
Magnetic induction heating of FeCr nanocrystalline alloys i n f o
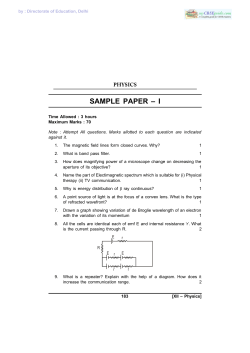
Magnetic induction heating of FeCr nanocrystalline alloys
a r t i c l e i n f o
abstract
Article history:
Received 15 September 2011
Received in revised form
16 January 2012
Available online 31 January 2012
In this work the thermal effects of magnetic induction heating in (FeCr)73.5Si13.5Cu1B9Nb3 amorphous
and nanocrystalline wires were analyzed. A single piece of wire was immersed in a glass capillary filled
with water and subjected to an ac magnetic field (frequency, 320 kHz). The initial temperature rise
enabled the determination of the effective Specific Absorption Rate (SAR). Maximum SAR values are
achieved for those samples displaying high magnetic susceptibility, where the eddy current losses
dominate the induction heating behavior. Moreover, the amorphous sample with Curie temperature
around room temperature displays characteristic features of self-regulated hyperthermia.
& 2012 Elsevier B.V. All rights reserved.
Keywords:
Amorphous alloy
Nanocrystalline
Magnetic susceptibility
Induction heating
Hyperthermia
1. Introduction
High frequency (radio frequency, rf) induction heating represents a topic of growing interest during the last decade. Their
main interest ranges within the biomedical applications in the
design of new cancer therapies based on the fluid suspensions
of ferromagnetic nanoparticles (magnetic hyperthermia) [1].
However, rf induction heating is a widely employed technique
in different industrial applications ranging from the steel industry [2],
household appliances (cooking) [3] or plastic industry [4]. Among
these applications the ferromagnetic based composites (i.e. magnetic nanoparticles dispersed in polymer matrices) stand out, in
the biomedical field (magnetic hyperthermia, cancer therapy) [5]
and in the polymer industry (sealing, curing and repairing of
polymers/epoxies) [6,7].
Magnetic induction heating is based on the heat generated as a
consequence of the application of an alternating (ac) field to a
magnetic material, both in bulk form (i.e. bars or needles) and
nanoparticle systems. In bulk form, eddy-current losses dominate
the rf dissipation behavior [8]. However, for magnetic nanoparticles in
a viscous medium, the heat dissipation is mainly determined by the
Ne´el and Brownian relaxations [9]. The use of ferromagnetic implants
for magnetic hyperthermia, and in particular the necrosis of solid
tumors, was recognized some decades ago as an adjutant cancer
therapy in the treatment of solid tumors [8,10–12]. Due to their
multifunctional capacities (MRI resonance imaging, targetable drug
carriers), the main recent efforts in this field have been focused on the
study and applications of magnetic nanoparticles [13]. However,
there are some aspects that prevent their extensive application in
clinical use, as toxicity or inhomogeneous distribution in tumors. In
fact, the achievement of a homogeneous temperature distribution
represents the main challenge regarding solid tumor treatments
[14]. In this sense, ferromagnetic needles have been recently shown
to display higher efficiency rates than iron oxide ferromagnetic
nanoparticles [15]. Therefore, the use of ferromagnetic implants in
inductive heating applications, as hyperthermia treatments, represents a renewed research topic in the biomedical field. Besides the
spatial distribution, the temperature control and stability is an
additional parameter to take into account in the design of optimum
rf heating systems. Accordingly, self-regulated systems have been
proposed, where the Curie point of the ferromagnetic component
controls the maximum heating temperature [16–19].
The main aim of the work is to explore the rf self-heating
features in ferromagnetic FeCrSiBCuNb amorphous and nanocrystalline wires. The results indicate that the eddy-current losses
basically dominate the induction heating phenomena. Moreover,
in these alloys the control of the Curie temperature through the Cr
content of the amorphous phase [20] enables the design of selfregulated rf induction systems.
2. Experimental procedure
Amorphous wires with nominal composition Fe73.5 xCrxSi13.5Cu1
B9Nb3 (x¼3, 7 and 10) were prepared by in-rotating-water quenching technique (diameter E130 mm). The devitrification process of
the initial amorphous state was followed by Differential Scanning
Calorimetry. The crystallization process takes place in two main
´mez-Polo et al. / Journal of Magnetism and Magnetic Materials 324 (2012) 1897–1901
C. Go
1898
0.16
Glass capilar
10
0.14
S. Generator
Water
8
0.12
L (μH)
Wire
C
RF Power
Amplifier
L (μH/mm)
LC
0.10
6
Fig. 1. Schematic diagram of the employed induction heating set-up.
0.08
steps at Tx1 and Tx2, correlated to the precipitation of a-FeSi and
boride phases, respectively [21]. The increase of the Cr content of the
alloy promotes a shift of the first crystallization process towards
higher temperatures [22]. The nanocrystalline structure, obtained
through isothermal annealings at annealing temperatures Ta ETx1,
was confirmed through X-ray diffractometry in the annealed samples. Mean grain sizes around 10 nm were estimated in the
nanocrystalline state through the Debye–Sherrer formula. Four
samples were selected: two amorphous wires with x¼3 and 10,
Cr3amorp and Cr10amorp, respectively; and two nanocrystalline
wires with x¼7 and different crystalline fractions, Cr7nano(1) and
Cr7nano(2) (Ta ¼818 K, annealing time, ta ¼90 and 210 min, respectively). With respect to the magnetic characterization, the temperature dependence of the self-inductance, L, was determined through a
commercial LCR meter at 10 kHz and a ac excitation voltage of 1 V.
An induction method was employed to determine at room temperature the ac hysteresis loops and the magnetic susceptibility,
w (f¼100 Hz, amplitude magnetic field 95 A/m). The induction
method consist of a long solenoid (1.2 (kA/m)/A) and two secondary
coils (2000 turns) connected in series-opposition. In the case of the
ac hysteresis loops the pick-up voltage was suitably integrated using
a fluxmeter, while in the susceptibility measurements it was
analyzed through a lock-in amplifier. The electrical resistivity, r, of
the wires was determined through a four-probe technique. The
heating effects on the wires were analyzed under the application of
an ac magnetic field, Hac, with the help of a home-made hyperthermia set-up. A single piece of wire (length, l¼5 10 3 m, mass,
mw ¼1.7 10 6 kg) was immersed in a glass capillary filled with
water. The capillary was subjected to the ac magnetic field generated by a water refrigerated coil and connected to a RF power
amplifier (see Fig. 1). The temperature increase (DT¼T(t) T0,
T0 ¼291 K) was registered as a function of time (t), using a fiber
optic thermometer under the action of Hac (frequency 320 kHz). The
measurements were repeated 5 times in order to estimate the mean
heating response of the samples.
3. Results and discussion
Fig. 2a displays the temperature dependence of the selfinductance, L, for the wires in amorphous state. At this low
frequency excitation (f ¼10 kHz), the skin effect can be disregarded and the electrical impedance can be expressed as
Z ¼ R þ i2pfL ¼ Rdc þ ið/EZ S=IÞl,
where Rdc is the electrical resistance of the wire, l the sample
length, I the electrical current flowing through the sample and
/EzSthe average electrical field originated by the circumferential
magnetization process (/EzSp mf, circumferential magnetic
permeability). Therefore, since L(T)pmf(T), its temperature
dependence can be employed to determine magnetic transitions
leading to sharp changes in mf(T) (i.e. the Curie temperature
TC, [23] or the martensitic transformation in ferromagnetic shape
memory alloys [24]). Fig. 2a shows that the Curie temperature can
4
0.06
300
375
450
525
T (K)
300
350
Fig. 2. Temperature dependence (T) of the self-inductance, L, for: (a) amorphous
wires in as-cast state (—) x ¼3, (&) x¼ 7 and (K) x¼ 10; and (b) in nanocrystalline
state (x¼ 7, Ta ¼818 K): (J) ta ¼ 90 min and (D) ta ¼ 210 min.
be easily characterized in the soft magnetic amorphous wires by a
sharp decrease in L around TC. As previously reported, the
substitution of Fe by Cr in the initial amorphous state promotes
a linear decrease in the Curie temperature, TC, of the alloy:
TC (K) ¼630 K 30 x (K/%Cr). Thus, for x ¼10 the amorphous alloy
displays a Curie point around room temperature. With respect to
the nanocrystalline state, it is extensively reported the occurrence
of a magnetic transition associated with the magnetic decoupling
process of the ferromagnetic crystallites around the Curie temperature of the residual amorphous phase, TCa [24–26]. This
magnetic transition leads to a sharp decrease in mf at temperatures around TCa and can be characterized by a parallel abrupt
diminution in L. Fig. 2b shows the temperature dependence of L
for the nanocrystalline wire with x ¼7 (annealing temperature,
Ta ¼818 K) and two different crystalline fractions (annealing time,
ta ¼90 and 210 min, Cr7nano(1) and Cr7nano(2), respectively).
As expected, the nanocrystalization process leads to a significant
decrease in TCa as a consequence of the enrichment in Cr of the
residual amorphous phase. Thus, the Curie point of the residual
amorphous phase can be suitable controlled through the annealing conditions. In particular, values of TCa around 300 K are
achieved in the nanocrystalline wire (x¼7) for the highest
annealing times (Cr7nano(2)).
With respect to the induction heating characteristics of the
wires, Fig. 3 shows the temperature rise, DT, (from T0 ¼291 K)
versus time, t, under the action of the ac magnetic field (amplitude 4 kA/m). Maximum DT values are found for the amorphous
wire with x ¼3 (Cr3amorp) and the nanocrystalline sample
Cr7nano(1) (TCa Z350 K). For comparison, the heating curve of a
Cu wire with similar mass and geometric characteristics is also
displayed. The detected slight temperature decrease should be
correlated to the effect of the coil refrigeration. Therefore, the
observed heating effects in the FeCr wires should be interpreted
as a direct consequence of the ferromagnetic nature of the
samples.
The obtained results indicate that the experimental set-up
departures from an ideal adiabatic zero thermal losses calorimeter. Under the ideal adiabatic conditions, the achieved temperature, T, under the application of the ac magnetic field should
linearly increase as a function of time, t [27]. However, the
experimental data can be suitably fitted to an exponential law:
DT ¼ TðtÞT 0 ¼ ABeCt
ð1Þ
This exponential law can be derived taking into account
the modified heat equation considering the heat transfer
´mez-Polo et al. / Journal of Magnetism and Magnetic Materials 324 (2012) 1897–1901
C. Go
contribution [28]:
dQ
dT
1
¼ mcP
þ ðTT 0 Þ
dt
dt
Rt
ð2Þ
with Q the thermal energy (heat), mcP ¼ mw cw þ mH2 O cH2 O (mi and ci:
mass and specific heat for i¼w and H2O, wire and water, respectively). The second term in Eq. (2) represents the heat transfer with
the environment, where Rt is the thermal resistance that in the case
of radial heat transfer with cylindrical geometry is given by
Rt ¼ Lnðr=r 0 Þ=2pLk (L: axial length, r and r0 radial coordinates at
T and T0, respectively), being k the thermal conductivity and T0 the
external or environment temperature [29]. This thermal resistance
would comprise the heat transfer within the wire and the water
bath. Thus, the total heat generated by the ferromagnetic wires can
be expressed as that absorbed by the water and the transferred
losses to the environment. If we considered T’ as the theoretical
temperature achieved under ideal adiabatic conditions (zero losses)
Eq. (2) can be rewritten as:
dT 0
dT
þ gðTT 0 Þ
¼
dt
dt
ð3Þ
with g ¼ 1=Rt mcp . Under ideal adiabatic conditions the achieved
temperature should linearly increase with t (dT0 /dt¼constant). Thus,
the solution of Eq. (3) displays an exponential time dependence
as that displayed in Eq. 1 with A¼B¼Tmax T0, being Tmax the
maximum temperature achieved under the non adiabatic conditions
(t-N) and the time constant C¼ g. Table 1 displays the fitting
parameters obtained from the experimental curves of Fig. 3. As
expected from the above discussion, the fitting parameters fulfill
Affi B. Those samples with the highest Curie temperatures of the
amorphous phase (Cr3amorp and Cr7nano(1)) display maximum
Tmax T0 values. Moreover, since the wires display similar
8
Cr3amorp
ΔT (K)
6
4
Cr7nano(1)
Cr7nano(2)
1899
geometrical features and equivalent bath water mass is employed,
the time constant g would come mainly determined by the thermal
conductivity of the wires. In metallic systems there is a direct
relationship between the thermal conductivity and the electrical
resistivity (Wiedemann–Franz law) [30]. Table 1 shows the electrical
resistivity, r, for the set of the analyzed wires. As expected, the
lowest time constant g is found in the amorphous sample with the
highest electrical resistivity.
In order to further analyze the induction heating features of
the samples, the equivalent Specific Absorption Rate (SAR) was
estimated through the initial slope of the heating curves,
ðdT=dtÞt-0 , according to the following expression:
mw cw þ mH2 0 cH2 0 dT
SAR ¼
ð4Þ
dt t-0
mw
with mw ¼1.7 10 6 kg, mH2 O ¼2 10 4 kg, cw ¼ 0.53 103
J kg 1 K 1 [31] and cH2 O ¼4.18 103 J kg 1 K 1. The initial
heating rate,ðdT=dtÞt-0 , can be easily calculated through the
derivation of Eq. (1): ðdT=dtÞt-0 ¼ ðT max T 0 Þg. Table 1 summarizes
the obtained SAR values according Eq. 4 and the calculated
ðdT=dtÞt-0 considering (Tmax–T0) ¼(AþB)/2. As expected from
the analysis of the temperature heating curves (see Fig. 3),
maximum SAR (15.2 103 W/kg) is found in the amorphous wire
Cr3amorp with the highest Curie point. These SAR values are
below the reported values in Fe-based nanoparticles [32–34].
The physical mechanisms associated to the induction heating
can be classified in three main contributions: (i) eddy-current
losses, (ii) magnetic hysteresis losses and (iii) relaxation losses
(Ne´el and/or Brown rotations). In all the cases, the power
dissipation (heat) should be interpreted as a consequence of the
magnetization lag with respect to the applied magnetic field. In
metallic (bulk) implants the eddy-current losses dominate the
heating behavior, while the hysteresis and relaxation losses are
the main contribution in the case of nanoparticle systems [35,36].
The energy loss associated to eddy-currents in a metallic
medium is proportional to the integral of rj2 (r: electrical resistivity,
j: current density) over the volume of the material. In particular, at
high frequencies when the penetration of the applied ac field is
incomplete the power loss, Pec, can be expressed as [37]:
Pec aðmrf Þ1=2 Hac 2
2
Cr10amorp
ð5Þ
with m ¼ m0 (1þ w), the static (low frequency) magnetic permeability.
However, in the case of hysteresis loss, the power loss is a function
of the area of the hysteresis loops [38]:
I
Phys pf
HdM
ð6Þ
Cu
0
0
200
400
t (s)
600
800
Finally, the power loss associated to the relaxation losses (Ne´el
and/or Brown rotations) are usually expressed as a function of the
imaginary component of the magnetic susceptibility w00 :
Prel aw00 ðf Þf Hac 2
Fig. 3. Temperature rise, DT¼T(t) T0 (T0 ¼291 K), as a function of time, t, for the
amorphous (x¼ 3, Cr3amorp and x ¼10, Cr10amorp) and nanocrystalline wires
(Cr7nano(1): ta ¼ 90 min, Cr7nano(2): ta ¼210 min, x ¼7). For comparison the results
in a Cu wire are also included. (Hac ¼ 4 kA/m).
ð7Þ
However, it has been recently shown that Eq. (7) is just a
particular case of Eq. (6) under linear response theory (M linear
with H) taking into account the Ne´el–Brown relaxation times [38].
Table 1
Fitting parameters of the exponential heating curves according to Eq. (1): A ¼ B¼ Tmax T0; C ¼ g. Electrical resistivity, r, Specific absorption rate (SAR) and magnetic
susceptibility, w, for the analyzed wires.
Sample
A (K)
B (K)
C (s 1)
q (O m)
SAR (W/kg)
v (a.u.)
Cr3amorp (x ¼3 amorphous)
Cr10amorp (x¼ 10 amorphous)
Cr7nano(1) (x¼ 7 nanocrystal ta ¼ 90 min)
Cr7nano(2) (x¼ 7 nanocrystal ta ¼ 210 min)
7.1
2.0
7.4
3.6
7.7
2.0
8.1
4.0
4.3 10 3
2.4 10 3
3.5 10 3
4.4 10 3
1.62 10 6
1.81 10 6
1.50 10 6
1.39 10 6
15.2 103
2.4 103
13.5 103
8.2 103
7695
3635
3812
934
´mez-Polo et al. / Journal of Magnetism and Magnetic Materials 324 (2012) 1897–1901
C. Go
1900
To discern the main contribution to the induction heating
process, the ac hysteresis loops were determined as function
of the exciting ac frequency, f. Fig. 4 shows the frequency
dependence of the coercive field, HC, for the analyzed wires.
As expected, the highest HC values are found in the nanocrystalline sample with lowest Curie temperature of the amorphous
phase (Cr7nano(2), TCa o300 K). In this sample the nanocrystalline
grains are partially decoupled as a consequence of the decrease in
the exchange correlation length due to the paramagnetic state of
the residual amorphous phase [26]. However, the nanocrystalline
wire with TCa 4300 K (Cr7nano(1)) displays similar low coercive
fields that the amorphous samples. In fact, nearly anhysteretic
hysteresis loops are found in these soft magnetic samples (see
inset of Fig. 4) in spite of their self-heating characteristics. Thus,
hysteresis losses should be disregarded as the mean mechanism
of the detected induction heating phenomena.
On the other hand, assuming that the eddy-current losses
dominate the power loss dissipation, SAR values should scale as
(wr)1/2 (Eq. (5)). Fig. 5 shows such a relationship (SAR versus
2.0
1.0
1.5
M (a.u.)
0.5
0.0
HC (kA/m)
-0.5
-1.0
1.0
-2
0
H (kA/m)
2
0.5
0.0
0
1
2
4
3
f (kHz)
5
Fig. 4. Coercive field, HC, versus frequency, f, for: (—) Cr3amorp, (K) Cr10amorp,
(J) Cr7nano(1) and (D) Cr7nano(2). Inset: M–H hysteresis loops at 20 Hz: black—Cr3amorp, gray—Cr10amorp, blue—Cr7nano(1) and red—Cr7nano(2) (For interpretation of the references to color in this figure legend, the reader is referred to the
web version of this article.).
(wr)1/2; w low frequency values). A linear behavior is found for the
samples with higher induction heating power (Cr3amorp and
Cr7nano(1,2)), confirming the relevant role of the eddy-current
losses in the induction heating process. It should be noted that
the nanocrystalline wire with the higher crystalline fraction
(Cr7nano(2)) displays a value of TCa, according to Fig. 2b, below
T0. Then, its self-heating capacity at 291 K should be interpreted
as a result of the dependence of the magnetic transition associated to the magnetic decoupling of the ferromagnetic crystallites on the amplitude of the applied magnetic field. Shifts of the
effective transition temperature close to 75 K are detected in
FeSiCuNbB nanocrystalline wires. Such an increase is interpreted
in terms of magnetization process of the decoupled ferromagnetic
grains [23,25]. In the present case, due to closeness of TCa to the
initial measuring temperature (T0 ¼291 K), the application of
Hac E4 kA/m would be able to magnetize the ferromagnetic
grains and thus to shift the effective magnetic transition above
TCa. However, the amorphous wire with TC E300 K (x ¼10) displays a significant lower heating capacity (see Fig. 3). In fact, as
Fig. 5 shows, this sample departures from the general linear trend
(SAR versus (wr)1/2). In this case, although the sample displays
high w values (see Table 1), it does not show comparable selfheating rates. This contradictory behavior should be interpreted
as a consequence of the features of the w–T curves in these
amorphous systems. Firstly, the absence of any significant
increase in TC with the applied magnetic field [23]. Secondly,
the occurrence around TC of a sharp Hopkinson peak in w (T) that
disappears after nanocrystallization [39]. Therefore, starting from
TrTC, a slight increase in temperature would promote a sharp
decrease in w that would drastically decrease the power losses in
the sample.
Finally, in order to check the self-regulated characteristics of
the samples, the experimental set-up was modified in order to
reduce the heat losses with the environment. Beside this, to
enhance the heating capacity of the samples, the effective mass
of the wires was increased and the measurements were taken
under a higher magnetic field (Hac ¼29 kA/m). Fig. 6 shows the
obtained heating curves (DT versus t) for both amorphous
samples (mw,Cr3amorp ¼19.5 10 6 kg; mw,Cr10amorp ¼ 34 10 6 kg;
mH2 O ¼0.15 10 3 kg). For the wire with higher Curie temperature, Cr3amorp, T sharply increases within the measuring temperature range. A similar behavior, that is, a continuous increase
of T, is detected in the nanocrystalline wires. Conversely, the
Cr10amorp wire shows an initial sharp temperature increase
60
2x10⁴
50
Cr7nano(1)
1x10⁴
30
20
Cr7nano(2)
Cr10amorp
10
0
0.035
ΔT (K)
SAR (W/kg)
40
Cr3amorp
0.070
0.105
(χρ)1/2 (a.u.)
Fig. 5. SAR values of the analyzed wires as a function of the relative values of
(wr)1/2 (w: magnetic susceptibility; r: electrical resistivity).
0
50
100
150
200
t (s)
250
300
350
400
Fig. 6. Temperature rise, DT¼ T(t) T0 (T0 ¼ 298 K), as a function of time, t, for the
amorphous (J) Cr3amorp and (K) Cr10amorp (Hac ¼ 29 kA/m).
´mez-Polo et al. / Journal of Magnetism and Magnetic Materials 324 (2012) 1897–1901
C. Go
followed by clear stabilization around TC. This result clearly
proves the self-regulated characteristics of this amorphous system, where the Cr content can be suitably tailored to control the
maximum temperature distribution. Finally, the estimated SAR
values are in this case 3 105 and 0.3 105 W/kg for Cr3amorp
and Cr10amorp, respectively. These values come closer to the
reported values in Fe-based nanoparticles [30–34] and metallic
iron nanostructures [40].
4. Conclusions
In conclusion, the magnetic induction heating effects in
amorphous and Fe73.5 xCrxSi13.5Cu1B9Nb3 (x¼3, 7 and 10) nanocrystalline wires have been analyzed. The application of a ac
magnetic field give rises to power losses that are able to increase
the mean temperature of a capillary water bath where the samples
are immersed. The Specific Absorption Rate (SAR) was determined
through the initial temperature rise of the system (wire plus water
bath). Maximum SAR values are achieved for those samples
displaying high magnetic susceptibility and Curie temperature
above the initial measuring point (300 K). The analysis of the
magnetic susceptibility indicates that the eddy current losses
mainly dominate the heating phenomena. In order to explore the
self-heating induction characteristics, samples (amorphous and
nanocrystalline) with Curie temperature (amorphous phase)
around 300 K were analyzed. The different heating response of
the amorphous and nanocrystalline samples is analyzed in terms of
the main features of the susceptibility–temperature curves. Selfregulated features are found in the amorphous alloy at temperatures around the corresponding Curie point.
Acknowledgments
The wires were kindly provided by Prof. M. Va´zquez (Instituto
de Ciencia de Materiales de Madrid, CSIC). The work has been
performed within the framework of the project MET-NANO
EFA17/08 (POCTEFA).
References
¨
[1] S. Laurent, S. Dutz, U.O. Hafeli,
M. Ahmoudi, Advances in Colloid and Interface
Science 166 (2011) 8–23.
[2] K. Fukutani, K. Umetsu, T. Itou, T. Isobe, T. Kitahara, R. Shimada, IEEE
Transactions on Industry Applications 130 (2010) 1131–1138.
[3] T. Waeckerle´, H. Fraisse´, B. Boulogne, S.L. Spire, Journal of Magnetism and
Magnetic Materials 304 (2006) e844–6846.
[4] B.J. Knauf, D.P. Webb, C. Liu, P.P. Conway, Microfluidics and Nanofluidics
9 (2010) 243–252.
[5] D.-H. Kim, H.-N. Kim, K.-M. Kim, Y.-K. Lee, Journal of Biomedical Materials
Research Part A 88 (2009) 1–11.
[6] C.C. Corten, M.W. Urbam, Advanced Materials 21 (2009) 5011–5015.
[7] K.J. Miller, K.N. Collier, H.B. Soll-Morris, R. Swaminathan, M.E. McHenry,
Journal of Applied Physics 105 (2009) 07E714.
1901
[8] P.R. Stauffer, T.C. Cetas, R.C. Jones, IEEE Transactions on Bio-medical Engineering 31 (1984) 235–251.
¨
[9] R. Hergt, S. Dutz, R. Muller,
M. Zeisberger, Journal of Physics: Condensed
Matter 18 (2006) S2919–S2934.
[10] P.R. Stauffer, T.C. Cetas, A.M. Flectcher, D.W. DeYoung, M.E. DeWhirst,
J.R. Oleson, R.B. Roemer, IEEE Transactions on Bio-medical Engineering 31
(1984) 76–89.
[11] H. Matsuki, K. Murakami, IEEE Transactions on Magnetics 21 (1985)
1927–1929.
[12] H. Matsuki, T. Satoh, K. Murakami, T. Hoshino, T. Yanada, S. Kikuchi, IEEE
Transactions on Magnetics 26 (1990) 1551–1553.
[13] A.J. Cole, V.C. Yang, A.E. David, Trends in Biotechnology 29 (2011) 323–332.
[14] V. Zablotskii, O. Lunov, C. Go´mez-Polo, Journal of Nanoscience and Nanotechnology 10 (2010) 690–695.
[15] R. Zuchini, H.-W. Tsai, C.-Y. Chen, C.-H. Huang, S.-C. Huang, G.-B. Lee,
C.-F. Huang, X.-Z. Lin, European Journal of Surgical Oncology 37 (2011)
604–610.
[16] T. Yanada, H. Matsuki, M. Takahashi, T. Satoh, S. Minakawa, S. Kikuchi,
K. Murakami, IEEE Transactions on Magnetics 27 (1991) 5390–5392.
[17] T. Shimizu, M. Matsui., Science and Technology of Advanced Materials 4
(2003) 469–473.
[18] K.L. McNemy, Y. Kim, D.E. Laughlin, M.E. McHenry, Journal of Applied Physics
107 (2010) 09A312.
[19] K.J. Miller, A. Colletti, P.J. Papi, M.E. McHenry, Journal of Applied Physics 107
(2010) 09A313.
[20] C. Go´mez-Polo, J.I. Pe´rez-Landaza´bal, V. Recarte, IEEE Transactions on
Magnetics 39 (2003) 3019–3024.
[21] C. Go´mez-Polo, Y. Li, J.I. Pe´rez-Landaza´bal, V. Recarte, M. Va´zquez, Sensors &
Actuators A 1–3 (2003) 230–233.
[22] V. Franco, C.F. Conde, A. Conde, B. Varga, A. Lovas, Journal of Magnetism and
Magnetic Materials 215–216 (2000) 404–406.
[23] C. Go´mez-Polo, J.I. Pe´rez-Landaza´bal, V. Recarte, M. Va´zquez, A. Hernando,
Physical Review B 70 (2004) 094412.
[24] J.I. Pe´rez-Landazabal, C. Go´mez-Polo, V. Recarte, C. Seguı´, E. Cesari, P. Ochin,
Journal of Magnetism and Magnetic Materials 290–291 (2005) 826–828.
[25] C. Go´mez-Polo, Journal of Magnetism and Magnetic Materials 320 (2008)
1984–1988.
[26] A. Hernando, P. Marı´n, M. Va´zquez, J.M. Barandiara´n, G. Herzer, Physical
Review B 58 (1998) 366–370.
[27] E. Natividad, M. Castro, A. Mediano, Applied Physics Letters 92 (2008)
093116.
[28] A. Clalkidou, K. Simeonidis, M. Angelakeris, T. Samaras, C. Martinez-Boubeta,
L.l. Balcells, K. Papazisis, C. Dendrinou-Samara, O. Kalogirou, Journal of
Magnetism and Magnetic Materials 323 (2011) 775–780.
[29] A. Faghari, Y. Zhang, J. Howell, Advanced Heat and Mass Transfer, Global
Digital Press, Columbia, 2010., p. 212.
[30] C. Kittel, Introduction to Solid State Physics, John Wiley & Sons, New York,
1996., p. 166.
[31] E. Vogt, International Journal of Rapid Solidification 3 (1987) 131–146.
[32] M. Ma, Y. Wu, J. Zhou, Y. Sun, Y. Zhang, N. Gu, Journal of Magnetism and
Magnetic Materials 268 (2004) 33–39.
[33] M. Suto, Y. Hirota, H. Mamiya, A. Fujita, R. Kasuya, K. Tohji, B. Jeyadevan,
Journal of Magnetism and Magnetic Materials 321 (2009) 1493–1496.
[34] T. Yuan, D.A. Borca Tasciuc, Journal of Magnetism and Magnetic Materials
323 (2011) 2463–2469.
¨
[35] J. Jordan, P. Wust, H. Fahling,
W. John, A. Hinz, R. Felix, International Journal
of Hyperthermia 1 (1993) 51–68.
¨
[36] R. Hergt, S. Dutz, M. Roder,
Journal of Physics: Condensed Matter 20 (2008)
385214.
[37] R.B. Bozorth, Ferromagnetism, IEEE Press, New York, 1993., pp. 779.
[38] J. Carrey, B. Mehdaoui, M. Respaud, Journal of Applied Physics 109 (2011)
083921.
[39] Q.Z. Zhi, B.S. Dong, W.Z. Chen, K.Y. He, Materials Science and Engineering A
448 (2007) 249.
[40] B. Mehdaoui, A. Meffre, L.-M. Lacroix, J. Carrey, S. Lachaize, M. Gougeon,
M. Respaud, B. Chaudret, Journal of Magnetism and Magnetic Materials 322
(2010) L49–L52.


© Copyright 2026