
Pædagog - Esrum Kloster & Møllegård
THE EUROPEAN
ENVIRONMENT
STATE AND OUTLOOK 2010
CONSUMPTION AND THE ENVIRONMENT
What is the SOER 2010?
The European environment — state and outlook 2010 (SOER 2010) is aimed primarily at policymakers,
in Europe and beyond, involved with framing and implementing policies that could support environmental
improvements in Europe. The information also helps European citizens to better understand, care for and
improve Europe's environment.
The SOER 2010 'umbrella' includes four key assessments:
1. a set of 13 Europe‑wide thematic assessments of key environmental themes;
2. an exploratory assessment of global megatrends relevant for the European environment;
3. a set of 38 country assessments of the environment in individual European countries;
4.a synthesis — an integrated assessment based on the above assessments and other EEA activities.
SOER 2010 assessments
Thematic
assessments
Understanding
climate change
Country
assessments
SOER 2010
— Synthesis —
Country profiles
Mitigating
climate change
National and
regional stories
Adapting to
climate change
Common
environmental themes
Biodiversity
Climate change
mitigation
Land use
Land use
Soil
Nature protection
and biodiversity
Marine and
coastal environment
Waste
Consumption
and environment
Assessment of
global megatrends
Material resources
and waste
Social
megatrends
Water resources:
quantity and flows
Technological
megatrends
Freshwater quality
Economic
megatrends
Air pollution
Environmental
megatrends
Urban environment
Political
megatrends
Freshwater
Air pollution
Each of the above
are assessed by
each EEA member
country (32) and
EEA cooperating
country (6)
All SOER 2010 outputs are available on the SOER 2010 website: www.eea.europa.eu/soer. The website
also provides key facts and messages, summaries in non‑technical language and audio‑visuals, as well as
media, launch and event information.
THE EUROPEAN
ENVIRONMENT
STATE AND OUTLOOK 2010
CONSUMPTION AND THE ENVIRONMENT
Cover design: EEA/Rosendahl-Schultz Grafisk
Layout: EEA/Pia Schmidt
Copyright notice
© EEA, Copenhagen, 2010
Reproduction is authorised, provided the source is acknowledged, save where otherwise stated.
Information about the European Union is available on the Internet. It can be accessed through the Europa
server (www.europa.eu).
Luxembourg: Publications Office of the European Union, 2010
ISBN 978-92-9213-154-8
doi:10.2800/58407
Acknowledgements
This assessment was prepared by a team of Lars Fogh
Mortensen and Almut Reichel (both EEA); David
Watson, Mikkel Stenbæk Hansen and Kate Power
(all ETC/SCP lead partner CRI).
Many inputs were received from other staff at the
EEA (Mikael Skou Andersen, Anca-Diana Barbu,
Birgit Georgi, Dorota Jarosinska, Peder Jensen,
Jock Martin, Peter Kristensen, Jan-Erik Petersen,
Stefan Speck, Ronan Uhel, Gerald Vollmer) and
European Environment Agency
Kongens Nytorv 6
1050 Copenhagen K
Denmark
Tel.: +45 33 36 71 00
Fax: +45 33 36 71 99
Web: eea.europa.eu
Enquiries: eea.europa.eu/enquiries
ETC/SCP (Carolin Baedeker, WI; Ioannis Bakas,
CRI; José Acosta Fernandez, WI; Sandra Kolberg,
WI; Andrius Plepys, IIIEE; Jozsef Szlezak, REC;
Jola Welfens, WI; Carol Wilson, EA; Dominic Wittmer,
WI).
We would like to thank the numerous experts from the
EEA member countries, the European Commission, and
the EEA's Scientific Committee who provided valuable
comments during the consultation process.
Thematic assessment | Consumption and the environment
Consumption and the environment
Summary��������������������������������������������������������������������������������������������������������������������������� 4
1Introduction�������������������������������������������������������������������������������������������������������������� 6
1.1 Why do we need to address consumption?....................................................................... 6
1.2 The policy challenge: some first reflections...................................................................... 7
2
2.1
2.2
2.3
2.4
2.5
Consumption patterns in Europe and their worldwide environmental
pressures and impacts���������������������������������������������������������������������������������������������� 9
Trends in consumption expenditure................................................................................. 9
Current European consumption patterns have high environmental impacts........................... 9
The unseen trade in environmental pressures................................................................. 11
Environmental pressures caused by different consumption categories................................ 12
Low-pressure households — a good example of more environmentally
sustainable consumption?............................................................................................ 17
3
3.1
3.2
3.3
3.4
3.5
3.6
Understanding what shapes current and potential future consumption������������������ 18
Economic influences on consumption............................................................................ 18
Demographic influences on consumption....................................................................... 19
Technology and innovation as drivers of consumption...................................................... 20
Urbanisation and the role of infrastructure..................................................................... 21
Social and cultural influences on consumption behaviour................................................. 21
Types of consumers.................................................................................................... 22
4
Food and drink�������������������������������������������������������������������������������������������������������� 24
4.1 Trends in consumption................................................................................................ 24
4.2 Life-cycle environmental impacts of food and drink......................................................... 24
4.3 Food and drink outlooks and scenarios.......................................................................... 27
4.4Responses ................................................................................................................ 28
5Housing������������������������������������������������������������������������������������������������������������������� 30
5.1 Trends in consumption................................................................................................ 30
5.2 Life-cycle environmental impacts of housing.................................................................. 32
5.3 Housing outlooks and scenarios.................................................................................... 33
5.4Responses ................................................................................................................ 33
6Mobility������������������������������������������������������������������������������������������������������������������� 36
6.1 Trends in mobility demand and modal split.................................................................... 36
6.2 Life‑cycle environmental impacts of mobility.................................................................. 37
6.3 Mobility outlooks and scenarios.................................................................................... 39
6.4Responses................................................................................................................. 39
7Tourism������������������������������������������������������������������������������������������������������������������� 41
7.1 Trends in consumption................................................................................................ 41
7.2 Life‑cycle environmental impacts of tourism................................................................... 41
7.3 Tourism outlooks and scenarios.................................................................................... 42
7.4Responses ................................................................................................................ 43
8
8.1
8.2
8.3
8.4
8.5
Concluding reflections: consumption, environmental priorities and policies����������� 45
Consumption and current environmental policies............................................................ 45
Consumption and management of natural capital and ecosystem services.......................... 46
Consumption and integration of environmental considerations across policy domains........... 47
The role of consumption in greening the economy.......................................................... 47
The triangle of change — the role of different actors on the road to greening the economy..... 49
References���������������������������������������������������������������������������������������������������������������������� 51
The European environment | State and outlook 2010
3
Thematic assessment | Consumption and the environment
Summary
The consumption of goods and services in EEA member countries is a major driver of global
resource use — and associated environmental impacts. Growth in global trade is resulting in an
increasing share of environmental pressures and impacts from European consumption taking place
beyond Europe. Food and drink, housing, mobility and tourism are responsible for a large part
of the pressures and impacts caused by consumption in the EU. Achieving significant reductions
in environmental pressures and impacts will require changing private and public consumption
patterns, to supplement gains achieved through better technology and improved production
processes.
Drivers and pressures
Consumption is shaped by an array of complex,
interrelated factors such as demographics, income and
prices, technology, trade, policies and infrastructure,
as well as social, cultural and psychological factors.
Production activities across economic sectors, including
extractive industries, agriculture, energy, transport and
manufacturing, are directly responsible for the majority
of the environmental impacts caused by the economy.
However, it is private and public consumption that are
the fundamental causal factors and drivers of change in
production activities.
Consumption leads to the direct creation of environmental
pressures from the use of products and services, for
example, through driving a car or heating a house with
fossil fuels. Of greater magnitude, however, are the
indirect pressures that are created along the production
chains of the goods and services consumed, including, for
example, food, clothing, furniture or electricity. Both direct
and indirect pressures result in environmental impacts, in
particular, global warming, biodiversity degradation, soil
sealing and air and water pollution. Since an increasing
share of the final and intermediate goods consumed in
Europe is imported, a growing proportion of impacts
caused by our consumption takes place in other parts
of the world. The average environmental footprint (an
indicator of pressures from consumption) per person
in EEA member countries is about double the available
biocapacity (an indicator of land which is biologically
productive) of those countries.
An EEA analysis of nine EU Member States (representing
268 million of the EU's total 501 million people) has
found that the majority of key environmental pressures
4
The European environment | State and outlook 2010
caused by total national consumption can be allocated
to eating and drinking, housing and infrastructure,
and mobility. These three broad consumption areas are
estimated to have contributed approximately two-thirds
of consumption-related material use, greenhouse gas
emissions, acidifying emissions and ozone precursor
emissions.
The reasons for these high shares are that food and drink,
housing and mobility are the areas which Europeans
spend most on and at the same time the areas with the
highest pressures per euro spent. Tourism is a fourth area
causing high and growing environmental impacts, both
within the EU and elsewhere.
A major reason why consumption negatively affects
the environment and causes an over-use of resources is
because the costs to society of environmental and resource
degradation are not fully reflected in the prices of goods
and services. Thus, many goods are relatively cheap
even though they cause major harm to the environment,
ecosystems or human health.
The need for sophisticated policy
packages
A culture of high and continuously growing levels of
consumption, generally associated with well-being and
success, has evolved in western European countries for
decades, and EU-12 Member States and the western
Balkan countries are rapidly catching up.
Large differences in environmental pressures from
consumption, even between households with equal
income levels, indicate a considerable potential for more
Thematic assessment | Consumption and the environment
sustainable consumption patterns through shifting choices
towards more sustainable alternatives. Examples include:
shifting from car use to collective transport, cycling and
walking; and choosing high quality and eco-labelled
products and energy-efficient housing solutions. Secondly,
additional income could be channelled towards products
and services with relatively low environmental pressures
such as communication, education and sustainable leisure
activities.
Europe will be better equipped to achieve sustainable
consumption patterns by developing and implementing
sophisticated policy packages. These would include
regulatory and voluntary instruments, providing
sustainable infrastructure, technological support,
consumer education and information, and green public
procurement (the purchase of goods, services and public
works by governments). A critical element of such policy
packages could be provided by ecological tax reform,
where the burden of taxation is shifted from labour to
environmentally damaging activities.
The framework conditions should enable business and
consumers/citizens to act sustainably, and business and
citizens need to take action by adopting more sustainable
consumption and production patterns.
The European environment | State and outlook 2010
5
Thematic assessment | Consumption and the environment
1Introduction
…the sheer weight of the combined aspirations and lifestyles of 500 million Europeans is just too great. Never mind
the legitimate desires of many other billions on our planet to share those lifestyles .... We will need to change the
behaviour of European consumers. To work on people's awareness, and to influence their habits.
Janez Potočnik, European Commissioner for Environment (March 2010)
…the major cause of the continued deterioration of the global environment is the unsustainable pattern of consumption
and production...
UN Agenda 21, Chapter 4 (1992)
1.1
Why do we need to address
consumption?
Demand for natural resources worldwide has increased
tremendously over recent decades. The main drivers have
been growth in population, wealth and consumption,
with high population growth mainly in developing
countries and highest levels of wealth and consumption in
developed countries.
This demand is causing major, irreversible impacts on
global ecosystems and ecosystem services: 73 170 km2
of forest were cleared each year in the period 2000–2005
(FAO, 2009). In addition, since 1960 a third of the world's
farmland has been abandoned, exhausted as a result
of overexploitation and soil degradation (Schade and
Pimental, 2010).
6
production activities and the resulting flows of resources
and wastes from and to the environment.
Although an increasing global population is a factor
in rising pressures, it is consumption and production
patterns in developed countries, with developing
countries catching up rapidly, that are the key drivers of
global environmental problems. This was recognised in
Agenda 21 in 1992 and again at the Johannesburg World
Summit on Sustainable Development in 2002, where
governments agreed a Plan of Implementation strongly
focused on sustainable consumption and production
(SCP) and a commitment to develop a 10-year framework
of programmes on SCP (UNCSD, 2002).
Moreover, emissions and wastes emitted during the
processing and conversion of resources into goods and
services have caused further damage to the natural
environment and human health. Nitrogen pollution,
ground-level ozone and particulate pollution are on the
increase, as is the prevalence of synthetic chemicals in the
environment (EEA, 2010a), with negative impacts on the
environment and health.
Consumption leads to direct environmental pressures
from the use of products and services, for example,
through driving a car or heating a house with fossil fuels.
Of greater interest and magnitude, however, are the
indirect pressures created along the production chains
of goods and services, including, for example, food and
other consumer goods, but also energy services. Since
an increasing share of the final and intermediate goods
consumed in Europe is imported, a growing proportion of
impacts caused by our consumption takes place in other
parts of the world.
If one isolates different activities in the economy, it is
production activities across sectors, such as mining,
agriculture, and manufacturing, that are directly
responsible for the majority of the environmental
pressures caused by economic development. However,
private and public consumption of goods and services
is the fundamental causal factor and driver of change in
A consumption-based perspective for assessing
and responding to environmental pressures
highlights various leverage points for reducing them.
Complementary actions to reduce environmental
pressures throughout the life cycle from resource
extraction and production through consumption to final
use are shown in Figure 1.1.
The European environment | State and outlook 2010
Thematic assessment | Consumption and the environment
Figure 1.1
Complementary actions to reduce the environmental pressures along the life
cycle of products and services
Production
Improving the eco-efficiency
of production of goods and services
End-of-life
Improving the eco-efficiency
of waste management including
reuse and recycling
Products/services
Improving products
and services using eco-design
and other measures
Consumption
Reducing consumption levels
and/or changing consumption
patterns away from eco-intensive
goods and services
The uppermost set of actions — responses aimed directly
at improving production processes and technologies,
and substituting environmentally-intensive material
and energy inputs with greener alternatives — have
received most attention over recent decades. Such actions
have resulted in clear reductions in the intensity of
environmental pressures (emissions per unit of economic
output) from European industry. Some progress has also
been made in the end-of-life stage through improving
waste management (see the SOER 2010 material resources
and waste assessment (EEA, 2010b)).
This assessment focuses on the two other stages in the life
cycle: products/services and consumption.
Improved design can provide products with lower
impacts, including lower waste generation during their
production, when they are in use and at the end of their
useful lives. However, it is increasingly recognised that
environmental problems such as climate change cannot
be solved through technological improvements alone (see,
inter alia, Swedish EPA, 2010).
Actions influencing private and public consumption
are also necessary as these can have knock-on effects
upstream, potentially reducing pressures created during
production. Such actions include those aimed specifically
at encouraging demand for less pressure-intensive
products but also actions aimed at encouraging broader
lifestyle changes.
The term consumption as used in this assessment covers
private (household) and public (government) final
consumption of goods and services and investments
in infrastructure (1), whether domestically produced or
wholly or partially supplied through imports. In terms
of value, private consumption was 2.6 times greater than
public consumption across the EU‑27 at the beginning
of 2010 (Eurostat, 2010a, 2010b). The main focus in this
assessment is accordingly on private consumption, with
public consumption addressed to a lesser extent.
1.2
The policy challenge: some first
reflections
There is a huge, largely unused potential for encouraging
environmentally less intensive consumption patterns
by households. This is illustrated by a recent report that
found that the annual greenhouse gas (GHG) emissions
caused directly and indirectly by equal-income Swiss
households range from 5 to 17 tonnes of carbon dioxide
(1) More formally called 'fixed capital formation' and including investments in machinery, transport systems, sewage and water
services etc.
The European environment | State and outlook 2010
7
Thematic assessment | Consumption and the environment
(CO2) per person, purely as a result of differing patterns
of consumption (Girod and de Haan, 2009). Encouraging
greener procurement by government and business can
also pay significant environmental dividends and may be
more easily achievable than shifting private consumption
patterns as it does not involve millions of citizens. Green
procurement by government and business can also play an
exemplary role and encourage more widespread adoption
of sustainable purchasing amongst citizens.
The broad private consumption areas of housing, food
and drink, and mobility are given special attention as
they have been identified by a number of studies as being
responsible for a large part of the pressures caused by
consumption in the EU (JRC/IPTS, 2006; ETC/SCP, 2009).
Although it overlaps with the other consumption areas,
tourism has also been identified as an important contributor
to environmental pressures, especially water shortages,
land-use changes in vulnerable areas and consequently
considerable impacts on biodiversity (Nijdam and Wilting,
2003; EEA, 2009a,b; EEA, 2006), and GHG emissions from
air travel.
Changes in consumption behaviour are needed to
complement technological improvements as targeting
consumption can tackle issues that production- and
technology-focussed policies cannot. Firstly, environmental
gains made through technical efficiency are often partially
or wholly offset by resulting increases in consumption due
to lower costs of production and/or use and more money
thereby becoming available for spending on other/more
goods and services — the so‑called rebound effect (Box 3.1;
Hertwich, 2008). Secondly, global environmental pressures
that take place overseas but are caused by European
consumption are beyond the reach of current European
production-related policies. The most direct way to reduce
these pressures may therefore be to influence which types
of imported goods are being purchased.
The potential for reducing global environmental impacts
through influencing consumption is yet to be exploited.
The EU Sustainable Development Strategy (European
Council, 2006) has identified the promotion of sustainable
consumption and production as one of seven key
challenges and stipulated respective objectives and targets.
More specifically, the EU Action Plan on Sustainable
Consumption and Production and Sustainable Industrial
Policies (EC, 2008) includes elements that aim directly at
influencing consumer behaviour and promoting greener
public procurement, but its main focus lies in cleaner and
leaner production and better products. The planned review
8
The European environment | State and outlook 2010
of the Action Plan in 2012 may provide an opportunity to
expand and strengthen the consumption elements.
The Europe 2020 Strategy for Smart, Sustainable and
Inclusive Growth includes a flagship initiative on
Resource-efficient Europe which aims to support the shift
towards a resource-efficient and low-carbon economy
(EC, 2010). Achieving this will require major technological
improvements, but also changes in consumption —
moving towards goods and services that are more
resource-efficient.
This will not be easy. Environmentally harmful
consumption patterns are institutionalised, economically,
politically, technically and socially, and consequently
seem normal and inevitable to most Europeans.
They also help define the aspirations for public
spending and consumption by the growing consumer
class in developing countries, that could amount to
1.2 billion people in 2030 (see EEA, 2010c).
The promotion of more sustainable consumption patterns
in the future may be achieved most effectively through
the development of sophisticated tailored policy packages
that provide a framework that enables consumers,
retailers and producers to act more sustainably. Such
packages would include well-chosen mixtures of economic
incentives, provision of information to consumers through
awareness-raising, labelling and other means, investments
in improved infrastructure, technology support, voluntary
agreements and where necessary regulation to achieve
objectives as effectively as possible.
In the following sections, the global environmental
pressures resulting from European consumption and
key individual consumption areas are assessed on the
macro scale. The differing environmental profiles of
households and their underlying behavioural causes
are then reviewed to assess the potential for reducing
consumption-related environmental pressures.
The complex nature of consumption and the underlying
factors that shape it now and in the future are briefly
investigated. The environmental pressures related to
four areas of consumption with high environmental
pressures — food, housing, mobility and tourism — and
the responses used to tackle them are examined. The final
section provides concluding reflections on consumption,
environmental priorities and the role various actors —
public authorities, business, and citizens — can play to
achieve desired change.
Thematic assessment | Consumption and the environment
2 Consumption patterns in Europe and their
worldwide environmental pressures and
impacts
2.1
Trends in consumption
expenditure
Consumption, as used in this report, covers both
private and public consumption of goods and services
produced domestically and imported, and investments
in infrastructure. Private consumption in Europe is
significantly higher than public consumption, ranging
from 2–3 times higher in the EU‑15 and EFTA (2)
countries to 4–6 times in Turkey and the Western Balkans
(World Bank, 2009). However, public consumption
remains an important element of national consumption,
and is also arguably more directly responsive to
government policy.
Average private consumption expenditure per person (3)
rose by 35 % in the EU‑27 between 1990 and 2007, with
the greatest growth, 75 %, in the 12 countries that have
joined the EU since 2004 (EU‑12). Growth has also been
rapid in the West Balkans and Turkey, rising by 130 %
and 54 % respectively in the same period (World Bank,
2009). Nonetheless, private consumption expenditure
in the EU‑15 and EFTA still exceeds expenditure in the
other regions by a factor of 2–2.7.
Private consumption in EEA member countries is
dominated by housing, transport and food and drink,
with the share of food and drink reducing as incomes
increase. The fastest growing private consumption
categories in the EU are communication, recreation
and culture (Eurostat, 2009). Health and social services,
education services, and public administration and
defence services together consume nearly 90 % of public
expenditure.
2.2
Current European consumption
patterns have high
environmental impacts
Many of the key environmental pressures created directly
within Europe during the extraction of resources and
the production and use of goods and services are closely
monitored and well documented, for example through the
collation of national emissions inventories. Methodologies
for measuring the global pressures caused by European
consumption are less mature and significantly more
uncertain, due in part to data scarcity in many of Europe's
trading partners.
Various methods for estimating global pressures caused
by European consumption are under development.
These include the input-output analyses of single regions
or multiregional economic and environment accounts
(for an overview, see Minx et al., 2009); methods using
national inventory tables combined with life-cycle impact
data for key imported and exported goods; hybrids of
input‑output methods and life-cycle-analysis (LCA)
process data; and resource accounting methods developed
to estimate national ecological, carbon, land and water
footprints. A description and evaluation of methods can
be found in Lutter et al. (2008). The EEA is currently
implementing a simplified accounting method that
addresses, inter alia, the relationship between production
and consumption patterns and their impacts on
ecosystems, both within and outside Europe (footprint).
The Joint Research Centre (JRC) is also developing
methods for estimating the impacts of European
consumption using combinations of national inventory
and trade flow data as well as life-cycle inventories of
representative imported and exported goods.
The Ecological Footprint (EF) is currently one of
the few consumption-based indicators that can be
benchmarked against sustainability thresholds. It has
been methodologically criticised (Best et al., 2008; Van
den Bergh and Verbruggen, 1999; Fiala, 2008; Lenzen and
Murray, 2001; Wiedmann and Lenzen, 2007) and is under
a continuous process of improvement to strengthen some
methodological weaknesses such as its limited scope,
excluding key impacts such as toxicity, non‑renewable
resource use, eutrophication and ecosystem degradation,
and its lack of ability to allow for improvements in land
productivity (Kitzes et al., 2009a; Kitzes et al., 2009b).
Nevertheless, the benchmarking option gives it a role
in communicating over-consumption (Wiedmann
and Barrett, 2010) and for measuring environmental
sustainability if used in combination with other
indicators (Best et al., 2008). The EEA's simplified
accounting method, focused on ecosystems, seeks to
(2) Iceland, Norway, Switzerland and Liechtenstein.
(3) Standardised in terms of purchasing power parity.
The European environment | State and outlook 2010
9
Thematic assessment | Consumption and the environment
05
20
00
20
95
19
90
19
80
19
75
19
19
19
19
20
20
19
19
19
19
19
19
19
19
Source:
70
0
65
0
61
1
05
1
00
2
95
2
90
3
85
3
80
4
75
4
70
5
65
Global hectares per person
5
61
Global hectares per person
85
Development of ecological footprint and available biocapacity per capita in
EEA member countries
19
Figure 2.1
Ecological footprint (gha/per person)
Carbon footprint (gha/per person)
Biocapacity (gha/per person)
Food, fiber, timber and built footprint (gha/per person)
Global Footprint Network, 2009a.
strengthen footprint calculations for Europe and make
them more operational for EU environment and sectoral
policies, currently a major weakness of the EF work.
The EF translates a few of the global pressures caused
directly and indirectly by a country's consumption into
direct and virtual land use worldwide (4). A nation or a
region's footprint can be benchmarked against the area of
land, or biocapacity available nationally and globally per
person, giving a useful indication of the extent to which its
consumption is environmentally sustainable (Wackernagel
and Rees, 1996). The biocapacity of a given piece of land is
a function of its physical area, a factor that takes account
of the type of land cover, and a yield factor varying
according to local conditions.
The global average EF was estimated at 2.6 global ha per
person in 2006 compared to an average available global
biocapacity of 1.8 global ha/person (Global Footprint
Network, 2009a). In other words we are already using
more of the world's resources than can be renewed —
termed global overshoot. Environmental degradation
due to over-use of natural resources is likely to lead to
serious consequences for human well-being and health
(Millenium Ecosystem Assessment, 2005; EEA, 2010).
By 2006, the EF of the average resident of EEA member
countries — 4.5 global ha/person — was already more
than double both the average global biocapacity of
1.8 global ha/person and the available biocapacity
within the territory of the EEA member countries of
2.1 global ha/person.
This suggests that current European consumption and
production patterns could not be transferred to the rest
of the world without overstretching global ecosystem
services. Moreover, Europe's footprint continues to rise
while the available biocapacity per person both in Europe
and globally is shrinking due to population growth and
the degradation of ecosystems.
Economic growth in Europe and other OECD countries
has brought significant social gains. However, these
have come hand in hand with a high demand for natural
resources. Under current development pathways no
country has so far managed to maintain sufficient levels of
human development while keeping resource consumption
within ecological limits (see Figure 2.2).
Achieving a high level of human development without
exceeding ecological limits requires the development
of alternative ways of providing for social, health and
educational needs that are less resource-intensive and
less environmentally damaging. It should be noted
that well-being is not necessarily linked to material
wealth once basic needs are covered. In recognition of
(4) This includes direct land use in the country for urban areas and roads, land used indirectly globally for the production of food, fiber,
timber, energy consumed in the country, and finally 'virtual' land in the form of average forest that would be required to absorb CO2
emissions from the country's use of fossil fuels thus avoiding accumulation in the atmosphere.
10
The European environment | State and outlook 2010
Thematic assessment | Consumption and the environment
Figure 2.2 Human Development Index and ecological footprint
Ecological footprint
(global hectares per person)
UNDP threshold for high human development
African countries
Asian countries
European countries
Latin American and Caribbean countries
North American countries
Oceanian countries
12
12
10
10
World average biocapacity per person in 1961
(This must also include the needs of wild species)
8
8
6
6
4
4
World average biocapacity per person in 2006
2
2
High human development
within the Earth's limits
0
0.2
0
Note: 0.4
0.6
0.8
1.0
United Nations Human Development Index
Both HDI and EF data refer to 2006.
Source: Global Footprint Network, 2009b.
this, the European Commission is committed to taking
leadership in developing and making use of alternative
and complementary indicators to gross domestic product
(GDP) as a measure of social progress (EC, 2009).
caused by consumption in EU Member States are directly
emitted by households for heating, cooking and the
use of private cars. The majority are emitted during the
production of consumed goods and services, including
electricity.
2.3
Moreover, in the global economy, where goods are
increasingly produced and traded worldwide, a significant
share of the environmental pressures associated with a
European country's consumption are felt outside national
borders, not only in other EU Member States but also
elsewhere in the world. Although indirectly caused by
The unseen trade in
environmental pressures
Only a relative minor part of environmental pressures
caused by a country's consumption are emitted directly by
consumers. For example, only 10–30 % of CO2-emissions
(5) 'Embodied' pressures refers to pressures which have taken place along the full production chain of a product from material
extraction to sale to the consumer.
The European environment | State and outlook 2010
11
Thematic assessment | Consumption and the environment
European consumption, these pressures are less visible to
European policy makers.
Multiregional input/output models can be used to estimate
environmental pressures embodied in trade between
global regions and individual countries. For EU Member
States on average, 40 % of total CO2 emissions caused by
national consumption were found to be embodied in goods
imported from both within the EU and from the rest of
the world (Figure 2.3). The figure rises to over 50 % for
some smaller countries including Austria, Belgium, the
Netherlands, Denmark and Sweden. Peters and Hertwich
(2008) estimate that typically half of embedded CO2 in
imports to EU Member States are associated with goods
coming from outside Europe.
Due to increasing international trade the shares of
non‑domestic emissions in the carbon footprints of
EU Member States are likely to be on the increase. In the
cases where imports are sourced increasingly in countries
with typically less eco-efficient industrial production
processes and more impact‑intensive energy mixes than
EU Member States (Rørmose et al., 2009) increasing trade
might push up carbon footprints of EU countries.
Helm et al. (2007), for example, estimated that the GHG
emissions associated with consumption in the United
Kingdom increased by 19 % between 1990 and 2003.
Figure 2.3
Similarly, while direct material resource use in Europe
has stabilised, there are indications that indirect resource
use and associated pressures caused by European
consumption are on the increase (EEA, 2005). The
total material consumption (TMC) for Germany, that
includes direct and indirect material extraction caused
by consumption, fell during the first half of the 1990s
but has been rising since then, increasing from 69 to
74 tonnes per person between 1996 and 2004 (Schulz and
Bringezu, 2008). Austria showed a 5 % increase in direct
and indirect material use — measured as Raw Material
Consumption (RMC), excluding unused extraction and
waste — caused by consumption between 1995 and 2005
(Schaffartzik et al., 2008).
This 'virtual' trade of environmental pressures is not
necessarily a problem. It merely demonstrates that
a different set of measures can be used to reduce
consumption-caused emissions than may have been
adopted to tackle emissions from domestic industry.
2.4
Environmental pressures
caused by different
consumption categories
The EEA has estimated the environmental pressures
caused by consumption in nine EU Member States (6)
CO2 emissions caused by consumption in 26 EU Member States, 2004
CO2 emissions (tonnes per person)
18
16
14
12
10
8
6
4
2
Be
Au
st
ria
lg
iu
Bu m
lg
ar
Cz
i
ec Cyp a
h
ru
Re
s
pu
bl
D
en ic
m
Es ark
to
n
Fi ia
nl
an
Fr d
an
ce
G
er
m
an
G
re y
ec
H
un e
ga
Ir ry
el
an
d
It
al
y
La
tv
Li
th ia
ua
ni
a
M
N
al
et
he ta
rla
n
Po ds
la
nd
Po
rt
u
Ro ga
m l
a
Sl nia
ov
a
Sl kia
ov
en
i
Sp a
a
U
i
ni
Sw n
te
ed
d
e
Ki
ng n
do
EU
m
M A
em v
be era
r ge
St
at for
es
0
Emissions in other countries (embodied in imports for domestic consumption)
Domestic emissions (from households and from national production of goods for domestic consumption)
Note:
CO2 emissions in other countries include emissions in other EU Member States resulting from internal EU trade.
Source:
Davis and Cadeira, 2010.
(6) Austria, Czech Republic, Denmark, Germany, France, Italy, the Netherlands, Portugal and Sweden.
12
The European environment | State and outlook 2010
Thematic assessment | Consumption and the environment
Box 2.1 Consumption and chemicals
There is growing concern about the potential human health and environmental impacts of chemicals in consumer
products, in particular persistent and bio-accumulative organic compounds, endocrine-disrupting chemicals and heavy
metals used in plastics, lubricants, textiles, cosmetics, dyestuffs, flame retardants, wood preservatives, electronic
goods, and food packaging. Exposure to these chemicals is thought to be linked with declining sperm counts, genital
malformations, impaired neural development and sexual behaviour, obesity, and cancer. Many of these chemicals leach
easily from the products and can be found in the environment — in ambient (urban) air, indoor dust, wastewater,
sludge — in some cases at levels high enough to be of health concern (Fisher et al., 2006). Some are highly persistent
in the environment where they may undergo further transformation. For example, it has recently been shown that
the flame retardant polybrominated diphenyl ethers (PBDE) exposed to wastewater treatment can generate dioxins
(Betts, 2009 — orig. Steen et al., 2009). Widely-used plasticisers such as phthalates and bisphenol A; perfluorinated
chemicals used in a variety of commercial applications as water, oil, soil and grease repellents; and brominated flame
retardants are most often discussed in this context due to their suspected health effects and ubiquitous presence in
the environment. A matter of particular concern is exposure to a mixture of low levels of chemical compounds that
may exert synergistic effects, especially in unborn and very young, vulnerable children (ULSOP, 2009).
representing 268 out of Europe's 501 million people
(Eurostat, 2010) and allocated them to final consumption
categories. The estimates were made using a single
region input-output model.
more important, for example tourism for degradation
of coastal habitats, chemicals in consumer products
for health impacts and eco-toxicological impacts (see
Box 2.1).
The majority of four key environmental pressures
caused by private and public consumption (7) can be
allocated to the consumption of food and drink, housing
and infrastructure, and mobility. These three broad
consumption areas are estimated to have contributed
68 % of GHG emissions, 73 % of acidifying emissions,
69 % of tropospheric ozone precursor emissions and 64 %
of the direct and indirect material input caused globally
by consumption in 2005 in the nine countries (EEA
and ETC/SCP, 2010; ETC/SCP, 2009). The same critical
consumption areas have been identified in other key
studies (for example, JRC/IPTS, 2006).
Pressures caused directly and indirectly along the
production chain of consumed goods and services plus
direct pressures created during private consumption can
be allocated to 12 broad categories of private household
consumption as defined under the Classification of
Individual Consumption according to Purpose (COICOP)
nomenclature used by Eurostat. When pressures caused
by private consumption are allocated to these 12 main
areas, food, housing and mobility dominate, followed by
furnishings and household equipment (Figure 2.4).
It should be noted that the single region methodology
used for these calculations assumes that imported goods
are produced with the same resource inputs and emissions
per unit output as those produced domestically. For
example, agricultural products imported to Sweden are
assumed to have emitted the same volume of GHGs as if
they had been produced in Sweden. This assumption will
considerably underestimate GHGs embedded in imports
from countries with less efficient production processes
(see Rørmose et al., 2009, for Denmark) and thus affect
estimates for consumption-based footprints of countries.
However, the share of pressures allocated to different
consumption categories is expected to be much less
affected.
For other environmental pressure categories not covered
by these analyses, for example, land degradation, other
consumption areas might also be as relevant or even
The dominance of the first three is partly due to their also
being the three private consumption categories in the EU‑27
with highest expenditure (Eurostat, 2009a). However, food
and mobility, and to a lesser extent housing, are also the
areas of private expenditure with the greatest pressures
for each euro spent (Figure 2.5). These three areas are
addressed in more detail in Chapters 4–6 of this assessment.
Chapter 5 on housing also covers furnishings and
household equipment. A fourth area, tourism is considered
in Chapter 7 because of its fast growing contribution to
environmental pressures from consumption. The pressures
caused by public consumption, meanwhile, can be partially
tackled through green public procurement. This is looked at
in more detail in Chapter 8.
Decoupling environmental pressures from growth in
private consumption can be achieved by reducing the
pressure intensities within individual consumption
categories — through improvements in housing energy
efficiency, switching transport expenditure from private
(7) Including fixed capital formation — investments in machinery, roads, water and sewage networks and other infrastructure.
The European environment | State and outlook 2010
13
Thematic assessment | Consumption and the environment
Figure 2.4 Direct and indirect global pressures caused by private (household)
consumption distributed by consumption (COICOP) category, in selected
EU Member States, 2005
Greenhouse gas emissions
1.6 %
1.7 %
1.8 %
4.1 %
1.3 %
0.7 %
0.2 %
0.2 %
11.6 %
Acidifying emissions
1.3 %
1.2 %
1.4 %
6.4 %
35.2 %
1.1 %
0.6 %
0.4 %
0.1 %
14.3 %
9.4 %
21.4 %
17.2 %
42.3 %
24.5 %
Tropospheric ozone precursor emissions
1.5 %
1.5 %
1.6 %
3.5 %
1.0 %
0.7 %
0.2 %
0.1 %
23.7 %
Material use
1.5 %
1.8 %
0.8 %
1.8 %
0.4 %
2.1 %
0.2 %
5.7 %
19.3 %
11.1 %
16.6 %
17.4 %
21.7 %
37.6 %
28.2 %
Housing, water, electricity, gas and other fuels
Restaurants and hotels
Health
Transport
Recreation and culture
Communication
Food and non-alcoholic beverages
Miscellaneous goods and services
Tobacco and narcotics
Furnishings, household equipment and routine maintenance
Clothing and footwear
Education
Notes: The input/output analysis of NAMEA tables gave estimates of pressures created along the production chains of finally
consumed products from 36 individual economic sectors. These were then allocated to the 12 COICOP household
consumption areas using a simplified transformation matrix developed by the EEA- ETC/SCP. The pressures allocated to
these categories do not include pressures created by public (government) consumption or caused by gross capital formation
— the building of roads, water and sewage networks serving households.
Source: EEA and ETC/SCP, 2010.
cars to public transport, or a shift from spending on
quantity to quality in food, furniture, clothing, etc.
However, the large differences in environmental pressure
intensities found between private expenditure categories
(Figure 2.5) highlights a second potential for reducing
or decoupling environmental pressures from growth in
consumption: that of channelling additional expenditure
of growing incomes towards low pressure consumption
14
The European environment | State and outlook 2010
categories such as education, communication, or
recreation and culture — except recreation activities
involving intensive use of transport.
Consumption trends appear to have moved modestly
in the right direction over recent years. Two of the less
pressure-intensive categories, communication, and
recreation and culture, were the two fastest-growing
private expenditure categories in the EU‑27 Member States
Thematic assessment | Consumption and the environment
Figure 2.5
Relative environmental pressure intensities — indexed pressure caused per
euro of spending — of private consumption categories in nine EU Member
States *, 2005
Pressure intensity relative to average across all consumption categories
5.0
4.5
4.0
3.5
3.0
2.5
2.0
1.5
1.0
0.5
io
ne
Ed
uc
at
at
ic
un
m
m
an ou
d sg
se o
rv od
ic s
es
n
n
io
lth
ea
H
ce
lla
Co
ra
ge
s
a
s te
an r,
d el
ot ec
he tr
To
r icit
ba
fu y
cc
el ,
o
s
an
d
na
Cl
rc
ot
ot
hi
ic
s
ng
an
d
fo
Fu
Re
ot
rn
w
st
is
ea
au
hi
r
ro ng
ra
ut s,
nt
in h
s
an
e ou
m s
d
ai eh
ho
nt o
te
en ld
ls
an eq
ce ui
of pm
th en
e ta
Re
ho n
cr
us d
ea
e
tio
n
an
d
cu
ltu
re
H
is
M
ga
ou
si
ng
,
Fo
w
od
an
d
be
Tr
ve
an
sp
or
t
0.0
Greenhouse gases
Note:
Acidifying emissions
Tropospheric ozone precursors
Material consumption
* Austria, Czech Republic, Denmark, Germany, France, Italy, the Netherlands, Portugal and Sweden.
Source: EEA and ETC/SCP, 2010.
between 1995 and 2006, increasing by 10.2 % and 4.4 %
respectively per year (Eurostat, 2009). However, evidence
from the EEA's NAMEA-based analysis suggests that
gains made through such shifts in consumption spending
are relatively modest compared to gains made from
improving eco-efficiencies within individual consumption
categories (Figure 2.6). Similar results were found by
Baicocchi and Minx (2010) for the United Kingdom
between 1992 and 2004.
Where decoupling of global GHG emissions and material
use from growth in consumption was achieved, it resulted,
in most cases, primarily from eco-efficiency improvements
in production chains, energy efficiency improvements, or
shifts in fuel use. Shifts in spending from more intensive
to less intensive consumption categories, for example,
from mobility to communication, have contributed
to decoupling to a limited extent. As noted earlier,
assumptions concerning pressures embodied in imports
can lead to overestimates of the levels of decoupling
of pressures from growth in consumption, and results
may therefore differ from findings in other studies (for
example, Netherlands Environmental Assessment Agency,
2007).
More rapid decoupling of GHG emissions and material
consumption from consumption expenditure is required
if absolute pressures are to be reduced significantly in the
foreseeable future. This will require more eco‑efficient
production of goods, fewer toxic products, more
resource‑efficient appliances, buildings and transport
systems, but also widespread fundamental changes in the
type of goods and services we buy.
Last but not least, current consumption patterns do not
only impact the environment, they can also have negative
impacts on health, as concerns about obesity illustrates
(Box 2.2).
The European environment | State and outlook 2010
15
Thematic assessment | Consumption and the environment
Figure 2.6
Changes in GHG emissions (1995–2005) and material use (2000–2005) caused
by national consumption and contributing factors in selected EU Member States
Globally induced GHG emissions (tonnes CO2-equivalent per person)
3
2
1
0
–1
–2
–3
–4
–5
–6
Changes in GHG emissions
1995–2005
Contribution from growth in
consumption
Contribution from changes in
domestic consumption-mix
Contribution from changes in
eco-efficiency
Globally induced direct material input (tonnes per person)
3
2
1
0
–1
–2
–3
–4
Changes in material use
2000–2005
Austria
Note: Denmark
Contribution from growth in Contribution from changes in Contribution from changes in
consumption
domestic consumption-mix
eco-efficiency
France
Germany
Italy
Netherlands
Portugal
Sweden
The left-hand set of bars in each graph show how per-person pressures have developed over the given time interval. The
next set of bars indicate how the pressures would have developed over the same period if they were linked to economic
growth only. The two sets of bars can be compared to see if decoupling has occurred. For example, the Netherlands showed
strongest decoupling in GHG emissions 1995–2005, while Italy showed very little decoupling.
The right-hand two pairs of bars demonstrate the extent to which shifts in consumption patterns and improvements in ecoefficiency in the provision of goods and services have contributed to the observed decoupling.
Source: EEA and ETC/SCP, 2010.
Box 2.2 Health impacts of unsustainable consumption patterns: obesity
Current consumption patterns of a large part of the European population, especially in terms of food and mobility, are
linked to several health risks, with overweight and obesity issues being of greatest concern because they are linked to
serious health problems including cardiovascular disease, diabetes, some types of cancer and reduced life expectancy.
Although overweight has many and complex determinants, increasing calorie intake, coupled with a more sedentary
lifestyle, is the root of the problem. More than 53 % of the EU population are estimated to be overweight (IASO,
2008), and the numbers are increasing (WHO, 2008).
Excessive intake of high-energy food, often cheaper, heavily advertised and more easily available than more healthy
food, plays an important role. Although not all healthy food has low environmental impacts and vice versa, several
dietary recommendations, such as a higher proportion of cereals, potatoes, vegetables and fruit in diets, and less
meat, are beneficial both to human health and to the environment (Figure 4.2). Higher calorie intakes combined
with sedentary lifestyles do not only have adverse health effects but also mean that more food has to be produced,
resulting in higher life-cycle environmental impacts than diets based on recommended healthy calorie intakes.
Insufficient physical activity is another very relevant factor for overweight, obesity, and their related health problems.
In addition to individual behaviour/life style-related choices, physical activity depends on many conditions, including
mobility patterns, access to walkable neighbourhoods, safe green areas, as well as infrastructure, promoting physical
activity. Overweight people report that they walk less (Eurostat, 2006) and tend to live in low-density areas and
with a higher dependency on car-based transport, although the nature of this association is highly complex (Scottish
Government, 2008; Eid et al., 2007).
16
The European environment | State and outlook 2010
Thematic assessment | Consumption and the environment
2.5
Low-pressure households
— a good example of more
environmentally sustainable
consumption?
The potential for reducing environmental pressures
through behavioural change can to a certain extent be
identified by analysing differences in the behaviour
of households within a single community or country.
A number of such studies have been carried out in
Europe, for example, Girod and de Haan (2009);
Lähteenoja et al. (2008); Brand and Boardman
(2008); Vringer and Blok (1995) and OFEV (2006). All
these studies found large differences between the
environmental pressures caused by households.
For example, Brand and Boardman (2008) found that
10 % of United Kingdom households were responsible
for 43 % of total GHG emissions from mobility. Kotakorpi
et al. (2008) found nearly a factor 10 difference in direct
and indirect material use caused by the most and least
impactful of 26 households studied in Finland.
A larger-scale Swiss study of 14 000 households found
that even after adjusting for income differences,
GHG emissions per person varied by a factor of 4,
ranging between 60 % and 170 % of the value for the
mean household (Figure 2.7). Vringer and Blok (1995)
also found large differences in energy use between Dutch
households of the same income level.
The Finnish and the Swiss studies show that households
that cause low environmental pressures tend to live in
urban areas, use public transport rather than private cars,
use renewable energy for heating, have smaller living
space per person, live in apartments rather than single
family houses, and eat less meat and more organic food.
Importantly, low-emitting households spend more on
leisure activities and are willing to pay more for quality
rather than quantity in the goods they buy. The fact that
the low-emitting households tend to lie in urban areas
does not mean that urban households on average are
lower emitters than rural ones. Rather the infrastructure
in urban areas more readily allows for reduced carbon
lifestyles by engaged citizens.
Some of the characteristics of low-emitting households
in the studies — use of public transport, living in
apartments, green heating, etc. — are only available in
dense urban areas where this kind of infrastructure is
economically viable. However, a study of the behaviour
and GHG emissions of urban households in the city of
York, United Kingdom, showed that while those living
in city centres made least use of cars, they were also the
households with the highest emissions related to air
travel (Haq and Owen, 2009).
Figure 2.7
Key differences between
equal income low and high
GHG emitting households in
Switzerland
Relative to median GHG emitting household
(median greenhouse gas household = 1)
3
3
2
2
1
1
0
1
2
3
4
5
6
7
8
9
10
Household decile groups from lowest to
highest greenhouse gas emitting households
Household GHG emissions
Living space (m2)
Renewable heating ('green heating')
Car use (pkm)
Single family house
Note: The households are grouped according to their
emission of greenhouse gases. The 10 % of
households with highest GHG emissions (group 10)
also had the highest car use, the highest share of
single family houses, the largest living space per
person and the lowest use of green heating (district
heating or renewables).
Source:
Girod and de Haan, 2009.
The types of consumption behaviour shown by
low‑pressure households in these studies could provide
a good example for helping shape future consumption
patterns. The potential for reductions in pressures caused
by consumption would be even higher than indicated
by the variations between current households when
combined with technological advances such as improved
efficiency of the housing stock, increasing share of
renewable electricity and improved fuel efficiency of
vehicles.
Such findings showing large variations in behaviour
across society demonstrate the need for focussed policies
tailor-made for different social groups. A first stage in
tailoring responses to enable greener consumption will
be to gain an understanding of the key factors shaping
consumption behaviour. These are examined in Chapter 3.
The European environment | State and outlook 2010
17
Thematic assessment | Consumption and the environment
3 Understanding what shapes current and
potential future consumption
Private consumption is shaped by an array of complex
and interrelated factors, including demographics; income
and prices; trade, globalisation and technologies; supply
of goods and services and how they are marketed;
information and transparency on products and services;
policies; housing and infrastructure, as well as social and
psychological factors such as habits, culture and taste
(Mont and Power, 2010; Power and Mont, 2010).
Some of those factors are very well understood by policy
makers — in particular income and prices, while others,
such as habits and culture, are typically less understood.
Future trends in European consumption, and the resulting
environmental impacts, will depend on how these many
factors develop. Policies at all levels, not only those directed
at consumption, also influence consumption behaviour.
These are dealt with in Chapter 8.
To develop effective policy responses to limit negative
environmental pressures and impacts from private
consumption, there is a need for a better understanding of
the many complex factors that shape people's consumption
behaviour (PSI, 2006). This chapter provides an overview of
the main factors, including how they relate to one another,
as well as some possible future developments.
3.1
Economic influences on
consumption
The most important factor influencing consumption
patterns is the level of disposable income at the individual
household level (OECD, 2008a). The growth path
hypothesis, implying an ever-growing GDP, can be
identified as one of the driving forces behind consumption
dynamics. Recent baseline projections published by the EC
— which take into account the current economic downturn
— assume that GDP in the EU‑27 will grow again between
2010 and 2020 but that this would not compensate GDP
losses from the downturn compared to earlier projections
(EC, 2010a). However, economic forecasts are very
uncertain (see also EEA, 2010b) and recent developments
show that steady growth cannot be taken for granted.
Immediately before the financial and fiscal crises began
in 2008, other major global economic trends had been
making their mark on European consumption patterns.
These included steeply rising prices of oil, steel and other
18
The European environment | State and outlook 2010
non‑renewable resources in response to global increases
in demand, and rising food prices (see Chapter 4). These
resource price increases were alleviated by the economic
downturn but could well reappear when a period of stable
economic growth returns.
Rather than growth being a driver of future consumption
patterns, the potential for growth may in future depend to
an increasing extent on how we consume. The economic
system is increasingly being recognised as being bounded
by the limits of the ecological system and is heavily
dependent on the services that ecosystems deliver to the
economy (TEEB, 2008).
The household savings rate is a key influence on the
extent to which income is translated into material
consumption; the savings rate in the EU rose by nearly
3 percentage‑points during late 2008 and 2009, and
started to fall again as consumer confidence increased
in the last quarter of 2009 (EC, 2010b). In the longer
term, the ageing population could lead to a fall in the
household savings rate, as older people tend to save less
than people of working age.
The relevance of prices for consumer decisions means
that, generally, consumers demand more of any product
if the price goes down and less if the price increases. The
degree of change in demand resulting from a variation
in price depends on the price elasticity of that particular
product or service. For example, price elasticities for basic
food items such as bread, milk and eggs are lower than for
restaurant meals, as going to a restaurant is much easier to
avoid than purchasing basic food.
However, the effects of resource use on the environment
and society, such as costs of cleaning up pollution or
climate change mitigation, are in many cases not included
in the prices of goods and services. Instead the costs
associated with negative effects are paid for by the wider
society. This lack of internalisation of external effects —
the costs to society of environmental degradation — in the
prices of products and services is a market failure driving
consumption patterns based on high resource use.
Economic instruments, such as taxes, can be applied
to overcome such market failures to ensure that prices
include economic, social and environmental costs (see also
Chapter 8). Carrying out such adjustments is one of the
Thematic assessment | Consumption and the environment
principles of the EU Sustainable Development Strategy
(European Council, 2006). Setting of high environmental
and social standards for resource extraction, production
and products is another option to internalise social and
environmental costs. Increases in product prices caused by
implementation of this internalisation principle can lead to
a reduction in the consumption of products and services
with higher environmental impacts.
The granting of subsidies also influences consumption
and its environmental impacts. Subsidies are implemented
for economic, environmental and/or social policy
reasons and are often seen as a policy failure. They
can be counterproductive in the sense that they can
encourage higher levels of consumption with negative
environmental consequences. But at the same time they
can also be justified because of their economic motives
and for promoting jobs. They can also be used to make
consumption patterns more sustainable, for example loan
programmes for energy efficiency measures or renewable
energy installations, fostering the implementation of
eco‑innovative technologies and thereby helping to
achieve environmental and economic benefits.
Policies driving economic development towards a
green economy, including taxes and charges, removing
environmentally-harmful subsidies, and economic
incentives at the point of sale such as tax rebates for
less pressure-intensive products or services might also
influence future consumption patterns, especially if they
successfully address the market failures. Such policies
have the potential to make products and services with
lower resource use and lower environmental impacts
more competitive and thus change their availability and
attractiveness to the market.
However, there is a risk that environmental benefits
resulting from changes to more sustainable consumption
patterns cannot be fully effective if they are not
accompanied by adjustments in the production structure
of economies, thereby reducing environmental impacts.
Otherwise, the existence of production over-capacity
for products with high environmental pressures
generally creates incentives to enhance consumption of
these products, thereby using sophisticated marketing
strategies. To maximise their environmental benefits,
policies promoting sustainable consumption and
production need to be well coordinated.
3.2
Demographic influences on
consumption
Consumption in Europe is by nature also shaped by
the size of its population, the share of the population in
various age groups, location, the number of people per
household and living space available per person.
The total population of Europe has been increasing
albeit slowly, acting as a driving force of total household
consumption expenditure — the EU‑27 population
reached 501 million in January 2010 (Eurostat, 2010). In
a scenario developed by Eurostat, assuming that fertility,
mortality and net migration will progressively converge
between Member States, population is expected to reach
514 million in 2020, largely driven by immigration, but
to decline after peaking at around 520 million in 2035
(EUROPOP, 2008). The United Nations projects an even
sharper decline of population in the EU‑27 plus Iceland,
Norway, and Switzerland (Hoßmann et al., 2008). There
are significant differences between countries, and several
already have declining populations, mainly the EU‑12
Member States (CSIS, 2008). The expected slow-down of
population growth and the later shrinking of population
in Europe may help curtail increases in energy
consumption (York, 2007).
The effect of immigration from non‑European countries
is likely to influence consumption patterns, but little is
known about the direction of that influence. For example,
the impact of immigration on food consumption is
obvious when one looks at the wide range of foreign
foods, and the increase in the number of ethnic restaurants
in Europe (European Migration Network, 2006) but the
resulting impacts on the environment are uncertain.
A second demographic trend, the ageing of the European
population, influences the patterns of consumption,
however the exact influence is uncertain. The share of
the EU‑27 population aged 65 years and over is likely to
rise from 17.1 % in 2008 to 30 % in 2060 (Eurostat, 2008a).
The share of household expenditure on food generally
increases with age, as retired people tend to have lower
relative incomes and thus spend more on basic goods
such as food (UK Office for National Statistics, 2007).
Ageing societies may result in reduced disposable
incomes and slower economic growth (EC, 2006; OECD,
2005). On the other hand, an increase in the number
of pensioners who have disposable income for leisure
and travel is projected to have negative environmental
impacts (EC, 2006; OECD, 2008a); currently, older people
typically take longer and more frequent leisure trips
abroad than the average person (Eurostat, 2008b), but
this may change as pensions provision comes under
pressure in ageing societies.
The third demographic trend is towards smaller and
therefore more households, which is expected to result in
higher demand for space and increases in consumption
of household goods. This phenomenon is observed in
almost all industrialised and European countries (Liu
et al., 2003). One-person households consume on average
38 % more products, 42 % more packaging and 55 %
more electricity per person than four-person households,
as well as producing significantly more waste (Williams,
The European environment | State and outlook 2010
19
Thematic assessment | Consumption and the environment
2007). The Second European Quality of Life Survey
(Anderson et al., 2007) indicates that the people of the
Baltic States, Bulgaria, the former Yugoslav Republic of
Macedonia, Hungary, Poland, and Turkey are the least
satisfied with the size of their living space and thus,
depending on socioeconomic conditions, increases over
the next years can be expected.
Technological developments and breakthroughs
often lead to improvements in eco-efficiency, though
these gains are often outweighed by consumption
growth, including from so-called rebound effects
where technology and efficiency gains often lead to
the increased consumption of other goods and services
(Box 3.1).
Markets play an important role in deploying
technological changes. Competition encourages
innovative and improved products, and variety and
novelty are cornerstones of modern life; European
consumers generally respond favourably, with a few
exceptions such as food based on genetically modified
organisms.
Future technological innovations, for example, in the
areas of nanotechnology, biotechnology and the further
development of information and communication
technologies, have a high potential to change our daily
life. Smart devices, such as intelligent appliances, floor
tiles with embedded sensors, and biosensors could
change the way we use appliances and heat and cool
our homes (Biointelligence Service, 2010). Full wireless
broadband access for all households and rolling out of
radio frequency identification (RFID) technology, which
are expected to enable people to instantly connect to
each other using tiny screens, digicams, video graphic
messages, are just some examples. Mobile phones are
increasingly used as digital terminals for data, text
and media at declining costs. These new options might
further encourage more working from home (JRC/IPTS,
2008) that could have the positive environmental impact
of reducing commuting, but the effect is not clear-cut
because people might accept longer commuting distances
if they do not have to commute every day.
When new goods first enter the market they are often
considered luxuries and are typically expensive. As the
market for early adopters saturates, the companies may
lower their profit margins or produce cheaper versions
in order to maintain or increase sales (Mont, 2007). This
process means that once-luxury goods become part of
normal consumption patterns, as has happened with
cars, personal computers, and mobile phones.
New technologies aimed at higher energy efficiency for
example in housing design including novel materials,
decentralised renewable energy generation, and
transport systems such as electric cars, can positively
influence the environmental impacts of mobility
and housing consumption patterns, but need strong
European energy efficiency policies to speed up their
uptake.
3.3
Technology and innovation as
drivers of consumption
Technology and innovation have changed our lifestyles
significantly: the emergence of convenience foods,
manifold household appliances and modern information
and communication technologies have changed our
patterns of mobility, recreation and leisure time activities,
and food consumption beyond recognition compared
to those of only one or two generations ago (Mont and
Power, 2010).
Box 3.1 The rebound effect
The rebound effect is usually examined in the context of the adoption of new energy-saving technologies — more
fuel‑efficient cars, energy-efficient household appliances, etc. It refers to behavioural changes or other systemic
responses that can partly or fully offset the beneficial environmental effects of these new technologies.
The rebound effect can be explained by three different economic reactions:
• Direct rebound effect: an increase in efficiency lowers the cost of consumption which can then lead to a rise of the
consumption of the product. For example, fuel efficient cars reduce the petrol cost per distance travelled, which can
then lead to more kilometres travelled and more petrol used.
• Indirect rebound effect: reduction in the costs of consumption increases the real income of households which can
trigger a rise in the consumption of other goods and services.
• Economy-wide or general equilibrium effect: this is more complex and refers to changes in aggregate consumption
patterns which may lead to structural change, as well as to changes in relative prices (Brännlund et al., 2007). An
example is time savings (Jalas, 2000) from efficiency improvements such as email or e-banking so that more time is
available for other forms of consumption, for example, leisure driving.
There is a general agreement that the rebound effect exists and can be significant in many cases. However, the size of
the rebound effect varies substantially from case to case (UKERC, 2007).
20
The European environment | State and outlook 2010
Thematic assessment | Consumption and the environment
Future developments will depend on many factors,
including the pace of technological change and public
perception of the risks involved. The implications
for the environment are often uncertain, as science
struggles to keep pace with the speed of developments.
For some technologies such as mobile technologies,
nanotechnologies and genetically modified organisms,
the application of the precautionary principle is
increasingly discussed as a tool to help society strike a
better balance between innovation and risk.
3.4
Urbanisation and the role of
infrastructure
Most European consumption takes place in cities
and towns, as 73 % of EU citizens live in urban areas,
and this share is expected to grow to 80 % by 2030
(IEA, 2008). Urban density and the design of the built
and natural environments of cities therefore play a
crucial role in shaping consumption patterns. At the
same time, urban areas and consumption patterns of
urban dwellers depend heavily on ecosystem services
provided by rural areas, such as clean water, food, and
green areas for recreation, and urbanisation and urban
sprawl contributes to biodiversity loss especially if not
counterbalanced by good urban and landscape planning
(see also the SOER 2010 urban environment assessment
(EEA, 2010c) and land use assessment (EEA, 2010d)).
Rural residents in Europe have largely adopted urban
lifestyles and luxuries, work in towns or cities and
use other urban services — but often commute longer
distances to achieve this and on average use more
living space per person. Although urban living in
developed countries is generally more efficient in terms
of energy use for mobility and housing than in rural
areas, energy consumption in urban areas accounts for
69 % of Europe's energy use (IEA, 2008), but the picture
might change if all consumption-related pressures were
included. In a study examining a number of Finnish
households, urban dwellers also caused lower material
resource use than rural dwellers (Kotakorpi et al., 2008).
Urban design is thus relevant particularly in two areas:
urban transport, which accounts for 40 % of GHG
emissions and 70 % of air pollutants from European
road transport (EC, 2007), and housing. Although data
for GHG emissions from housing in urban areas differ
depending on the applied methodology, usually a share
above 50 % is stated in literature (see the SOER 2010
urban environment assessment (EEA, 2010c)). Building
design can therefore reduce energy consumption
dramatically. Urban design and spatial planning also
play an important role for quality of life, which in turn
influences consumption patterns.
3.5
Social and cultural influences
on consumption behaviour
Our behaviour is greatly influenced by the lifestyles
of those around us: friends, family, colleagues, and
increasingly by the lifestyles, both real and fictional,
portrayed in the media: we want to belong to our social
group, but at the same time we also want to establish our
status within it. Consumer culture encourages many to
establish a place in society or status through the purchase
of material possessions and other lifestyle choices we make.
In this way, we use consumption to help us construct our
personal and collective identity (Power and Mont, 2010).
Fitting in with our social groups is a crucial driver of
conspicuous consumption, as we use goods to signify and
maintain both our membership of a group and our status
within it (Power and Mont, 2010); however, as goods that
were once seen as luxuries, such as cars or televisions,
that signified status gradually enter the mainstream
these products lose their positional status, and so people
are drawn to ever-higher levels of luxury consumption
(Veblen, 1902; Hirsch, 1977; for further explanation, see
Mont and Power, 2010). Of course this is not inevitable:
in some social groups status can be established through
non‑material means including charitable works or
education and there are means of further promoting
less‑materially intensive values (Schor, 1999; Jackson,
2009).
In addition to group identity, our personal identity can
also be a relevant psychological driver of consumption as
we are not born with a fixed identity, and in the Western
world our roles are no longer defined by traditional roles.
We have a strong need to define our own identity and our
material possessions may play an important part in this
process (Halkier, 1998). A further psychological factor is
the symbolic role goods play in our lives: our possessions
are not only functional, they may also have meanings and
signify information about us or our lives, both to ourselves
and others — examples are wedding rings, family photos
and religious artefacts (Power and Mont, 2010).
Research confirms the commonly-held belief that we are
led more by our desires than by our actual needs; this is
often used in marketing campaigns, based on the idea that
we respond more strongly to desire than to rational ideas
(Belk et al., 2003). Consumer choices are strongly influenced
by media, marketing and popular culture (Henderson,
2005; Mont and Power, 2010). As the basic needs of most
Europeans have been met, the advertising industry is
increasingly creating new needs to ensure that we buy
new products. This is known in marketing as problem
recognition: the consumer recognises a need or want and
is motivated to act upon it (Belch and Belch, 2007). This
process starts early in life: the average kindergartner child
The European environment | State and outlook 2010
21
Thematic assessment | Consumption and the environment
can identify 300 logos (McNeal, 1992; Schor, 2004; Fischer,
1991). Although European spending on advertising fell in
2009 during the financial crisis, it is expected to return to
growth in 2010 and 2011 (Zenith, 2009).
It is also important to address concerns about 'green
washing' — to ensure that market information for
consumers is not misleading: one policy response to this
concern is the EU Directive 2006/114/EC which deals with
misleading and comparative advertising, and also covers
environmental and ethical claims by companies (EC 2006b;
Mont and Power, 2010). However, there are also positive
examples of the power of advertising in promoting more
sustainable consumption — see for example UNEP's
Creative Gallery on Sustainable Communications, a
database of mostly corporate advertisement which
encourage the purchase of environmental or ethical
products (OECD, 2008b, UNEP, 2010).
However, much of our consumption expenditure is
inconspicuous, for example rent payments or utility
bills, as well as mundane everyday purchases such as
lunch or a newspaper. Many consumption decisions and
behaviours are driven by habit and context (Gronow and
Warde, 2001; Shove, 2003), rather than by rational and
conscious decision-making processes, and they become
stronger every time we repeat an action, which is one
reason why they can be difficult to change. In addition,
history and cultural norms can also play a role in shaping
consumption choices.
The normal practices of everyday life have meanings and
associated consumption norms. For example, being an
accepted part of society requires us to take part in standard
practices such as wearing suits to work, or buying material
gifts for wedding presents (Randles and Warde, 2006).
Inevitably people find it difficult to live sustainably when
this is not the social norm (Jackson, 2009).
Social norms can, however, change over time. For
example, a consumerist culture has evolved in Western
European countries but also rapidly in the EU‑12 Member
States and Western Balkan countries (EEA, 2010a).
Consumerism is where high consumption of material
goods is seen as normal, seems necessary to be accepted
in society and is generally associated with well-being
and success. However, the Sustainability First scenario of
UNEP's GEO-4 report shows that new values can emerge
that respect sustainability objectives (Box 3.2).
3.6
Types of consumers
There are different types of consumers, and not all
consumer types respond in the same way to policy
instruments. People have different values and attitudes,
different cultural backgrounds, different incomes, ages,
genders, education, access to infrastructure and abilities.
In marketing, the concept of consumer segmentation
is widely used to sub-divide populations according to
various attributes in order to be more effective in targeting
Box 3.2 But what if?
The emerging trends indicate that incomes and consumption levels in Europe will continue to grow, which is likely
to result in higher pressures and impacts on the environment. But the uncertainties around the trends are high, as
has recently been illustrated by the economic downturn that started in 2007. In order to explore possible future
developments, scenarios are used to show what could happen if uncertain factors ('what ifs') develop in different
directions (UNEP, 2007a).
What if ecosystems and the services they are able to provide continue to decline so that clean water, high-quality food,
energy and materials as well as access to nature become more expensive relative to European citizens' incomes? Will
Europeans still be able to buy resources from other parts of the world to satisfy their consumption?
What if the economy does not recover to previous growth paths, more people become unemployed and pension and
social security systems come more and more under pressure? People might want to save more, some might stay
away from green products if these are more expensive, and others might reduce spending on holidays or use public
transport instead of the car. Perhaps people would become more interested in extending the lifetime of goods or buy
second-hand, or would buy cheaper goods which might break more quickly.
What if the world becomes more dominated by business, with markets and free trade being seen as the best path for
rapid economic growth and markets also playing the main role in regulating future development? This 'Market first'
scenario is one of four scenarios in UNEP's GEO-4 report (UNEP, 2007b) — a world where water and other services
are increasingly privatised, and ecosystem services turned into commodities by putting a price on them? The poorer
people in Europe, but especially in developing countries, might then suffer from not being able to purchase more
expensive energy, water and other goods and services, whereas the richer part of the world could more or less
continue their lifestyles, albeit in a somewhat more resource-efficient manner.
But what if more sustainable lifestyles become trendy and the norm? The 'Sustainability first' scenario of UNEP's
GEO‑4 report maps out a world where society groups promote slow food (as opposed to fast food, advocating for
example local food traditions), socially responsible investment and fair trade (UNEP, 2007b). In such a scenario, status
might become more connected to the latest fancy bike instead of the fastest car, and people might compete for the
lowest energy bill within their neighborhood.
22
The European environment | State and outlook 2010
Thematic assessment | Consumption and the environment
consumers. This approach can also be used for designing
policies directed at making consumption patterns more
sustainable.
There are relatively few environment-related
segmentation models, and many focus on a specific
behavioural domain such as car use (Sharp and Darnton,
2006). However, an interesting example is the United
Kingdom's assessment of the potential for different types
of people to change to greener behaviours (Defra, 2008).
Their model looks at ability to act, willingness to act, and
the potential to do more on key behaviours that would
lower their carbon footprint — and indicates which types
of policy intervention would be most effective within each
segment (Figure 3.1).
For example, people who are willing and able to do more
— in this model called positive greens, the concerned
consumers and the sideline supporters could be effectively
engaged through communications, community actions,
and targeting individual opinion leaders. Those who are
concerned about how others act — in this model called
cautious participants and waste watchers — would need
government leadership as well as social norms supporting
sustainable lifestyles to change. Those less willing to act
— typified as stalled starters and honestly disengaged —
Figure 3.1
could be encouraged through pricing policies, regulation
or choice editing (Defra, 2008).
In the United Kingdom, Defra (2008) has estimated the
following distribution of the population in the various
categories: positive greens 18 %; waste watchers 12 %;
concerned consumers 14 %; sideline supporters 14 %;
cautious participants 14 %; stalled starters 10 %; and
honestly disengaged 18 %.
The study concludes that a 'multiplicity of actions (is)
needed to support greener lifestyles, confirming the need
for packages of mutually supporting measures' (Defra,
2008). The segmentation is not aimed at developing
targeted policies for different sections of the populations,
but to enable the development of a range of policies that
'collectively will motivate a range of responses across
larger population groups' (PSI, 2006).
Understanding the motivations behind consumer
behaviour enables policy-makers to devise more effective
solutions, drawing on a range of policy instruments that
address different types of people and situations. Many of
these solutions will work most effectively when tailored
to those sectors of the economy that are the source of most
environmental pressures caused by consumption.
Segmented strategy, showing potential by segment and main emphasis for
interventions
Potential to
do more
Potential to do more, and how
High
Enable
Encourage
Engage
Exemplify
High potential
and willing
1: Positive
greens
3: Concerned
consumers
Enable
4: Sideline
supporteres
5: Cautious
participants
2: Waste
watchers
Low
Willing
to act
High
6: Stalled
startes
7: Honestly
disengaged
Encourage
Enable
Low potential and
unwilling
Low
Source: Defra, 2008.
The European environment | State and outlook 2010
23
Thematic assessment | Consumption and the environment
4 Food and drink
4.1
Trends in consumption
Eating and drinking, along with shelter, tend to dominate
household spending in poorer households and societies.
However in developed countries, as incomes increase,
absolute spending on food and drink tends to remain
fairly stable, and therefore represents a dwindling
proportion of incomes. Actual calorie intake is only
weakly correlated to income once it exceeds a certain
level (Danish EPA, 2004). In the past decade, European
expenditure on food and non‑alcoholic drinks increased
by only around 10 % in absolute terms (Eurostat,
2009) and fell from 14 to 12 % of total expenditure.
In comparison, food represents around 20 % of total
household expenditure in the poorest EU Member States
(EC, 2008).
Nevertheless, while total consumption of food in Europe
is relatively decoupled from income, the types of food
we eat and the way we eat and drink has changed with
increasing wealth, and this change is exacerbated by
falling household sizes, increasing globalisation of food
markets and tastes and reduced time devoted to preparing
food (EEA, 2005).
Some general trends in European food consumption are:
•
•
•
•
24
Replacement of beef and lamb in diets by pork and,
particularly, poultry across the EU as a whole (FAO,
2010), although beef consumption is growing in newer
Member States. This is due to a combination of factors
including price differences, a general trend towards
healthier food and the ease by which poultry can be
combined with pre-prepared foods (Danish EPA,
2004; Omann et al., 2007). This trend accelerated in
2008 due to increases in food prices, and total meat
consumption even dropped by 2.2 % in the EU‑27
compared to 2007 (EC, 2009a).
Increasing consumption of fruit by 11 % in the EU‑15
in 1990–2005 (FAO, 2010). This may be due to greater
availability and reduced prices of (imported) fruit.
Rise in the purchase of pre-prepared and frozen meals
and convenience foods due to smaller household sizes
and reducing time devoted to food preparation as more
women enter the labour market (Omann et al., 2007).
Increasing expenditure and frequency of eating
take‑away food and in restaurants (Omann et al.,
2007; Danish EPA, 2004).
The European environment | State and outlook 2010
•
•
A dramatic increase in quantities of imported food.
Meat imports to the EU‑15 increased by 120 %
between 1990 and 2007. Cereal imports increased by
83 %, frozen vegetables by 174 %, and bananas by
92 % over the same period (FAO, 2010).
A marked rise in the consumption of bottled
water in many European countries (IBWA, 2010).
Consumption in the EU was on average 105 litres per
person in 2009, varying from 16 litres in Finland to
189 litres in Italy (EFBW, 2010). Energy is used in the
manufacturing and transport of the bottles and many
are made from plastic derived from non‑renewable
resources, i.e. oil (EEA, 2009).
These trends have differing consequences for the
environmental impacts of eating and drinking. The
switch from beef to pork and poultry is likely to
have resulted in lower GHG emissions during food
production. The rise in processed, convenience and
frozen foods may have overall net negative effects
because of increased energy use during sale, distribution
and storage at home due to the increased need for
freezing, and from packaging waste. Increases in
imported foods may increase energy use and emissions
from long distance food transport. On the other
hand energy use and emissions from agriculture and
production may in some cases be lower, for example
imported Mediterranean field grown tomatoes to
northern European countries where local tomatoes
would be grown in greenhouses. Food imports also have
other benefits, including economic and social benefits in
the producing countries.
4.2
Life-cycle environmental
impacts of food and drink
The EEA and ETC/SCP (2010) have estimated the
pressures associated with the consumption of 31 key
product categories in nine EU Member States. If the
pressures caused by the product categories associated
with food and drink are summed, consumption of food
and drink is estimated to cause 15 % of GHG emissions,
37 % of acidifying emissions, 14 % of tropospheric ozone
precursors and 19 % of material resource use activated
by national consumption. Comparable results have been
found through life-cycle analysis, where food and drink
consumption was found to be responsible for around
Thematic assessment | Consumption and the environment
Figure 4.1 How the food and drink value chain impacts the environment
Resource inputs
Soil, land,
fertilisers
water, energy
Agricultural
production
and
distribution
Land take, soil
loss, pesticides,
GHGs, effluent,
acidification
Energy,
plastics, glass,
metals
Food
processing
and
packaging
Fossil fuels
Energy
Distribution
Retail
Storage
and
preparation
Food and
packaging
waste
Waste, GHGs
Food and
GHGs, air
packaging waste, pollutants
wastewater,
GHGs
Energy,
water
Energy,
water
Consumption
of
food and drink
Dishwashing
GHGs
waste water
Energy
Waste
management
Emissions to
air, soil and
water
Pressure outputs
Source:
Compiled by EEA-ETC/SCP.
20–30 % of environmental impacts, in most impact
categories caused by consumption in the EU. Impacts
analysed were abiotic resource depletion, acidification,
ecotoxicity, global warming, eutrophication, human
toxicity, ozone layer depletion, and photochemical
oxidation (JRC/IPTS, 2006).
dishwashing, and the generation of food and packaging
waste (EEA, 2005). At the household level, approximately
20 % of private electricity consumption is used for the
storage and preparation of food, including processing
heat — cookers — and mechanical energy, including
fridges and freezers (ETC/SCP, 2009).
Environmental impacts are caused during all stages
along the food product chain (Figure 4.1), but agricultural
production and to a lesser extent industrial processing
are responsible for the most significant impacts caused
by eating and drinking (EEA, 2005; ETC/SCP, 2009;
Foster et al., 2006). These include impacts from: energy,
water use and waste generation in agriculture and the
processing industry; the use of fertilisers and pesticides;
emissions from livestock; land use and transport; and
biodiversity loss from clearance of ecosystems to make
way for food and feed cultivation, and pollution of water
courses. However, agriculture can also have positive
environmental effects. For example, grazing animals often
play a role in protecting and maintaining biodiversity, and
well-managed grasslands serve as a carbon sink.
The carbon, material and water footprints of different
types of food and drink vary considerably. Figure 4.2
gives an indication of how footprints range between
different food types based on a number of representative
studies. It should be noted, however, that footprints
for the same food type vary significantly according
to the place and type of production (for example, the
data shown for meat in Figure 4.2 relate to industrial
production systems highly based on grain feed). Beef,
butter and cheese generally have higher footprints,
especially carbon and material footprints, while
vegetables, cereal products, potatoes and fruit such as
apples in season generally have much lower footprints.
With regard to water footprints, the environmental
impacts of a high footprint are of concern especially in
case of products from water-scarce regions and using
irrigation (for more information on the water footprint,
see the SOER 2010 water resources: quantity and flows
assessment (EEA, 2010a)).
The direct impacts of food consumption are lower in
magnitude and relate to travel for shopping, energy use
for cooking and cold storage, energy and water use for
The European environment | State and outlook 2010
25
Thematic assessment | Consumption and the environment
Figure 4.2
Carbon, material and water
footprint for different types of
food
Kg or 1 000 litres respectively
50
45
40
35
30
25
20
15
The majority of a number of key impacts from meat and
dairy products are caused by cattle and dairy farming
(Figure 4.3). Poultry and pig farming contribute generally
less across a range of key impact types per kg of meat
produced due in part to poultry and pigs often being
more efficient converters of plant energy into animal
energy and producers of lower methane emissions
(Garnett, 2009).
10
5
tt
er
ee
se
G
re
en
Po
ho
Ch rk
us
e
i
ve cke
n
ge
ta
bl
es
Ri
ce
M
Po
ilk
ta
W
to
he
es
at
an
Br
d
e
r
ad
Ap oo
t
pl
c
r
e
in ops
se
as
on
Ch
Be
Bu
ef
0
Carbon footprint (kg CO2-equivalent/kg)
Material input (kg/kg)
Water footprint (1000 litres/kg)
Source: Carbon: Angervall et al., 2008; Danish EPA, 2006;
Fritsch and Eberle, 2007; Hirschfeld et al., 2008;
Williams et al., 2006; Århus University, 2007; Material
input: Kotakorpi et al., 2008; Water: Water Footprint
Network, 2010.
Figure 4.3
The consumption of meat and dairy products is
responsible for the bulk of a number of key impacts
caused by eating and drinking and also for a
considerable share of overall impacts from consumption.
According to a study by the European Commission's
Joint Research Centre, it contributes 24 % of the overall
environmental impacts caused by total consumption in
the EU‑27, but accounts for only 6 % of total expenditure
(JRC/IPTS, 2008). The same study shows that in the
EU‑27 meat and dairy products contribute about 30–40 %
of aquatic and terrestrial eutrophication, 14 % of GHG
emissions, and 35 % of nature occupation caused by total
European consumption (JRC/IPTS, 2008).
Reductions in some environmental impacts could
potentially be gained through diets with a lower
consumption of meat and dairy products and to a
certain extent through shifts in diets from beef towards
chicken and pork. This latter partly depends on which
farming methods are substituted. Intensive livestock
farming in general uses considerable inputs of cereal
and soybean feeds, with chicken and pork farming in
Contribution from the meat and dairy value chain to environmental impacts
Acidification
Ecotoxicity, aquatic
Eutrophication, aquatic
Eutrophication, terrestrial
Global warming
Nature occupation
Photochemical ozone, vegetation
Respiratory inorganics
Respiratory organics
All impacts
0
10
20
30
40
50
60
70
80
90
Grain crops
Dairy farming
Pig farming
Cattle farming
Poultry farming
Food industry
Transport
Car driving for shopping
Electricity production
Remaining processes
Source: Joint Research Centre, Institute for Prospective Technological Studies (JRC/IPTS), © European Communities, 2008.
26
100
%
The European environment | State and outlook 2010
Thematic assessment | Consumption and the environment
particular requiring rich feeds. But considerable amounts
of soybean feeds are also used in intensive dairy and
beef production. Therefore, replacement of products
from intensive cattle farming with those from chicken or
pork farming with lower per kg impacts will in general
give environmental benefits, although substantial
improvement potentials also remain for intensive
pork and chicken farming in Europe (JRC/IPTS, 2008).
However, it is likely to have negative effects on animal
welfare.
On the other hand, extensive (i.e. low density, low input)
cattle and sheep farming can have positive effects on
biodiversity in upland and nutrient poor areas of Europe
which are unsuitable for other types of farming including
intensive cultivation. Extensive livestock farming forms
an essential element of high nature value (HNV) farming
and European biodiversity goals. A shift from beef to
pork and chicken could, therefore, also negatively impact
extensive cattle farming and potentially HNV farming in
general (European Forum on Nature Conservation and
Pastoralism, 2010; Garnett, 2009).
While higher availability of meat and dairy products has
led to better availability of nutrients in human diets, it
also has contributed to negative health effects (Box 2.2).
Lower consumption of animal fats, for example butter,
is generally in line with dietary recommendations for a
large part of the European population (JRC/IPTS, 2009).
Another key issue is that of food waste. Based on data
from Eurostat and national data, it has been estimated
that around 89 million tonnes or 181 kg per person of
food waste was generated in the EU‑27 in 2006, of which
42–43 % was from households, 39 % from manufacturing
and the rest from other sources including retailers,
wholesale and the food service sector, but excluding
agricultural waste. Per person generation of total food
waste varies between countries by a factor of more than
10, reflecting not only differences in the importance
of the food industry between countries, but also data
uncertainties (Biointelligence Service et al., 2010).
A recent study shows that in the United Kingdom an
estimated 137 kg/person or 25 % of food purchased by
households ends up as waste, of which nearly two-thirds
would have been avoidable — roughly split between
leftovers from meals and not using the food in time
(WRAP, 2009). Any reduction in avoidable food waste
should eventually lead to equivalent reductions in
impacts upstream from agricultural production.
A further major issue related to food consumption is the
overexploitation of fish stocks. In all, 88 % of EU stocks are
already fished beyond their maximum sustainable yield,
and for some, such as North Sea cod, the vast majority
are caught before they have reproduced (EC, 2009b; EEA,
2010b). EU‑27 fish and seafood imports rose by an average
of 4.2 % per year in the period 2000–2007 (Eurostat, 2008).
4.3
Food and drink outlooks and
scenarios
Key determinants of changing food consumption in
the EU over the next decade may include: food prices,
Common Agricultural Policy (CAP) reform, developments
in transport costs, competition with biofuels and
developments in global food demand, developments in
preferences driven by health concerns, and changes in food
culture.
Average crop prices during 2009–2018 are projected to be
much lower than their 2007–2008 average — the recent
peak — while meat prices are not expected to change
substantially. Crop and livestock productivity is expected
to increase, especially in Central and Eastern Europe
— provided that new technologies, infrastructures and
services are successfully adopted. Assuming a recovery
of the economy, increasing incomes and relatively stable
food prices, the major trend over the next ten years could
be shifting consumption patterns rather than markedly
increasing per person consumption volumes (OECD/FAO,
2009).
The European Commission projects that the marked
decline in meat consumption seen between 2007 and 2008
due to price increases may continue for a short while as
a result of reduced incomes during the economic crisis,
but will recover again in the mid-term. However, the
growth is likely to be in pork, and especially poultry
consumption in relation to beef that is expected to
decline, though by less than 1 %. Production of pork and
poultry in Europe is unlikely to keep up with increases in
demand and will increasingly be imported from outside
Europe. Demand for cheese is also expected to grow by
10 % between 2008 and 2015 (European Commission,
2009a).
The projected small decline in the consumption of beef is
likely to have some positive effects on a number of key
environmental impacts from cattle farming by reducing
nitrate pollution and methane emissions if intensive
beef farming is reduced. Effects on biodiversity and land
management may be negative, however, if the reductions
take place in the extensive beef farming sector rather than in
the intensive one. A rapid growth in poultry consumption
will have major implications for animal waste disposal and
for animal welfare if the growth takes place in the intensive
sector. A small but continuing growth in calories consumed
could also raise questions about the health of the European
population in the future, with increasing levels of obesity
(Danish EPA, 2004).
The European environment | State and outlook 2010
27
Thematic assessment | Consumption and the environment
4.4Responses
Reducing the environmental impacts related to the
consumption of food and drink is a major challenge that
requires efforts at all phases of the food value chain. The
majority of environmental impacts related to consumption
of food are from agricultural activities, including in
particular dairy farming, cattle farming and grain crops
production, and fisheries. Thus, targeting policies at
the source of impacts — the agricultural and fisheries
sector — is one of several options for reducing impacts.
However, such policies might sometimes conflict with free
trade and competitiveness concerns.
There are two main pieces of EU legislation specific to
agricultural food production and fisheries:
•
•
The 2003 reform of the EU Common Agricultural
Policy (CAP) included environmental goals and
developed the role farmers could play in managing
natural resources and contributing to landscape
conservation (EC, 2003). But it did not succeed
in introducing significant reductions of impacts
(EEA, 2010). The next reform, planned in 2013, may
possibly allow policymakers to address the challenges
of delivering sustainable and multifunctional
agriculture in the future.
The Common Fisheries Policy. A major reform
is foreseen in 2012 as current policies have not
succeeded to bring European fisheries and fish stocks
to a status of sustainability, to avoid over-fishing or to
stop the decline of marine biodiversity.
Impacts could also potentially be reduced by policies
targeting food processing or transportation. Another
option is policies aimed at the demand for foods linked
to heavy environmental burdens (Box 4.1). Many
EU Member States already have policies to promote
organic food or aimed at preventing food waste.
Recently, the European food industry launched
a Roundtable on Sustainable Consumption and
Production, with the involvement of major European
food producers and the European Commission, and
support from the EEA and UNEP (European Food SCP
Roundtable, 2010). This initiative already seems to have
raised awareness in the food industry, but it remains to
be seen whether it will result in reduced pressures from
food production.
Environmental impacts from dairy and meat farming
are being tackled in some countries through industry
initiatives, such as the United Kingdom's Milk Roadmap
(DEFRA, 2009) — a scheme based on voluntary pledges
from industry stakeholders.
However, the European Commission's Joint Research
Centre (JRC) has shown that technical abatement can only
cut the environmental impact from livestock production
by about 20 % (MacMillan and Durrant, 2009). The JRC
concludes that future reductions in impacts from meat and
dairy products would also require targeting the levels and
patterns of food consumption (JRC/IPTS, 2008).
A shift towards consumption of more products from
organic farming is also an option. But LCA-based
comparisons of organic and non‑organic production
show mixed results for different products (Williams
et al., 2006). Reduced impacts resulting from no inputs
of artificial fertilisers and reduced animal feed inputs are
Box 4.1 The role of retailers in sustainable consumption
Retailers are in a unique position at the heart of the food chain by providing the link between production and
consumption, and they can play a key role on the path towards sustainable consumption. Through their contact with
producers, retailers have the potential to encourage more sustainable production practices. Through their direct
contact with consumers, retailers have the potential to encourage more sustainable ways of living.
Today a growing number of retail organisations and producers are developing and implementing internal environmental
management schemes and sustainability strategies. While the initial focus of these are often on internal operations,
an increasing number of retailers are also seeking to green their upstream supply chains and reduce the downstream
impact of products by raising customer awareness and providing appropriate choices. However, there is still a great,
unharnessed potential for retailers to contribute to more sustainable consumption especially through focusing on
environmental hot-spots such as meat production and through promoting more sustainable and healthier choices.
A specific approach that is starting to receive attention is that of choice-editing, the practice of removing products
with significant environmental impacts from the shelves, or the placement and advertisement of more sustainable
alternatives.
The important role of retailers and their potential contribution to SCP was recognised by the EU Action Plan on
Sustainable Consumption and Production and Sustainable Industrial Policy (SCP Action Plan). Through the Plan in
2008, the European Commission launched the European Retailers Forum to promote sustainable consumption and
production through retailers.
Similarly the pivotal role of retailers in SCP is being recognised by national policymakers in Europe, who are
increasingly involving retailers through voluntary agreements and public-private partnerships.
28
The European environment | State and outlook 2010
Thematic assessment | Consumption and the environment
often offset by greater direct energy use and the use of
manure in organic farming. However, organic farming
has biodiversity and eco-toxicity benefits due to the lower
intensity of land use and a reduced use of pesticides, but
these are not well recorded by LCA methods. Moreover,
organic farming tends to preserve soils in the long term
and is being promoted through the European Action Plan
for Organic Food and Farming.
Nonetheless, organic farming is often, at least in the
short term, less productive per hectare than non‑organic
(Williams et al., 2006), and thus requires more land,
though these differences might reduce considerably when
viewed over a longer period (Mäder et al., 2002). All other
things being equal, a major shift to organic production
would mean either more biodiversity-rich land taken into
production or an increase in imports leading to increased
environmental impacts overseas. However, a significant
shift to organic farming without increased imports or
increased land under production could occur if the shift
to organic were accompanied by a complimentary shift
towards diets with a lower meat and dairy content and
therefore lower demand for land.
A larger share of consumption of fruit and vegetables
would have environmental benefits. The JRC recently
published a study investigating the environmental
implications of a switch to healthier diets in Europe.
Two of the three healthy diet scenarios investigated
included a reduction in the consumption of beef and
pork by ~ 60 % in favour of chicken and fish, and one of
these, the so‑called Mediterranean diet, also included
a 9 % reduction in the consumption of dairy products:
According to the JRC, a 100 % shift to this diet across the
EU‑27 would reduce the overall environmental impacts
related to food consumption by around 8 % (JRC/IPTS,
2009). The other two healthy diet scenarios resulted in
lower but still positive gains, though these gains reduced
somewhat when rebound effects were taken into account
(Box 3.1).
Shifting to seasonal locally-grown fruits and vegetables
would also in general lead to less environmental impacts,
in particular from transport, cooling and freezing.
The United Nations has supported a call to halve
food waste by 2025; researchers suggest this could be
achieved more quickly if businesses, governments and
the public work together (Lunqvist et al., 2008). There
are indications that the generation of food waste may be
exacerbated by quantity‑based marketing strategies such
as buy‑one‑get‑one-free offers. Finland had already banned
such promotions, and Belgium has considered the idea, but
the European Court of Justice recently ruled against such
bans (ECJ, 2009). The onus is therefore on retailers to find a
voluntarily solution. Civil society has an important role to
play in promoting voluntary sustainability initiatives among
retailers and encouraging consumers to support them.
The European environment | State and outlook 2010
29
Thematic assessment | Consumption and the environment
5Housing
5.1
Trends in consumption
(EC, 2010a). Space heating accounts for 67 % of household
energy consumption in the EU‑27, followed by water
heating and appliances/lighting (Odyssee database, 2010).
In this chapter, housing includes both the use of buildings
as shelter and living space for people and the construction
and demolition of buildings. In the use phase, the energy
consumption of households is an important source of
environmental impacts, but water use and materials
consumption, for example for furnishings and household
equipment, are also relevant.
There are large differences in final energy consumption
per person for space and water heating, cooking and
electricity in households across Europe (Figure 5.1). The
differences are influenced by many factors including
different consumption patterns, climate, energy efficiency
of dwellings, type of heating systems, and energy prices.
Direct and indirect CO2 emissions resulting from energy
use depend mainly on the fuels used for heating and the
national energy mix.
Energy consumption in buildings — for space heating,
water heating and use of electric appliances – is a
key cause of environmental impacts. Energy use in
buildings — including commercial and public buildings
— represents approximately 40 % of total final energy
consumption and 36 % of CO2 emissions in Europe
Figure 5.1
Final energy consumption per person in the EEA (EU‑27,
EFTA and Turkey) member countries increased by 3 %
Final household energy consumption per person in EEA member countries,
1990 and 2007
Gigajoule per person
100
90
80
70
60
50
40
30
20
10
M
Bu alt
lg a
a
Tu ria
rk
Po e
rt y
Ro ug
m al
an
i
Sp a
ai
Cy n
Sl pru
ov s
ak
Cr ia
o
Li at
th ia
ua
ni
a
It
G aly
re
ec
Po e
l
Sl an
ov d
H eni
u
a
N
et ng
he ar
rla y
Cz
n
ec E ds
h U–
Re 2
pu 7
b
Fr lic
U
an
ni
ce
te
d Lat
Ki vi
ng a
d
Ir om
el
a
Es nd
to
Sw nia
G ede
Sw erm n
itz an
er y
la
Au nd
st
Be ria
l
D giu
en m
m
a
N rk
or
w
Lu Fin ay
xe la
m nd
bo
Ic urg
el
an
d
0
Other energy types, 1990
Note:
Electricity, 1990
Other energy types, 2007
Iceland: 2006 instead of 2007.
Source: Eurostat energy statistics.
30
The European environment | State and outlook 2010
Electricity, 2007
Thematic assessment | Consumption and the environment
between 1990 and 2007. However, the increase was
reversed between 2005 and 2007 when it decreased by 9 %
in the EU‑27 and 7 % in the EEA member countries, partly
driven by rapidly increasing energy prices, although
energy efficiency policies might also have contributed to
this effect. Household electricity consumption per person
increased more rapidly: on average by more than 30 %
between 1990 and 2007 in the EEA member countries, in
spite of increasing prices in many countries (Figure 5.1).
Consumption more than doubled in Cyprus, Estonia,
Malta, Portugal, Romania, Spain and Turkey in the same
period. Since 2005, however, electricity consumption per
person in the EU‑27 has stabilised (EEA energy indicators
ENER22, 2010).
Rising energy consumption for space heating is mainly
driven by an increase in housing space per person. The
average area of a dwelling unit rose from 86 to 92 m2 in
the EU‑15 between 1990 and 2007 (EEA energy indicator
ENER22, 2010), while the number of people per household
decreased from 2.8 to 2.4 (Odyssee database, 2010), giving
a 20 % rise in floor space per person and an increase in the
number of households. In the EU‑12 countries, the average
floor area per dwelling increased even more rapidly from
62 m2 to 71 m2. These trends have largely offset the gains
made in the energy efficiency of buildings (Figure 5.2).
While the energy efficiency of some types of appliances
has improved significantly over the past two decades
(Figure 5.3) these product improvements have not been
able to keep up with increasing ownership and use of
appliances. As a result, overall electricity consumption
per dwelling for lighting and appliances has gone up,
illustrating the rebound effect (Box 3.1).
The main reasons behind the increase in electricity
consumption are the steady increases in the numbers
of appliances — including TV sets and dishwashers
owned by households (Figure 5.3), consumer electronics
and information and communication equipment —
and a rising demand for air conditioning and cooling
technologies, especially in the Mediterranean countries
(JRC/IE, 2009). Part of the increase in ownership is due
to increasing numbers of households and increasing
disposable income. In addition, consumer electronics and
information and communication equipment tend to have
a high rate of standby energy consumption — responsible
for around 6 % of all electricity in households (JRC/IE, 2009).
Figure 5.3
Trends in appliance energy
efficiency and ownership,
EU‑27
Index 1990 = 1
Figure 5.2
Trends in heating energy
consumption and energy
efficiency of housing, EU‑27
2.6
2.4
2.2
Index 1990 = 1
2.0
1.3
1.8
1.6
1.2
1.4
1.2
1.1
1.0
1.0
0.8
6
20
0
4
2
20
0
20
0
0
8
20
0
19
9
6
19
9
4
19
9
19
9
0
19
9
0.8
2
0.6
0.9
Ownership — dish washer
Ownership — TV
20
06
20
04
20
02
20
00
19
98
19
96
19
94
19
92
19
90
0.7
Growth in floor area of housing (19 EU Member States)
Total energy consumption of housing stock for
space heating
Energy consumption per dwelling for space heating
Energy consumption per m2 for space heating
Source: Odyssee database, 2010.
Ownership — washing machine
Electricity consumption per dwelling for lighting
and appliances
Specific energy consumption — TV
Specific energy consumption — washing machine
Specific energy consumption — dish washer
Source: Odyssee database, 2010.
The European environment | State and outlook 2010
31
Thematic assessment | Consumption and the environment
Housebuilding, especially diffuse residential sprawl, and
related infrastructure are responsible for a high share of
land-take in Europe. Total annual land-take for artificial
areas has increased to 0.61 % (percentage of initial year) in
the period 2000 to 2006 compared to 0.57 % in the previous
decade, but land-take for housing has slowed slightly. Most
of the new artificial areas were formerly agricultural land
and forests, although re-utilisation of developed urban
land — contaminated and non‑contaminated brownfield
sites — has increased considerably, a sign of better
management of land development patterns (ETC/LUSI,
based on Corine Land Cover data, see the SOER 2010 land
use assessment (EEA, 2010a)).
5.2
Other studies vary on the proportions of key environmental
impacts that can be allocated to housing and household
equipment, but there is general consensus that this area of
consumption is one of the most important EU contributors
to global environmental impacts (JRC/IPTS, 2006). The
majority of environmental pressures are caused by energy
use while the houses are in use, while around one fifth are
caused during their construction (EEA and ETC/SCP, 2010;
JRC/IPTS, 2008).
Around one third of total material use in Europe is
for housing — mainly construction material — with
consequent negative impacts on land and biodiversity
from mining and waste disposal. Although construction
and demolition waste in the EU is increasingly recycled
(see the SOER 2010 material resources and waste
assessment (EEA, 2010b)), the resulting savings only
substitute a fraction of construction resource use.
For example, in Denmark where more than 90 % of
construction and demolition waste is recycled, this still
only contributes around 6 % of the materials used in new
construction (calculated based on data from the Danish
Statistics Office).
Life-cycle environmental
impacts of housing
Housing has multiple impacts on the environment
throughout its life-cycle (Figure 5.4). The EEA has
estimated the pressures associated with the consumption
of 31 key product categories in nine EU Member States. If
the pressures caused by the product categories associated
with housing and infrastructures are added up —
including furnishing and household appliances — use
of housing is estimated to cause 38 % of GHG emissions,
22 % of acidifying emissions, 32 % of tropospheric ozone
precursors and 38 % of material resource use activated by
national consumption (EEA and ETC/SCP, 2010).
Figure 5.4
Land sealing — making land impermeable — is
also a significant impact of housing and associated
infrastructure like residential roads and parking. Sealed
land looses its soil functions and cannot be used for other
functions like agriculture, is detrimental to biodiversity
How the housing value chain impacts the environment
Resource inputs
Land, minerals,
metals, energy
Minerals,
metals, energy,
wood, plastics
Raw material
extraction
and processing
(cement)
Land take, toxins
and emissions to
soil, air and water
Production of
windows,
bricks,
tiles, girders
GHGs, air
pollutant, solid
and liquid waste
Land, minerals
components,
energy
Energy, water
Dwelling
construction
Use of
32
Energy
Maintenance
Demolition
GHGs,
air pollutant,
solid and
liquid waste
Demolition waste,
emissions to air,
soil and water
housing
Land take, soil
sealing,
construction
waste, GHGs
GHGs, air
pollutants,
wastewater,
waste
Pressure outputs
Source:
Minerals,
components,
energy
Compiled by EEA-ETC/SCP.
The European environment | State and outlook 2010
Thematic assessment | Consumption and the environment
and can increase the risk of flooding (see the SOER 2010
land use assessment (EEA, 2010a), urban environment
assessment (EEA, 2010c), soil assessment (EEA, 2010d) and
biodiversity assessment (EEA, 2010e)).
With regard to water consumption, an average of around
100–200 litres of tap water are used per person per day
in most European countries, but if the amount of water
embedded in products such as food, paper and cotton
clothes is included, water use is often 10–20 times higher
(EEA, 2010f).
Dwelling type has important consequences for energy use,
material use and soil sealing. For example, single family
houses typically use 1.5 to 2 times more energy per m2 than
multi-family buildings, and have a higher demand for land
per unit of floor area and material use than multi‑family
and high-rise buildings (JRC/IPTS, 2008). Moreover,
low density housing reduces the economic viability and
technical efficiency of district heating and public transport
systems. However, single-family houses make up 57 % of
homes in the 19 EEA member countries for which data are
available (calculated based on Odyssee data, 2009).
5.3
Housing outlooks and scenarios
The past trend in the EU towards fewer people per
household is likely to continue until 2020 (Jiang and
O'Neill, 2009), leading to a growth in demand for living
space per person. In addition to the projected slight growth
in population, these factors are expected to increase the
total area of dwelling space, and along with it associated
demand for heating/cooling energy and construction
materials unless rising energy and material efficiency
offsets these trends. However, the economic downturn adds
uncertainty to this development as the housing market has
been heavily affected, and if incomes grow more slowly or
even decline, the ability to buy houses and apartments is
also likely to be affected.
The International Energy Agency (2009) expects that
ownership and use of consumer electronics, including
televisions and information and communication equipment,
will continue to increase rapidly in Europe. Equipment for
the reception, decoding and interactive processing of digital
broadcasting will also increase with the gradual switch to
such broadcasting (JRC/IE, 2009). As a result, the electricity
consumption of households for consumer electronics and
information and communication technologies is expected
to increase substantially (IEA, 2009) unless more ambitious
policy measures are introduced to increase energy
efficiency.
The reference scenario of the European Commission's
PRIMES model, which takes into account the effect of
energy efficiency policies in place and the anticipated
effects of the climate and energy package adopted in 2009,
projects a growth of final energy demand for electrical
appliances and lighting in the residential sector of 2.2 %
annually in the period 2010 to 2020, whereas final energy
demand for heating and cooling is expected to stabilise
over the same period (based on data published in a
summarised form in EC, 2010b).
5.4Responses
Houses and other buildings have a huge potential for
significant energy saving (EEA, 2008). The EU and
individual Member States have introduced a number of
policies to tap this potential:
•
•
•
•
•
•
the Energy Efficiency Action Plan (EEAP) (EC, 2006);
the Eco-Design of Energy-Related Products Directive
(2009/125/EC);
the Energy Performance of Buildings Directive (EPBD)
(2010/31/EU);
the Energy End-use Efficiency and Energy Services
Directive (ESD) (2006/32/EC);
the Energy Labelling Directive (2010/30/EU);
the renewed agreement on Energy Star endorsement
label use in Europe.
The Eco-Design of Energy-Related Products
Directive (Ecodesign Directive) sets a framework for
setting minimum environmental performance and
energy‑efficiency requirements for energy-related
products, with new standards recently adopted for
refrigerators, freezers, TV sets, set-top boxes, and
lighting. The directive was extended in 2009 to products
that can influence energy use such as windows. Although
environmental aspects other than energy efficiency are
covered by the directive, it has in practice been used
mainly to set energy-efficiency performance criteria.
Thus there is a future opportunity to steer product
design into a more sustainable direction, for example
requirements on repairability or upgrading in order to
prevent waste.
The directive is supplemented by the recently
revised Energy Labelling Directive, and the EU
Eco‑label Regulation (EC, 2009). However, resultant
energy‑efficiency improvements in appliances from these
directives have, to date, been largely offset by increasing
ownership and use (Figure 5.3).
The Energy Performance of Buildings Directive requires
Member States to apply minimum requirements on the
energy performance of new and existing buildings when
undergoing major renovation, and technical building
systems. All new buildings shall fulfil a near zero-energy
standard by the end of 2020, and public buildings by end
of 2018. The directive is expected to result in reductions
The European environment | State and outlook 2010
33
Thematic assessment | Consumption and the environment
of 160–210 Mt/year CO2 across the EU by 2020, 4–5 %
of EU total CO2 emissions (EC, 2008). However,
substantial potential still remains for further reductions
in energy use in buildings in areas yet to be addressed
by policy. For example, if renovation and refurbishment
of windows, wall insulation and roof insulation were
always performed to the cost-optimal energy efficiency
level, GHG emissions could be reduced by a further
25–30 % with payback periods of 10–15 years (JRC/IPTS,
2009).
In addition, the EU's Lead Markets Initiative (EC, 2007),
especially the initiatives on sustainable construction and
renewable energies, can help to realise eco-innovation
potentials in housing. Actions include, for example,
establishing a network of public authorities in charge of
construction and the widening of European construction
design codes to include sustainability aspects.
Making dwellings more energy-efficient, generally
requires to make them tighter against cold or hot air
from the outside, a measure that might be in conflict
with providing fresh air for the dwellers and prevent
in-door air pollution or mould. However, good planning
and implementation of such measures combined with
information for dwellers about correct airing of highly
energy-efficient buildings can prevent health problems.
Driven by front-running stakeholders from business
and civil society, the technology and designs for
zero‑energy and very low energy housing already exist,
including super-insulated building envelopes, passive
solar heating, cooling and lighting, ventilation and
shower drain heat exchangers, solar water heaters and
photovoltaic panels on roofs. Several hundred houses
have already been built across Europe that meet the
passive house standard for heating demand that is factor
4–5 below normal new built houses (Harvey, 2009).
Other examples of implementation of these technologies
include the solar settlement in Freiburg (Heinze and
Voss, 2009) and the BedZed development in London
(Bioregional, 2009). More ambitious policy targets,
economic incentives, green public procurement and
regulation in Europe could ensure a more rapid
development and uptake of this kind of housing. The
United Kingdom, for example, has a target for all new
housing to be zero carbon by 2016 (ETC/SCP, 2010b)
backed by an exemption from stamp duty land tax
(HM Treasury, 2007).
Household water consumption can be effectively
influenced by water pricing and metering, and the
introduction of metering in households is reaching a
high level of implementation in EU Member States (EEA,
2009) as required by the Water Framework Directive
(EC, 2010c). Water metering and charging by volume has
been shown to influence household behaviour (OECD,
2010). In eastern Europe, water demand has declined
by 40 % since the early 1990s as a result of higher water
prices, and consumption has also decreased in western
Europe, albeit at a slower pace (EEA, 2010f; EEA, 2009).
Figure 5.5 illustrates that household water consumption
has decreased along with increasing water prices in
Spain and Estonia. In Spain, reduction of water use has
been supported by regulatory developments including
regulation on watering gardens and filling of private
swimming pools.
So overall there is substantial potential to improve the
picture for housing through uptake of existing policies
and coupling them with good urban design and spatial
planning. Doing so can deliver a wide range of benefits
through significantly reducing the environmental
impacts of housing on land-take, biodiversity, soil sealing,
materials, water and energy consumption and people's
overall well-being.
Box 5.1 Smart metering
Smart metering of electricity, space heating and gas consumption can help citizens to better control their energy
consumption in the home. A smart meter shows the energy use in the dwelling in a more accessible way, helping
citizens to identify the appliances which use the most energy, and also shows the consequences of energy behaviour,
raising people's awareness of the structure of their energy consumption. The EU's energy market liberalisation package
requires 80% of households to be equipped with smart meters by 2020. Finland, Italy and Sweden have already widely
introduced smart meters for electricity (ESMA, 2010).
Experience from pilot projects in the United States of America shows that smart metering can be made more effective
if combined with smart communication: telling households how efficient they are relative to their neighbours in similar
houses, accompanied by tailored recommendations on how to use less energy led to a reduction of 2–5 % of energy
use whereas smart meters alone had only a limited effect (von Renssen, 2009). An experiment where 'smileys'
were used to communicate above/below average energy consumption showed a much larger effect compared to
information-only communication (Schultz et al., 2007).
34
The European environment | State and outlook 2010
Thematic assessment | Consumption and the environment
Figure 5.5
Water pricing and household water use in Spain, 2000–2008, and
Estonia, 1992–2007
Spain
Estonia
Litre
180
Euro
Litre
1.4
200
EEK
12
180
160
1.2
140
1.0
120
100
0.8
80
0.6
10
160
140
8
120
100
60
0.4
40
6
80
4
60
40
Note:
0
07
20
04
20
01
20
19
98
0
95
08
20
07
20
06
20
05
20
04
20
03
20
02
20
20
01
0.0
19
0
2
20
92
20
19
0.2
Litre per person per day
Litre per person per day
Euro per m3
Average water price of 1 m3 per capita, EEK
Spain: Prices are calculated as average unit values for water supply and sewage services; in Estonia: water use for human
consumption only.
Source: National Statistics Institute of Spain, 2010 (left figure); Estonian Environment Information Centre, 2010 (right figure).
The European environment | State and outlook 2010
35
Thematic assessment | Consumption and the environment
6Mobility
Figure 6.1
In this section, mobility includes life‑cycle based
environmental pressures from passenger transport. This
means pressures from the provision of transport services
for passengers — railways, metro, buses, airlines,
taxis, ferries and cruise services; transport equipment
purchased by households — cars, motor cycles, etc.;
extraction and delivery of fuel for private transport as
well as direct environmental pressures from the use of
private vehicles — exhaust emissions. Freight transport
is not included except for the transport of transport
equipment and fuel.
Not all transport modes show similar growth. While
road and particularly air transport demand has
increased significantly, use of trains, buses and coaches
in the EU‑27 has increased at a much slower rate
(Figure 6.1). Cars remain the dominant mode, with
a 72 % share of passenger kilometres in the EU‑27,
excluding Cyprus and Malta, in 2007. Bus and coach
travel have decreased slightly from a share of more
than 9 % in 1995 to 8 % in 2007. Intra‑EU air transport
increased to a 9 % share of total passenger kilometres in
2007, while trains, trams and metros now account for 7 %
of passenger kilometres (EEA, 2010a).
Interestingly, while the use of rail has remained stable
overall, high‑speed trains are among the transport
modes that have recently seen the highest growth rates,
with passenger kilometres increasing by 180 % in the
EU‑27 between 1995 and 2007 (EC, 2009a) driven by
the expansion of the high‑speed network. The share of
high‑speed transport of total rail passenger transport
kilometres in the EU‑27 increased to 23.3% in 2007
(EC, 2009a). In some cases, such as France, the expansion
of the high‑speed network has been successful in
reducing the demand for air travel (EEA, 2008).
36
The European environment | State and outlook 2010
%
5
4
3
2
1
0
ra
l
Note: *
a
Se
*
Ai
r
ac
h
co
an
d
Ra
ilw
ay
–1
O
ve
Europeans are moving further and faster than ever
before. The number of kilometres travelled by people
in the 32 EEA member countries increased by 20 %
between 1995 and 2007 or roughly 1.5 % per year
over the past decade, slightly below growth in GDP,
and although there are variations between countries,
passenger kilometres continue to grow overall across all
EEA member countries (EEA, 2010a).
Average annual growth rates
for passenger transport,
EU‑27, 1995–2007
Bu
s
Trends in mobility demand and
modal split
lp
a
tr sse
an n
sp ge
Pa
or r
ss
t
en
ge
r
Tr
ca
am
rs
an
d
m
et
ro
6.1
* Sea and Air only include intra‑EU traffic. Estimates
are made by the European Commission based on
airport‑to‑airport data collected under Regulation
(EC) 437/2003 and port‑to‑port data collected under
Council Directive 95/64/EC.
Source: EC, 2009a.
The demand for mobility and the choice of transport
mode is driven by a variety of distinct factors
including socio‑economic ones, income and prices;
socio‑demographic, family size and structure; spatial
and infrastructural, population density, distance between
home and work place; and cultural factors, image and
status (EEA, 2008).
One important driver of increased mobility demand is the
increase in car ownership. In the EU‑27, this increased by
35 % in the period 1990–2007 (EC, 2009a) and average car
ownership in EEA member countries in 2008 was 419 cars
per 1 000 inhabitants (EEA, 2010b). A further driver is
the expansion of transport infrastructure, particularly
motorways. In the period 1990–2005 total transport
networks in the EU‑27 grew by 3 %, while the length of
motorways increased by 47 % (Eurostat, 2009).
Thematic assessment | Consumption and the environment
Figure 6.2
Indexed consumer prices * for
passenger transport, EU‑27,
1998–2009
Index 1998 = 1.00
2.00
1.75
The price of different transport modes is another
determining factor for mode choice, and differential
pricing, for example through taxation and fees, can be an
effective tool for encouraging a shift to more sustainable
forms of transport. While the cost of all modes of
transport has increased significantly over the past decade
(Figure 6.2) the prices of air travel and the purchase
of vehicles have increased less than those of public
transport.
1.50
6.2
1.25
1.00
Note:
09
20
07
20
05
20
03
20
01
20
19
99
0.75
Fuel prices
Railway
Road
Air
Ferries
Purchase of vehicles
* Indexed consumer prices are calculated as
harmonised indices of consumer prices (HICPs), a set
of EU consumer price indices calculated according to a
harmonised approach and a single set of definitions.
Source: Eurostat, 2010.
Figure 6.3
Life‑cycle environmental
impacts of mobility
Transport gives rise to various environmental impacts
including climate change, air pollution, noise pollution,
resource consumption, generation of waste, and habitat
fragmentation and soil sealing as a result of the building
of roads, airports, railways, etc., leading to losses of
biodiversity (Figure 6.3).
Increasing travel, especially by modes of transport
with high GHG intensity such as private cars and
aviation — means that GHG emissions from passenger
transport continue to grow (Figure 6.4). According to
the LIFE EC4MACS (2010) project, direct emissions of
How the mobility value chain impacts the environment
Resource inputs
Land, minerals,
metals, energy
Infrastructure
development
Land
fragmentation,
soil sealing,
GHGs,
wastewater
Source:
Energy,
metals,
plastics, glass
Vehicle and
fleet
production
GHGs, air
pollutant,
solid and
liquid waste
Compiled by EEA‑ETC/SCP.
Fossil fuels,
land
Fuel
extraction
and
processing
GHGs, air
pollutants, fuel
waste
Transport fuels,
electricity
Use of
transport
GHGs, air
pollutants,
noise
Energy, metals,
plastics, glass
Vehicle and
infrastructure
maintenance
Solid and liquid
waste, waste oil
Energy
End of life
vehicles
Emissions to
air, soil and
water
Pressure outputs
Source: Compiled by EEA‑ETC/SCP.
The European environment | State and outlook 2010
37
Thematic assessment | Consumption and the environment
Emissions from ferries and aviation only include
intra‑EU traffic. CO2 emissions from rail transport are
too low to be seen on the graph. The reason is that
only emissions from the use phase are covered —
indirect emissions such as from electricity production
for electric trains are excluded.
Source: LIFE EC4MACS, 2010.
CO2 from passenger transport in the EU‑27, excluding
the production and waste management of vehicles, and
international air and maritime transport, increased by
6 % between 2000 and 2005. Emissions from the transport
sector as a whole now account for just below 20 % of total
GHG emissions across the EEA‑32 countries (EEA, 2010).
The EEA and ETC/SCP (2010) have estimated the
pressures associated with the consumption of 31 key
product categories in nine EU Member States. If the
pressures caused by the product categories associated
with mobility are added up, personal mobility is
estimated to cause 20 % of GHG emissions, 19 %
of acidifying emissions, 32 % of troposheric ozone
precursors and 15 % of material resource use activated
by national consumption. These environmental pressures
include a rough estimate of pressures arising from
international sea and air transport. Comparable results
were found using life cycle approaches: mobility was
found to be responsible for 15–25 % of the environmental
impacts in most impact categories caused by European
consumption (JRC/IPTS, 2006).
While the fuel efficiency of the average car has
been improved continuously in recent decades,
the improvements have been more than offset by
38
The European environment | State and outlook 2010
Figure 6.5
Growth in private car travel
versus fuel efficiency in
EU‑27, 1990–2007
Index 1990 = 1.0
1.6
1.5
1.4
1.3
1.2
1.1
1.0
0.9
0.8
0.7
0.6
06
Ferries
20
Rail
04
Aviation
Motorcycles
20
2005
Passenger cars
02
2000
20
Notes: Buses
00
0
20
100
98
200
19
300
96
400
Unlike GHG emissions, emissions of pollutants from
transport that affect local air quality have continued to
decline across EEA member countries, but passenger
cars are still among the top six individual polluting
sources for NOX, particulate matter (PM10, PM2.5),
carbon monoxide (CO) and non methane volatile
organic compounds (NMVOC). As a result, ambient
concentrations of nitrogen dioxide (NO2) still exceed 2010
limit values in many cities around Europe (EEA, 2010a).
Transport, and especially road transport, is also the major
source of noise pollution in the largest cities in the EU‑27,
with 47 million people being affected by noise levels that
are considered dangerous for public health (see also the
SOER 2010 air pollution assessment (EEA, 2010d) and
urban environment assessment (EEA, 2010e)).
19
500
94
600
19
700
92
800
Direct emissions from the combustion of fuels make up
about 77 % of total life‑cycle based GHG emissions from
passenger car transport. The remainder can be allocated
to fuel production and supply, 13 %; vehicle production
and maintenance, 9 %; and disposal and end of life, < 1 %
(JRC/IPTS, 2008).
19
Million tonnes CO2
growing demand for travel by private car in the EU‑27
(Figure 6.5).
90
CO2 emissions from passenger
transport (use phase only),
EU‑27, 2000 and 2005
19
Figure 6.4
Stock of cars
Total car km travelled
Total fuel consumption of private cars
Specific fuel consumption of average car (litres/km)
Source: Odyssee database, 2010.
Thematic assessment | Consumption and the environment
6.3
Mobility outlooks and scenarios
Current GHG emissions caused by transport are already
close to what we can emit from all our consumption
activities by 2050 if Europe is to meet the strategic objective
adopted by the European Council of limiting the global
average temperature increase to not more than 2 °C above
pre‑industrial levels (Council, 2007 and ETC/SCP, 2009).
A further 30 % increase in passenger transport demand
between 2010 and 2030 is projected based on a
business‑as‑usual scenario (EEA, 2010), and demand is
growing fastest for modes of transport that emit higher
levels of CO2 (Figure 6.6). Past experience suggests that
fuel efficiency and technology improvements are unlikely
to develop at sufficient rates to offset the projected
increases in personal transport and consequent GHG
emissions (Box 3.1). Demand management, therefore,
appears to be an indispensable measure alongside modal
shifts if GHG emissions from mobility are to be reduced.
6.4Responses
Some examples of positive developments related to
mobility are being seen, including the rapidly expanding
high‑speed train system in some European countries, the
renaissance of research into the technical and commercial
Figure 6.6
aspects of electric vehicles, the potential abatement of
GHG emissions from aviation by its integration into the
European emission trading scheme, the European clean
air programme to tackle air pollution, and noise mapping.
However, it is clear that further action is needed to reduce
the environmental footprint of European mobility.
Strategies for reducing the environmental impacts of
transport include (BUND et al., 2008 and Dalkmann and
Brannigan, 2007):
•
avoid: reduce overall transport demand by intelligent
urban and regional design — compact cities and a
polycentric regional development;
shift: improve system efficiency by promoting a
shift from less to more sustainable modes, such as
from air to rail or from car to public transport or
non‑motorised modes; or car sharing rather than
individual ownership;
improve: technological improvement of vehicles and
promotion of cleaner vehicles.
•
•
Policies aimed at managing the environmental pressures
of mobility should tackle all these three areas to be
successful. A number of policy instruments have been
used: regulation such as speed limits or fuel‑efficiency
standards, economic instruments like taxation on cars
and fuels, congestion charges or increased parking fees,
Trends and outlooks in passenger transport demand for the different modes of
transport, EU‑25, 1990–2030
Gpkm
%
10 000
9 000
1.2
5.2
9.7
0.7
0.7
0.6
7.6
9.0
10.9
12.2
7.5
6.9
7.0
7.5
0.8
8 000
7 000
72.7
75.4
4 000
75.2
72.3
5 000
74.1
6 000
3 000
Public road transport
Note: Private cars and motorcycles
Rail
Aviation
7.0
30
20
20
20
8.0
10
20
00
20
90
19
20
30
20
25
20
20
20
15
20
10
20
05
20
00
19
95
19
90
0
8.8
11.6
1 000
7.3
2 000
Inland navigation
Figures for aviation and inland navigation only include intra‑EU air and sea travels.
Source: EEA, 2010c. Figures after 2005 are based on projections.
The European environment | State and outlook 2010
39
Thematic assessment | Consumption and the environment
information‑based instruments like information on fuel
consumption and CO2 emissions of new cars, voluntary
agreements with industry including voluntary targets
on fuel efficiency and education such as eco‑driving
campaigns (ETC/SCP, 2009 and Böhler et al., 2009).
Cycling City, Cycling Town could be used to promote
cycling in place of motorised transport.
These measures are most effective when applied in
an appropriate mix, complementing each other and
targeting relevant actors, rather than used on their own.
Furthermore, as the drivers of demand for transport
are often outside the transport policy area, for example
in spatial patterns, urban design, and production and
distribution systems, transport policy must be integrated
with other policies, particularly within urban and regional
planning and health planning (EEA, 2007).
Integrating sustainable mobility concepts into urban
planning is also crucial. For example, the EC's 2009
Urban Mobility Action Plan (EC, 2009b) develops
measures identified in the European Green Paper
on Urban Transport (EC, 2007). It highlights the
responsibility of local, regional and national authorities
in developing urban mobility policies that have the
promotion of sustainable transport at their core.
One theme in the plan, The optimisation of urban
mobility, describes the importance of affordable and
family‑friendly public transport solutions to promote
reduced car‑dependence.
Some economic instruments used to discourage car use
are included in Box 6.1. However, if such instruments are
to be effective, they must be combined with investment
in viable alternatives such as effective public transport
systems and bicycle lanes, thereby making sustainable
alternatives attractive. Bicycle action plans such as those
implemented in Denmark and Germany (TRM, 2007 and
BMVBS, 2002) and city‑bike systems and investments
in cycling infrastructure such as the United Kingdom's
A study carried out for the European Commission
concludes that GHG emissions from transport in the
EU could be reduced by 89 % by 2050 compared with
1990 levels if all the options currently available are
embraced with bold actions. To achieve such reductions,
non‑technical measures, including better spatial planning
and use of economic instruments to internalise the
externalities of transport as well as removal of harmful
subsidies, etc. are essential (EC, 2010).
Box 6.1 Use of economic instruments in the area of transport
Pricing of passenger transport can focus on different issues: ownership and size of cars (vehicle tax), fuel consumption
(energy tax or green taxes), and the use of transport infrastructure (road‑pricing, congestion charging, parking fees)
(Böhler et al., 2009).
Feebate systems that combine a fee and a rebate have been introduced in several EU Member States. Examples
include the French Bonus‑Malus scheme and the Danish differentiated registration levy. These systems introduce
CO2 emission rates in the registration of cars combining elements of both a fee and a rebate thus providing a price
incentive for cars with lower CO2 emissions. A recent study (JRC/IPTS, 2009) found that the feebate instrument could
benefit both the environment and the economy.
Green taxes on fuel consumption have already been implemented in several European countries either as fuel taxes or
as carbon taxes. In the United Kingdom and Germany the environmental benefits included reductions in fuel use and
emissions, and vehicle kilometres were found to be below expectations (Green Fiscal Commission, 2009; UBA, 2005).
Congestion charges, in combination with improved public transport, have proved to be very effective in reducing
impacts, but to date have had only very limited application. The London congestion charge introduced in 2003 has led
to a reduction in traffic by 18 %, which accounts for 150 000 tonnes of CO2‑reduction per year (Siemens AG, 2009).
Similarly, the Stockholm congestion charge, introduced in 2006, resulted in a 25 % reduction in traffic during its
6‑month trial period (Eliasson, 2007; Pike, 2010). A study for Switzerland showed that a nationwide kilometre‑based
charge could reduce traffic by 4–7 % (ARE, 2007).
40
The European environment | State and outlook 2010
Thematic assessment | Consumption and the environment
7Tourism
7.1
Trends in consumption
people with time and money for tourist trips has generally
increased in Europe, especially among the elderly, singles,
and couples without children (Eurostat, 2008).
Europe is both a key tourist destination — six EU Member
States are in the world's top ten destinations, with France
heading the list — and a key source of tourists taking
trips within Europe and to many other parts of the world
(UNWTO, 2010). The EU tourism industry is of high
economic importance, generating more than 5 % of EU GDP
and employing around 5.2 % of the total labour force, and
these figures double if indirect effects are included (EC,
2010). This section focuses, where data allow, on Europeans
as tourists.
There are indications that tourism is spreading uncontrolled
in some areas, for example the Greek islands (EEA, 2010b)
and Croatia (UNEP/MAP/BLUEPLAN, 2008). In addition,
second homes are becoming more and more attractive. For
example, in France, the building of second homes in coastal
municipalities has increased by a factor of 2.5, compared
to 1.7 for regular residential houses in the past 40 years
(INSEE, 2009).
Leisure trips are becoming more frequent, and shorter
(Eurostat, 2008; OECD, 2010), although the economic crisis
may have temporarily curbed the growth in tourism.
The spread of low‑cost air travel has been an important
driver of the growth in the number of trips and the trend
towards more frequent and shorter stays. The number of
Figure 7.1
7.2
Life‑cycle environmental
impacts of tourism
Tourism has multiple environmental impacts inside and
outside Europe, including from travel to destinations,
How the tourism value chain impacts the environment
Resource inputs
Land, materials,
energy
Holiday
infrastructure
development
Landtake, loss of
coastline, soil
sealing, GHGs,
wastewater
Energy,
materials
Vehicle and
fleet
production
GHGs, air
pollutants,
waste
Transport
fuels, land
Energy,
water
Travel to
and from
destination
Land
fragmentation,
GHGs, air
pollutants
Holiday stay
GHGs, air pollutants,
waste, waste water,
pressures on
biodiversity
Energy,
materials
Infrastructure
maintenance
and demolition
Construction and
demolition
waste, emissions
to air, soil and
water
Pressure outputs
Source: Compiled by EEA‑ETC/SCP.
The European environment | State and outlook 2010
41
Thematic assessment | Consumption and the environment
the building of facilities such as hotels, second homes or
tourism infrastructure and activities at the destinations
(Figure 7.1). Life‑cycle assessment studies on tourism are
sparse and often related to a specific hotel or destination
(De Camillis et al., 2010).
holiday homes, marinas, skiing facilities, and other
attractions, is an important driver of land take and
degradation, especially in coastal areas. Together with
other tourism‑related pressures, such as over‑visiting
vulnerable habitats, disturbance of wildlife, sale of
endangered species to tourists, trampling of dune
environments, this contributes to the loss of habitats for
wildlife (UNEP/MAP/BLUEPLAN, 2008; see also EEA,
2010e). Tourism based on observation of marine wildlife
is both an opportunity and a threat to biodiversity if the
intensity of such activities is not controlled (UNEP/MAP/
BLUEPLAN, 2008).
Transport connected to tourism accounts for about 8 %
of GHG emissions in the EU‑15 (Working Group on
Sustainable Tourism, 2007) and the choice of transport
mode to and from the destination is by far the most
influential factor in overall GHG emissions from tourism, as
illustrated by the emissions associated with different types
of typical holiday trips of German tourists (Figure 7.2).
In the EU‑15, most trips are made by car, followed by air.
Car travel accounts for about 41 % of GHG emissions from
tourism (Working Group on Sustainable Tourism, 2007),
and trips made by plane account for about 55 % despite
only being used for 20 % of trips (UNWTO and UNEP,
2008). In the Mediterranean countries, the share of tourists
arriving by plane increased from 23 % to 40 % between 1988
and 2006 (UNEP/MAP‑Plan Bleu, 2009).
The growth in tourism is proving to be especially
environmentally damaging in some mass tourist
destinations such as the Mediterranean coasts and islands
and the Alps. And as mass tourism spreads further to
the coastal areas of the Southern Baltic Sea, Brittany
and the Black Sea, similar environmental degradation is
occurring and can be expected to continue (EEA, 2006).
In the Alps, winter tourism is growing rapidly, often
extended by artificial snow‑making, which is not only
energy‑intensive but has high water demand in a season
of low water levels, thus putting pressures on lakes, rivers
and groundwater, and enhances flood risks when the snow
melts (EEA, 2009b).
Some tourist activities, such as swimming and golf, are
responsible for heavy water use, often in regions with
few water resources. In sensitive regions such as the
Mediterranean or the Alps, tourism is thus an important
cause of water shortages and the degradation of water
supplies (EEA, 2009a; EEA, 2010c, 2010d). In order to meet
high tourist water demands, in some cases drinking water
is even transported over long distances by ship, for example
to some of the Greek islands (EEA, 2010b).
7.3
Before the economic recession, total tourist travel was
forecast to grow by 122 % between 2000 and 2020, with a
related increase in CO2 emissions from European tourism
of 85 % (Simpson et al., 2008). Tourist air travel is expected
Although highly dependent on environmental quality,
tourism, through the construction of hotels, second/
Figure 7.2
Tourism outlooks and scenarios
GHG emissions for some types of holiday trips from Germany, CO2‑equivalent
per person per day
Staycation (14 days, 4 persons)
Family holiday Ruegen, Germany (car, 14 days, 4 persons)
Wellness holiday Allgaeu, Germany (train, 10 days, 3 persons)
Culture holiday, South Tyrol (bus, 5 days, 2 persons)
Skiing holiday, Austria (car, 7 days, 1 person)
Beach holiday, Majorca (plane, 14 days, 3 persons)
Mediterranean cruise (plane, 7 days, 2 persons)
All-inclusive holiday Mexico (plane, 14 days, 4 persons)
0
200
400
CO2-equivalent per person per day
Travel
Note: Staycation means a holiday at home with holiday activities locally.
Source: WWF, 2009.
42
The European environment | State and outlook 2010
Accomodation
Food
600
On-location activities
Thematic assessment | Consumption and the environment
Box 7.1 What if? Effects of climate change on tourism and possible future scenarios
Climate change is expected to affect major tourism areas in Europe. For example, water demand for tourism is likely
to increase with climate change, with warmer and longer summers driving up demand and worsening water stress,
especially in the popular Mediterranean destinations (see also EEA, 2010b).
Winter tourism areas such as those in the Alps might face shorter snow seasons (EEA, 2009b). What if winter tourism
regions react by using more artificial snow‑making to keep winter sports enthusiasts coming, leading to increased
energy and water consumption? Ski resorts might also opt to build large‑scale indoor winter sports facilities with the
associated need for cooling energy, similar to the ones that already exist in several European countries, thereby adding
further to climate change.
But tourist resorts in the Alps might also opt for withdrawing from winter tourism, compensating by developing
summer tourism, promoting more sustainable options, including agri‑tourism, eco‑labelled tourist accommodation and
investing in the maintenance of the Alpine ecosystems keeping them attractive for tourists.
to continue to increase, though the growth trend for air
travel, including tourism, slowed during 2006–2007 (EEA,
2010a).
The face of tourism is changing: it is expected that
experimental tourism — which includes eco‑tourism,
nature, heritage, cultural, and soft adventure tourism, as
well as sub‑sectors such as rural and community tourism
— is among the sectors that will grow most quickly over
the next two decades (TIES, 2006).
7.4Responses
European Commission communications include:
a renewed EU tourism policy: towards a stronger
partnership for European tourism (EC, 2006); an
agenda for a sustainable and competitive European
tourism (EC, 2007) and Europe, the world's No 1 tourist
destination — a new political framework for tourism in
Europe (EC, 2010). The 2010 Communication proposes
a number of actions to promote the development of
sustainable, responsible and high‑quality tourism,
including sustainability indicators for destinations, a
charter for sustainable and responsible tourism, a prize for
tourism businesses following the charter, and a strategy
for sustainable coastal and marine tourism. At the same
time, the communication proposes actions to remove
barriers to tourism growth, and mobilise Community
instruments and programmes to support tourism. The
European Destinations of Excellence (EDEN) project is
a voluntary initiative of the European Commission to
promote sustainable tourism.
Improved waste and water management and energy
efficiency in tourist destinations can help to reduce the
environmental impacts of tourism. There are some,
mostly voluntary, initiatives, such as the Blue Flag for
European beaches and the European eco‑label for tourist
accommodation and campsite services, as well as many
national and regional environmental certificates and
labels for tourism businesses (Hamele and Eckardt, 2006;
De Camillis, 2010) but mainstreaming these approaches
remains a challenge. Several EU‑funded schemes
support the development of sustainable tourism, such
as stakeholder collaboration in the tourist industry
(TRAVELIFE), benchmarking for sustainable tourism
(TOURBENCH), and cooperation of environmental labels
in the area of tourism (VISIT) (De Camillis, 2010).
Use of the European Environment Management and
Auditing Scheme (EMAS) certification is still quite
limited for tourism with only 230 hotels and other
accommodation in the EU having being certified
(EMAS‑register, 2010). Sustainability principles have been
included in many national and regional tourism strategies,
with Hungary having developed a dedicated eco‑tourism
strategy (EC, 2010; Hungary tourism report, 2008), and
a number of activities to encourage sustainable tourism
are being taken at national and local levels, including
tourist carrying‑capacity assessments, managing access
to vulnerable areas to protect wildlife, and programmes
aimed at greening tourist accommodation (UNEP/
MAP/BLUEPLAN, 2008). However, assessments of
whether these activities are successful in reducing the
environmental impacts of tourism are lacking.
Little has been done to tackle the most important source of
environmental pressures: air travel and car‑based tourism.
However, in July 2008 the EU agreed to bring the aviation
sector into the EU Emissions Trading Scheme (ETS) system
from 2012 (Directive 2008/101/EC), while the International
Air Transport Association (IATA) announced that the
air‑line industry is committed to achieving carbon-neutral
growth from 2020 globally (IATA, 2009).
Governments at all levels and tourism businesses
increasingly recognise that investing in ecosystems that
underpin regional attractiveness is essential for sustaining
tourism, and tourism‑related local taxes, entrance fees or
concession licence fees to national protected nature areas,
etc. might be a viable option to finance the maintenance
The European environment | State and outlook 2010
43
Thematic assessment | Consumption and the environment
of ecosystems. Tourism could play a vital role in halting
the loss of biodiversity if managed sustainably, building
on, maintaining and restoring the ecosystems that it
relies on and building stewardship for protected areas
(Lefèvre and McCool, 2008). Natural heritage areas can
serve as learning laboratories, where tourists can learn
about biodiversity and how to protect it. At the same
time, the United Nation's World Tourism Organization
promotes sustainable tourism as a tool to alleviate poverty
(UNWTO, 2004).
•
The Marrakech Process Task Force on Sustainable Tourism
has developed a number of policy recommendations that
highlight the responsibility of all stakeholders (ITF‑SDT,
2009). Recommendations include:
•
•
Overall, there are many initiatives in place in Europe and
globally, but in sum the package of measures is not as
robust and effective in addressing consumption impacts
on the environment as those for other consumption areas
such as food and drink, housing and mobility.
•
44
•
investments in public infrastructure related to tourism
or investments in private tourism businesses should
estimate their social and environmental impacts and
adopt economic measures to compensate for and
offset unavoidable impacts;
corporations should adopt corporate social and
environmental responsibility (CSER) principles in
their tourism investments;
guidelines for the behaviour of tourists at destinations
should be promoted using networks, media and other
communication channels;
governments and businesses should set baseline
and measurable targets, review progress and report
progress towards the achievement of sustainable
tourism objectives.
governments at all levels are recommended to
integrate sustainable tourism planning into national
and regional development plans;
financing from national and international
organisations (public and private) dealing with
The European environment | State and outlook 2010
Thematic assessment | Consumption and the environment
8 Concluding reflections: consumption,
environmental priorities and policies
The SOER 2010 synthesis (EEA, 2010a) identifies four
future environmental priorities in Europe to address the
identified links between risks and increased uncertainties
across the world:
•
•
•
•
implementing and strengthening current
environmental policies;
dedicated management of natural capital and
ecosystem services;
coherent integration of environmental considerations
across the many policy domains; and
a greening of the economy.
This chapter takes, as its starting point, these four
priorities and provides a perspective on the role of
consumption within them. It does so by using the analyses
of the previous chapters to discuss options and potential
obstacles.
Finally, the chapter considers that public authorities
at the EU, national and local levels are responsible for
deciding on and implementing a policy framework
and policy instruments. However, they cannot ensure
more environmentally sustainable consumption
without business and citizens playing an active and
complementary role in a triangle of change (Figure 8.1).
8.1
Consumption and current
environmental policies
A broad range of policies, environment‑related or not,
set the framework for consumption patterns, including,
for example, the EU Common Agricultural Policy
(CAP), EU transport policies, the Cohesion Policy, and
trade policies. All these influence the relative prices and
availability of different goods and services.
The focus of EU environmental policies on sustainable
consumption and production has gradually evolved over
recent decades from a focus mainly on cleaner production,
through sustainable products to a more holistic approach
to sustainable consumption and production.
The overall EU policy framework dedicated to addressing
the environmental impacts of consumption is the EU
Action Plan on Sustainable Consumption and Production
and Sustainable Industrial Policy (EC, 2008a). It seeks
to improve the supply, and stimulate demand for,
sustainable products and services. This includes the
strengthening and extension of the Eco‑design Directive,
the EU Eco‑label and Energy Label Directives, and Green
Public Procurement (Box 8.1). The EU Action Plan thus
mainly makes use of regulatory, information‑based and
voluntary instruments.
At the national level, at least 15 EU Member States have
adopted national SCP strategies either as stand‑alone
overarching SCP strategies or action plans — the Czech
Republic, Finland, Poland and the United Kingdom — or
as a key theme within national sustainable development
strategies — Austria, Belgium, Denmark, Finland,
France, Hungary, Italy, Malta, the Netherlands, Romania
and Sweden (EEA, 2010; Watson et al., 2009 and Adell
et al., 2009). There is a great potential in sharing good
practices from the design and implementation of such
policies.
Policies in the EU and in individual EEA member
countries have, in most cases, focused on products, by
promoting the supply of more sustainable products and
encouraging consumers to buy these through the use of
labelling or other information‑based instruments (Berg,
2007; Tukker et al., 2008; Rubik et al., 2009). In addition,
at national and local levels, economic instruments are
increasingly being used particularly for influencing
energy and water consumption, mobility behaviour and
waste (Table 8.1).
Research shows that policy implementation using a single
type of instrument alone often has limited impact. Using a
complementary mix of various types of policy instruments
addressing different groups of actors is likely to increase
the effectiveness of policy implementation in the field
of SCP (OECD, 2010; Rubik et al., 2009; Jackson, 2005;
Jackson and Michaelis, 2003).
Labelling has, in a few cases, proved effective, for
instance in the case of electrical appliances for which
energy efficiency labels have helped drive significant
improvements over the past decade. In addition,
well‑designed consumer campaigns can help raise
awareness and contribute to influencing behaviour,
especially if campaigns are linked to other instruments
and particularly in areas where awareness levels are low.
A recent OECD study found that in addition to the key
The European environment | State and outlook 2010
45
Thematic assessment | Consumption and the environment
Table 8.1
Examples of sustainable consumption policy instruments in place at EU and
national levels
Policy instrument
EU level examples
National and local examples
Economic instruments
Energy Taxation Directive
Energy and fuel taxes, emission‑based car
taxation, water fees, subsidies for installation of
renewable energy systems and energy‑saving
measures in buildings, traffic congestion
charges, deposit‑refund schemes
Vignettes for Heavy Good Vehicles
The EU Emissions Trading Scheme
Regulatory
instruments and
standards
The EU Ecodesign Directive on
energy‑related products, several
waste‑related directives aiming at enhancing
recycling, and the EU RoHS Directive.
Regulatory requirements for energy performance
of buildings (e.g. the German Federal Ordinance
on Energy Saving)
Voluntary agreements
The EU Retail Forum, the European Food
SCP Roundtable and the Communication
on Green Public Procurement; the EU‑Asia
partnership on Sustainable Consumption
and Production (SWITCH Programme), the
European Destinations of Excellence (EDEN)
project to promote sustainable tourism
Public‑private partnerships, for example the
Austrian Sustainability Seal, the British
Red/Green Calculator, the German Sustainable
Retail Initiative or the French retailers'
commitments with regard to sustainable
development.
Information‑based
instruments
The European Ecolabel Regulation (including
its revision), the EU Organic food label and
the Energy Label including its extension to
more products, the Control Climate Change
campaign, and the Buying Green Handbook
Numerous guidelines and portals, for example,
Topten (Switzerland) and topprodukte.at
(Austria). Campaigns include Love Food, Hate
Waste (the United Kingdom), Et ton mindre
(Denmark) or Faisons vite, ça chauffe Energy
Campaign (France).
Note: Additional examples of sustainable consumption policies can be found in pilot SCP policy factsheets for six European
countries developed by the EEA and the ETC/SCP (2009).
Source:
Based on ETC/SCP and EEA, 2009; ETC/RWM and EEA, 2007 and Watson et al., 2009.
role played by economic instruments, information to
consumers and education have a complementary role to
play in inducing changes on the demand side (OECD,
2010).
However, as discussed in Chapter 3, raising
environmental awareness alone is often not an effective
approach for reaching all consumers (OECD, 2010). In
general regulatory and economic instruments have a
higher impact than softer informative ones (Tukker et al.,
2008; Rubik et al., 2009; Jackson, 2005). Overall, current
policies are rather incremental than transformative
(WEF, 2010a).
8.2
Consumption and management
of natural capital and
ecosystem services
Sound management of natural capital and ecosystem
services requires, inter alia, increased resource efficiency
in production as well as in consumption (EEA, 2010a).
Consumers and public authorities in Europe consume
resources directly, for example when eating or drinking,
building or renovating houses, and indirectly through the
resources used in the life‑cycles of the goods and services
they use. Thus, efficiency in consumption is an essential
part of increasing the overall resource efficiency within
society with the aim of better management of our natural
46
The European environment | State and outlook 2010
capital — water, land, biodiversity and soil, and ecosystem
services.
Increasing the resource efficiency of consumption can be
achieved either through eco‑improvements in products
or through changes in consumption patterns, both within
— switching from car to bicycles and walking — and
between consumption categories — spending less on
mobility and more on recreation and culture.
The SOER 2010 synthesis (EEA, 2010a) recognises that
an ecosystem‑based approach is essential for managing
the demands for resources in Europe. Through
the increase in imports, European consumption is
increasingly linked to ecosystems in the rest of the world,
as shown in Chapter 2. Policies directed at making
European consumption more sustainable, together with
international cooperation on the better management of
ecosystems, can therefore complement policies directed
at preserving natural capital and ecosystem services in
Europe.
Policies and initiatives to provide information on
ecosystem and other lifecycle aspects of consumption in
Europe have expanded in scope and recognition in recent
years, although we have to recognise that information is
not an effective instrument for all types of consumers,
as argued in Chapter 3. Examples of such initiatives
are the Forest Stewardship Council and the Marine
Thematic assessment | Consumption and the environment
Stewardship Council, recent draft legislation to prevent
illegally‑logged timber and timber‑based products
from entering the EU market, and other supply‑chain
initiatives.
In Chapter 2, it was shown that the environmental
pressures and material resource intensities per euro
spent varied considerably for different consumption
categories. Consumption of food and drink, mobility and
housing have the highest pressures and material resource
use per euro spent. Since these consumption categories
also make up considerable parts of overall European
consumption, they are the areas with the highest
potential in terms of reducing environmental pressures
caused by consumption patterns.
8.3
Consumption and
integration of environmental
considerations across policy
domains
policy domains, include sustainable transport policy,
policies to promote corporate social responsibility (CSR),
integration of sustainable consumption in education
at all levels, agri‑environmental policy, and spatial
planning.
Many sustainable consumption policies are fully
coherent with targets and policies in other areas. For
example, the EU Energy Label Directives and the
Eco‑design Directive contribute directly to meeting
EU climate change and energy targets. And policies to
limit fuel use in cars and encourage a shift to public
transport contribute to reducing our dependence on
fossil fuels and meeting climate change and air pollution
objectives and targets.
However, there are also cases where policies in
specific sectors are not fully coherent with sustainable
consumption policies or objectives. One example is the
Common Fisheries Policy (CFP), which has been found to
cause significant negative environmental impacts.
The SOER 2010 synthesis (EEA, 2010a) concludes
that where environmental pressures correspond to
multiple sources and economic activities — including
consumption — there is a need to ensure coherence
in the way we tackle the challenges. It identifies
consumption, in particular housing, food and mobility
as significant areas to address. The other clusters are
territorial cohesion, resource efficiency and ecosystem
management; agriculture, forestry, maritime and green
infrastructure; and sustainable production, intellectual
property rights, trade and aid.
In the future, it is of the utmost importance to ensure that
policies addressing sustainable consumption and policies
in other areas are coherent and mutually supportive.
Research into innovative approaches to SCP
policy‑making has shown the emergence in European
academic and policy circles of new systems thinking
about the dynamics of innovation and entrepreneurship
for sustainable consumption and production. At the
heart of this is a recognition of the systemic nature of
new, long‑term, global sustainability challenges such
as climate change, which in turn require transitions in
the systems that fulfil key societal needs like mobility,
shelter, food and energy (Geels et al., 2008; Tukker et al.,
2008). However, innovative system‑oriented policy
instruments do not fit easily into existing institutional
and departmental frameworks.
8.4
Sustainable consumption is, by its nature, a broad
field touching policy areas such as environment,
climate change, energy, economy, industry, agriculture,
transport, education and health. Tackling unsustainable
consumption will require cooperation across these
areas to deliver coherent, cost‑effective sustainable
consumption policies. Examples of policy fields relevant
to achieving more sustainable consumption, which
could benefit from a close cooperation across traditional
Measuring progress is key to achieving a successful
transition to more sustainable consumption. The EEA and
its European Topic Centre for Sustainable Consumption
and Production (ETC/SCP) have developed a framework
of indicators for reporting on progress in SCP in Europe
(ETC/SCP, 2010).
The role of consumption in
greening the economy
As consumption and production are the two main
pillars of the economy, making consumption more
environmentally friendly is vital if we are to move the
economy on to a more sustainable footing. An integrated
approach that targets both the supply and the demand
side, should be taken in policy interventions.
The United Kingdom's Sustainable Consumption
Roundtable (2006) suggests that there is a need for a
mix of complementary policy responses that enable,
encourage, exemplify and engage people, businesses and
public authorities in what they call the 4 Es:
•
•
•
encourages, including through the tax system, reward
schemes, penalties and enforcement;
enables, for example through giving information,
education, providing facilities and infrastructures and
removing barriers;
engages, through community action, media
campaigns, networks, etc.;
The European environment | State and outlook 2010
47
Thematic assessment | Consumption and the environment
•
exemplifies, by leading by example and achieving
consistency in policies.
In practice, encouraging, enabling, engaging and
exemplifying sustainable consumption more effectively
will require intelligent and innovative policy packages
that mix different complementary policy instruments
— regulation, economic instruments, information and
awareness‑raising, voluntary agreements and investments
in infrastructure (Rubik et al., 2009; Berg, 2007;
Jackson and Michaelis, 2003; Sustainable Consumption
Roundtable, 2006).
Such an approach is necessary to tackle the rebound
effect and enhance policy coherence. The main objective
should be to make sustainable alternatives available,
affordable and attractive as well as to make consumers
aware of them. Connected to this is the need to develop
social norms and societal values that support sustainable
lifestyles. This work has begun in the research community
but needs to be translated into concrete policy initiatives.
Public authorities, which are responsible for 16 % of all
European consumption (Chapter 1) can play a leading role
through environmentally sustainable procurement and
thus contribute to an increase in resource efficiency and
setting an example for consumers and business (Box 8.1).
A major reason that consumption and production is
negatively affecting the environment and causing overuse
of resources is that the costs of environmental and resource
degradation to society are not fully reflected in the prices of
goods and services. Thus, many goods are relatively cheap
even though they cause major harm to the environment,
ecosystems or even human health. And goods and services
that are less harmful or benign according to environmental,
resource and even societal criteria are often more expensive
as they are more costly to produce.
Environmental fiscal reform through the use of economic
instruments aims to better integrate such external effects
in the prices of goods and services through the use of
economic instruments — removing subsidies for activities
that have high external effects as well as financially
supporting activities that have no or very low external
effects.
The rationale of the environmental fiscal reform approach
is not to increase the overall tax burden of an economy but
to shift it in a revenue‑neutral manner from taxes levied
on economic functions, such as labour, personal income
tax, and capital, corporate income tax, to taxes levied on
environmental pressures and natural resource use as well
as reforming environmentally harmful subsidies. The
redistribution of tax burdens across the economy would
provide appropriate signals to consumers and producers
and lead to a better functioning of markets and increased
welfare, as it moves society to a more sustainable
development path (EC, 2010b; Ekins and Speck, 2011;
Andersen and Ekins, 2009; EEA, 2005).
Box 8.1 Green public procurement
Green Public Procurement (GPP) means that public authorities and services take account of environmental factors
when procuring products, services or works. Its merits often include not only direct savings and reducing the ecological
footprint of the public sector, but also:
• helping to strengthen markets for green(er) products and services and stimulate environmental innovation;
• providing long‑term economic savings, particularly where products consume large amounts of resources over their
lifetime;
• contributing to changing societal norms, leading by example;
• potentially creating green jobs and reducing social costs via reduced environmental impacts.
In 2003, the European Commission recommended that Member States adopt national action plans on GPP by the
end of 2006. To date, 20 Member States have adopted such plans: Belgium, Cyprus, the Czech Republic, Denmark,
Finland, France, Germany, Italy, Latvia, Lithuania, Luxembourg, Malta, the Netherlands, Poland, Portugal, Slovakia,
Slovenia, Spain, Sweden, and the United Kingdom (EC, 2010a; REC, 2008). Three further Member States are in
the process of adopting plans — Austria, Hungary and Romania — and four are in the process of preparing them —
Bulgaria, Ireland, Estonia and Greece (EC, 2010a).
A 2008 study for the European Commission (PWC, 2008) demonstrates that there are seven front runners (Austria,
Germany, Denmark, Finland, the Netherlands, Sweden and the United Kingdom) implementing GPP at a rapid rate.
They had, on average, 55 % of the total number of contracts in 2006/2007, representing 45 % of the total value, in
line with GPP requirements in ten priority sectors.
A new impetus has been given to GPP by the publication of the EU's Communication on Public Procurement for a Better
Environment (EC, 2008b) which has been followed by the development of GPP criteria, in close cooperation with all
stakeholders. As of August 2010, GPP criteria had been developed for 18 product groups.
In addition to public authorities, private companies also have great purchasing potential and there is significant
potential for stimulating private companies to incorporate green demands in their dealings with subcontractors.
48
The European environment | State and outlook 2010
Thematic assessment | Consumption and the environment
A combination of stringent carbon reduction targets, and
the need for a number of European governments to increase
revenues from taxation has led to a resurgence of interest
in carbon/energy taxation and environmental fiscal reform
with Denmark, Ireland and Sweden all either introducing
new or redesigning existing environmental taxes in 2009.
In recent decades, we have seen many policies that have
improved the environmental sustainability of production
in Europe mainly through regulations and the setting
of standards, and to some extent economic instruments
including taxes on CO2 emissions; wastewater treatment;
use of sand, gravel and stone; and landfill.
Economic instruments are used in European countries to
some extent to create incentives for behavioural changes to
more sustainable consumption patterns (OECD/EEA, 2010).
Instruments aimed at the provision of household services
— user charges for water, sanitation and waste — or
transport — fuel taxes and congestion charging — are used
in many countries. However, few countries have developed
more ambitious demand‑side policies incentivising lifestyle
changes through the introduction of environmental fiscal
reform, shifting taxes from labour to resource use and
environmental pressures.
As the SOER 2010 synthesis (EEA, 2010a) argues, the
evidence for the benefits of environmental fiscal reform,
including environmental benefits, employment gains,
stimulus to eco‑innovation and more efficient tax systems,
has grown in recent years.
8.5
The triangle of change — the
role of different actors on the
road to greening the economy
Examples of business responses related to the supply
of more sustainable products and services include
eco‑design, cleaner production and sustainable
supply‑chain management. Examples of business
responses related to increasing the demand for sustainable
products and services include environmentally sustainable
corporate procurement, eco‑labelling, green marketing
and choice editing.
The transition to sustainable goods and services also
involves changes to the business models from the current
focus on material throughput to a focus on for instance
the creation of values and welfare, with sustainable
entrepreneurship and innovation playing a key role.
One example of such a change is moving away from
offering a product to offering a service, the so‑called
product‑service systems (WEF, 2010a). Examples of such
business models includes movie rentals, leasing of white
goods, photocopiers, etc. and car‑sharing schemes in which
a company invites several individuals to pay to get access
to the same car at different times. Product‑service systems
can potentially reduce the overall life‑cycle environmental
impacts of products and there is thus a great potential to
expand such innovative business models to other products,
such as PCs, TVs, mobile phones, and do‑it‑yourself tools.
Part of the business sector acknowledges the need for
a transition to sustainable consumption, and many
businesses and business associations have launched
initiatives related to sustainable consumption. One
example is the World Business Council on Sustainable
Figure 8.1
The analyses made throughout this assessment and
the arguments presented in this section suggest that
governments have a crucial role in providing the
framework to make consumption more sustainable.
However, although governments can enable this change,
citizens and business also need to play an important role
and have to take considerable action.
The triangle of change (Figure 8.1) is based on the
recognition that neither businesses nor people nor
policymakers can solve the problems alone. Rather
they must work together, each having their own role to
play (UK Sustainable Consumption Roundtable, 2006).
The hope that green consumers or green businesses
alone will save the day is unlikely to lead to sustainable
consumption. In addition to creating a policy framework
for sustainable consumption, governments themselves
can play a leading role by building partnerships and
showing the way forward, for example through providing
sustainable spatial design and infrastructure, and green
public procurement (Box 8.1) (Tukker et al., 2008).
Triangle of change
Create a policy
framework that enables
and engages
sustainable consumption
by businesses and people
and plays a leading role
in the transition
towards SCP
Public
authorities
Business
Provide goods and services
that are profitable and
sustainable and
develop new sustainable
business models
Source:
People and
communities
Make sustainable
consumption and
behavioural decisions in
an enabling framework
provided by
public authorities
EEA, based on UK Sustainable Consumption
Roundtable, 2006.
The European environment | State and outlook 2010
49
Thematic assessment | Consumption and the environment
Development, another is the World Economic Forum's
Sustainable Consumption Initiative in which a
cross‑industry group of companies and a network
of sustainable consumption experts are developing
practical ideas and new forms of collaboration
putting sustainability at the heart of business models
(WEF, 2010b).
in Europe. Public authorities at all levels — including at
the EU level, national governments and local governments
— are taking action towards putting better frameworks
in place and implementing policies towards sustainable
consumption. However, the policy area of sustainable
consumption is still in its infancy and many options
remain completely unexplored.
The central position of retailers in the product chain
provides an opportunity for them to play a key role on the
path towards sustainable consumption. More research into
what authorities can do to stimulate action by retailers
towards SCP, both through supply chain management and
choice editing, would be an important first step in this
direction.
As shown in this assessment, there is huge potential for
reducing environmental impacts in Europe and other
regions of the world through changing private and
public consumption patterns in Europe. Such changes
could be instigated through policy packages that
include legislation, taxes on environmentally harmful
consumption, voluntary instruments with business
and citizens, information‑based instruments, including
awareness‑raising campaigns and labels. Together they
would provide a necessary and effective supplement
to the efforts to improve technologies and regulate
environmental impacts from production in Europe.
Some citizens — either as individuals or through
community‑based initiatives, consumer organisations
and NGOs — have acted independently, playing a role
as pioneers and agents of change in normalising and
mainstreaming sustainable ways of living. Examples
include the Transition Towns movement, the Co‑housing
Community and the Alliance of Climate‑friendly
Settlements in Hungary. However, it is crucial to recognise
that placing the responsibility on individuals to make
voluntary decisions in isolation is unlikely to bring about
sufficient widespread changes in behaviour rapidly
enough.
Thus, as illustrated above, some businesses and citizens
are taking action towards more sustainable consumption
50
The European environment | State and outlook 2010
The assessment also shows the systemic nature of
the environmental impacts from consumption (and
production) and the many common avenues for achieving
sustainable consumption and production. Both reflections
argue strongly for transformative responses that start
from the natural environment and the resources and
services it provides for our well‑being, and linking much
better existing actions so as to deliver timely, effective
and cost‑efficient improvements in times of economic and
financial crises.
Thematic assessment | Consumption and the environment
References
1Introduction
EC, 2008. Communication from the Commission to the
European Parliament, the Council, the European Economic
and Social Committee and the Committee of the Regions
on the Sustainable Consumption and Production and
Sustainable Industrial Policy Action Plan. COM(2008) 397
final.
Eurostat, 2010b. Government final consumption
expenditures, current prices. http://epp.eurostat.ec.europa.
eu/portal/page/portal/product_details/dataset?p_product_
code=TEINA030 (accessed 21 September 2010).
EC, 2010. Communication from the Commission, Europe
2020: A strategy for Smart, Sustainable and Inclusive
Growth. COM(2010) 2020. http://ec.europa.eu/eu2020/pdf/
COMPLET%20EN%20BARROSO%20%20%20007%20-%20
Europe%202020%20-%20EN%20version.pdf (accessed 3
March 2010).
Girod, B. and de Haan, P., 2009. 'GHG reduction potential of
changes in consumption patterns and higher quality levels
from Swiss household consumption survey', Energy Policy
37(12) 5 650–5 661.
EEA, 2006. The changing faces of Europe's coastal areas.
EEA Report No 6/2006. European Environment Agency.
EEA, 2009a. Regional climate change and adaptation. The Alps
facing the challenge of changing water resources. EEA report No
8/2009. European Environment Agency.
EEA, 2009b. Water resources across Europe — confronting
water scarcity and drought. EEA Report No 2/2009. European
Environment Agency.
EEA, 2010a. The European environment — state and
outlook 2010: synthesis. European Environment Agency,
Copenhagen.
EEA, 2010b. The European environment — state and outlook
2010: material resources and waste. European Environment
Agency, Copenhagen.
EEA, 2010c. The European environment — state and outlook
2010: assessment of global megatrends. European Environment
Agency, Copenhagen.
ETC/SCP, 2009. Environmental Pressures from European
Consumption and Production. European Topic Centre for
Sustainable Consumption and Production Working Paper
1/2009. http://scp.eionet.europa.eu/publications/working%20
paper%20namea2009 (accessed 21 September 2010).
Eurostat, 2010a. Private final consumption, current prices.
http://epp.eurostat.ec.europa.eu/portal/page/portal/
product_details/dataset?p_product_code=TEINA020
(accessed 21 September 2010).
FAO, 2009. State of the World's Forests 2009. Food and
Agriculture Organisation of the United Nations, Rome.
Hertwich, E., 2008. 'Consumption and the Rebound Effect:
An Industrial Ecology Perspective', Journal of Industrial
Ecology, 9(1–2) 85–98. http://onlinelibrary.wiley.com/
doi/10.1162/1088198054084635/pdf (accessed 20 September
2010).
JRC/IPTS, 2006. Environmental impacts of products (EIPRO).
Analysis of the life cycle environmental impacts related to
the total final consumption of the EU-25. EUR 22284 EN.
Institute for Prospective Technological Studies, Sevilla.
http://ec.europa.eu/environment/ipp/pdf/eipro_report.pdf
(accessed 21 September 2010).
Nijdam, D. S. and H. Wilting, 2003. Milieudruk consumptie in
beeld. [A view on environmental pressure on consumption.]
RIVM rapport 7714040004. National Institute for Public
Health and the Environment (RIVM), Bilthoven, the
Netherlands.
Schade, C. and Pimental, D., 2010. 'Population crash:
prospects for famine in the twenty-first century'
Environment, Development and Sustainability 12 (2), 245–262.
Swedish EPA, 2010. The Climate Impact of Swedish
Consumption. Report 5992. Swedish Environmental
Protection Agency, Stockholm. www.swedishepa.se/
Documents/publikationer/978-91-620-5992-7.pdf
(accessed 20 September 2010).
UNCSD, 2002. Plan of Implementation of the World Summit
on Sustainable Development. United Nations Commission
for Sustainable Development, New York. www.un.org/
esa/sustdev/documents/WSSD_POI_PD/English/WSSD_
PlanImpl.pdf (accessed 20 September 2010).
The European environment | State and outlook 2010
51
Thematic assessment | Consumption and the environment
2
Consumption patterns in Europe
and its worldwide environmental
pressures and impacts
Baiocchi, G., and Minx, J.C., 2010. 'Understanding
changes in the UK's CO2 emissions: a global perspective',
Environmental Science and Technology, 44 (4) 1 177–1 184.
ETC/SCP, 2009. Environmental Pressures from European
Consumption and Production. European Topic Centre
for Sustainable Consumption and Production Working
Paper 1/2009. http://scp.eionet.europa.eu/publications/
working%20paper%20namea2009 (accessed 21 September
2010).
Best, A.; Giljum, S.; Simmons, C.; Blobel, D.; Lewis, K.;
Hammer, M.; Cavalieri, S.; Lutter, S. and Maguire, C.,
2008. Potential of the Ecological Footprint for monitoring
environmental impactsfrom natural resource use: Analysis of the
potential of the Ecological Footprint and related assessment tools
for use in the EU's Thematic Strategy on the Sustainable Use
of Natural Resources. Report to the European Commission,
DG Environment, Brussels.
Eurostat, 2009. Consumers in Europe. 2009 Edition.
Luxemburg. http://epp.eurostat.ec.europa.eu/cache/
ITY_OFFPUB/KS-DY-09-001/EN/KS-DY-09-001-EN.PDF
(accessed 8 October 2010).
Betts, K., 2009. 'New data suggest PBDE byproducts
are ubiquitous in U.S. waters', Environmental Science and
Technology, 43 (14): 5 161–5 163.
Brand, C., and Boardman, B., 2008. 'Taming of the ew—
The unequal distribution of greenhouse gas emissions
from personal travel in the UK', Energy Policy, 36 (1):
224–238.
Davis, S. J. and Caldeira, K., 2010. Consumption-based
accounting of CO2 emissions. Proceedings of the National
Academy of Science of the United States. 8 March 2010.
EC, 2009. Questions and Answers on Gross Domestic
Product and Beyond. Memo/09/378. http://europa.eu/
rapid/pressReleasesAction.do?reference=MEMO/09/378
&format=PDF&aged=0&language=EN&guiLanguage=en
(accessed 20 September 2010).
EEA, 2005. Sustainable use and management of natural
resources. EEA Report No 9/2005. European Environment
Agency. www.eea.europa.eu/publications/eea_
report_2005_9/at_download/file (accessed 20 September
2010).
EEA, 2010. The European environment — state and
outlook 2010: synthesis. European Environment Agency,
Copenhagen.
EEA and ETC/SCP, 2010. Database and project using
national accounts matrices with environmental accounts
(NAMEA) based input-output methodology. European
Environment Agency and European Topic Centre on
Sustainable Consumption and Production.
Eid, J.; Overman, H.; Puga, D. and Turner, M., 2007. 'Fat
City: Questioning the Relationship Between Urban Sprawl
and Obesity'. CEPR Discussion Paper no. 6191. London,
Centre for Economic Policy Research. www.cepr.org/pubs/
dps/DP6191.asp.
52
The European environment | State and outlook 2010
Eurostat, 2010. European demography; EU-27 population 501
million at 1 January 2010 — more than 5 million children born
in the EU-27 in 2009. Eurostat NewsRelease. http://epp.
eurostat.ec.europa.eu/cache/ITY_PUBLIC/3-27072010-AP/
EN/3-27072010-AP-EN.PDF (accessed 20 September 2010)
Fiala, N., 2008. 'Measuring sustainability: Why
the ecological footprint is bad economics and bad
environmental science'. Ecological Economics 67 (4) 519–525.
doi:10.1016/j.ecolecon.2008.07.023. http://linkinghub.
elsevier.com/retrieve/pii/S0921800908003376.
Fischer, D.; Hooper, K.; Athanasiadou, M.; Athanassiadis,
I. and Bergman, A., 2006. 'Children show highest levels of
polybrominated diphenyl ethers in a California family of
four: a case study', Environ Health Perspect 114 (10)
1 581–4 581.
Girod, B. and de Haan, P., 2009. 'GHG reduction potential
of changes in consumption patterns and higher quality
levels from Swiss household consumption survey', Energy
Policy, 37 (12): 5 650–5 661.
Global Footprint Network, 2009a. National Footprint
Accounts, 2009 Edition, Oakland, California.
Global Footprint Network, 2009b. How we can bend the
curve. Global Footprint Network Annual Report. Oakland,
California. www.footprintnetwork.org/images/uploads/
Global_Footprint_Network_2009_annual_report.pdf
(accessed 20 September 2010).
Haq, G. and Owen, A., 2009. Green Streets: the
neighbourhood carbon footprint of York. Report of the
Stockholm Environment Institute. York, the United
Kingdom.
Helm, D.; Smale, R. and Phillips, J., 2007. Too Good to be
True? The UK's Climate Change Record. www.dieterhelm.
co.uk/sites/default/files/Carbon_record_2007.pdf (accessed
20 September 2010).
IASO, 2008. Overweight & Obesity in the EU27. International
Association for the Study of Obesity, London. www.iotf.
Thematic assessment | Consumption and the environment
org/database/documents/v2PDFforwebsiteEU27.pdf
(accessed 20 September 2010).
JRC/IPTS, 2006. Environmental impacts of products (EIPRO).
Analysis of the life cycle environmental impacts related to
the total final consumption of the EU-25. EUR 22284 EN.
Institute for Prospective Technological Studies, Sevilla.
http://ec.europa.eu/environment/ipp/pdf/eipro_report.pdf
(accessed 21 September 2010).
Kitzes, J.; Alli, A.; Bagliana, M.; Barrett, J.; Dige, G.; Ede, S.;
Erb, K.; Giljum, S.; Haberl, H.; Hails, C.; Jolia-Ferrier, L.;
Jungwirth, S.; Lenzen, M.; Lewis, K.; Loh, J.; Marchettini,
N.; Messinger, H.; Milne, K.; Moles, R.; Monfreda, C.;
Moran, D.; Nakano, K.; Pyhälä, A.; Rees, W.; Simmons,
C.; Wackernagel, M.; Wada, Y.; Walsh, C.; Wiedmann,
T., 2009a. 'A research agenda for improving national
Ecological Footprint accounts'. Ecological Economics 68,
pp. 1 991–2 007.
Kitzes, J.; Moran, D.; Galli, A.; Wada, Y. and Wackernagel,
M., 2009b. ‚Interpretation and application of the Ecological
Footprint: A reply to Fiala (2008)'. Ecological Economics,
(68) 929–930.
Kotakorpi, E.; Lähteenoja, S. and Lettenmeier, M., 2008.
Household MIPS — Natural resource consumption of Finnish
households and its reduction. The Finnish Environment
43en/2008, Ministry of the Environment, Helsinki. www.
ymparisto.fi/download.asp?contentid=99743&lan=en
(accessed 21 September 2010).
Lenzen, M. and Murray, S.A., 2001. 'A modified ecological
footprint method and its application to Australia'.
Ecological Economics (37) 229–255.
Lähteenoja, S.; Lettenmeier, M. and Kotakorpi, E., 2008.
The ecological rucksack of households — huge differences,
huge potential for reduction. Proceedings Sustainable
Consumption Research Exchanges (SCORE!) conference,
10–11 March 2008, Brussels, Belgium.
Millenium Ecosystem Assessment (MA), 2005. Ecosystems
and human well-being: health synthesis: a report of the
Millennium Ecosystem Assessment. WHO, Corvalan, C.;
Hales, S.; McMichael, A. (core writing team).
Minx, J. C.; Wiedmann, T.; Wood, R.; Peters, G.P.; Lenzen,
M.; Owen, A.; Scott, K.; Barrett, J.; Hubacek, K.; Baiocchi,
G.; Paul, A.; Dawkins, E.; Briggs, J.; Guan, D.; Suh, S. and
Ackerman, F., 2009. 'Input-output analysis and carbon
footprinting: an overview of applications', Economic
Systems Research, 21 (3): 187–216.
Netherlands Environmental Assessment Agency,
2007. Milieubalans 2007. Milieu en Natuur PlanBureau,
Bilthoven, the Netherlands. www.klimaatportaal.nl/pro1/
general/show_document_general.asp?documentid=833&G
UID=%7B4F924482-F98D-49C6-BD6E-DC44E2570380%7D
(accessed 20 September 2010).
Nijdam, D.S. and H. Wilting, 2003. Milieudruk consumptie
in beeld. [A view on environmental pressure on
consumption.] RIVM rapport 7714040004. National
Institute for Public Health and the Environment (RIVM),
Bilthoven, the Netherlands.
OFEV — Office Fédéral de l'Environnement, 2006.
Consommation respectueuse de l'environnement:
Décisions et acteurs clés, modèles de consommation.
Berne. www.bafu.admin.ch/publikationen/
publikation/00015/index.html?lang=fr&download=NHzLp
Zig7t,lnp6I0NTU042l2Z6ln1ae2IZn4Z2qZpnO2Yuq2Z6gpJ
CGdnt3gmym162dpYbUzd,Gpd6emK2Oz9aGodetmqaN1
9XI2IdvoaCVZ,s-.pdf (accessed 21 September 2010).
Peters, G.P. and Hertwich, E.G., 2008. 'CO2 Embodied in
International Trade with Implications for Global Climate
Change', Environmental Science and Technology, 42 (5).
Rørmose, P.; Olsen, T. and Hansen, D., 2009. GHG emissions
embodied in trade. Report by Statistics Denmark for
Eurostat.
Schaffartzik, A.; Krausmann. F. and Eisenmenger, N.,
2009. Der Rohmaterialbedarf des österreichischen Außenhandels
— Weiterentwicklung und Analyse. Institute for Social
Economics, Vienna.
Schulz, H. and Bringezu, S., 2008. Resource consumption
of Germany — indicators and Definitions. Research Report
363 01 134 UBA-FB 001103. German Federal Environment
Agency, Dessau-Rosslau.
Scottish Government, 2008. Healthy Eating, Active Living:
An action plan to improve diet, increase physical activity and
tackle obesity (2008–2011). Edinburgh. www.scotland.
gov.uk/Resource/Doc/228860/0061963.pdf (accessed
20 September 2010).
Steen, P.O.; Grandbois, M.; McNeill, K. and Arnold, W.A.,
2009. 'Photochemical Formation of Halogenated Dioxins
from Hydroxylated Polybrominated Diphenyl Ethers
(OH-PBDEs) and Chlorinated Derivatives (OH-PBCDEs)',
Environ. Sci. Technol., 43 (12): 4 405–4 411.
ULSOP, 2009. Service contract: the State of the Art Report on
Mixture Toxicity. Kortenkamp, A.; Backhaus, T., Faust, M.
(eds); the School of Pharmacy University of London.
Van den Bergh, J.C.J.M and Verbruggen, H., 1999. 'Spatial
sustainability, trade and indicators: an evaluation of the
'ecological footprint''. Ecological Economics, (29) 61–72.
The European environment | State and outlook 2010
53
Thematic assessment | Consumption and the environment
Vringer, K. and Blok, K. 1995. 'The direct and indirect
energy-requirements of households in the Netherlands',
Energy Policy 23 (10): 893–902.
Wackernagel, M. and Rees, W. 1996. Our Ecological
Footprint. New Society Press.
WHO Europe, 2008. Obesity. www.euro.who.int/obesity
(accessed 21 September 2010).
Wiedmann, T. and Lenzen, M., 2007. ‚On the conversion
between local and global hectares in Ecological Footprint
analysis'. Ecological Economics (60) 673–677.
Wiedmann, T. and Barrett, J., 2010. 'A review of the
Ecological Footprint indicator — perceptions and
methods'. Sustainability 2(6) 1 645–1 693.
World Bank, 2009. World Development Indicators, http://
publications.worldbank.org/ecommerce/catalog/
product?item_id=8948363 (accessed 8 October 2010).
Understanding what shapes current
and future consumption
Anderson, R.; Mikulic, B.; Vermeylen, G.; Lyly-Yrjanainen,
M. and Zigante, V., 2007. Second European Quality of
Life Survey, Overview. European Foundation for the
Improvement of Living and Working Conditions, Dublin.
www.eurofound.europa.eu/pubdocs/2009/02/en/2/
EF0902EN.pdf (accessed 20 September 2010).
documents/behaviours-jan08-report.pdf (accessed
17 September 2010).
EC, 2006a. The impact of ageing on public expenditure:
projections for the EU-25 Member States on pensions,
health care, long-term care, education and unemployment
transfers (2004–2050). Special Report n° 1/2006. Economic
Policy Committee and the European Commission
(DG ECFIN), European Commission. DG Economic
and Financial Affairs. www.lex.unict.it/eurolabor/
documentazione/altridoc/rapporti/dg_febbraio06.pdf.
EC, 2006b. 'Directive 2006/114/EC of the European
Parliament and of the Council of 12 December 2006
concerning misleading and comparative advertising',
Offic. J. Eur. Union, 376, 21–27.
EC, 2007. State of European Cities Report. Adding value
to the European Urban Audit. European Commission,
DG Regional Policy. http://ec.europa.eu/regional_policy/
sources/docgener/studies/pdf/urban/stateofcities_2007.pdf
(accessed 27/09/2010).
3
Belch, G.E. and Belch, M.A., 2007. Advertising and
Promotion: An Integrated Marketing and Communications
Perspective. McGraw-Hill/Irwin, New York.
Belk, R.; Ger, G. and Askegaard, S., 2003. 'The Fire of
Desire: a multi-sited inquiry into consumer passion',
Journal of Consumer Research. Vol. 30, No. 3, pp. 326–351.
Biointelligence Service, 2010. Support to analysis
of mega‑trends in the areas of nanotechnology,
biotechnology and information and cognitive sciences.
Final background paper, June 2010, unpublished.
Brännlund, R.; Ghalwash, T. and Nordström, J., 2007.
'Increased energy efficiency and the rebound effect: Effects
on consumption and emissions', Energy Economics 29, 1–17.
CSIS, 2008. The Graying of the Great Powers. Demography
and Geopolitics in the 21st Century. Center for Strategic and
International Studies, Washington. http://csis.org/files/
media/csis/pubs/080630_gai_majorfindings.pdf (accessed
16 June 2010).
Defra, 2008. A Framework for Pro-environmental Behaviours.
Department for Environment, Food and Rural Affairs,
London. www.defra.gov.uk/evidence/social/behaviour/
54
The European environment | State and outlook 2010
EC, 2010a. Commission staff working document
accompanying the Communication from the Commission
to the European Parliament, the Council, the European
Economic and Social Committee and the Committee of
the Regions, Analysis of options to move beyond 20%
greenhouse gas emission reductions and assessing the
risk of carbon leakage. Background information and
analysis, Part II, {COM(2010) 265 final}. http://ec.europa.
eu/environment/climat/pdf/26-05-2010working_doc2.pdf
(accessed 14 June 2010).
EC, 2010b. Fragile recovery in progress in the EU. Interim
forecast 2010, European Commission, DG for Economic
and Financial Affairs. http://ec.europa.eu/economy_
finance/articles/pdf/2010-02-25-interim_forecast_en.pdf
(accessed 20 September 2010).
EEA, 2010a. Environmental trends and perspectives in the
Western Balkans: future production and consumption patterns.
EEA Report No 1/2010. European Environment Agency,
Copenhagen.
EEA, 2010b. The European environment — state and
outlook 2010: assessment of global megatrends. European
Environment Agency, Copenhagen.
EEA, 2010c. The European environment — state and outlook
2010: urban environment. European Environment Agency,
Copenhagen.
EEA, 2010d. The European environment — state and
outlook 2010: land use. European Environment Agency,
Copenhagen.
Thematic assessment | Consumption and the environment
European Council, 2006. Renewed EU Sustainable
Development Strategy as adopted by the European
Council on 15/16 June 2006. Document 10917/06. http://
register.consilium.europa.eu/pdf/en/06/st10/st10917.en06.
pdf (accessed 16 June 2010).
EUROPOP, 2008. EUROpean POpulation Projections —
[tps00002]. http://epp.eurostat.ec.europa.eu/tgm/table.do?t
ab=table&init=1&language=en&pcode=tps00002&plugin=1
(accessed 16 June 2010).
European Migration Network, 2006. Impact of Immigration
on Europe's Societies. An introduction to the EMN Pilot
Research Study on the 'Impact of Immigration on Europe's
Societies'. http://ec.europa.eu/home-affairs/doc_centre/
immigration/docs/studies/emn_immigration_2006_en.pdf
(accessed 16 June 2010).
Eurostat, 2008a. Ageing characterises the demographic
perspectives of the European societies. Statistics in Focus,
72/2008.
Eurostat, 2008b. Tourism in Europe: does age matter?.
Statistics in Focus, 69/2008. Accessible at: http://epp.
eurostat.ec.europa.eu/cache/ITY_OFFPUB/KS-SF-08-069/
EN/KS-SF-08-069-EN.PDF (accessed 21 September 2010).
Eurostat, 2010. European demography; EU-27 population 501
million at 1 January 2010 — more than 5 million children born
in the EU-27 in 2009. Eurostat NewsRelease. http://epp.
eurostat.ec.europa.eu/cache/ITY_PUBLIC/3-27072010-AP/
EN/3-27072010-AP-EN.PDF (accessed 20 September 2010).
Fischer, P.M.; Schwartz, M.P.; Richards, J.W.Jr. and
Goldstein, A.O., 1991. 'Brand logo recognition by children
aged 3 to 6 years: Mickey Mouse and Old Joe the Camel',
Journal of the American Medical Association, 266, 3 145–3 148.
Gronow, J. and Warde, A., 2001. Ordinary Consumption.
Routledge, London.
Halkier, B., 1998. Miljøhensyn I Forbrug. Erfaringer og
Forhandlinger i Ambivalente Hverdagsliv (Environmental
Consideration in Consumption. Experiences and Negotiations
in Everyday Lives). Institut for Miljø, Teknologi og
Samfund, Roskilde Universitet, Denmark.
Haq, G. and Owen, A., 2009. Green Streets: the
neighbourhood carbon footprint of York. Report of the
Stockholm Environment Institute. York, the United
Kingdom.
Henderson, A., 2005. 'From Barnum to “Bling Bling”:
The changing face of celebrity culture.' Hedgehog Review:
Critical Reflection on Contemporary Culture, 7 (1) 37–46.
Hirsch, F., 1977. Social Limits to Growth. Cambridge MA,
USA: Harvard University Press.
Hoßmann, I.; Karsch, M.; Klingholz, R.; Köhnke, Y.;
Kröhnert, S.; Pietschmann, C. and Sütterlin, S., 2008.
Europe's Demographic Future: Growing Imbalances. Berlin
Institute for Population and Development, Berlin. www.
berlin-institut.org/index.php?id=48 (accessed 16 June
2010).
IEA, 2008. World Energy Outlook 2008. International Energy
Agency Geneva.
Jackson, T., 2009. Prosperity without Growth? The Transition
to a Sustainable Economy. Sustainable Development
Commission. Sustainable Development Commission,
London.
Jalas, M., 2000. A Time-Use Approach on the Materials
Intensity of Consumption. Helsinki School of Economics and
Business Administration, Department of Management:
Helsinki.
JRC/IPTS, 2008. European Perspectives on the Information
Society: Annual Monitoring Synthesis and Emerging Trend
Updates. JRC Scientific and Technical Reports, Joint
Research Centre, Institute for Prospective Technological
Studies, Sevilla. http://ftp.jrc.es/EURdoc/JRC47923.pdf
(accessed 20 May 2010).
Liu, J.; Daily, G.C.; Ehrlich, P.R. and Luck, G.W., 2003.
'Effects of household dynamics on resource consumption
and biodiversity'. Nature 421, 530–533.
Kotakorpi, E.; Lähteenoja, S. and Lettenmeier, M., 2008.
Household MIPS — Natural resource consumption of Finnish
households and its reduction. The Finnish Environment
43en/2008, Ministry of the Environment, Helsinki.
www.ymparisto.fi/download.asp?contentid=99743&lan=en
(accessed 21 September 2010).
McNeal, J., 1992. Kids as customers. Lexington Books, New
York.
Mont, O., 2007. 'Consumption and Ecological Economics:
Towards Sustainability', Ecological Economics Research
Trends. C. C. Pertsova, Nova Science Publishers: 13–44.
Mont, O. and Power, K., 2010. 'The Role of Formal
and Informal Forces in Shaping Consumption and
Implications for a Sustainable Society. Part I', Sustainability
2 (5): 2 232–2 252.
OECD, 2005. The impact of ageing on demand, factor
markets and growth.. ECO/WKP(2005)7. OECD
Economics Department, Paris. www.oecd.org/
dataoecd/28/2/34652146.pdf.
The European environment | State and outlook 2010
55
Thematic assessment | Consumption and the environment
OECD, 2008a. OECD Environmental Outlook to
2030. Organisation for Economic Co-operation and
Development, Paris.
OECD, 2008b. Promoting Sustainable Consumption. Good
Practices in OECD Countries. Organisation for Economic
Co-operation and Development, Paris.
Power, K. and Mont, O., 2010. 'The Role of Formal
and Informal Forces in Shaping Consumption
and Implications for a Sustainable Society. Part II',
Sustainability 2 (5): 2 573–2 592.
PSI, 2006. Designing policy to influence consumers:
Consumer behaviour relating to the purchasing of
environmentally preferable goods. Policy Studies Institute,
London. http://ec.europa.eu/environment/enveco/
pdf/RealWorldConsumerBehaviour.pdf (accessed
21 September 2010).
Randles, S. and Warde, A., 2006. Consumption: the view
from theories of practice, in Industrial Ecology and Spaces of
Innovation, In: Green, K. and Randles, S. (eds), Industrial
Ecology and Spaces of Innovation, Cheltenham, the United
Kingdom: Edward Elgar, 220–237.
Schor, J., 1999. The Overspent American: Why We Want What
We Don't Need. HarperPerennial, New York.
Schor, J.B., 2004. Born to Buy. The Commercialized Child and
the New Consumer Culture. Scribner, New York.
Sharp, V. and Darnton, A., 2006. Segmenting for
Sustainability. The Social Marketing Practice, the United
Kingdom.
Shove, E., 2003. Comfort, Cleanliness and Convenience.
Routledge, London.
UK Office for National Statistics, 2007. Family spending —
edition 2007. First published 2008 by Palgrave Macmillan,
USA. www.statistics.gov.uk/downloads/theme_social/
Family_Spending_2006/FamilySpending2007_web.pdf
(accessed 1 October 2010).
TEEB, 2008. The economics of ecosystems and biodiversity. An
interim report. http://ec.europa.eu/environment/nature/
biodiversity/economics/pdf/teeb_report.pdf (accessed
1 October 2010).
UKERC, 2007. The rebound effect: An assessment of the
evidence for economy-wide energy savings from improved
energy efficiency. UK Energy Research Centre, London.
www.ukerc.ac.uk/Downloads/PDF/07/0710ReboundEffect/
0710ReboundEffectReport.pdf (accessed 1 June 2009).
56
The European environment | State and outlook 2010
UNEP, 2007a. GEO Resource Book. A training manual on
integrated environmental assessment and reporting. United
Nations Environment Programme, Nairobi. www.unep.
org/dewa/Docs/geo_resource.pdf (accessed 15 September
2010).
UNEP, 2007b. Environment for development. Section E: The
outlook towards 2015 and beyond. Global Environment
Outlook 4, United Nations Environment Programme,
Nairobi. www.unep.org/geo/geo4/report/09_The_Future_
Today.pdf (accessed 8 July 2010).
UNEP, 2010. Creative Gallery on Sustainable Communciations,
www.unep.fr/scp/communications/ad/list.asp?g=1&cat=all
(accessed 21 September 2010).
Veblen, T., 1902. The Theory of the Leisure Class: An Economic
Study of Institutions. Macmillan, New York.
Williams, J., 2007. 'Innovative Solutions for averting
a potential resource crisis — the case of one-person
households in England and Wales', Environment,
Development and Sustainability 9 (3): 325–354.
York, R., 2007. 'Demographic trends and energy
consumption in European Union Nations, 1960–2025'
Social Science Research 36 (3): 855–872.
Zenith, 2009. Global advertising downturn slows despite
disappointing Q1. Mild global recovery in 2010; all regions to
return to growth in 2011. Press Release, 6 July 2009. Zenith
Optimedia, London.
4
Food and drink
Agritrade, 2010. Review of situation in the EU beef market,
http://agritrade.cta.int/en/Commodities/Beef-sector/News/
Review-of-situation-in-the-EU-beef-market (accessed 21
June 2010).
Angervall, T.; Sonesson, U.; Ziegler, F. and Christel, C.,
2008. Mat och klimat — En sammanfattning om matens
klimatpåverkan i ett livscykelperspektiv. Report of the
Swedish Institute for Food and Biotechnology (SIK).
www.teknologiradet.no/Mat_och_klimat2_HrrH1.pdf.file
(accessed 12 October 2010).
Århus University, 2007. LCA Food Database (www.
lcafood.dk) created by Faculty of Agriculture, Århus
University and LCA 2.0 Consultants, Hoersholm.
Biointelligence Service, AEA Energy and Environment,
Umweltbundesamt, 2010. Preparatory study on food
waste across EU-27. Study for the European Commission.
Forthcoming.
Thematic assessment | Consumption and the environment
Danish EPA, 2004. Consumption and the Environment in
Europe — Trends and Futures. Environmental Project 904.
Danish Environmental Protection Agency, Copenhagen.
www2.mst.dk/udgiv/publications/2004/87-7614-193-4/
html/default_eng.htm (accessed 21 September 2010).
Danish EPA, 2006. Miljøvurdering af konventionel og
økologisk avl af grøntsage — Livscyklusvurdering af produktion
i væksthuse og på friland: Tomater, agurker, løg, gulerødder.
Authors: Niels Halberg, Danmarks JordbrugsForskning;
Randi Dalgaard, Forskningscenter Foulum; Morten
Dalgas Rasmussen, Dansk Erhvervsgartnerforening.
Danish Environmental Protection Agency
Working Report Nr. 5 2006. www2.mst.dk/udgiv/
Publikationer/2006/87-7614-960-9/pdf/87-7614-961-7.pdf
(accessed 12 October 2010).
DEFRA, 2008. The Milk Roadmap. Dairy Supply Chain
Forum's Sustainable Consumption & Production
Taskforce, UK Department for Environment, Food and
Rural Affairs, London. www.defra.gov.uk/environment/
business/products/roadmaps/documents/milk-roadmap.
pdf (accessed 21 September 2010).
EC, 2003. CAP reform — a long-term perspective for
sustainable agriculture. http://ec.europa.eu/agriculture/
capreform/index_en.htm (accessed 21 September 2010).
EEA, 2005. Household consumption and the environment.
EEA Report No 11/2005. European Environment Agency.
www.eea.europa.eu/publications/eea_report_2005_11/
at_download/file (accessed 21 September 2010).
EEA, 2009. Water resources across Europe — confronting water
scarcity and drought. EEA Report, No. 2/2009. European
Environment Agency.
EEA, 2010a. The European environment — state and
outlook 2010: water resources: quantity and flows. European
Environment Agency.
EEA, 2010b. The European environment — state and
outlook 2010: marine and coastal environment. European
Environment Agency.
EFBW, 2010. Bottled water facts, www.efbw.eu/bwf.
php?classement=07 (accessed 6 September 2010).
ETC/SCP, 2009. Environmental Pressures from European
Consumption and Production. ETC/SCP Working
Paper 1/2009, European Topic Centre for Sustainable
Consumption and Production, Copenhagen. http://scp.
eionet.europa.eu/publications/working%20paper%20
namea2009/wp/working%20paper%20namea2009
(accessed 21 September 2010).
EC, 2008. Communication from the Commission to
the European Parliament, the Council, the European
Economic and Social Committee and the Committee of
the Regions: Tackling the challenge of rising food prices
— directions for EU Action. COM (2008) 321 final. http://
ec.europa.eu/development/icenter/repository/COMM_
PDF_COM_2008_0321_F_EN_COMMUNICATION.pdf
(accessed 21 September 2010).
European Food SCP Roundtable, 2010. European Food
Sustainable Consumption and Production Round Table.
www.food-scp.eu/ (accessed 21 September 2010).
EC, 2009a. Prospects for Agricultural Markets and Income
in the European Union 2008–2015, http://ec.europa.eu/
agriculture/publi/caprep/prospects2008/index_en.htm
(accessed 21 September 2010).
Eurostat, 2008. Food: From farm to fork statistics. Eurostat
Pocketbooks, 2008 Edition. European Commission. http://
epp.eurostat.ec.europa.eu/cache/ITY_OFFPUB/KS-30-08339/EN/KS-30-08-339-EN.PDF (accessed 21 September
2010).
EC, 2009b. Green paper — Reform of the Common
Fisheries Policy. COM (2009) 163 final. http://
eur-lex.europa.eu/LexUriServ/LexUriServ.
do?uri=COM:2009:0163:FIN:EN:PDF (accessed
21 September 2010).
ECJ, 2009. Joined Cases C-261/07 and C-299/07 VTB-VAB
NV v Total Belgium NV and Galatea BVBA v Sanoma
Magayines Belgium NV. Judgment of the Court (First
Chamber) 23 April 2009, European Court of Justice.
http://eur-lex.europa.eu/LexUriServ/LexUriServ.
do?uri=CELEX:62007J0261:EN:HTML (accessed
21 September 2010).
European Forum on Nature Conservation and
Pastoralism, 2010. High Nature Value farming and European
biodiversity goals. www.efncp.org/high-nature-valuefarmland/biodiversity/ (accessed 21 June 2010).
Eurostat, 2009. Consumers in Europe. 2009 Edition.
Luxemburg. http://epp.eurostat.ec.europa.eu/cache/
ITY_OFFPUB/KS-DY-09-001/EN/KS-DY-09-001-EN.PDF
(accessed 8 October 2010).
FAO, 2010. FAOSTAT, http://faostat.fao.org/site/368/
default.aspx#ancor (accessed 21 September 2010).
Foster, C.; Green, K.; Bleda, M.; Dewick, P.; Evans, B.;
Flynn, A. and Mylan, J., 2006. Environmental impacts of food
consumption and production. A report to the Department
for Environment, Food and Rural Affairs. Manchester
Business School. Defra, London. www.ifr.ac.uk/waste/
Reports/DEFRA-Environmental%20Impacts%20of%20
The European environment | State and outlook 2010
57
Thematic assessment | Consumption and the environment
Food%20Production%20%20Consumption.pdf (accessed
21 September 2010).
Livestockconsumption_0.pdf (accessed 21 September
2010).
Fritsch, U.R. and Eberle, U., 2007. Treibhausgasemisionnen
durch Erzeugung und Verabeitung von Lebensmitteln (in
German). Working Paper, Oko-Institut e.V., Darmstadt/
Hamburg.www.oeko.de/oekodoc/328/2007-011-de.pdf
(accessed 21 September 2010).
Mäder, P.; Flieβbach, A.; Dubois, D.; Gunst, L.; Fried, P.
and Niggli U., 2002. 'Soil Fertility and Biodiversity in
Organic Farming', Science 296 (5 573): 1 694–1 697.
Garnett, T., 2009. 'Livestock-related greenhouse gas
emissions: impacts and options for policy makers'.
Environmental Science and Policy (12): 491–503.
Hirschfeld, J.; Weiß, J.; Preidl, M.; Korbun, T., 2008.
Klimawirkungen der Landwirtschaft in Deutschland.
Schriftenreihe des IÖW 186/08. Institut für ökologische
Wirtschaftsforschung. Berlin. www.foodwatch.de/
foodwatch/content/e10/e17197/e17201/e17220/IOEW_
Klimawirkungen_der_Landwirtschaft_SR_186_08_ger.pdf
(accessed 12 October 2010).
IBWA, 2010. The 2007 Statistics, provided by the Beverage
Marketing Cooperation, www.bottledwater.org/public/
Stats_2007.doc (accessed 21 September 2010).
JRC/IPTS, 2006. Environmental impacts of products (EIPRO).
Analysis of the life cycle environmental impacts related to
the total final consumption of the EU-25. EUR 22284 EN.
Institute for Prospective Technological Studies, Sevilla.
http://ec.europa.eu/environment/ipp/pdf/eipro_report.pdf
(accessed 21 September 2010).
JRC/IPTS, 2008. Environmental improvement potentials
of meat and dairy products. European Commission Joint
Research Centre scientific and technical reports JRC
Scientific and Technical Reports, EUR 23491 EN. Joint
Research Centre, Institute for Prospective Technological
Studies, Sevilla. http://ftp.jrc.es/EURdoc/JRC46650.pdf
(accessed 21 September 2010).
JRC/IPTS, 2009. Environmental impacts of diet changes in the
EU, JRC Scientific and Technical Reports, EUR23783EN.
Joint Research Centre, Institute for Prospective
Technological Studies. http://ftp.jrc.es/EURdoc/JRC50544.
pdf (accessed 21 September 2010).
Kotakorpi, E.; Lähteenoja, S. and Lettenmeier, M., 2008.
Household MIPS — Natural resource consumption of Finnish
households and its reduction. The Finnish Environment 43en
| 2008, Ministry of the Environment, Helsinki.
www.ymparisto.fi/download.asp?contentid=99743&lan=en
(accessed 21 September 2010).
MacMillan, T., and Durrant, R., 2009. Livestock
consumption and climate change. A framework for
dialogue. Food Ethics Council and WWF-UK, Brighton/
Godalming. www.foodethicscouncil.org/system/files/
58
The European environment | State and outlook 2010
Norwegian Board of Technology, 2008. Matens
Klimaspor (in Norwegian). Report X 2008. Norwegian
Board of Technology, Oslo. www.teknologiradet.no/
dm_documents/Matens_klimaspor_Rapport_BKUOI.pdf
(accessed 21 September 2010).
OECD/FAO, 2009. Agricultural Outlook 2009–2018.
Highlights. Organisation for Economic Cooperation and
Development and Food and Agriculture Organisation
of the United Nations, Paris/Rome. www.agri-outlook.
org/dataoecd/13/13/45438527.pdf (accessed 21 September
2010).
Omann, I.; Friedl, B.; Hammer, M. and Pack, A.,
2007. The Environmental Effects of Food Consumption
for Different Household Categories. Sustainable Europe
Research Institute, Vienna. http://seri.at/wp-content/
uploads/2009/09/ESEE-2007-sufotrop-Presentation1.pdf
(accessed 21 September 2010).
Water Footprint Network, 2010. Water Footprint
Product Gallery, www.waterfootprint.org/?page=files/
productgallery (accessed 21 September 2010).
Williams, A.G.; Audsley, E. and Sandars, D.L., 2006.
Energy and environmental burdens of organic and non‑organic
agriculture and horticulture. Final report to Defra on
project IS0205: Determining the environmental burdens
and resource use in the production of agricultural and
horticultural commodities. School of Applied Sciences,
Cranfield University, the United Kingdom.
WRAP, 2009. Household food and drink waste in the UK. Final
report. Waste & Resources Action Programme, Banburry.
www.wrap.org.uk/downloads/Household_food_and_
drink_waste_in_the_UK_-_report.bca68aba.8048.pdf
(accessed 1 July 2010).
5Housing
Bioregional, 2009. BedZED seven years on. The impact of the
UK's best known eco-village and its residents. BioRegional
Development Group, Surrey. www.bioregional.com/files/
publications/BedZED_seven_years_on.pdf (accessed
8 June 2010).
EC, 2006. Action Plan for Energy Efficiency: Realising the
Potential, COM(2006) 545 final.
EC, 2007. Communication from the Commission to
the Council, the European Parliament, the European
Thematic assessment | Consumption and the environment
Economic and Social Committee and the Committee of the
Regions. A lead market initiative for Europe. COM(2007)
860 final. http://eur-lex.europa.eu/LexUriServ/LexUriServ.
do?uri=COM:2007:0860:FIN:en:PDF (accessed 8 September
2010).
EC, 2009. Regulation (EC) No 66/2010 of the European
Parliament and of the Council of 25 November 2009 on
the EU EcolabelEC (2008): Commission staff working
document accompanying document to the proposal for a
recast of the energy performance of buildings Directive
(2002/91/EC), Summary of the impact assessment,
{COM(2008) 780 final} {SEC(2008) 2864}. 13/11/2008.
http://eur-lex.europa.eu/LexUriServ/LexUriServ.
do?uri=SEC:2008:2865:FIN:EN:PDF (accessed 9 June 2010).
EC, 2010a. COM 2002/91/EC: Directive on the Engery
Performance of Buildings, www.managenergy.net/
products/R210.htm (accessed 21 September 2010).
EC, 2010b. EU Energy trends to 2030. Update 2009.
European Commission, Directorate-General for Energy in
collaboration with Climate Action DG and Mobility and
Transport DG. Authors (E3M-Lab): Capros, P.; Mantzos, L.;
Tasios, N.; De Vita, A.; Kouvaritakis, N. http://ec.europa.
eu/environment/climat/pdf/climat_action/trends_to_2030_
update_2009_en.pdf (accessed 8 October 2010).
EC, 2010c. Commission staff working document
accompanying document to the report from the
Commission to the Council and the European Parliament.
Second Follow-up Report to the Communication on water
scarcity and droughts in the European Union (COM(2007)
414 final). {COM(2010)228 final}. http://ec.europa.eu/
environment/water/quantity/pdf/staff_working_doc.pdf
(accessed 20 May 2010).
EEA, 2008. Energy and Environment Report 2008.
EEA Report No 6/2008, European Environment Agency.
EEA, 2010e. The European environment — state and outlook
2010: biodiversity. European Environment Agency.
EEA, 2010f. The European environment — state and outlook
2010: water resources: quantity and flows. European
Environment Agency.
EEA energy indicator ENER 22, 2010. Energy efficiency
and energy consumption in the household sector
(ENER22), Assessment published September 2010,
European Environment Agency. www.eea.europa.eu/
data-and-maps/indicators/energy-efficiency-and-energyconsumption-2/assessment (accessed 1 October 2010).
ESMA, 2010. Annual Report on the Progress in Smart
Metering 2009. European Smart Metering Alliance.
www.esma-home.eu/UserFiles/file/ESMA_WP5D18_
Annual_Progress_Report_2009 %281 %29.pdf (accessed
21 September 2010).
Estonian Environment Information Centre, 2010. Estonian
Environmental Review 2009. Tallinn. www.keskkonnainfo.
ee/publications/4263_PDF.pdf (accessed 10.09.2010).
ETC/SCP, 2010b. Country Fact sheet on SCP policies for the
United Kingdom. European Topic Centre on Sustainable
Consumption and Production, Copenhagen. http://scp.
eionet.europa.eu/facts/factsheets_waste/fs_scp/pdf/uk
(accessed 7 June 2010).
Harvey, L.D.D., 2009. 'Reducing energy use in the
buildings sector: measures, costs, and examples', Energy
Efficiency 2, 139–163.
Heinze, M. and Voss, K., 2009. 'Goal: Zero Energy
Building Exemplary Experience Based on the Solar Estate
Solarsiedlung Freiburg am Schlierberg, Germany', Journal
of Green Building 4 (4) 93–100.
EEA, 2009. Water resources across Europe — confronting water
scarcity and drought. EEA Report No 2/2009, European
Environment Agency.
HM Treasury, 2007. Chancellor of the Exchequer's Budget
Statement. http://webarchive.nationalarchives.gov.uk/+/
www.hm-treasury.gov.uk/budget/budget_07/bud_bud07_
speech.cfm (accessed 9 June 2010).
EEA, 2010a. The European environment — state and outlook
2010: land use. European Environment Agency.
IEA, 2009. Gadgets and Gigawatts. Policies for Energy-efficient
electronics. OECD/IEA, International Energy Agency, Paris.
EEA, 2010b. The European environment — state and outlook
2010: material resources and waste. European Environment
Agency.
JRC/IE, 2009. Electricity Consumption and Efficiency Trends
in the European Union. Status Report. JRC Scientific and
Technical Reports, EUR 24005 EN. Joint Research Centre,
Institute for Energy, Ispra. http://re.jrc.ec.europa.eu/
energyefficiency/pdf/EnEff_Report_2009.pdf (accessed
21 September 2010).
EEA, 2010c. The European environment — state and outlook
2010: urban environment. European Environment Agency.
EEA, 2010d. The European environment — state and outlook
2010: soil. European Environment Agency.
JRC/IPTS, 2006. Environmental impacts of products (EIPRO).
Analysis of the life cycle environmental impacts related to
the total final consumption of the EU-25. EUR 22284 EN.
The European environment | State and outlook 2010
59
Thematic assessment | Consumption and the environment
Institute for Prospective Technological Studies, Sevilla.
http://ec.europa.eu/environment/ipp/pdf/eipro_report.pdf
(accessed 21 September 2010).
JRC/IPTS, 2008. Environmental Improvement Potentials of
Residential Buildings (IMPRO-Building). JRC Scientific and
Technical Reports. Institute for Prospective Technological
Studies, Sevilla.
JRC/IPTS, 2009. Towards additional policies to improve the
environmental performance of buildings. Part II: Quantitative
assessment. JRC Scientific and Technical Reports, EUR
24015 EN. Joint Research Centre, Institute for Prospective
Technological Studies, Sveilla. http://ipts.jrc.ec.europa.eu/
publications/pub.cfm?id=2699 (accessed 9 June 2010).
Jiang, L. and O'Neill, B.C., 2009. Household Projections
for Rural and Urban Areas of Major Regions of the World.
Interim Report, IR-09-026, International Institute for
Applied Systems Analysis (IIASA), Laxenburg. www.
populationaction.org/Issues/Population_and_Climate_
Change/IR-09-026.pdf (accessed 21 September 2010).
National Statistics Institute of Spain, 2010. Encuestas
del agua 2001/2002/2003/3004/2005; Encuesta sobre el
suministro y tratamiento del agua 2006; Encuesta sobre el
suministro y saneamiento del agua. Año 2007/2008. www.
ine.es (accessed 8 October 2010).
ODYSSEE database, 2010. Energy Efficiency Indicators in
Europe, www.odyssee-indicators.org/ (accessed 9 June 2010).
OECD, 2010. Water quality and conservation. OECD
Observer No 278. Organisation for Economic
Co‑operation and Development, Paris. www.oecd.org/
dataoecd/61/43/45089018.pdf (accessed 21 September 2010).
Schultz, P.W.; Nolan, J.M; Cialdini,R.B.; Goldstein, N.J. and
Griskevicius, V., 2007. 'The Constructive, Destructive, and
Reconstructive Power of Social Norms', Psychological Science,
18 (5) 429–434. www.kysq.org/docs/Schultz.pdf (accessed
21 September 2010).
Von Renssen, S., 2009. Placing smart meters at the heart
of energy use, www.endseurope.com/22963 (accessed
21 September 2010).
6Mobility
ARE, 2007. Einführung eines Road Pricing. Bericht des
Bundesrates zur möglichen Einführung von Road Pricing
in der Schweiz in Erfüllung des Postulats 04.3619 KVF
Nationalrat vom 16.11.2004 (in German). Bundesamt für
Raumentwicklung, Bern.
BMVBS, 2002. National Cycling Plan 2002–2012 — Ride your
bike! Federal Ministry of Transport, Building and Housing,
Berlin.
60
The European environment | State and outlook 2010
Böhler, S.; Koska, T.; Reutter, O., 2009. Moving away from
oil — on behalf of Spahn Foundation. Part A: Environment
and transport support for oil saving automobile types
(draft working paper), Wuppertal.
BUND et al., 2008. Sustainable Germany in a globalized
world — an impetus for social debate. Friends of the Earth
Germany (BUND), Brot für die Welt (Bread for the World),
Church Development Service (EED) — Association of
the Protestant Churches in Germany (eds.). Wuppertal
Institute for Climate, Environment, Energy. Fischer
Taschenbuch publishing, Frankfurt/Main.
Council, 2007. Presidency Conclusions. 8/9 March 2007 —
7224/1/07 REV 1. Council of the European Union, Brussels.
Dalkmann, H. and Brannigan, C., 2007. Sustainable
Transportation Sourcebook: A Sourcebook for Policy-Makers
in Developing Countries. Transport and Climate Change:
Module 5e. Sustainable Urban Transport Project — Asia.
www.sutp-asia.org.
EC, 2007. Green Paper — Towards a new culture for urban
mobility. COM(2007) 551 final.
EC, 2009a. EU energy and transport in figures — Statistical
Pocketbook 2009. Luxembourg.
EC 2009b. Communication from the Commission to
the European Parliament, the Council, the European
Economic and Social Committee and the Committee
of the Regions. Action Plan on Urban Mobility. Draft.
COM(2009)490/5.
EC, 2010. EU Transport GHG: Routes to 2050? www.
eutransportghg2050.eu/cms (accessed 1 October 2010).
EEA, 2007. Transport and environment: on the way to a
new common transport policy. TERM 2006: indicators
tracking transport and environment in the European Union.
EEA Report No 1/2007. European Environment Agency.
EEA, 2008. Beyond transport policy — exploring and managing
the external drivers of transport demand. EEA Technical report,
No 12/2008. European Environment Agency.
EEA, 2010a. Towards a resource-efficient transport system —
TERM 2009: indicators tracking transport and environment
in the European Union. EEA Report No 2/2010. European
Environment Agency.
EEA, 2010b. TERM Indicator no. 32 — Vehicle ownership
and truck intensity. www.eea.europa.eu/data-and-maps/
figures/term32-vehicle-ownership-and-truck-intensity-1,
(accessed 21 September 2010).
Thematic assessment | Consumption and the environment
EEA, 2010c. Passenger and freight demand projections for
the EU‑25. www.eea.europa.eu/data-and-maps/figures/
passenger-and-freight-demand-projections (accessed
21 September 2010).
EEA, 2010d. The European environment — state and outlook
2010: air pollution. European Environment Agency.
EEA, 2010e. The European environment — state and outlook
2010: urban environment. European Environment Agency.
Eliasson, J. and Karlstrom, A., 2007. Lessons from the
Stockholm congestion charges. www.etcproceedings.org/
paper/lessons-from-the-stockholm-congestion-charges
(accessed 28 June 2010).
ETC SCP, 2009. Environmental Pressures from European
Consumption — A study in integrated environmental and
economic analysis. ETC/SCP working paper No. 1/2009.
European Topic Centre on Sustainable Consumption and
Production, Copenhagen.
Eurostat, 2009. Panorama of Transport. Eurostat Statistical
books. Luxembourg.
Eurostat, 2010. Price indices for transport. Contextual
Indicator under theme 7: Sustainable Transport of Eurostat
Sustainable Development Indicators. Downloaded from
http://epp.eurostat.ec.europa.eu/tgm/table.do?tab=table&i
nit=1&plugin=1&language=en&pcode=tsdtr310, (accessed
May 2010).
Green Fiscal Commission, 2009. Lessons from two green tax
shifts in the United Kingdom. Briefing Paper One. London.
JRC/IPTS, 2006. Environmental impacts of products (EIPRO).
Analysis of the life cycle environmental impacts related to
the total final consumption of the EU-25. EUR 22284 EN.
Institute for Prospective Technological Studies, Sevilla.
http://ec.europa.eu/environment/ipp/pdf/eipro_report.pdf
(accessed 21 September 2010).
JRC/IPTS, 2008. Environmental Improvement of Passenger
Cars (IMPRO-car). JRC Scientific and Technical Reports,
EUR 23038 EN. Joint Research Centre, Institute for
Prospective Technological Studies, Sevilla. http://
ec.europa.eu/environment/ipp/pdf/jrc_report.pdf
(accessed 21 September 2010).
JRC/IPTS, 2009. Feebate and scrappage policy instruments
— Environmental and economic impacts for the EU27. JRC
Scientific and Technical Reports, Institute for Prospective
Technological Studies, Sevilla. JRC Scientific and Technical
Reports, EUR 23896 EN. Joint Research Centre, Institute
for Prospective Technological Studies, Sevilla. http://ftp.
jrc.es/EURdoc/JRC51094.pdf (accessed 21 September 2010).
LIFE EC4MACS, 2010. Baseline transport projection using
the PRIMES 2009 Baseline Scenario. Internet reference
at: www.ec4macs.eu. Data delivered via personal
communication by L. Ntziachristos, Lab of Applied
Thermodynamics, Thessaloniki, Greece.
ODYSSEE database, 2010. Energy Efficiency Indicators
in Europe, www.odyssee-indicators.org/ (accessed 9 June
2010).
Pike, E., 2010. Congestion Charging: Challenges and
Opportunities. International Council on Clean
Transportation, Washington. www.theicct.org/pubs/
congestion_apr10.pdf (accessed 21 September 2010).
Siemens, 2008. Sustainable urban infrastructure.– a view to
2025. London edition. Siemens AG, München.
TRM, 2007. More bicycles on safe road in the state — the
bicycle strategy. Danish Ministry of Transport and Energy,
Copenhagen.
UBA, 2005. Was bringt die Ökosteuer — weniger
Kraftstoffverbrauch oder mehr Tanktourismus? (in German).
German Federal Environmental Agency, Dessau.
7Tourism
De Camillis, C.; Raggi, A. and Petti, L., 2010. 'Tourism
LCA: state-of-the-art and perspectives', The International
Journal of Life Cycle Assessment, 15 (2): 148–155.
De Camillis, C., 2010. Towards environmental sustainability of
tourism: life cycle thinking approaches and tools. Dipartimento
di Scienze. Pescara, Italy, Universitá degli Studi
'G. d’Annunzio'. PhD in Sciences.
EC, 2006. Communication from the European Commission
— A renewed EU Tourism Policy — Towards a stronger
partnership for European Tourism (COM/2006/0134).
http://eur-lex.europa.eu/LexUriServ/LexUriServ.
do?uri=COM:2006:0134:FIN:en:PDF (accessed 21 June
2010).
EC, 2007. Communication from the Commission —
Agenda for a sustainable and competitive European
tourism. COM/2007/0621 final. http://eur-lex.europa.eu/
LexUriServ/LexUriServ.do?uri=CELEX:52007DC0621:en:H
TML (accessed 21 June 2010).
EC, 2010. Communication from the Commission to the
European Parliament, the Council, the European Economic
and Social Committee and the Committe of the Regions.
Europe, the world's No 1 tourist destination — a new
political framework for tourism in Europe. COM(2010) 352
final. http://ec.europa.eu/enterprise/sectors/tourism/files/
communications/communication2010_en.pdf (accessed
8 September 2010).
The European environment | State and outlook 2010
61
Thematic assessment | Consumption and the environment
EEA, 2006. The changing faces of Europe's coastal areas. EEA
Report No 6/2006. European Environment Agency.
EEA, 2009a. Water resources across Europe — confronting
water scarcity and drought. EEA Report No 2/2009.
European Environment Agency. www.eea.europa.
eu/publications/water-resources-across-europe/at_
download/file (accessed 21 September 2010).
EEA, 2009b. Regional climate change and adaptation. The
Alps facing the challenge of changing water resources. EEA
Report No 8/2009. European Environment Agency.
EEA, 2010a. The European environment — state and outlook
2010: country assessment — Greece. European Environment
Agency, Copenhagen.
EEA, 2010b. The European environment — state and
outlook 2010: water resources: quantity and flows. European
Environment Agency, Copenhagen.
EEA, 2010c. The European environment — state and outlook
2010: freshwater quality. European Environment Agency,
Copenhagen.
EEA, 2010d. The European environment — state and
outlook 2010: marine and coastal environment. European
Environment Agency, Copenhagen.
EMAS-register, 2010. EMAS-register of the European
Commission. www.emas-register.eu/index.php (accessed
18 June 2010).
Eurostat, 2008. Panorama on Tourism. 2008 edition.
Eurostat statistical books. http://epp.eurostat.ec.europa.
eu/cache/ITY_OFFPUB/KS-30-08-550/EN/KS-30-08-550EN.PDF (accessed 21 September 2010).
Hamele, H. and Eckardt, S., 2006. Environmental initiatives
by European tourism businesses. Instruments, indicators
and practical examples. A contribution to the development
of sustainable tourism in Europe. Ecotrans e.V. (ed.),
Saarbrücken. http://sutour.ier.uni-stuttgart.de/englisch/
downloads/sutour_lores_en.pdf (accessed 14 September
2010).
Hungary tourism report, 2008. Annual tourism reporting
template. http://ec.europa.eu/enterprise/sectors/
tourism/files/annual_reports/hu_2008_en.pdf (accessed
8 September 2010).
IATA, 2009. Carbon-Neutral Growth by 2020, www.
iata.org/pressroom/pr/2009-06-08-03.htm (accessed
21 September 2010).
INSEE, 2009. Les résidences secondaires :une composante
du développement et de l’attractivité de la région. Décimal
62
The European environment | State and outlook 2010
Poitou-Charentes. N° 288 — Février 2009. Institut
national de la statistique et des études économique.
www.insee.fr/fr/insee_regions/poitou-charentes/themes/
decimal/dec2009288/dec2009288.pdf (accessed 13 October
2010).
ITF-STD, 2009. A Three-Year Journey for Sustainable
Tourism. International Task Force on Sustainable
Tourism Development under the Marrakech Process on
Sustainable Consumption and Production. www.unep.
fr/scp/tourism/activities/taskforce/pdf/TF %20REPORT_
FINAL.pdf (accessed 21 September 2010).
OECD, 2010. OECD Tourism Trends and Policies
2010. Organisation for Economic Co-operation and
Development, Paris. www.oecd.org/document/24/0,3343
,en_2649_34389_44607576_1_1_1_1,00.html (accessed 21
June 2010).
Simpson, M.C.; Gössling, S.; Scott, D.; Hall, C.M. and
Gladin, E., 2008. Climate Change Adaptation and
Mitigation in the Tourism Sector: Frameworks, Tools
and Practices. UNEP, University of Oxford, UNWTO,
WMO, Paris. www.unep.fr/shared/publications/
pdf/DTIx1047xPA-ClimateChange.pdf (accessed
21 September 2010).
TIES, 2006. TIES global ecotourism fact sheet. The
International Ecotourism Society, Washington.
www.ecotourism.org/atf/cf/ %7B82a87c8d-0b56-41498b0a-c4aaced1cd38 %7D/TIES %20GLOBAL %20
ECOTOURISM %20FACT %20SHEET.PDF (accessed
18 June 2010).
UNEP/MAP/BLUEPLAN, 2008. Promoting sustainable
tourism in the Mediterranean: Proceedings of the Regional
Workshop. Sophia Antipolis, France, 2–3 July, 2008. MAP
Technical Report Series No 173. UNEP/Mediterranean
Action Plan, Athens. www.planbleu.org/publications/
mts173_tourisme.pdf (accessed 18 June 2010).
UNEP/MAP-Plan Bleu, 2009. State of the environment and
development in the Mediterranean — 2009. United Nations
Environment Programme/Mediterranean Action PlanPlan Bleu, Athens.
UNWTO, 2004. Tourism and Poverty Alleviation
Recommendations for Action. United Nations World
Tourism Organisation, Madrid. www.wtoelibrary.org/
content/g5m783/?p=d9e576194da44706be08d7d69f709923
&pi=10 (accessed 18 June 2010).
UNWTO, 2010. Interim update, April 2010. UNWTO World
Tourism Barometer, United Nations World Tourism
Organisation, Madrid. www.unwto.org/facts/eng/pdf/
barometer/UNWTO_Barom10_update_april_en_excerpt.
pdf (accessed 21 June 2010).
Thematic assessment | Consumption and the environment
UNWTO and UNEP, 2008. Climate Change and Tourism.
Responding to Global Challenges. United Nations World
Tourism Organisation, Madrid. www.unep.fr/shared/
publications/pdf/WEBx0142xPA-ClimateChangeandTouris
mGlobalChallenges.pdf (accessed 21 September 2010).
Working Group on Sustainable Tourism, 2007. Action for
more sustainable European Tourism. http://ec.europa.eu/
enterprise/sectors/tourism/files/docs/tsg/tsg_final_report_
en.pdf (accessed 21 June 2010).
WWF Germany, 2009. The Tourist Climate Footprint. WWF
Report on environmental impacts of holiday trips. World
Wide Fund for Nature Germany. Hamburg.
Concluding reflections: consumption,
environmental priorities and policies
Adell, A; Alcantud, A and Scheafer, B., 2009. Sustainable
Consumption Strategies in the European Union. EUPOPP
Work Package 1 — Deliverable 1.3. Ecoinstitut Barcelona,
Spain.
EEA, 2005. Market-based instruments for environmental
policy in Europe. Technical report No 8/2005, European
Environment Agency.
EEA, 2010a. The European environment — state and
outlook 2010: synthesis. European Environment Agency,
Copenhagen.
EEA, 2010b. Pilot fact sheets on national sustainable
consumption and production policies — Taking stock of EU
initiatives. EEA leaflet. European Environment Agency.
Ekins, P. and Speck, S. (eds.), 2011. 'Environmental Tax
Reform (ETR): A Policy for Sustainable Economic Growth'.
Oxford University Press, Forthcoming.
8
Andersen M.S. and Ekins P. (eds.), 2009. Carbon-Energy
Taxation: Lessons from Europe, Oxford University Press.
Berg, A., 2007. European Forerunners of Sustainable
Consumption and Production Programmes — Challenges and
possibilities in an emerging environmental policy field. Paper
for PhD Master Class Marie Curie European Summer
School on Earth Systems Government, Helsinki.
EC, 2008a. Communication from the Commission to
the European Parliament, the Council, the European
Economic and Social Committee and the Committee of the
Regions on the Sustainable Consumption and Production
and Sustainable Industrial Policy Action Plan, SEC(2008)
2110, SEC(2008) 2111.
EC, 2008b. Public Procurement for a Better Environment.
Communication from the European Commission to
the European Parliament, the Council, the European
Economic and Social Committee and the Committee of the
Regions. COM(2008) 400.
EC, 2010a. National Action Plans (NAPs) — the status
in EU Member States. http://ec.europa.eu/environment/
gpp/pdf/national_gpp_strategies_en.pdf (accessed
21 September 2010).
EC, 2010b. Communication from the Commission, Europe
2020: A strategy for Smart, Sustainable and Inclusive
Growth. COM(2010) 2020. http://ec.europa.eu/eu2020/pdf/
COMPLET%20EN%20BARROSO%20%20%20007%20-%20
Europe%202020%20-%20EN%20version.pdf.
ETC/RWM and EEA, 2007. National Sustainable
Consumption and Production Strategies in the EU — a
Comparative Review of Selected Cases. Background paper for
the conference Time for Action held on 27–29 September
2007, Ljubljana, Slovenia.
ETC/SCP and EEA, 2009. County fact sheets on sustainable
consumption and production policies. http://scp.eionet.
europa.eu/facts/factsheets_scp (accessed 21 September
2010).
ETC/SCP, 2010. Towards a Set of Indicators on Sustainable
Consumption and Production (SCP) for EEA reporting.
ETC/SCP Working Paper 1/2010. European Topic
Centre on Sustainable Consumption and Production,
Copenhagen.
Geels, F.W.; Monaghan, A.; Eames, M. and Steward,
F., 2008. The feasibility of systems thinking in sustainable
consumption and production policy. Report to the
Department for Environment, Food and Rural Affairs,
Brunel University. Defra, London.
Jackson, T., 2005. Motivating Sustainable Consumption: a
review of evidence on consumer behaviour and behavioural
change. A report to the Sustainable Development Research
Network. Centre for Environmental Strategy, University of
Surrey.
Jackson, T. and Michaelis L., 2003. Policies for Sustainable
Consumption. A report for the UK Sustainable
Development Commission. Sustainable Development
Commission, London.
OECD, 2010. Environmental policy and household behaviour.
A Synthesis Report. Draft version 23/04/2010. ENV/EPOC/
WPNEP(2010)1.
The European environment | State and outlook 2010
63
Thematic assessment | Consumption and the environment
OECD/EEA, 2010. OECD/EEA database on instruments used
for environmental policy and natural resources management.
www2.oecd.org/ecoinst/queries/ (accessed 21 September
2010).
PWC, 2008. Collection of statistical information on Green
Public Procurement in the EU Report on data collection results.
Price Waterhouse Coopers in cooperation with EcoFys
and Significant. http://ec.europa.eu/environment/gpp/pdf/
statistical_data.pdf (accessed 1 October 2010).
REC, 2008. The status and review of national Green Public
Procurement (GPP) action plans in the new EU Member States
of the Central and Eastern European (CEE) region (preliminary
results) and barriers to the use of the EU Ecolabel in GPP.
Regional Environmental Center for central and Eastern
Europe, Szentendre, Hungary.
Rubik, F.; Scholl, G.; Biedenkopf, K.; Kalimo, H.; Mohaupt,
F.; Söebech, Ó.; Stø, E.; Strandbakken, P. and Turnheim,
B., 2009. Innovative Approaches in European Sustainable
Consumption Policies. ISBN 978-3-932092-95-4. IÖW 192/09,
Berlin.
Sustainable Consumption Roundtable, 2006. I Will if
You Will — Towards Sustainable Consumption. Sustainable
Development Commission and National Consumer
Council, London.
64
The European environment | State and outlook 2010
Tukker, A.; Diaz-Lopez, F.; van de Lindt, M.; Mont, O.;
Lorek, S.; Spangenberg, J.; Giljum, S.; Bruckner, M. and
Oman, I., 2008. Sustainable Consumption Policies Effectiveness
Evaluation (SCOPE2). Final Report — Draft 7 October 2008.
TNO Built Environment and Geosciences, Delft.
Watson, D.; Stenbæk Hansen, M.; Szlezak, J. and Zhao, W.,
2009. Background Paper for 4th RIM Preparatory Meeting on
Sustainable Consumption and Production — Progress Review
of Policy Development. Geneva, 30 November 2009. www.
unep.ch/roe/SCP/Background_paper_prp_scpmtg.pdf
(accessed 21 September 2010).
WEF, 2010a. Redesigning Business Value: A Roadmap
for Sustainable Consumption. World Economic Forum.
Geneva. www.weforum.org/pdf/sustainableconsumption/
DrivingSustainableConsumptionreport.pdf (accessed
11 October 2010).
WEF, 2010b. WEF Sustainable Consumption
Initiative, www.weforum.org/en/initiatives/
DrivingSustainableConsumption/index.htm (accessed
21 September 2010).
TH-30-10-544-EN-N
doi:10.2800/58407
European Environment Agency
Kongens Nytorv 6
1050 Copenhagen K
Denmark
Tel.: +45 33 36 71 00
Fax: +45 33 36 71 99
Web: www.eea.europa.eu
Enquiries: www.eea.europa.eu/enquiries


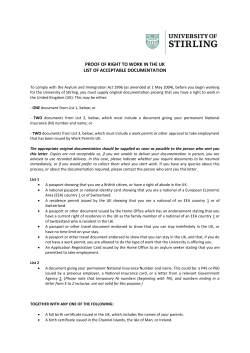


© Copyright 2026