
2014 ASEA 1 AfricAn SecuritieS exchAngeS ASSociAtion
African Securities Exchanges Association
2014
ASEA
Y E A R B O O K
1
African Securities Exchanges Association
asea member STATES
TUNISIA
MOROCCO
ALGERIA
L I B YA
EGYPT
CAPE VERDE
M A U R I TA N I A
SENEGAL
MALI
NIGER
SUDAN
GAMBIA
NIGERIA
GUINEA
ETHIOPIA
GUINEA
B I S S AU
SOMALIA
UGANDA
SIERRA
LEONE
K E N YA
RWANDA
LIBERIA
C OT E D ’ I VO I R E
GHANA
TO G O
TA N Z A N I A
M A L AW I
BENIN
ANGOLA
ZAMBIA
MOZAMBIQUE
NAMIBIA
Z I M BA B W E
M AU R I T I U S
B OT S WA N A
S WA Z I L A N D
L E S OT H O
asea member exchanges
Botswana Stock Exchange
Libyan Stock Market
Bolsa De Valores De Cabo Verde
Lusaka Stock Exchange
Bourse Regionale Des Valeurs Mobilières
Malawi Stock Exchange
Bourse De Tunis
Mozambique Stock Exchange
Casablanca Stock Exchange
Nairobi Securities Exchange
Dar-Es Salaam Securities Exchange
Nigerian Stock Exchange
Douala Stock Exchange
Stock Exchange Of Mauritius
Egyptian Stock Exchange
Tunis Stock Exchange
Ghana Stock Exchange
Namibian Stock Exchange
Johannesburg Stock Exchange
Uganda Securities Exchange
Khartoum Stock Exchange
Zimbabwe Stock Exchange
Rwanda Stock Exchange
Safe Asia (Associate Member)
ASEA
Y E A R B O O K
2
SOUTH AFRICA
African Securities Exchanges Association
Table of contents
ASEA Members Country Map
2
ASEA Executive Commitee Members
4
Member Exchange Profiles
14
Botswana Stock Exchange
14
Bourse Regionale des Valeurs Mobilières
29
Bourse de Tunis
41
Casablanca Stock Exchange
55
Dar-es Salaam Stock Exchange
65
Douala Stock Exchange
75
Egyptian Stock Exchange
83
Ghana Stock Exchange
98
Johannesburg Stock Exchange
110
Rwanda Stock Exchange
136
Lusaka Stock Exchange
145
Malawi Stock Exchange
154
Stock Exchange of Mauritius
161
Mozambique Stock Exchange
172
Nairobi Securities Exchange
181
The Namibia Stock Exchange
193
Nigerian Stock Exchange
202
Uganda Securities Exchange
213
Zimbabwe Stock Exchange
221
Khartoum Stock Exchange
232
ASEA
Y E A R B O O K
3
African Securities Exchanges Association
ASEA
Y E A R B O O K
Profiles OF THE executive
Committee members
4
African Securities Exchanges Association
Sunil Benimadhu
Sunil Benimadhu has been in
office as Chief Executive of the
Stock Exchange of Mauritius
(SEM) since May 1998 after
having held various positions in
the Securities Industry.
Sunil has played an instrumental role in uplifting the operational, technical and regulatory infrastructure
of the SEM and contributed to its emergence as one of the leading Exchanges in Africa. Sunil is
currently the President of the African Securities Exchanges Association (ASEA) an association of
23 Exchanges operating on the continent. Sunil is a regular speaker on emerging markets and on
African markets in international stock exchange conferences.
Before joining the Stock Exchange of Mauritius, Sunil Benimadhu worked in the Treasury Department
of the African Development Bank (ADB) from February 1997 to April 1998, where he managed the
Bank’s assets on international fixed-income markets. Sunil Benimadhu was the General Manager
of the National Mutual Fund Limited between December 1992 and February 1997. He played an
instrumental role in the structuring, marketing and setting up of the National Investment Trust Limited,
one of the largest investment trusts listed on the Stock Exchange of Mauritius.
Sunil Benimadhu holds a MBA in Finance and Investment from the University of Illinois, United States.
He also holds a D.E.A in Development Economics and a Maîtrise in Macro-Economics from the
University of Aix-Marseille, France.
ASEA
Y E A R B O O K
5
African Securities Exchanges Association
Oscar Onyema
Oscar Onyema is the Chief
Executive Officer of The
Nigerian Stock Exchange,
a position he assumed in
April 2011.
Oscar Onyema is the Chief Executive Officer of The Nigerian Stock Exchange, a position he
assumed in April 2011. Prior to this role, he served for over 20 years in United States financial
markets and the Nigerian information technology sector. Mr. Onyema is the Chairman of Central
Securities Clearing System (CSCS) Limited, the clearing house for the Nigerian capital market; he
is also a Council member of the Chartered Institute of Stockbrokers of Nigeria (CIS). He is the Vice
President of the African Securities Exchanges Association (ASEA) and Chairman of the West African
Capital Markets Integration Council (WACMIC).
ASEA
Y E A R B O O K
In 2009, Mr. Onyema founded Market Strategists LLC and consulted under the Gerson Lehrman
Group in the United States, successfully enabling decision-makers at investment firms and
corporations better understand financial products, services, companies, and issues in global
financial markets. Mr. Onyema served as the Senior Vice President and Chief Administrative Officer
at American Stock Exchange (Amex), which he joined in 2001. He was the first person of colour
to hold that position, and was instrumental in integrating the Amex equity business into the NYSE
Euronext equity business after their acquisition of Amex in 2008. He then managed the NYSE
Amex equity trading business, which he helped position as a premier market for small and mid-cap
securities.
6
For approximately five years, Mr. Onyema served as Adjunct Lecturer of Economics at Pace
University, New York. In 2008, he received the Financial Industry Regulatory Authority (FINRA)
Series 7, 24 and 63 brokerage licenses through Seamount Execution Services LLC, a FINRA
member firm in New York. He remains active in the Security Traders Association of New York, and
in the Securities Industry and Financial Markets Association, USA. In the late 1990s, he held various
positions at New York Mercantile Exchange where he managed futures market structure initiatives.
He started his post-NYSC career in Nigeria at Data Processing Maintenance and Services Ltd. (an
IBM business partner) where he sold mid-range IBM systems.
EDUCATION
Mr. Onyema holds an MBA in Finance and Investments from Baruch College, New York. He received
his Bachelor’s degree in Computer Engineering from Obafemi Awolowo University, Ile-Ife, Nigeria.
African Securities Exchanges Association
Geoff Rothschild
Geoff Rothschild is a past
Chairman of the JSE and was
a member of the board from
1991 - 2008
Geoff Rothschild is a past Chairman of the JSE and was a member of the board from
1991 - 2008. Geoff currently holds the position of Head: Government and International
Affairs promoting the JSE. After qualifying as a Chartered Accountant he spent 30 years in
the stockbroking industry with Sasfin Frankel Pollak Securities. Initially he was in charge of
administration, followed by the positions of Financial Director, Joint Managing Director and
finally Marketing Director.
The positions he holds:On African related bodies are:
•
•
•
•
•
•
•
•
•
•
Executive Committee member of the African Securities Exchange Association (ASEA);
The JSE’s Representative on the Committee of SADC Stock Exchanges (CoSSE);
Director of the NEPAD Business Foundation and Chairman of their Operating Committee;
Council Member of the National Advisory Council for Innovation (NACI), which advises the
Minister of Science and Technology
An Honorary Fellow of the Da Vinci Institute of Technology
Trustee of Brand South Africa
An Adviser to Brand Africa
Director on the NOAH (Nurturing Orphans of Aids for Humanity) Board
Patron of Education Africa (EA)
Patron of The Nelson Mandela Children’s Hospital (NMCH)
In addition, he also assists various charitable organisations such as CHOC.
ASEA
Y E A R B O O K
7
African Securities Exchanges Association
Ekow Afedzie
Ekow Afedzie is also a
member of The Chartered
Institute of Marketing, Ghana.
Ekow Afedzie is currently the Deputy Managing Director of the Ghana Stock Exchange. He
was educated at the University of Ghana, Legon, where he obtained a Master’s Degree in
Business Administration and an MA in Economic Policy Management. He is also a member of
The Chartered Institute of Marketing, Ghana.
He joined the Ghana Stock Exchange in 1990 when it was established and has served as the
Head of Marketing, Research and Systems, then the General Manager before becoming the
Deputy Managing Director of the Exchange. He is the immediate past Vice President of the
African Securities Exchanges Association (ASEA) and currently a member of the Executive
Committee of ASEA.
ASEA
Y E A R B O O K
Mr. Afedzie has also made contributions to local and international research on stock markets,
and presented papers on stock market operations at many local and international fora. He
serves on the Board of the GSE Securities Depository Company Ltd. as well as a member of
the Ghana Alternative Market (GAX) Governing Committee.
8
African Securities Exchanges Association
Peter Mwangi
Peter Mwangi is the
Chief Executive of the Nairobi
Securities Exchange.
He is also a Director of the
Central Depository and
Settlement Corporation in
Kenya
Peter Mwangi is the Chief Executive of the Nairobi Securities Exchange. He is also a director
of the Central Depository and Settlement Corporation Ltd in Kenya, and a Member of the
Executive Committees of the African Securities Exchanges Association (ASEA) and the East
African Securities Exchanges Association (EASEA).
Before joining the Exchange, Peter was the Managing Director of Centum Investment Company
Ltd, the largest publicly quoted investment company in the East African region, from 2004 to
2008. He started his career in the Kenya Air Force where he worked for 5 years and left having
attained the rank of Captain.
Peter holds a Bachelor of Science Degree in Electrical Engineering from the University of Nairobi.
He is a member of the CFA Institute, the CFA Society East Africa, Institute of Certified Public
Accountants of Kenya, Institute of Certified Public Secretaries of Kenya, Institute of Directors of
Kenya and the Kenya Institute of Management.
ASEA
Y E A R B O O K
9
African Securities Exchanges Association
Karim Hajji
Karim Hajji is the CEO of the
Casablanca Stock Exchange,
one of the largest exchange
in Africa, and a member
of the World Federation of
Exchanges.
Karim Hajji is the CEO of the Casablanca Stock Exchange, one of the largest exchange in
Africa, and a member of the World Federation of Exchanges. In 2011, he joined the HOPE
Global Board of Advisors and was appointed Chairman of the Executive Committee of the
Association of African French speaking Exchanges.
ASEA
Y E A R B O O K
Prior to joining CSE in April 2009, he was Chairman and CEO of Atlas Capital Group, a
well respected, independent investment bank, active in both corporate finance and asset
management, which he had founded in 1999. After an 8 year international career at Eli Lilly and
Co in the US then in Italy and Switzerland, he had joined the ONA Group, Morocco’s largest
conglomerate, in 1990 as advisor to the Chairman, then General Manager of an affiliate in
Monaco and finally Group CFO in 1994. Karim Hajji holds an MBA from New York University’s
Stern School, a diploma from “Institut d’Etudes Politiques de Paris” and a Master’s degree in
capital markets from the University of Paris-IX Dauphine.
10
African Securities Exchanges Association
Mohamed Omran
Mohammed Omran is the
Chairman of the Egyptian
Exchange and Professor of
Finance at the Arab Academy
for Science and Technology.
The Chairman of the Egyptian Exchange and Professor of Finance at the Arab Academy for
Science and Technology. Prior to his current job, he served as a Vice Chairman for Operation
of the Insurance Holding Company for one year and a Vice Chairman of the Egyptian Exchange
for four years from 2006-2010. Professor Omran holds an MSc from Cairo University and
Ph.D. in Finance from the University of Plymouth. UK.
He was a visiting Professor in several research and academic institutions such as University of
Plymouth, University of Oklahoma, the World Bank, University of Laval, and Vaasa University.
He served several years as an Economist at both the Arab Monetary Fund in Abu Dhabi and
the International Monetary Fund in Washington D.C. He was an advisor to the Minister of
Investment and an Acting Executive Director of the Egyptian Institute of Directors. Professor
Omran had been awarded several research grants and prizes, and he was a Fullbright Scholar
and he is a Research Fellow at the Economic Research Forum.
ASEA
Y E A R B O O K
He served as reviewer for more than a dozen of Economics and Finance Journals. Professor
Omran specializes in financial markets, corporate governance, corporate finance and
privatization concentrating on the MENA region. He authored and co-authored around
40 papers and his work appears in several international Economics and Finance Journals
such as: Journal of Financial Research, Journal of Comparative Economics, Journal of
International Financial Markets, Institutions and Money, World Development, International
Review of Law and Economics, Multinational Finance Journal, International Review of
Financial Analysis, Journal of Investing, Emerging Market Review, International Journal
of Business, Review of Accounting and Finance, International Journal of Theoretical and
Applied Finance, and Global Finance Journal
11
African Securities Exchanges Association
Innocent D. Dankaine
Innocent D. Dankaine is the
Acting Chief Executive and
Head of Products & Markets
at the Uganda Securities
Exchange
Innocent D. Dankaine is the Acting Chief Executive and Head of Products & Markets at the
Uganda Securities Exchange, where among other duties he is responsible for raising the public
profile of the exchange, increasing trading revenues, and multiplying the number of securities
holders actively participating in the market.
Until June 2012, Mr. Dankaine served as Finance and Investment Manager of National Housing
& Construction Co. Ltd., where he was responsible for developing financing solutions, evaluation
and risk management for projects worth US$ 100 million.
He also served as Assistant Manager – Financial Services Audit with PriceWaterhouseCoopers
in Dublin, Ireland, and as an audit executive in the Financial Services department of the UK firm
of Ernst & Young LLP.
ASEA
Y E A R B O O K
Mr. Dankaine received a Bachelors degree in Commerce (accounting) from Makerere University
with Honors. He is a member of the Institute of Certified Public Accountants of Uganda and is
also a Certified Chartered Accountant (UK).
12
African Securities Exchanges Association
ASEA
Y E A R B O O K
13
African Securities Exchanges Association
botswana stock exchange
profile
Website
Market Regulator
ASEA
Y E A R B O O K
Address
14
www.bse.co.bw
Non-Bank Financial Institutions Regulatory
Authority (NBFIRA)
Exchange House, Plot 64511, Fairgrounds,
Private Bag 00417, Gaborone
Trading Session hours (local time)
10h30 - 13h30 (Official Trading Hours)
Time Zone
GMT +2
Contact Person for ASEA
Tapiwa Tamocha
Telephone
(+267) 367 4400
Fax
(+267) 318 0175
E-mail
[email protected]
Name of Local Currency
Pula (BWP)
Tax Rates (dividends, interest, capital gains)
7.5% withholding tax on dividend,10% on
Interest,
Listing of Foreign Domiciled Companies
Available
Commodities Exchange
Not available
African Securities Exchanges Association
BOTSWANA STOCK EXCHANGE
OVERVIEW
The Botswana Stock Exchange (BSE) is Botswana’s national stock exchange given the
responsibility to operate and regulate equity and the fixed interest security market. Formally
established in 1989, the BSE trace its humble beginnings to when it was known as Botswana
Share Market (BSM).At that time there was no formal stock exchange in Botswana and the
BSM traded as an informal market. There were only 5 listed entities with a single broking firm
i.e. Stock Brokers Botswana Ltd (SBB), which was also charged with facilitating trading on
the exchange via the matching of orders. In order to encourage foreign investors to Botswana
an interim exchange committee was set up in October 1990 with representatives from the
private and public sector, including the secretary of the Zimbabwe Stock Exchange, the chief
executive of SBB, the permanent secretary of the ministry of finance, and the Deputy Director
of the Bank Supervision. The committee had the power to list and to de-list a stock, and was
also responsible for ensuring that the BSE traded ethically [Ruben Lee, 1998]. The necessity to
detach the running of the exchange from the broking business set in motion a process for the
establishment of an independent exchange.
In September 1994, the legislation to transform the BSM into a full exchange was passed by
Parliament paving the way for the establishment of the Botswana Stock Exchange (BSE) where
trading opened in November 1995. In March 1998, Ernst and Young took the full administration
of the BSE. With effect from July 2001, a full time Chief Executive Officer was appointed with
the aim of making the BSE completely independent. In April 2003, in order to better execute the
affairs of the Exchange, better serve stakeholder, and be more responsive to global events and
to remain competitive, the BSE discontinued the secretarial role of Ernst and Young Botswana
to become a fully independent entity.
The BSE continues to be pivotal to Botswana’s financial system, and in particular the capital
market, as an avenue on which government, quasi- government and the private sector can
raise debt and equity capital. The BSE plays host to the most pre-eminent companies doing
business in Botswana. These companies represent a spectrum of industries and commerce;
these are Banking, Financial Services, Wholesaling and Retailing, Tourism, Energy, Funeral
Services, Property, Security and Information Technology. Currently, there are 35 listed entities
in the BSE and comprise of 23 domestic and 12 foreign companies.
BOTSWANA STOCK EXCHANGE REGULATORY ENVIRONMENT
The main law which governs all the activities between the Exchange and its members, the
proceedings of the Main Committee and its composition; the relationship between the Minister
and the Exchange together with the relations between the Registrar, is the Botswana Stock
Exchange Act No 11of 1994. The BSE is regulated by the Non Banking Financial Institutions
Regulatory Authority.
ASEA
In addition, the Exchange has a set of Listing Requirements which provide the pre-listing
Y E A R B O O K
The members have promulgated Rules (Member Rules) which provide the requirements to
be fulfilled for the securities listed and traded on the Exchange. Members Rules provide as
the main objective thereof, “to operate a Stock Exchange in Botswana with due regard to the
public interest to maintain fair and efficient dealing in securities for the protection of investors
and regulate the affairs of members”.
15
African Securities Exchanges Association
requirements and post listing requirements to be observed by the issuers of listed securities.
The emphasis is to make sure issuers disclose as much information to the public and investors
so that the latter can make informed investment decisions.
OUR PRODUCTS
The BSE aim to become a financial supermarket ,meaning it aims to provide the right kind of
products to suit investor and issuer so that it meet growing customer demands and challenges
of the globalisation of financial markets. This can be done through product innovation and
diversification. Current products that can be listed include Equities, Corporate Bonds,
Government Bonds, Exchange Trade Products and Commercial Papers while products being
developed are Global Depository Receipts, Securitised Products and Derivatives.
HIGHLIGHTS
•
•
•
•
•
•
•
•
•
DCI appreciated by 20.5 %
Record turnover of P2.3 Bn achieved
Trading Rules for both Equity and Debt Instruments in final stages of review
Regular trading sessions in the ATS extended by a total of 1 hour, from 1hour 45minutes to
2 hours 45 minutes
Shumba Coal listed on the Foreign Venture Board through private placement
BSE launched 3 bond indices, the GovI, CorpI and the BBI (Composite)
Botswana Bond Market Association (BBMA) officially registered
Botswana Bond Market Association (BBMA) Committee appointed
Number of Accounts opened in CSD increased by 13.5% to 20,027 accounts
ACHIEVEMENTS
The BSE has made progress in achieving strategic objectives as detailed in the BSE’s strategic
plan. A synopsis of progress to date is given below:
1.1 INFRASTRUCTURE DEVELOPMENT
•
•
•
•
•
•
CSD implemented in May 2008, followed by subsequent shares dematerialisation
Electronic CSD account statements launched in 2010
Dematerialisation of bonds into the CSD System commenced in 2011
Automated Trading System (ATS) was implemented in August 2012
More than 20,027 investor accounts opened as at end of December 2013
More than 59.3% of domestic companies were dematerialised as at end of December 2013
ASEA
Y E A R B O O K
1.2 REGULATION
16
• CSD rules drafted by BSE and implemented in 2008
• Settlement cycle of transactions in the BSE reduced from T+5 to T+4, and T+3 effective
2012
• Committee appointed by MFDP to review the draft Securities Bill completed its review and
recommended several amendments which have now been incorporated into the draft bill.
The Securities Bill is expected to be presented to Parliament in the second half of 2014
• Enactment of the Securities Bill will enable BSE to proceed on several development initiatives
which will include the corporatization of the BSE
• ATS Trading Rules for Debt and Equity instruments implemented in 2012
• Trading in the ATS extended by one hour effective 4 November in 2013
African Securities Exchanges Association
1.3 PRODUCT AND MARKET DEVELOPMENT
• Series of road shows targeting retail investors held nationwide to educate general public
about the stock market so to improve retail investor participation on the BSE
• Dual listed the NewGold ETF in July 2010 and the Bettabeta Equally Weighted Top 40 ETF
in May 2011
• Conceptualisation of Contract for Difference (CFDs) approved in 2013
• Three bond indices launched in 2013
• Review of Debt Listing Requirements underway
• Contract negotiation with international data vendors for dissemination of trading data
secured, negotiations with others on-going
1.4 GOVERNANCE STRUCTURE
• BSE Board Charter adopted
• Differentiation between “independent” and “non independent” committee members made
in the constitution of sub-committees
1.5 FINANCIAL RESOURCES
• BSE fees on transactions rationalised to reduce dependence on government subvention as
well as rationalisation of expenditure by benchmarking against other exchanges
• BSE Strategic plan review in progress aimed at Commercialisation of the Exchange
1.
MARKET PERFORMANCE
1.1 Domestic Company Indices
The Domestic Company Index (DCI) closed the year at 9,053.4 points, its highest level since
21 November 2007, recording an increase of 20.5%. This is the highest annual appreciation
in the DCI since 2007. The performance of the DCI in 2013, overshadowed its performance in
2012 when the DCI appreciated by 7.7%. The DCI signalled a recovery from the effects of the
financial crisis in 2008 when it registered a positive growth in 3 consecutive years up to and
including 2013.
The Foreign Company Index (FCI) depreciated by 1.0% in Quarter 1, and by 0.2% in Quarters
2 and 3. The FCI however appreciated by 0.3% in Quarter 4. As at 31 December 2013 the FCI
had declined by 1.0% to close the year at 1,583.5 points compared to a depreciation of 6.1%
in 2012.
Figure 1: Index Performance: 2009 to 2013
2011
6,970.9
8.7
2012
7,510.2
7.7
2013
9,053.4
20.5
1,418.3
19.0
1,673.9
18.0
1,703.9
1.8
1,599.5
(6.1)
1,583.5
(1.0)
ASEA
2010
6,412.9
(11.4)
Y E A R B O O K
DCI
% Change in
DCI
FCI
% Change in
FCI
2009
7,241.9
2.9
Source: BSE
17
African Securities Exchanges Association
The modest appreciation in the DCI towards the end of 2012 resulted in the DCI picking up
momentum in Quarter 1 of 2013, leading to an increase of 11.8%. The DCI further appreciated
by 3.4% in Quarter 2, before experiencing a decline of 1.1% in Quarter 3. In Quarter 4, the DCI
gained 5.3%. The Foreign Resources Sector Index (FRSI) closely reflected the growth pattern
followed by the FCI given that the largest sector included in the FCI is the Resources sector.
Figure 2 : Quarterly Performance of the DCI and FCI: 2013
DCI
% Change in DCI
FCI
% Change in FCI
Quarter 1
8,400.0
11.8
1,584.3
(1.0)
Quarter 2
8,688.5
3.4
1,581.2
(0.2)
Quarter 3
8,594.9
(1.1)
1,578.8
(0.2)
Quarter 4
9,053.4
5.3
1,583.5
0.3
Source: BSE
1.2 MARKET TURNOVER
1.2.1Equity
The year 2013 stands out as the year in which the BSE registered the highest turnover since
its inception in 1989. The amount of turnover in 2013 is almost double the turnover recorded
on the BSE in 2008 (highest up to 2013) and is 2.6 times the turnover in 2012. The volume of
shares traded in 2013 was 1.7 times the volume in 2012. The year 2013 can also be described
as a year in which the stability of turnover continued to improve, albeit marginally.
ASEA
Y E A R B O O K
Figure 3 : Indicators of Liquidity: 2009 to 2013 Indicators
18
Indicators
2009
Turnover
763. 8
(P' Mn)
Average Daily
3.1
Turnover
(P 'Mn)
Turnover/
Average
Market Cap
(%)
Standard
7.7
Deviation
Coefficient
2.5
of Variation
(CoV)
No. of Shares
167.6
Traded (Mn)
2.9
Shares
Traded/
Shares Listed
(%)Note 1
Turnover/ Average Market Cap (%)
2010
962.8
2011
1,007.9
2012
894.7
2013
2,315.4
3.9
4.1
3.6
9.3
8.6
13.5
6.9
15.9
2.2
3.3
1.9
1.7
308.7
458.7
409.9
710.5
3.9
4.8
4.3
6.3
African Securities Exchanges Association
Indicators
Standard
Deviation
Coefficient
of Variation
(CoV)
No. of Shares
Traded (Mn)
Shares
Traded/
Shares Listed
(%)Note 1
2009
7.7
2010
8.6
2011
13.5
2012
6.9
2013
15.9
2.5
2.2
3.3
1.9
1.7
167.6
308.7
458.7
409.9
710.5
2.9
3.9
4.8
4.3
6.3
Note 1: For Domestic Companies and based on average shares traded
Source: BSE
It can be observed that trading activity in terms of volume and value of shares traded was
highest in Quarter 4 in comparison to the other quarters of 2013. The average daily turnover of
P13.8 Mn per day achieved in Quarter 4 of 2013 is the highest turnover achieved in any Quarter
in the history of the BSE. This was largely due to the turnover generated from transactions in
Choppies. Choppies generated a turnover of P204.4 Mn in Quarter 4 through the transaction
of 66.8 Mn shares.
Figure 4 : Quarterly Market Turnover: 2013
Indicators
Turnover (P’ Mn)
Average Daily
Turnover (P ‘Mn)
Turnover/
Average Market
Cap (%)
Standard
Deviation
Coefficient of
Variation
No. of Shares
Traded (Mn)
Shares Traded/
Average Shares
Listed %)Note 1
Quarter 1
Quarter 2
Quarter 3
Quarter 4
250.8
4.1
684.1
11.0
510.4
8.2
870.1
13.8
0.7
1.8
1.1
2.0
6.4
11.8
9.5
23.5
1.6
1.1
1.4
1.7
99.8
229.3
134.5
246.9
0.9
2.0
1.1
2.2
Note 1: For Domestic Companies
Source: BSE
ASEA
Y E A R B O O K
19
African Securities Exchanges Association
1.3 EQUITY MARKET CAPITALISATION
The relative size of domestic companies listed on the BSE continued to improve in 2013.
The BSE’s domestic market capitalisation for equity was P43.5 Bn as at the end of 2013,
an increase of 22.3% in comparison to P35.5 Bn in 2012. The size of domestic companies
relative to the size of the economy, indicated by the ratio of market capitalisation to GDP, also
increased in 2013 to 33.6% from 30.8% in 2012.
Figure 5: Market Capitalization and Relative
Performance: 2009 to 2013
Market
Capitalisation
Domestic
Companies
(P’Mn)
Foreign
Companies
(P’Mn)
Total (P’Mn)
Relative
Performance
Note 1
Domestic
Market Cap/
GDP (%)
Turnover/
Domestic Co
Market Cap
(%)
Turnover/ All
Co Market
Cap (%)
2009
2010
2011
2012
2013
28,536.2
26,245.7
30,694.3
35,530.8
43,457.6
346,001.1
408,380.3
380,909.5
376,818.2
373,132.8
374,537.2
434,626.0
411,603.8
412,349.0
416,590.4
38.0
33.1
28.8
30.8
33.6
2.7
3.5
3.5
2.7
5.9
0.2
0.2
0.2
0.2
0.6
ASEA
Y E A R B O O K
Note 1: Computed using average domestic market capitalisation, average total market
capitalisation and average annual GDP (at current prices) subsequent to the rebasing of
economic statistics by Statistics Botswana
Source: BSE, Statistics Botswana
20
African Securities Exchanges Association
1.4 INDICATORS OF VALUE
Figure 6: Market Indicators for Domestic Companies Listed
on the BSE : 2009 to 2013
Domestic
Companies
Market
indicators
P/E Ratio
(times)
Dividend
Yield (%)
Price/Book
Value (times)
2009
2010
2011
2012
2013
10 YR
AVG
13.5
10.8
10.2
9.2
11.5
12.1
4.3
4.9
5.2
4.9
4.1
5.0
4.8
3.9
2.8
2.5
2.7
5.4
Note: The statistics are based on the most recent audited financial statements
Source: BSE
1.5EXCHANGE TRADED FUNDS
1.5.1Performance of the NewGold ETF
The price of Gold declined gradually from its 2013 high to close the year with a depreciation of
27.8%. The NAV and price on the BSE in Pula terms of the NewGold ETF depreciated by 19.1%
and 17.2% in 2013 respectively. The difference in the depreciation of the BSE price of 17.2%
and the decrease in the NAV (in Pula terms) of 19.1% as at end December 2013 was primarily
due to the manner in which the BSE determines closing price, which is defined as the last
traded price. The NewGold ETF traded 1.2 Mn units for a value of P131.2 Mn, in comparison to
223,026 units with a value of P27.6 Mn in 2012. The ETF was traded at prices ranging between
P100.50 and P130.30 per unit. A record 2.3 Mn units were held in the Botswana register as at
the end of 2013, the highest number of units since the New Gold ETF was listed on the BSE in
July 2010. This increased creation of units underpinned the proportionate increase in volume
and inflows in 2013.
1.5.2 Performance of the BettaBeta ETF
At the end of 2013, the price of the BettaBeta ETF had depreciated by 5.6% on the BSE. The
turnover of the BettaBeta ETF was the lowest since being listed on the BSE. The BettaBeta
ETF traded 20,519 units at prices ranging from P33.55 and P40.60 per unit.
ASEA
Y E A R B O O K
21
African Securities Exchanges Association
1.6
BOND MARKET PERFORMANCE
Debt market turnover decreased substantially in 2013 when compared to 2012. The total value
of debt instruments traded in 2013 amounted to P94.7 Mn, compared to P332.2 Mn in 2012.
The total debt market turnover was accounted for by government bonds. The total number of
bonds listed on the BSE as at the end of 2013 stood at 35, unchanged from 2012. The total
nominal debt market capitalisation of the bonds listed on the BSE amounted to P9.3 Bn in
2013 in comparison to P8.5 Bn in 2012.
2.0 PRIMARY MARKET ACTIVITY
2.1 Equity
On 14 October RDC Properties undertook a share split on a 5 for 1 basis resulting in its
price moving from P7.11 per share to P1.42 per share. Share splits are usually carried out to
improve affordability of the company’s shares making them more marketable while the existing
shareholders retain the same proportion of ownership. As a result of the share split the number
of issued securities increased fivefold. The share split resulted in an appreciation of the price of
RDC Properties by 26.8% between 14 October 2013 and 31 December 2013.
Shumba Coal Limited, a mineral exploration company, listed on the BSE’s Foreign Venture
Capital Board on 8 April 2013. The company listed 168.8 Mn shares at an indicative offer price
of P1.05 per share.
Aviva Corporation and Hana Mining delisted from the BSE’s Foreign Venture Capital Board with
effect from 27 September 2013 and 25 February 2013 respectively.
On the domestic board, RPC Data Limited delisted with effect from 12 December 2013 as the
result of management buyout.
Overall, the BSE listed one company in 2013 in comparison to 3 companies having listed in
2012. Three companies delisted from the BSE in 2013 in comparison to 1 company in 2012.
2.2 Bonds
9.2.1 Government Bonds
On 6 September, the Bank of Botswana (BoB) auctioned P450 Mn worth of bonds, of which
P449 Mn was allotted. In addition to the two bonds, a six month Treasury Bill was issued for a
value of P340 Mn (Treasury Bills are not listed and traded on the BSE at present).
ASEA
Y E A R B O O K
Additional issues were made in respect of 2 existing bonds, BW008 and BW010. The BoB
also issued a new bond (BW011) which will mature on 10 September 2031. Issues in respect
of BW008 and BW010 were fully allotted at P150 Mn and P100 Mn respectively. BoB offered
P200Mn on account of BW011 of which P199.0 Mn was allotted. Overall, the 3 bonds were 3.6
times oversubscribed. The BW009 bond matured on 11 September 2013. BW011 was listed
on the BSE on 29 October 2013.
22
On 6 December 2013, BoB auctioned P840 Mn worth of bonds and the issue was allotted in
full. The auction comprised of 3 bonds on account of BW008, BW010 and BW011 and a 6
month Treasury Bill for P340 Mn. The nominal value in issue of BW008, BW010 and BW011
increased by P150 Mn, P150 Mn and P200 Mn respectively. The bond auction was 2.4 times
oversubscribed.
African Securities Exchanges Association
9.2.2 Corporate Bonds
On 6 December 2013, Furnmart Limited listed a bond (FML025) with a nominal value of P150
Mn. FML025 is a 12 year bond maturing on 23 October 2025. The bond pays a fixed coupon
of 8.20% per annum payable half-yearly.
Letshego issued and listed 4 bonds with semi-annual coupon payments on 8 November 2013.
The issues are detailed in Figure 7.
Figure 48: Corporate Bonds Listed by Letshego in 2013
Bond Code
LHL005
LHL006
LHL007
LHL008
Source: BSE
Amount Issued
(BWP)
50,000,000
200,000,000
75,000,000
25,000,000
Maturity ( Years)
4
10
12
14
Coupon Payment
(%)
8.25
10.50
10.50
11.00
Stanbic Bank Botswana redeemed three bonds in issue by exercising call options. The
SBBL046, SBBL049 and SBBL052 were redeemed on 11 June, 13 August and 17 December
2013 respectively.
DPCF003 and the SCBB005 matured on 2 June and 27 November 2013 respectively.
ASEA
Y E A R B O O K
23
African Securities Exchanges Association
Statistics
Section One : Economic Indicators
Main Economic Indicators
Currency: USD
Indicators
2010
2011
2012
2013
Population (million)
Real GDP (USD)
(millions) at market
exchange rates
Inflation rate (%)
Net Foreign Direct
Investment (USD)
(Millions)
Unemployment rate
(%)
Interest Rate (T-Bills)
1.82
2.04
2.04
2.13
15683.42
N/A
N/A
N/A
7.4
9.2
7.4
4.1
N/A
N/A
N/A
N/A
17.5
17.8
17.8
17.8
7.15
3.45
5.36
2.84
6.44
7.52
7.40
8.73
Exchange rate (local
currency versus US$)
Section Two: Trading Statistics
Trading equity Statistics
ASEA
Y E A R B O O K
Indicators
Total Value traded $
Total volume traded
Total number of
transactions
Number of listed
companies
Number of traded
companies
Market
Capitalization
(billions) end of year
Market
Capitalization as %
of GDP**
Turnover Velocity
(%) *
24
Currency: USD
2010
149,516,874
308,662,256
4,978
2011
133,968,231
458,706,950
5,045
2012
135,596,598
465,790,767
7,465
2013
265,580,004
710,451,879
1,380,789
32
37
39
35
30.0
37.0
38.0
34.0
67.50
54.70
53.03
47,78
0.30
0.25
0.24
NA
3.7
3.3
2.71
6.6
Turnover Velocity = (Monthly Value Traded Of Listed Shares/Month-End Market Cap) X 12
(Annualized).
African Securities Exchanges Association
Investors Type
Foreigners vs. Local Investors
Type of Investors
Foreign Investors
Local Investors
Total %
2010
Not available
Not available
% Of the Total Value traded $
2011
2012
Not available
Not available
Not available
Not available
2013
33%
67%
100%
Includes brokers but excludes ETFs
Insitutions Vs. Individuals
Institutions
Individuals
Total %
2010
Not available
Not available
2011
Not available
Not available
2012
Not available
Not available
2013
89%
11%
100%
Includes brokers but excludes ETFs
Sectors Traded
Sectors traded on
the Stock Exchange
Domestic Board
Banking
Financial Services
Retail & Wholesaling
Property & Property
Trust
Funeral Services
Security Services
Information Technology
Energy
Tourism
Health
Foreign board
Financial Services
Mining & Minerals
Retail &wholesaling
ETF's
Corporate Bonds
Number Of Companies Included In Each Sector
2010
2011
2012
2013
4
3
5
4
4
3
4
5
4
3
5
5
4
3
5
5
1
1
1
1
2
None
1
1
1
1
3
None
1
1
1
1
3
None
1
1
1
1
3
None
2
7
None
1
26
2
10
None
2
23
2
11
None
2
23
3
11
None
2
26
ASEA
Y E A R B O O K
25
African Securities Exchanges Association
5 Most Active Sectors
#
1
2
3
4
5
Sectors
Financial Services and Insurance
Banking
Retail and Wholesaling
Funeral Services
Property and Property Trust
Section Three: Bonds Statistics
Bonds Statistics
Bonds
Total Value traded $
Value traded on
governmental
bonds ($)
Value traded on
corporate bonds
2010
18,514,274.32
18,259,346.32
2011
43,172,211.08
37,703,202.08
2012
42715664
40,400,864
2013
10,857,454
10,857,454
254,928
5,469,009
2,314,800
-
Section Four: Trading System
Trading System ( Automated Trading System )
Is this system locally developed or bought?
If bought, who is the Vendor?
Year of implementing the system:
Bought
MillenniumIT
8/1/2012
Section Five : Clearing and Settlement
Where do Clearing & Settlement take
place?
26
No
Yes
MillenniumIT
2008
T+ 2
T+ 3
Others
ASEA
Y E A R B O O K
If Separate Company please mention its
name
Is this system locally developed
or bought?
If bought, who is the Vendor?
Year of implementing the system:
Clearing and Settlement is conducted in:
The Stock Exchange Botswana Stock
Exchange
Separate Company Central Securities
Depository Botswana
Central Securities Depository Botswana
N/A
Yes
African Securities Exchanges Association
Section Six : Products traded on the Stock
Exchange
Types of markets in the Stock Exchange
Equity Market
Cash Market
Derivative Market
Bond Market
Yes
N/A
N/A
Yes
Products
Product (Stocks,Bonds, Funds, ETF's,
Derivatives, etc.)
Stocks
Bonds
ETFs
Description of the Product
Ordinary shares
Government and corporate bonds
Gold Bullion Exchange Traded Fund + index
based ETF
Section Seven: Trading Mechanism
Margin Trading
Intraday Trading
Online Trading
No
Yes
Yes
Section Seven: Indices
Indices
Index Name
Domestic company index
Foreign company index
Domestic Company Index
Foreign Company Index
Index Type (Price Index, Sector Index,..etc)
Price Index
Price Index
Closing 2012
7,510.24
Closing 2013
9,053.36
% change
20.55%
1,599.53
1,583.45
-1.01%
ASEA
Y E A R B O O K
27
African Securities Exchanges Association
Section Eight : IPOs
2012
Company
Date of IPO
Choppies
26-January
2012
2012
Value of IPO
($ Million)
6.84
Company Date of Issue Face Value of
Issue
($Million)
None
2013
Company
Date of IPO
Shumba
8-April-2013
2013
Value of IPO
($ Million)
20.67
Company
Date of Issue
BW011
FML015
LHL005
LHL006
LHL007
LHL008
6-Sep-2013
18-Oct-2013
11-Aug-2013
11-Aug-2013
11-Aug-2013
11-Aug-2013
Face Value
of Issue
($ Million)
45.85
5.93
5.91
23.64
8.87
2.96
Section Nine : 2013 Rankings of Top 5 Trading
Participants
Ranking
1
2
3
4
Stock brokerage Units
Stockbrokers Botswana
Motswedi Securities
Capital Securites
African Alliance Botswana
Purchases
$
N/A
N/A
N/A
N/A
Sales
$
N/A
N/A
N/A
N/A
ASEA
Y E A R B O O K
Members’ Contacts are available on the BSE website www.bse.co.bw
28
Total
$
N/A
N/A
N/A
N/A
African Securities Exchanges Association
bourse regionale des valeurs
mobilieres stock exchange
BOURSE REGIONALE DES VALEURS MOBILIERES
Afrique de l’Ouest
Website
Market Regulator
Address
www.brvm.org
Conseil Régional de l'Epargne Publique et des
Marchés Financiers
18 Avenue Joseph Anoma, 01 BP 3802
AbidJanuary 01
Trading Session hours (local time)
Preopen: 8:30am - 10:30am; Fixing: 10:45am
Time Zone
Greenwich Mean Time + 0 hours
Contact Person for ASEA
Edoh Kossi Amenounve, CEO
Telephone
+225 20 31 55 59
Fax
+225 20 32 66 84
E-mail
[email protected]
Name of Local Currency
(XOF) FCFA
Tax Rates (dividends, interest, capital gain)
Dividend withholding taxes 10%
Listing of Foreign Domiciled Companies
Company must register in WEST AFRICAN
ECONOMIC AND MONETARY UNION
-WAEMU - Registrar of Companies. If already
listed, it must get a letter of comfort from its
listing authority
Commodities Exchange
N/A
ASEA
Y E A R B O O K
29
African Securities Exchanges Association
The History of the Cape Verde Stock Exchange
• Created in 1998 and became fully functional in December 2005
• Orden Quote Driven and POS - Light, SifoxDeal and SifoxBackOffice technology platforms
put in use in 2005
• 2009- About 94% of all credit granted to the national economy originated from the BVC,
through various emissions carried out.
• 2010- First time issuance of Municipal bonds for the municipalities of Sal and Praia
• 2011- Current market capitalization is approximately $273,277,594.92 (USD); Capitalization
is at 20% of the gross domestic product, according to data from the Bank of Cape Verde.
• Thirty (30) active securities, including: 4 listed companies in the shares segment and 26 in
the bonds segment (16 corporate bonds, 8 Treasury bonds and 2 municipal bonds)
•
Par tnerships with Euronext Lisbon, with the Central Clearing and Depository,
Interbolsa, which is a subsidiary of Euronext Lisbon, with Caixa de Crédito Agrícola and
with Instituto Superior de Economia e Gestão (ISEG) da Universidade Técnica de Lisboa.
•
cy
2012 – Protocols with Secondary schools and Universities regard Financial litera-
•
New Code of Securities Market, after 14 year since entry in force of the original
Code
•
Release of New Circular – Circular nº3/2012 regard to the Code of Conduct
•
With Regard to the Market Capitalization, currently, it represents five times more
the amount in the reopening in
2005
ASEA
Y E A R B O O K
•
With regard to transactions, taking into account the high issuance of treasury
bonds, the volume of transactions have nearly tripled. A relevant indicator of trend and
impact that market will have, knowing the envisage deployment of Platform Auction
trading of treasury bonds in the Capital Market
30
African Securities Exchanges Association
Statistics
Section One : Economic Indicators
Main Economic Indicators
Currency: USD
Indicators
2010
2011
2012
2013
Population (million)
Real GDP (USD)
(millions) at market
exchange rates
Inflation rate (%)
Net Foreign Direct
Investment (USD)
(Millions)
Unemployment rate
(%)
Interest Rate (T-Bills)
97.05
98.60
101.23
103.25
65,818.78
72,234.16
70,145.67
77,913.58
1.40
3.90
2.30
2.20
1950.72
N/A
N/A
N/A
N/A
N/A
N/A
N/A
N/A
N/A
N/A
N/A
497.97
456.62
497.58
474.85
Exchange rate (local
currency versus US $)
Source: BCEAO (2013 E)
Section Two : Trading Statistics
Trading equity Statistics
Currency: USD
2010
130,847,082
28,275,804
21,522
2011
129,114,703
18,066,088
18,683
2012
174,171,421
37,311,162
29,657
2013
296,791,113
60,754,359
33,906
39
39
37
37
39
39
37
37
6.97
6.96
8.10
11.86
10.59%
9.63%
11.55%
0.15
1.88%
1.86%
2.15%
2.50%
ASEA
# Number of companies which have shares listed on an exchange at the end of the period
* Turnover Velocity = (Monthly value traded of listed shares/month-end market cap) x 12
(annualized).
Y E A R B O O K
Indicators
Total Value traded $
Total volume traded
Total number of
transactions
Number of listed
companies #
Number of traded
companies
Market
Capitalization
(billions) end of year
Market
Capitalization as %
of GDP
Turnover Velocity
(%) *
31
African Securities Exchanges Association
Investors Type
Foreigners vs. Local Investors
Type of Investors
Foreign Investors
Local Investors
Total %
% of the Total Value traded $
2011
2012
N/A
N/A
N/A
N/A
N/A
N/A
2010
N/A
N/A
N/A
2013
N/A
N/A
N/A
institutions vs. individuals
Institutions
Institutions
Individuals
Total %
2010
N/A
N/A
N/A
2011
N/A
N/A
N/A
2012
N/A
N/A
N/A
2013
N/A
N/A
N/A
Sectors Traded
Sectors traded on
the Stock Exchange
ASEA
Y E A R B O O K
(Equity Market and
1st & 2nd board)
Industry
Public utilities
Financial
Transportation
Agricultural
Distribution
Other sectors
Bond Market
WAEMU countries
Bonds
Institutional Bonds
32
Number Of Companies Included In Each Sector
2010
2011
2012
2013
13
4
8
2
4
7
1
13
4
8
2
4
7
1
12
4
8
2
4
6
1
12
4
8
2
4
6
1
6
8
9
12
8
6
8
6
African Securities Exchanges Association
5 Most Active Sectors
#
1
2
3
4
5
Sectors
Financial
Public utilities
Agricultural
Industry
Distribution
Section Three: Bonds Statistics
Bonds Statistics
Bonds
Total Value traded $
Value traded on
governmental
bonds
Value traded on
institution bonds
Value traded on
corporate bonds
2010
48,494,658
2011
37,166,743
2012
38,854,098
2013
38,712,500
47,261,106
34,766,384
29,021,081
30,888,247
61,042
323,276
1,397,718
4,569,765
1,172,510
2,077,083
8,435,299
3,254,489
Section Four : Trading System
Is this system locally developed or bought?
If bought, who is the Vendor?
Year of implementing the system:
Bought
NOVITA
2012
ASEA
Y E A R B O O K
33
African Securities Exchanges Association
Section Five : Clearing and Settlement
Where do Clearing & Settlement take
place?
If Separate Company please mention its
name
Is this system locally developed
or bought?
If bought, who is the Vendor?
Year of implementing the system:
Clearing and Settlement is conducted in:
The Stock Exchange
Separate Company
Yes
Dépositaire Central / Banque de Règlement
(DC/BR)
No
Yes
PERCIVAL Limited
1998
T+ 2
T+ 3
Others
Yes
Section Six : Products traded on the Stock
Exchange
Equity Market
Cash Market
Derivative Market
Bond Market
Yes
Yes
Products
Product (Stocks,Bonds,
Funds, ETF's, Derivatives, etc.)
Shares
Rights
Bonds
Common Shares
Rights
Government - Corporate - Institution Bonds
Section Seven : Trading Mechanism
ASEA
Y E A R B O O K
Margin Trading
Intraday Trading
Online Trading
34
Yes
African Securities Exchanges Association
Section Seven : Indices
Please specify the main indices used by your Stock Exchange and the description of each:
Indices
Index Name
BRVM 10
BRVM Composite
BRVM Financial
BRVM Public utilities
BRVM Agricultural
BRVM Industry
BRVM Distribution
BRVM 10
BRVM Composite
Index Type (Price Index, Sector Index,..etc)
This index reflects the performance of the 10
most active securities on the BRVM.
The BRVM Composite is calculated using the
capitalisation of all equities listed on the BRVM.
The BRVM Financial Index is calculated using
the capitalisation of all equities listed on the
finacial sector.
The BRVM Public utilities Index is calculated
using the capitalisation of all equities listed on
the Public utilities sector.
The BRVM Agricultural Index is calculated using
the capitalisation of all equities listed on the
agricultural sector.
The BRVM Industry Index is calculated using the
capitalisation of all equities listed on the Industry
sector.
The BRVM Distribution Index is calculated using
the capitalisation of all equities listed on the
Distribution sector.
Closing 2012
184.04
Closing 2013
246.34
% Change
33.85
166.58
232.02
39.28
ASEA
Y E A R B O O K
35
African Securities Exchanges Association
Section Eight : IPOs
EQUITY ISSUES
Company
Bank Of Africa
Cote D'ivoire
Bank Of Africa
Burkina Faso
Total
2010
Date of Issue
Value of Issue ($ million)
April 07, 2010
33.94
December 30, 2010
40.15
74.09
2011
Company
Date of Issue
Value of Issue ($ million)
None
None
None
2012
Company
Date of Issue
Value of Issue ($ million)
None
None
None
ASEA
Y E A R B O O K
2013
36
Company
Date of Issue
Value of Issue ($ million)
None
None
None
African Securities Exchanges Association
RIGHTS ISSUES
2010
Company
Bank Of Africa NIGER
Bank Of Africa NIGER
Date of Issue
Value of Issue ( $ million )
June 04, 2010
August 03, 2010
6.29
0.74
Total
7.03
2011
Company
Date of Issue
Value of Issue ( $ million )
Bank Of Africa
BURKINA FASO
Bank Of Africa
BURKINA FASO
Bank Of Africa NIGER
June 15, 2010
2.41
October 05, 2010
0.66
October 31, 2010
0.73
December 15, 2011
7.01
Bank Of Africa
COTE D'IVOIRE
Total
10.82
2012
Company
None
Date of Issue
Value of Issue ( $ million )
None
None
2013
Company
Bank Of Africa NIGER
Date of Issue
Value of Issue ( $ million )
October 1st, 2013
0.89
Section Eight : debt securities
2010
Issuer
Government of Côte
d'Ivoire Treasury Bond
Port Autonome de
Dakar
Total
Date of Issue
Value of IPO ($ million)
September 17 2010
130.05
November 30 2010
20.08
150.13
ASEA
Y E A R B O O K
37
African Securities Exchanges Association
2011
Issuer
ASEA
Y E A R B O O K
Ecowas Bank For
Investment And
Development
Palm Ci
Port Autonome De Côte
D'ivoire
Government Of Sénégal
Treasury Bond
Government Of Côte
D'ivoire Treasury Bond
Government Of Togo
Treasury Bond
Government Of Côte
D'ivoire Treasury Bond
38
Date Of Issue
Value Of IPO ($ Million)
18th January 2011
91.98
19 January 2011
32.85
27 January 2011
65.70
31 January 2011
168.19
7 February 2011
50.18
9 August 2011
131.40
19 December 2011
350.92
African Securities Exchanges Association
2012
Issuer
Government of Burkina
Faso Treasury Bond (*)
Government of Bénin
Treasury Bond (*)
West African
Development Bank
Government of Côte
d'Ivoire Treasury Bond
Regional Fund for
Mortgage Re- financing
(CRRH-WAEMU)
Government of Côte
d'Ivoire Treasury Bond
Banque de l'Habitat du
Benin
Bank Of Africa
Burkina Faso
Bank Of Africa
Côte d'Ivoire
Bank Of Africa Niger
Bank Of Africa Sénégal
Government of Senegal
Treasury Bond
Regional Fund for
Mortgage Re- financing
(CRRH-WAEMU)
Date of Issue
Value of IPO ($ million)
9 February 2012
121.79
28 February 2012
138.29
29 February 2012
87.16
22 May 2012
144.59
6 August 2012
25.12
14 September 2012
188.28
4 October 2012
4.02
4 October 2012
8.04
4 October 2012
8.04
4 October 2012
4.02
4 October 2012
4.02
7 December 2012
177.06
19 December 2012
37.18
(*) Issued in 2011
ASEA
Y E A R B O O K
39
African Securities Exchanges Association
2013
Issuer
Government of
Côte d'Ivoire
TreasuryBond
Government of Senegal
Treasury Bond
SIFCA
Regional Fund for
Mortgage Re- financing
(CRRH-WAEMU)
Government of Burkina
Faso Treasury Bond
ORAGROUP
Government of Côte
d'Ivoire Treasury Bond
Date of Issue
Value of IPO ($ million)
28 June 2013
254.57
22 July 2013
140.96
31 July 2013
73.71
18 October 2013
42.54
14 November 2013
256.08
27 November 2013
45.32
28 November 2013
205.72
Section Nine : 2013 Rankings of Top 5 Trading
Participants
Ranking
1
Stockbrokerage Units
N/A
Purchases
Sales
Total
$
$
$
ASEA
Y E A R B O O K
Members’ Contacts are available on the BRVM website
40
African Securities Exchanges Association
Bourse de Tunis stock exchange
profile
Website
www.bvmt.com.tn
Market Regulator
Conseil du Marché Financier (CMF) / Financial Market Council
34 Avenue de la Bourse, les Jardins du Lac, Les Berges du Lac
II, 1053, Tunis, Tunisia
Address
Trading Session hours
(Local time)
Fixing Trading:
Continuous Trading:
9:00 am-10:00 am:
First Pre-opening
09:00 am - 10:00 am:
Pre-opening
10:00 am : First Opening
10:00 am : Opening
10:00 am-11:30 am:
Second Pre-opening
10:00 am - 02:00 pm:
Continuous trading
02:00 pm - 02:05 pm:
Closing auction
11:30 am: Second Opening
11:30 am - 01:00 pm:
Third Pre-opening
02:05 pm: Opening
01:00 pm: Third opening
02:05 pm- 02:10 pm:
Trading at last price
01:00 pm - 01:05 pm:
Trading at last price
02:10 pm: Closing
01:05 pm: Closing
Time Zone
Greenwich Mean Time + 1 hour
Contact Person for ASEA Lotfi Khezami
Telephone
00 216 71 197 910
Fax
00 216 71 197 903
E-mail
[email protected]
Name of Local Currency
TND (Tunisian Dinar)
ASEA
Y E A R B O O K
41
African Securities Exchanges Association
1- Dividends are exempted, but
for natural persons are taxed of
5% and abtment of
TND 10 000.
2- Bonds' interests are subject
to withholding tax of 20%.
3- Capital gains are taxed when
equities bought at year N are
sold before year N+2:
* For local natural persons,
capital gains are subject to tax
rate of 10%, after deduction
of capital loss recorded during
the same year and abatment of
TND 10 000.
Tax Rates (dividends,
interest, capital gain)
* For local corporate entities,
capital gains are taxed in the
case of corporate's profit and
after deduction of capital loss
* For foreign natural person,
capital gains are subject to
withholding tax of 10% with a
maximum limit of 2,5% of sale
price
* For foreign coroporate entity,
capital gains are subject to
withholding tax of 30% with a
maximum limit of 5% of sale
price
ASEA
Y E A R B O O K
Foreign investors can opt for
tax return to benefit from the
deduction of capital loss and
abatment, like local investors.
42
Listing of Foreign
Domiciled Companies
No
Commodities Exchange
No
African Securities Exchanges Association
Statistics
Section One : Economic Indicators
Main Economic Indicators
Indicators
2009
2010
2011
2012
2013
Population (million)
Real GDP (USD)
(millions) at market
exchange rates *
Inflation rate (%)
Net Foreign Direct
Investment (USD)
(Millions)*
Unemployment rate
(%) *
Interest Rate (T-Bills)
10.44
10.55
10.67
10.78
10.89
44,618.31
44,176.92
3.50
4.40
3.50
5.60
6.10
1,729.83
1,505.67
1,077.77
1,932.22
1,275.28
13.30%
13.00%
18.90%
17.02%
15.70%
4.18%
4.87%
3.28%
4.16%
4.24%
1.3173
1.4379
1.4993
1.5506
1.6467
Exchange rate (local
currency versus US$)
43,600.35 45,994.32
47,123.40
* Estimated value for 2012
ASEA
Y E A R B O O K
43
ASEA
44
14.02%
Turnover Velocity (%) *
17.18%
24.11%
10.63
56
56
629,488
271,666,075
1,826,390,755.96
2010
10.87%
22.50%
9.64
57
57
448,872
252,692,067
1,048,193,427.60
2011
14.10%
19.32%
8.89
59
59
569,403
240,522,983
1,253,082,047.59
2012
2013
10.88%
18.2%
8.56
68
71
513,099
238,674,931
884,953,500.33
* Estimated value * Turnover Velocity%(2013) = (Monthly Share Value Traded/Month-End Market Capitalization) x 12 (annualized)
22.90%
Market Capitalization
as % of GDP *
52
Number of traded
companies
9.28
52
Number of listed
companies
Market Capitalization
(billions) end of year
394,137
189,343,003
Total volume traded
Total number of
transactions
1,301,594,847.04
2009
Total Value traded $
Indicators
Trading equity Statistics
Section Two : Trading Statistics
Y E A R B O O K
African Securities Exchanges Association
African Securities Exchanges Association
Investors Type
Foreigners vs. Local Investors
Type of Investors
Foreign Investors
Local Investors
Total %
2009
12.00%
88.00%
100%
% of the Total Value traded $
2010
2011
2012
10.00%
11.30%
6.30%
90.00%
88.70%
93.70%
100%
100%
100%
2013
12.10%
87.90%
100%
Insitutions Vs. Individuals
Institutions
Individuals
Total %
N/A
N/A
N/A
N/A
N/A
N/A
N/A
N/A
N/A
NA
N/A
N/A
NA
N/A
N/A
Sectors Traded
Sectors traded on the
Stock Exchange
Domestic Board
Finance
Telecommunication
Consumer services
Health
Consumer Goods
Industry
Basic materials
Oil and gas
Technology
Foreign board
Corporate Bonds
Number of Companies Included In Each Sector
2009
52
22
2
6
2
8
7
4
1
2010
56
25
2
6
2
8
8
4
1
None
142
None
159
2011
57
24
2
6
2
9
8
4
1
1
None
168
2012
59
24
2
6
2
9
9
4
1
2
None
173
2013
71
26
2
8
2
13
12
4
1
3
None
197
* Specify the sector and the number of companies in each
ASEA
Y E A R B O O K
45
African Securities Exchanges Association
5 Most Active Sectors
#
1
2
3
4
5
Sectors
Industry
Consumer Goods
Finance
Consumer services
Telecommunication
Section Three: Bonds Statistics
Bonds Statistics
Bonds
2009
2010
2011
2012
2013
Total
Value traded $
75,452,703.26
52,705,519.30
71,008,532.65
86,827,569.33
46,505,714.46
Value traded
on governmental
bonds $
69,186,759.28
44,002,666.25
20,821,435.34
55,400,857.73
28,873,073.42
6,265,943.98
8,702,853.05
50,187,097.31
31,426,711.60
17,632,641.04
ASEA
Y E A R B O O K
Value traded
on corporate
bonds $
46
African Securities Exchanges Association
Section Four : Trading System
Trading System ( NSC )
Is this system locally developed or bought?
If bought, who is the Vendor?
Year of implementing the system:
Bought
NYSE Technologies
1996
Section Five : Clearing and Settlement
Where do Clearing & Settlement take
place?
The Stock Exchange No
If Separate Company please mention its
name
Société Tunisienne Interprofessionnelle pour la
Compensation et le Dépôt des Valeurs Mobilières
(STICODEVAM)
No
Yes
Euroclear
1996
Is this system locally developed
or bought?
If bought, who is the Vendor?
Year of implementing the system:
Clearing and Settlement is conducted in:
Separate Company
Yes
T+ 2
T+ 3
Others
No
Yes
No
Section Six : Products traded on the Stock
Exchange
Types of markets in the Stock Exchange
Equity Market
Cash Market
Derivative Market
Bond Market
Yes
Yes
No
Yes
ASEA
Y E A R B O O K
47
African Securities Exchanges Association
Products
Product (Stocks,Bonds,
Funds,ETF's,Derivatives ..etc)
Shares
Bonds
Securitised Debt
Description of the Product
Common stocks, none voting stocks
Government Bonds and Corporate Bonds
-
Section Seven : Trading Mechanism
Margin Trading
Intraday Trading
Online Trading
No
No
Yes
Section Seven : Indices
Please specify the main indices used by your Stock Exchange and the description of each:
Indices
Index Name
TUNINDEX
Sector Indices
TUNINDEX 20
TUNINDEX
ASEA
Y E A R B O O K
TUNINDEX20
48
Index Type (Price Index, Sector Index,..etc)
A broad market return index launched in
December 31 st, 1997, with a base of 1000.
Weighted by the free float adjusted market
capitalization
Return indices launched in December 31 st,
2005, with a base of 1000. Weighted by the free
float adjusted market capitalization. Each listed
company is allocated to the sector where it
realizes the majority of its revenue
It was launched in January 1st, 2012. It's a
return index weighted by free float adjusted
market capitalization and it reflects the
performance of the 20 most liquid shares traded
on Tunis Stock Exchange
Closing 2012
4,579.85
1,791.82
Closing 2013
4,381.32
% change
-4.33%
1,753.16
-2.16%
African Securities Exchanges Association
Section Eight : IPOs
2009
Company
SERVICOM
Les Ciments de
Bizerte
Total
Date of IPO
6 January 2009
Value of IPO ($ million)
2.47
10 August 2009
76.91
79.38
2010
Company
Assurances Salim
TUNIS RE
Carthage Cement
Ennakl Automobiles
Modern Leasing
Total
Date of IPO
Value of IPO ($ million)
19 March 2010
26 April 2010
6.89
9.74
6 October 2010
7 December 2010
12 January 2010
93.82
66.97
5.91
183.32
2011
Company
Date of IPO
Value of IPO ($ million)
TELNET HOLDING
Total
19 April 2011
8.01
8.01
2012
Company
HEXABYTE
ATELIERS
MECANIQUES DU
SAHEL
Total
Date of IPO
25 January 2012
18 May 2012
Value of IPO ($ million)
1.29
6.45
7.74
ASEA
Y E A R B O O K
49
African Securities Exchanges Association
2013
Company
Land'or
Ae-Tech
New Body Line
One Tech Holding
Syphax Airlines
Euro Cycles
Hannibal Lease
Best Lease
City Cars
Manufacture De
Panneaux Bois Du
Sud «Mpbs»
Lilas
Sotemail
ASEA
Y E A R B O O K
Total
50
Date of IPO
Value of IPO ($ million)
15 February 2013
21 March 2013
6.63
2.13
30 April 2013
9 May 2013
29 May 2013
17 June 2013
21 June 2013
8 October 2013
19 November 2013
24 December 2013
8.13
49.77
15.18
11.05
10.04
12.75
26.93
7.19
27 December 2013
27 December 2013
78.67
4.86
233.33
African Securities Exchanges Association
2009
Company
Tunisie Leasing
Société Tunisienne de Banque
(STB)
BNA
Arab Tunisian Lease (ATL)
Arab Tunisian Bank (ATB)
Compagnie Internationale de
Leasing (CIL)
Union Internationale de
Banque (UIB)
Compagnie Internationale de
Leasing (CIL)
Banque de Tunisie et des
Emirates (BTE)
Arab Tunisian Lease (ATL)
Tunisie Leasing
Amen Bank
Banque de l'Habitat (BH)
Cie Internationale de Leasing
Arab Tunisian Lease (ATL)
Total
Date of Issue
Face Value of Issue
($ million)
2 February 2009
11.39
2 May 2009
37.96
31 March 2009
37.96
27 April 2009
22.77
5 May 2009
37.96
25 June 2009
15.18
29 June 2009
75.91
8 March 2009
15.18
9 January 2009
37.96
9 November 2009
15.18
9 November 2009
15.18
23 September 2009
45.55
21 December 2009
75.91
23 December 2009
15.18
24 December 2009
22.77
482.05
ASEA
Y E A R B O O K
51
African Securities Exchanges Association
2010
Company
Tunisie Leasing
STB
Tunisie Leasing
CIL
Date of Issue
Face Value of Issue
($ million)
18 February 2010
10.43
3 October 2010
69.55
26 April 2010
13.91
7 July 2010
20.86
Arab Tunisian Lease
(ATL)
Amen Bank
26 July 2010
52.16
8 February 2010
55.64
BTE
26 August 2010
34.77
Attijari leasing
31 August 2010
20.86
CIL
18 October 2010
20.86
Tunisie Leasing
19 October 2010
20.86
Arab Tunisian Lease
(ATL)
Attijari Bank
13 December 2010
24.34
28 December 2010
34.77
El Wifak Leasing
29 December 2010
13.91
ASEA
Y E A R B O O K
392.93
52
African Securities Exchanges Association
2011
Company
Date of Issue
Face Value of Issue
($ million)
1 October 2011
20.86
Tunisie Leasing
1 November 2011
13.34
Tunisie Leasing
13 April 2011
20.01
UIB
15 August 2011
33.35
Amen Bank
26 August 2011
33.35
13 September 2011
20.01
CIL
Tunisie Leasing
140.92
2012
Company
Compagnie
Internationale de
Leasing -CILTunisie Leasing
Attijari Leasing
Date of Issue
Face Value of Issue
($ million)
23 February 2012
12.90
16 April 2012
19.35
19 April 2012
12.90
Arab International
Lease -ATLAmen Bank
30 April 2012
19.35
17 August 2012
32.25
Attijari Leasing
23 October 2012
12.90
11 January 2012
25.80
11 December 2012
12.90
12 July 2012
12.90
17 December 2012
12.90
Union Internationale de
Banques -UIBTunisie Leasing
Compagnie
Internationale de
Leasing -CILModern Leasing
174.13
ASEA
Y E A R B O O K
53
African Securities Exchanges Association
2013
Company
Date of Issue
Face Value of Issue ($ million)
2 May 2013
4.86
ATL
21 February 2013
18.22
Tunisie leasing
28 February 2013
12.15
Elwifack leasing
4 March 2013
12.15
4 February 2013
18.22
4 May 2013
12.15
AIL
16 April 2013
24.29
BH
30 April 2013
30.97
8 July 2013
18.22
Unifactor
14 August 2013
12.15
ATL
23 August 2013
30.36
Attijari Leasing 2013-1
30 August 2013
12.75
CIL 2013-1
9 December 2013
18.22
Tunisie leasing
20 November 2013
12.15
Hannibal lease
16 December 2013
24.29
Servicom
UBCI
Hannibal lease
Tunisie leasing
ASEA
Y E A R B O O K
261.13
54
African Securities Exchanges Association
CASABLANCA stock
exchange profile
Website
Market Regulator
Address
Trading Session hours (local time)
Time Zone
Contact Person for ASEA
Telephone
Fax
E-mail
Name of Local Currency
Listing of Foreign Domiciled
Companies
www.casablanca-bourse.com
Conseil Déontologique des Valeurs Mobilières-CDVM
Angle Avenue des Forces Armées Royales et Rue
Arrachid Mohamed, Casablanca- MAROC
9:00-3:40 (The trading hours during the month of
Ramadan: 9:15-13:40)
GMT
Ayoub Youssefi
(212)522457503
[email protected]
MAD
Available
ASEA
Y E A R B O O K
55
African Securities Exchanges Association
Tax Rates (dividends, interest, capital Non-domestic corporate investors are exempt from
gains)
capital gains tax on listed securities. However, they are
subject to capital gain tax for shares NOT listed in the
Casablanca Stock Exchange. If the investor’s country
of residence has signed a double taxation treaty (DTT)
with Morocco, the payment place and CGT rate will be
stipulated In the DTT. In the event where no DTT is in
place, the investors will be subject to 30 % CGT rate
and it is the investor’s responsibility to arrange for the
payment to the local tax administration.
Non-resident individuals are subject to capital gains tax,
exception to this is when there is a Double Tax Treaty
between the residency of the individual and Morocco.
The capital gains tax rates applicable to non-resident
individuals are as follows:
15 % on equities
15 %on mutual funds permanently investing at least 60
percent of their assets in equities
20 % on bonds and other mutual funds
Effective 1 January 2010, individuals (residents and non
residents) have become subject to a capital gains tax
rate of 20% on Non-listed equities.
ASEA
Y E A R B O O K
Commodities Exchange
56
Foreign investors are subject to 15% withholding tax on
dividends unless a double taxation treaty in signed
between Morocco and the investor’s domicile country
and provides for a lower rate or exemption.
No
African Securities Exchanges Association
MARKET PERFORMANCE
With a market capitalization in excess of $ 55.0 billion at the end of 2013, CSE is one of the
largest securities exchange in Africa.
CSE, that was established as far back as 1929 operates within a modern market infrastructure
which includes a market authority, the CDVM, a central depository, Maroclear and a centralized
payment system operated by the Central Bank.
There are currently 76 companies listed on the exchange, representing all major sectors of the
economy.
Following the major overhaul of Morocco’s capital markets, in 1993, security trading boar
became Casablanca Stock Exchange, a private company, owned by the brokers.
In 2011, CSE has been involved in the creation of the “Association des Bourses Francophones
d’Afrique” (ABFA) (French-speaking Exchanges Association).
In 2010, CSE became a member of the World Federation of Exchanges (WFE).
The same year, CSE created, in partnership with FTSE, the FTSE CSE 15 index.
With the creation, in 2010, of the Moroccan Financial Board, empowered to transform
Casablanca into a regional financial hub, CSE is poised to experience new growth.
In 2001, the exchange started trading on an electronic platform which was upgraded in 2008
to a new, state of the art platform offering multiple functionalities, increased speed and greater
transparency.
In 2014, the Casablanca Stock Exchange signs a strategic partnership with the London Stock
Exchange Group (LSEG) reflecting the commitment of both financial centers to reinforce
the international attractiveness of Morocco which positions itself as a regional financial hub.
Through this partnership, LSEG and CSE will work to develop the Moroccan and regional
financial market, in the areas of Technology, Financing SMEs and the establishment of new
products and markets including a derivatives’ market.
ASEA
Y E A R B O O K
57
African Securities Exchanges Association
Section One : Economic Indicators
Main Economic Indicators
Currency: USD
Indicators
2010
2011
2012
2013
Population (million)*
31.89
32.24
32.59
32.95
90.9
90.8
99.21
96.73
0.99%
1.40%
1.20%
2.10%
1,240.627
2,521.365
2,841.956
-
9%
9.10%
9.00%
9.20%
3,34 (T4 2011)
3,40 ( T4
2012)
3.48 %(oct
2013)
8.58
8.43
8.15
Real GDP (USD) (billions) at
market exchange rates**
Inflation rate (%)***
Net Foreign Direct Investment
(USD) (Millions)**
Unemployment rate (%)
Interest Rate (T-Bills)-13
weeks***
Exchange rate (local currency
versus US$)
8.36
*HCP: www.hcp.ma
**World Bank
***The Central Bank: www.bkam.ma
Section Two : Trading Statistics
Trading equity Statistics
Indicators
Total Value traded $ (1)
Total volume traded (1)
Total number of transactions (1)
Number of listed companies (Domestic)†
Number of listed companies (Foreign)‡
Number of traded companies
Domestic Market Capitalization (billions)
end of year ¤
Market Capitalization as % of GDP
Turnover Velocity (%) ***
Currency: USD
2013
5,956,631,622.54
197,316,097
125,137
75
1
78
55.22
50.58
5.87%
Number of companies which have shares listed on an exchange at the end of the period, split into
domestic and foreign, excluding investment funds and unit trusts. A company is considered domestic
when it is incorporated in the same country as where the exchange is located. A company is considered
foreign when it is incorporated in a country other than that where the exchange is located.
†
The exchange’s Domestic Market Capitalization should be reported, this excludes foreign companies
dual listing on the exchange and collective investment funds ie. REITs, unit trusts
ASEA
Y E A R B O O K
¤
58
***
Turnover Velocity = (Monthly value traded of listed shares/month-end market cap) x 12 (annualized).
(1)
= one way counted-Central Market and Block Market - Rights are included
African Securities Exchanges Association
Investors Type
Foreigners vs. Local Investors
Type of Investors
Foreign Investors*
Local Investors
Total %
% of the Total Value traded $
2011
11%
89%
100%
2012
11.00%
89.00%
100%
2013
35%
65%
100%
*Foreign institutional investors(individuals are not considered)
**Traded Value Both Central and Bloc Markets(Excluding capital raises, public offers, Ipos..)
Insitutions Vs. Individuals
Institutions
Individuals*
Total %
90%
10%
100%
94%
6%
100%
95%
5%
100%
*Including foreign individuals
**Traded Value Both Central and Bloc Markets(Excluding capital raises, public offers, Ipos..)
ASEA
Y E A R B O O K
59
African Securities Exchanges Association
Sectors Traded
Sectors Traded on the Stock
Exchange
Shares Market Segment
Banks
Beverages
Chemicals
Construction & Building Materials
ASEA
Y E A R B O O K
Distributors
Electrical & Electronic Equipment
Electricity
Engineering & Equipment
Industrial Goods
Food producers & Processors
Forestry & Paper
Holding Companies
Insurance
Investment Companies & Other
Finance
Leisures and Hotels
Mining
Oil & Gas
Pharmaceutical Industry
Real Estate
Software & Computer Services
Telecommunications
Transport
Utilities
60
Number of Companies Included in each Sector
2010
74
6
3
4
6
9
1
0
2011
76
6
3
4
7
8
1
0
2012
77
6
3
4
8
8
1
0
2013
76
6
2
4
8
8
1
1
1
2
2
2
6
1
2
4
6
1
2
4
6
1
2
4
6
1
2
4
8
8
8
7
1
4
2
2
4
6
1
2
1
1
4
2
2
4
7
1
2
1
1
4
2
2
4
7
1
2
1
1
4
2
2
4
7
1
2
1
African Securities Exchanges Association
5 Most Active Sectors
2013
Sectors
Banks
Food producers & Processors
Electricity
Real Estate
Telecommunications
#
1
2
3
4
5
Section Three: Bonds Statistics
Bonds Statistics
Bonds
2010
Total Value
traded $
Value traded on
governmental
bonds ($)*
Value traded
on corporate
1,119,460,185.47
bonds**
2011
2012
1,002,343,955.39 897,905,665.04
2013
844,620,452.41
*Please note that government bonds are not traded on the exchange.
**Including bonds issued by public firms.
Section Four : Trading System
Trading System
( NSC V900 )
Is this system locally developed or bought? Bought
If bought, who is the Vendor?
NYSE Euronext
Year of implementing the system:
Upgraded 2008
ASEA
Y E A R B O O K
61
African Securities Exchanges Association
Section Five : Clearing and Settlement
Where do Clearing & Settlement take
place?
The Stock
Exchange
Separate
Company
If Separate Company please mention its
name
Is this system locally developed or
Internally
bought?
If bought, who is the Vendor?
Year of implementing the system:
Clearing and Settlement is conducted in:
T+ 2
T+ 3
Others
Yes
Yes
Section Six : Products traded on the Stock Exchange
Types of markets in the Stock Exchange
Equity Market
Cash Market
Derivative Market
Bond Market
Yes
Yes
Products
Product (Stocks,Bonds, Funds, ETF's,
Derivatives, etc.)
Stocks
Bonds
ETFs
Description of the Product
Shares traded on 3 different boards
Corporate bonds only
No
Section Seven : Trading Mechanism
ASEA
Y E A R B O O K
Margin Trading
Intraday Trading
Online Trading
62
Yes
Yes
African Securities Exchanges Association
Section Seven : Indices
Indices
Index Name
MASI Float
FTSE CSE Morocco 15 Index
Index Type (Price Index, Sector Index,..etc)
A broad-based index comprising all shares
Free float index calculated by FTSE-a real time
tradable index consisting of the top 15 stocks
trading on the Casablanca Stock Exchange,
ranked by gross market capitalization
MASI Float
Closing 2012
9,359.19
FTSE CSE Morocco 9,619.81
15 Index
Closing 2013
9,114.14
8,822.30
% Change
-2.62
-8.29
Section Eight : IPOs
2012
Company
Afric Industries SA
Date of IPO
5 January 2012
Value of IPO ($ million)
3.152
2013
Company
Jorf Lasfar Energy Company
Date of IPO
24 December 2013
Value of IPO ($ million)
122.69
2012
Company
BMCI
Ciments De L'atlas
FEC
IMMOLOG
Residences Dar Saada
SGMB
Total
Date of Issue
19 November 2012
3 July 2012
17 January 2012
18 January 2012
25 June 2012
17 December 2012
Face Value of Issue
($ million)
30.24
6.65
17.79
5.93
8.89
38.44
107.94
ASEA
Y E A R B O O K
63
African Securities Exchanges Association
2013
Company
Attijariwafa Bank
BMCE Bank
Date of Issue
22 May 2013
16 January 2013
Face Value of Issue
($ million)
66.25
19.63
Section Nine : 2012 Rankings of Top 5 Trading
Participants
Ranking
ASEA
Y E A R B O O K
1
64
Stockbrokerage Units
Non public information
Purchases
$
Sales
$
Total
$
African Securities Exchanges Association
dar-es salaam stock
exchange profile
Please fill in the following data about your
Stock Exchange
Website
www.dse.co.tz
Market Regulator
Capital Market Securities Authority (CMSA)
Tanzania
Address
14th FLOOR GOLDEN JUBILEE TOWERS,
OHIO STREET, DAR ES SALAAM
Trading Session hours (local time)
10h00 - 14h00 (Official Trading Hours)
Time Zone
East Africa
Contact Person for ASEA
A. Ngoshani
Telephone
+255 (0)71 4022044 or +255 (0)2123983
Fax
255(0)22 2133849
E-mail
[email protected]
Name of Local Currency
Tanzanian Shilling
Tax Rates (dividends, interest, capital gains) 5% tax on dividends, 0% tax on capital gains
Listing of Foreign Domiciled Companies
Available
Commodities Exchange
Not available
ASEA
Y E A R B O O K
65
African Securities Exchanges Association
MARKET PERFORMANCE TREND
Market Indicator
DSE All Share Index
Tanzania Share Index
(TSI)
Total Market
Capitalization (TZS. Bn)
Domestic Market Cap
(TZS Bn)
December 2012
1,485.63
1,430.46
2011
1,303.23
1,140.26
% change
14%
25%
13,197.34
11,577.05
14%
3,005.05
2,395.42
25%
LISTING ACTIVITIES
In year 2012, the Government listed bonds wor th TZS. 882.71 billion ($554.46 million) through
the issuance and listing of Government of Treasury Bonds with maturities of 2, 5, 7, and 10
years. There was no new listing in the equity market during the period under review. However,
the following happened during the period under review:
• The East African Breweries (EABL) shares in Tanzania Breweries Limited (TBL) were
offloaded. • EABL 20% in TBL was offloaded through a Min IPO.
• MS. Richland Resources Ltd (a tanzanite mining and marketing company) application for
IPO and cross listing was approved by the Governing council. Richland is primarily listed on
London Stock Exchange AIMs;
• DCB Commercial Bank (DCB) application for additional listing of its shares by way of rights
issues and bonus shares was approved. DCB has applied for listing of additional 44.7
million ordinary shares.
The DSE Strategic Initiatives
During year 2012 the DSE Governing Council approved three major strategic initiatives:
• DSE Council in May, 2012 approved the DSE 5 Year Corporate Plan for the years 2012/13
to 2016/17;
• Endorsed engagement of the Consultant to study DSE demutualization prospects;
• Endorsed engagement of the Consultant to review the DSE Rules in order to among
others accommodate new planned products, procedures and best practices.
ASEA
Y E A R B O O K
The approved DSE 5 Year Corporate Plan has come up with the following new DSE’s vision
and mission:
66
African Securities Exchanges Association
VISION
“To be a sustainable securities exchange that is an engine of economic growth for Tanzania”
MISSION
“To provide a responsive securities exchange that promotes economic empowerment and
contributes to the country’s economic development through offering a range of attractive and
cost-effective products and services”.
The DSE Corporate Plan therefore has eight objectives namely:
1. Ingrain a self-reliant, commercial business culture in the exchange;
2. Achieve consistent profitability without government subventions or grants supporting its
core activities;
3. Identify and reduce costs;
4. Expand its range of fee-generating products and services;
5. Improve the organisation and accountability of the DSE organization;
6. Improve the risk management of the DSE and the securities market;
7. Raise the profile of the DSE;
8. Deliver the program defined in this strategy timely.
During the period, DSE acquired its own building in a remote location for use as Disaster
Recovery Site (DRS). A full range of new ICT equipment’s were procured to replace the ageing
hardware at the main office and for installation at the DRS. The procured ICT equipment are
expected to suppor t increased operational efficiency in the Exchange. In May 2012 DSE
offices were relocated to the 14th Floor of Golden Jubilee Towers Building , Ohio Street in Dar
es salaam to provide for more space for planned activities and services and uplift corporate
image of the Exchange.
2013 PROSPECTS :
Major focus will be on consolidating revenue generating activities initiated during 2012 while
working for new listings both in the main market segment and the new EGM market segment.
The thrust will also be in laying foundation for new products to be launched in subsequent
years for example: M-Akiba bonds, Exchange Traded Funds and services to the Commodities
Market. During the year a better foundation for risk management will be put in place.
ASEA
Y E A R B O O K
67
African Securities Exchanges Association
NEAR TERM PRIORITIES
The following has been identified as the major activities for year 2013:
ASEA
Y E A R B O O K
• Strengthening the DSE’s organization structure and SRO function through recruiting,
redefining some roles and overhauling the DSE Blue Print in line with the existing and
foreseeable challenges,
• Bringing new listings in the MIMS, EGM and fixed income securities and Implementing
the new fee structure,
• Consolidation of the gains on data vending and securities registration services, d)
Introducing CSDR services and laying ground for M-Akiba bonds product,
• Put in place the DSE demutualization road map,
• Continue working on necessary conditions for future roll out of new products and services
including municipal bonds, Exchange Traded Funds and services related to commodities
Exchange
68
African Securities Exchanges Association
Section One : Economic Indicators
Main Economic Indicators
Indicators
Population
(million)
Real GDP
(USD) (millions)
at market
exchange rates
Inflation rate (%)
Net Foreign
Direct
Investment
(USD) (Millions)
Unemployment
rate (%)
Interest Rate
(T-Bills)
Exchange rate
(local currency
versus US $ )
Currency: USD
2010
2011
2012
2013
43.64
44.97
46.35
47.78
21.36
22.91
23.87
28.25
7.2
12.7
16.1
7.9
10.70
10.70
NA
21.1
23.9
23.9
NA
14.55
14.96
NA
NA
1,453.54
1,566.66
1,571.62
1,574.01
Section Two : Trading Statistics
Trading equity Statistics
2011
2012
2013
24,567,231.10
32,696,009.44
32,088,577.97
160,348,409.48
188,174,810
133,327,780
78,285,596
243,537,149
11,324.00
12,198
9,975
12,673
15
17
17
18
12
15
12
12.00
1,263,670,159.44
1,528,999,174
1,912,073,345
3,799,080,477
5.69%
6.38%
6.72%
NA
1.94
2.14
1.68
4.22
Turnover Velocity = (Monthly value traded of listed shares/month-end market cap) x 12 (annualized).
ASEA
2010
Y E A R B O O K
Indicators
Total Value
traded ( $ )
Total volume
traded
Total number of
transactions
Number
of listed
companies
Number
of traded
companies
Market
Capitalization
(billions) end of
year ( $ )
Market
Capitalization
as % of GDP**
Turnover
Velocity (%) *
Currency: USD
69
African Securities Exchanges Association
Investors Type
Foreigners vs. Local Investors
Type of
Investors
% of the Total Value traded $
Foreign
Investors
Local Investors
Total %
2010
2011
2012
2013
43%
46%
30%
23%
57%
100%
54%
100%
70%
100%
77%
100%
66.67
33.33
100
84.5
15.5
100
Institutions Vs. Individuals
Institutions
Individuals
Total %
55.5
44.5
100
68.22
31.78
100
Sectors Traded
Sectors traded on the
Stock Exchange
Number of Companies Included in each Sector
2010
2011
2012
Domestic Board
Industrial and Allied
Banking Investment and
Finance
Commercial Services
6
4
2013
6
3
6
3
6
3
2
2
2
5 Most Active Sectors
#
1
2
3
Sectors
Banking Finance and Investment
Industrial and Allied
Commercial Services
Section Three: Bonds Statistics
Bonds Statistics
ASEA
Y E A R B O O K
Bonds
70
2010
2011
2012
2013
Total Value traded $ 154,141,394.00
268,942,225.00
241,773,165.00
189,219,453.00
Value traded on
governmental
bonds ($)
Value traded on
corporate bonds
154,141,394.00
265,540,083.00
241,731,806.00
188,742,963.00
N/A
3,402,142.00
41,359.00
476,490.00
African Securities Exchanges Association
Section Four : Trading System
Please tick :and make sure that if your answer is Yes to add the required data
Please specify the Trading System
Is this system locally developed
or bought?
If bought, who is the Vendor?
Year of implementing the system:
Automated Trading System
No
Yes
Millennium Information Technology
2006
Section Five : Clearing and Settlement
Where do Clearing & Settlement take
place?
If Separate Company please mention its
name
Is this system locally developed or
bought?
If bought, who is the Vendor?
Year of implementing the system:
Clearing and Settlement is conducted
in:
The Stock
Exchange
Separate
Company
Yes
No
Internally
Millennium Information Technology
T+ 2
T+ 3
Others
Section Six : Products traded on the Stock Exchange
Types of markets in the Stock Exchange
Equity Market
Cash Market
Derivative Market
Bond Market
Yes
Yes
ASEA
Y E A R B O O K
71
African Securities Exchanges Association
Products
Product (Stocks,Bonds, Funds,
ETF's, Derivatives, etc.)
Stocks
Bonds
ETFs
Description of the Product
Oridnary Shares
Government Bonds, State and Local (Municipal)
Bonds, and Corporate Bonds
No
Section Seven : Trading Mechanism
ASEA
Y E A R B O O K
Margin Trading
Intraday Trading
Online Trading
72
No
No
Yes
African Securities Exchanges Association
Section Seven : Indices
Index Name
Index Type (Price Index, Sector Index,..etc)
DSE All Share Index (ASI)
The DSE ASI (All Share Index) is a value-weighted
market capitalization index of all listed companies
(Including cross listed ones). The start date for the
DSE ASI is 2006; the base value is 1000 points.
DSE Tanzania Share Index (TSI)
The DSE ASI (All Share Index) is a value-weighted
market capitalization index of all domestically listed
companies (Exluding cross listed companies). The
start date for the DSE ASI is 2006; the base value
is 1000 points.
Industrial and Allied Share Index (IA)
This index is designed to provide an investable
benchmark to capture the performance of the
Industrial and Allied Sector. The DSE ASI (All Share
Index) is a value-weighted market capitalization
index of all local companies involved in Industrial
and Allied actvities. The start date for the DSE
ASI is 2006; the base value is 1000 points.
Banking Finance and Investment Share Index This index is designed to provide an investable
(BI)
benchmark to capture the performance of the
companies providing Banking, Finance and/
or Investment services . The Banking Finance
and Investment Share Index is a valueweighted market capitalization index of all local
companies involved in Banking, Finance or
Investment services. The start date for the DSE
ASI is 2006; the base value is 1000 points.
Commercial Services Index
This index is designed to provide an investable
benchmark to capture the performance of
companies involved in Commercial Services.
The Commercial Services Share Index is a
value-weighted market capitalization index
of all local companies providing Commercial
Services. The start date for the DSE ASI is
2006; the base value is 1000 points.
DSE - ASI
DSE - TSI
Closing 2012
Closing 2013
% Change
1,485.63
1,430.46
1,866.57
2,843.50
25.64
98.78
ASEA
Y E A R B O O K
73
African Securities Exchanges Association
Section Eight : IPOs
Company
None
2012
Date of IPO
Value of IPO ($ million)
2013
Company
None
MAENDELEO BANK
Date of IPO
5 November 13
Value of IPO ($ million)
2.5
dEBT SECURITIES
2012
Company
N/A
Date of Issue
N/A
Face Value of issue ($ million)
N/A
2013
ASEA
Y E A R B O O K
Company
N/A
74
Date of Issue
N/A
Face Value of issue ($ million)
N/A
African Securities Exchanges Association
douala stock
exchange profile
Please fill in the following data about your
Stock Exchange
Website
www.douala-stock-exchange.com
Market Regulator
Financial Services Commission
Address
Immeuble de la Bourse, BP442 Douala
Boulevard de la Liberté, Akwa
Trading Session hours (local time)
9 a.m - 11 a.m (Official Market)
Time Zone
GMT +1h
Contact Person for ASEA
Pierre Ekoule, General Manager.
Telephone
(237) 33 43 85 83
Fax
(237) 33 43 85 84
E-mail
[email protected]
Name of Local Currency
FCFA (XAF)
Tax Rates (dividends, interest, capital gain)
ASEA
Y E A R B O O K
75
African Securities Exchanges Association
OVERVIEW
BACKGROUND
Creation of the DSX
The economies of Central Africa, which consist of Cameroon, the Republic of Congo,
Gabon,Equatorial Guinea, the Central African Republic and Chad have carried out, over the
pasttwo decades, structural adjustment programmes aimed at restoring their macroeconomic
equilibrium.
In view of the completion of these programmes, Cameroon established a financial market
regulated by law no.99/015 of the 22nd December, 1999 concerning the establishment and
organisation of a financial market, in order to respond to the needs of privatisations and longterm
financial investment. The Douala Stock Exchange was created on the 30th November 2001 and
inaugurated on the 23rd April 2003 by the Prime Minister.
Introduction to the DSX
Douala Stock Exchange is a market entreprise operating under the terms and conditions of
Law No. 99/015 of the 22nd December 1999 which regulates the creation and organisation of
financial markets. It is a limited liability company with a Board of Directors and share capital
of 1.740.500.000 Francs CFA divided as follows : 63,7% by banks : Amity Bank, Afriland First
Bank, Banque Internationale du Cameroun pour L’Epargne et le Crédit, Citibank Cameroun,
Commercial Bank of Cameroon, Crédit Agricole - Société Commerciale de Banques Cameroun,
Ecobank, Union Bank of Cameroun, Standard Chartered Bank Cameroon , Société Générale
de Banque au Cameroun, Crédit Foncier du Cameroun and FMO ; 23% by public entities
: Caisse Autonome d’Amortissement, Caisse Nationale de Prévoyance Sociale, Caisse de
Stabilisation des Prix des Hydrocarbures and the Société Nationale d’Investissement du
Cameroun, and 13,3% by insurance companies : Activa Assurances, Cameroon Insurance,
Pro Assur, Compagnie Professionnelle d’Assurances, Société Africaine d’Assurance et de
Réassurance du Cameroun,and Satellite Insurance.
The Board of Directors consists of twelve (12) members including five (5) representatives of
Investment Service providers and members of Douala Stock Exchange (brokers), three (3)
representatives of public investors, one (1) representative of the insurance companies, one (1)
representative of listed companies, one (1) representative of the banking profession and one (1)
representative of the Goverment of Cameroon.
ASEA
Y E A R B O O K
Under the authority of their Financial Markets Commission, the financial market is responsible
for : the administration of the market, the introduction, listing and quotation of shares (activity
devolved to the Douala Stock Exchange « DSX »); the admission, conservation and circulation
of shares (activity delegated to the Caisse Autonome d’Amortissement « CAA ») and the cash
settlement of market transactions (activity delegated to the Société Générale des Banques au
Cameroun « SGBC »).
76
In addition to the General Management, the organisational chart of Douala Stock Exchange
comprises three key functions; Market and Operations, Administration and Finance, and
Information and Technology System.
African Securities Exchanges Association
Functioning of the DSX
Douala Stock Exchange applies the principle of a spot or cash market which is centralised
and order-driven. These orders are recorded in the DSX quotation system by the Investment
Service providers. There is currently one trading session per week, through there are plans to
increase Douala Stock Exchange to 3 sessions per week by the end of 2012. Delivery of shares
and settlement of accounts will take place wiithin three days following the trading session, as
opposed to four days the current.
Douala Stock Exchange consists of three market units: equity, corporate bonds and government
bonds.
Currently, shares in three (03) companies (Société des Eaux Minérales du Cameroun-SEMC,
Société Africaine Forestière et Agricole du Cameroun-SAFACAM, and Société Camerounaise
de Palmeraies-SOCAPALM) are listed in the first market unit (shares and capital securities),
and one bond (International Finance Corporation -IFC-) is listed in the second market unit
(bonds and credit instruments). There are currently 13 brokers locally called Investment services
providers, namely; AFRILAND FIRST BANK - BAC - BICEC - BMCE Capital Cameroun - CASCB
- CBC - CENAINVEST - CITIBANK - EDC Investment Corporation - SFA - SCBC - SGBC
- UBA.
Conditions for Eligibility and Listing on the DSX
The stock market is composed of two divisions, one for large and multinational companies
and the other for small and medium size companies and is guided by a number of regulations
designed to ensure transparency and the credibility of operations:
• For SHARES, a Limited Liability Company may be admitted into the first division (shares) of
the DSX provided its stock market capitalisation on introduction exceeds 500 million
• F.CFA (USD 1 million), and it can demonstrate a net margin of 3% of its turnover for the
previous three years, and can present three years annual audited and consolidated accounts.
• Additionally, the company is required to sign a contract which provides for a quotation or a
price instruction, each trading session. Finally, it must offer to the public at least 20% of its
share capital on listing.
• For the second division, credit instruments and certificates, any limited liability comapny is
eligible if it shows a stock market capitalisation of at least 200 million F.CFA (USD 400 000)
on listing, can provide two years audited accounts and a strong profit-making potential.
• Equally, the company is also required to sign a contract which provides for a quotation or a
price instruction every five trading sessions. Finally, it must offer to the public at least 20%
of its share capital on listing.
• For CORPORATE BONDS, any limited liability company with share capital of at least 200
million FCFA (USD 400 000) and which issues at least 500 million FCFA (USD 1 million) is
eligible.
• For GOVERNMEMT BONDS, admission is open according to the law.
ASEA
Y E A R B O O K
77
African Securities Exchanges Association
Section One : Economic Indicators
Main Economic Indicators
Indicators
Population
(million)
Real GDP
(USD) (millions)
at market
exchange rates
Inflation rate (%)
Foreign Direct
Investment
(USD) (Millions)
Unemployment
rate (%)
Interest Rate
(T-Bills)
Exchange rate
(local currency
versus US$)
Currency: USD
2011
2012
2013
19.40
20.13
22.53
3.80
4.70
5.10
3,4(est)
2,9(est)
2.10
N/A
N/A
N/A
N/A
30(est)
30(est)
N/A
N/A
N/A
500
515
494
Section Two : Trading Statistics
Trading equity Statistics
ASEA
Y E A R B O O K
Currency: USD
78
Indicators
Total Value
traded $
Total volume
traded
Total number of
transactions
Number of listed
companies
Number
of traded
companies
Market
Capitalization
(billions) end of
year (USD.)
Market
Capitalization as
% of GDP
Turnover
Velocity(%) *
2011
2012
2013
447,628.00
1,582,288.63
914,548.44
4,807.00
16,883.00
6,773.00
141
141
181
6
6
3
6
6
3
0.20
0.22
0.28
N/A
N/A
N/A
0.23
6.48
1.93
* Turnover Velocity = (Monthly value traded of listed shares/month-end market cap) x 12
(annualized).
African Securities Exchanges Association
Investors Type
Foreigners vs. Local Investors
Type of
Investors
Foreign
Investors
Local Investors
Total %
% of the Total Value traded $
2011
2012
2013
14
14
14
86
100%
86
100%
86
100%
Insitutions Vs. Individuals
Institutions
Individuals
Total %
4
96
100%
4
96
100%
4
96
100%
Sectors Traded
Sectors traded on the Stock
Exchange
Number of Companies Included In Each Sector
Main Investore Market Segment
Sector "agriculture"
Sector "industry"
Fixed Income Market Segment
Corporate Bonds
Government bonds
Over the Counter
Government debt bonds (OTZ)
2010
2011
2012
2
1
2
1
2
1
2
1
2
1
2
1
2013
5 Most Active Sectors in 2010
#
1
2
Sectors
Agriculture
Industrial
ASEA
Y E A R B O O K
79
African Securities Exchanges Association
Section Three: Bonds Statistics
Bonds Statistics
Bonds
Total Value traded $
(USD.)
Value traded on
governmental
bonds ($) (OTZ)
Value traded on
corporate bonds
(IFC & BDEAC)
Value traded on
government bonds
(ECMR)
2011
2012
2013
4,503,822.00
121,861,781.80
17,369,107.28
4,056,602.00
-
-
21,860.00
329,509.00
100,376.16
447,220.00
121,532,272.00
17,268,731.12
Section Four : Trading System
Please specify the Trading System
Is this system locally developed
or bought?
If bought, who is the Vendor?
Year of implementing the system:
TITAN
Yes
3V Finance (Vieil et Tradition - France)
2003
Section Five : Clearing and Settlement
Where do Clearing & Settlement take
place?
ASEA
Y E A R B O O K
If Separate Company please mention its
name
Is this system locally developed or
bought?
If bought, who is the Vendor?
Year of implementing the system:
Clearing and Settlement is conducted
in:
80
The Stock
Exchange
Separate
Yes
Company
Central Depository - Caisse Autonome
d’Amortissement (CAA)
Yes
Euroclear
2006
T+ 2
T+ 3
Others
Yes
African Securities Exchanges Association
Section Six : Products traded on the Stock Exchange
Types of markets in the Stock Exchange
Equity Market
Yes
Cash Market
Derivative Market
Bond Market
Yes
Products
Product (Stocks, Bonds, Funds, ETF's,
Derivatives ..etc)
Ordinary shares
Government and corporate bonds
Description of the Product
All common stocks
Government bonds issued through the
Primary Dealers System
Section Seven : Trading Mechanism
Margin Trading
Intraday Trading
Online Trading
Yes
Section Seven : Indices
Index Name
Index Type (Price Index, Sector
Index,..etc)
N/A
N/A
Section Eight : IPOs
2008
Company
SAFACAM
Date of IPO
-
5/26/2008
Value of IPO
($ million)
6.22
2009
Company
-
1/22/2009
Value of IPO
($ million)
32.3
ASEA
Y E A R B O O K
SOCAPALM
Date of IPO
81
African Securities Exchanges Association
2010
Company
Date of IPO
Value of IPO
($ million)
None
2008
Company
Date of Issue
Face Value of Issue
($ million)
None
2009
Company
Date of Issue
IFC
None
23 November 2009
Face Value of Issue
($ million)
42.91
2010
Company
Date of Issue
BDEAC
State Of Cameroon
-
29 November 2010
6 December 2010
Face Value of Issue
($ million)
64.38
429.19
Section Nine : 2012 Rankings of Top 5 Trading
Participants
Ranking
1
Ranking
1
Stockbrokerage Units
N/A
Dealing Units
N/A
Purchases
$
N/A
Sales
$
N/A
Total
$
N/A
Purchases
$
N/A
Sales
$
N/A
Total
$
N/A
ASEA
Y E A R B O O K
Members’ Contacts are available on the websitethe DSX website
www.douala-stock-exchange.com
82
African Securities Exchanges Association
EGYPTIAN stock
exchange profile
Website
Market Regulator
Address
Trading Session hours (local time)
Time Zone
Contact Person for ASEA
Telephone
Fax
E-mail
Name of Local Currency
Tax Rates (dividends, interest, capital gain)
Commodities Exchange
www.egx.com.eg
The Egyptian Financial Supervisory Authority
Over-the-counter, Deals Market 9:45 - 11:15
Orders Market 14: 45- 15:15 (Monday &
Wednesday)
Listed Securities 10:30 - 14:30
Nilex: 10:30 - 11:30
Primary Dealers Bonds Market 10:30-14:30
Greenwich Mean Time + 2 hours
Sara Magdy
202- 23933984- 202-23921402
+202 239 70 461
[email protected]
Egyptian Pound
Taxes are not applicable on capital gains
NA
ASEA
Y E A R B O O K
83
African Securities Exchanges Association
EGX FUTURE OUTLOOK
EGX will continue exerting efforts to enhance the efficiency of the market, raise investors’
awareness, promote the financial literacy and improve the communication between EGX and
its stakeholders. Moreover, EGX will continue its aggressive marketing plan to attract the big
companies to be listed in the market
On the other hand, EGX strives to build on its success by accelerating the introduction of a bundle
of new investment products and mechanisms into the Egyptian market such Introducing of the
first ETFs in 2014, sukuks, activating the bonds market to finance public projects, Activating
NILEX to become a financing tool for SMEs.
Moreover, EGX is working to develop a new listing rule to attract promising companies and
ensure investor protection, turning into a self regulatory organization (SRO) which would allow
EGX to conform to international standards in this regard.
In addition, EGX continued its awareness campaigns in different governorates about the
investment tools available in the market.
EXCHANGE BACKGROUND
The Egyptian Exchange (EGX) dates back to more than 129 years. Alexandria Stock Exchange
was officially established in 1883, followed by Cairo in 1903. The two exchanges were very
active as one of the oldest Future Market dated 1940, ranked as the fifth worldwide. Egyptian
cotton was among other commodities at that time.
Nevertheless, the socialist policies adopted in the mid 1950 have led to a drastic reduction in
activity on the stock exchange, which remained dormant during 1961 till 1992.
In an attempt to re-activate the market, the government opted for the public offering of the
state owned enterprises through the privatization program, which provided the impetus for its
revival.
In 1997, The Egyptian Exchange (formerly known as Cairo & Alexandria Stock Exchange)
started its modernization program in terms of legislation and infrastructure to keep abreast with
globalization and internationalization.
Stocks, bonds and funds are traded on EGX. In addition to a number of structured products,
issued by several international financial institutions, on the Exchange in-house designed index,
EGX 30 Index, are listed and traded on various European Exchanges such as EGX 30 Certificates
Issuance by The Royal Bank of Scotland (RBS), EGX 30 EUR X-Pert Certificates Issuance by
Deutsche Bank, and EGX 30 Open End Certificates Issuance by Goldman Sachs International.
ASEA
Y E A R B O O K
The Exchange continued the journey of expanding its services and products by launching,
NILEX. The first SME Market in the MENA region.
84
African Securities Exchanges Association
EGX has developed a number of indices which help the investors track the market’s performance.
EGX 20 Capped, EGX 30, EGX70, EGX100, Dow Jones EGX Egypt Titans 20 INDEX, and S&P/
EGX ESG Index which is the first corporate governance and social responsibility index in the
MENA region in collaboration with the Egyptian Institute of Directors and Standard &Poor’s. The
Egyptian Exchange is governed and regulated by the Egyptian Financial Supervisory Authority
(EFSA) that is a single regulatory body governing all non banking financial services.
EGX do not impose any restrictions on foreign investment or profit repatriation in the Egyptian
securities market. No taxes are levied on dividends, capital gain and interest on bonds for
individuals, mutual funds and international funds.
On the international front, EGX has signed a number of Memoranda of Understanding with
various Exchanges as it continues to develop partnerships with regional and global exchanges.
The mutual cooperation and sharing of information serve to enrich the strategic planning
of the different exchanges whether on the international, regional or individual fronts. In this
respect, EGX is sparing no efforts to strengthen its position on the international capital market
map through enhancing its relations with other stock exchanges as well as federations and
associations belonging to the exchange industry.
EGX is
• A Board member of WFE (World Federation of Exchanges).
• A member of ASEA (African Securities Exchanges Association).
• A vice chairmen of FEAS (Federation of Euro-Asian Stock Exchanges).
• A founder member of the Union of Arab Exchanges.
• An affiliate member of the International Organization of Securities Commissions (IOSCO).
Despite the Difficulties EGX Performance is the Best
The Egyptian market faced several challenges during year 2013 due to the inconsistent political
stance affecting the economic performance.
Despite this the Egyptian stock market for the second year in row proved its success in
comparison to other investment tools rising by 24% during 2013. Worth mentioning that a rise
of 43% took place since 30 June 2013, a distinctive performance that lead to a cumulative
return of more than 87% during the past two years.
Towards the end of the year the market was able for the first time to surpass January 2011
levels either in terms of indices or market capitalization which gained LE 51 billion during 2013
only.
EGX enticing performance placed the market in an advanced ranking among all emerging
markets. Egypt ranked second according to MSCI Indices in 2013 and first among all Emerging
markets during the past 2 years.
This comes despite the economic uncertainty on the short run waiting for the end of the
transition period. The growth rate settled at 2.1% for the FY 2012/13 with inflationary pressures
exceeding 10% and a devaluing Egyptian pound sealing the year 2013 at LE 6.93 against the
dollar accompanied by a noticeable budget deficit. Meanwhile a positive outlook remains for
the economic future on the medium and long term following political stability.
ASEA
Y E A R B O O K
On the liquidity front, EGX was able to maintain trading aggregates close to previous year and
85
African Securities Exchanges Association
exceeding 2011 trading aggregates. EGX managed to maintain trading records close to 2012
and surpassing the year 2011, registering a trading value of LE 162 billion as opposed to LE
185 billion last year. Moreover, the volume traded soared to reach 29 billion securities in 2013
compared to 34 billion securities in 2012. Likewise, the number of transactions recorded 5
million transactions versus 6 million transactions in 2012.
The value traded of the main market amounted to LE 146 billion in 2013 compared to
LE 166.5 billion in 2012. Worth mentioning that a deal was executed on National Societe
Generale Bank in March 2013, with a value of LE 17 billion. Also, a deal was executed on
Orascom Construction Industries in July 2013, with a value of LE 11 billion.
Additionally, volume traded of the main market reached 27 billion securities this year as
opposed to 33 billion securities in 2012.
On the other hand, Over the Counter (OTC) market registered a trading value of LE 15 billion
during the year compared to LE 18 billion in 2012. Meanwhile, the OTC trading volume
recorded 1.7 billion securities in 2013, compared to 1.4 billion securities last year.
The year 2013 witnessed re-activating the Intra-day trading mechanism, in May, which was
halted since the 25th of January revolution. Intra-day traded stocks recorded a trading volume
of 895 million securities which represents 3 percent of the total volume traded of listed
stocks. Moreover, their value traded amounted to LE 2.6 billion, making up around 2 percent
of the total value of the listed stocks. Likewise, the number of transactions executed through
intra-day trading registered 177 thousand transactions, which accounted for 4 percent of the
total number of transactions of the listed stocks.
From another perspective, Nilex witnessed a remarkable performance in 2013; this could
be attributed to increasing Nilex trading hours to reach four hours. Nilex recorded a trading
value of LE 748 million compared to LE 247 million in 2012. Moreover, the trading volume
amounted to 254 million securities in 2013 as opposed to 81 million securities last year.
EGX. Support the Egyptian Economy
In defiance of all the challenges, EGX continued its major role in supporting the Egyptian
economy through providing the required financing for companies to expand, grow and
provide extra job opportunities.This year 9 new companies were listed and 24 companies
have undergone capital increases with around LE 5 billion; four times higher than the previous
year’s capital increases.
ASEA
Y E A R B O O K
On this context, EGX released its new strategy for the period 2013-2017. The strategy sets
a realistic ambitious plan to place EGX among the leading Exchanges and consolidate its
grounds as an influential Emerging market aiding in the economic development process
The primary goal is to enhance the legislative and regulatory infrastructure of the market.
Second comes the development of the trading system, whilst increasing its efficiency. The
third goal is concerned with the augmentation of the Technological infrastructure. Fourth is
increasing promotional activities and awareness.
86
Finally, emphasizing EGX role in enhancing the economic and social welfare while reinforcing
its international position.
African Securities Exchanges Association
On the other hand, EGX management continued its efforts to enhance the trading
environment, increasing efficiency and effectiveness for all market participants. This year the
market witnessed several developments while ensuring the smooth continuation of trading
regardless of the instability. Meanwhile, EGX is nearly done with the ETFs file in cooperation
with the related parties arranging for its launch in the market. Also, EGX concentrated on
activating the bond market in agreement with the ministry of finance, central bank and the
primary dealers by allocating a ratio of the treasury bonds issued to retail investors in order
to be traded through member firms. This will lead to a surge in the bond market performance
during the coming period; likewise, EGX targets the development of the OTC market through
issuing regulations for the unification and standardization of the orders and deals operations.
Accordingly, this solved the problems in the operations carried out in 2013 while finalizing
the pending operations from previous years executing a large number of them. From another
perspective, EGX has undertaken several initiatives to attract more investments to the local
market, on top of them was the launch of the FIX HUB which facilitates foreign investors’
entry to the Egyptian market by linking EGX to 175 international markets via the international
linking network (Fidessa) through which more than US$ 800 billion are currently being traded.
This step is expected to enhance the Egyptian market liquidity at a lower cost.
Moreover, the Egyptian exchange has given priority to enhancing the disclosure and
transparency standards for the listed companies. A new layout for a monthly disclosure report
has been published requiring listed companies to provide information about the stocks on
a monthly basis. This aims to improve the quality of information provided to the investors.
On the other hand EGX launched the new version of its website on the internet providing
investors with real time data. In addition to revamping the dissemination of material events on
the website to match its disclosure timing on the trading screens to ensure timely access to
news among all investors.
We have to clarify that, year 2013 is considered the golden year for Nilex achieving an
unprecedented performance during the year. Trading volumes more than doubled, and
trading values surged to around LE 748 million .Moreover, 5 new companies have been listed
on Nilex this year from different sectors raising the total number of listed companies to 24
companies. Worth mentioning this year witnessed the IPO of 2 companies with coverage
ratios between 55 times and 67 times. This reflects the liquidity available for investment in
companies listed on NILEX.
On the other hand the new institutions in the market are a result of the ongoing efforts for
promoting the opportunities within the Egyptian market. More than 1200 new institution
entered the market three quarters of which are foreign institutions entering the market for the
first time.
ASEA
Y E A R B O O K
87
African Securities Exchanges Association
Section One : Economic Indicators
Main Economic Indicators
Indicators
Population (million)
Real GDP (USD) (billion) at
market exchange rates
Inflation rate (Urban) (%)
Net Foreign Direct
Investment (USD) (Millions)
Unemployment rate (%)
Interest Rate
(91 Days T-Bills) %
Exchange rate
(local currency versus US $)
ASEA
Y E A R B O O K
* End of December
88
2010 / 2011
80.4
236.116
2011 / 2012
82.3
254.55
2012 / 2013
85.2
271.93
11.8
2188.6
7.26
2078.2
11.66*
3004.7
11.8
12.1
12.6
14.75
12.7
10.53
5.81
6.059
6.93
ASEA
Y E A R B O O K
24%
34.09
34.0
61,512,466,261.42
51,688,215,519 60,097,919,773.00
22.73%
206
220
204
27
24%
212
213
213
4,790,280.00
6,233,096.00
29,190,092,844.00
18,490,172,527.00 34,221,343,688.00
5,589,676.00
2013
23,331,247,688.79
2011^^
2012
24,571,443,698.40 23,402,696,671.99
* Turnover Ratio (%)= value traded of listed stocks/market capitalization
** after excluding deals
^ it represtents the trading figures for the main market. Worth mentioning that Nilex market (SMEs Market) has been launched since 2007 and
trading has been commenced on Nilex on 3 June 2010, whereby there were 24 companies listed on Nilex at the end of 2010, with a market
capitalization of USD 172 million.
^^ EGX was closed from 28 January - 22 March after the revolution.
Indicators
2007
2009
2010
Total Value
65,834,904,722.82 81,707,244,812.59 55,360,550,000.00
traded $ (USD)
Total volume
15,091,289,631.95 36,601,431,681.00 33,429,372,218.00
traded
Total number of
9,016,116.00
14,627,805.00
10,201,219.00
transactions
435
306
212
Number
of listed
companies ^
Number
337
289
213
of traded
companies ^
Market
139,319,168,585
91,080,506,444
84,102,973,825
Capitalization
end of year
(USD) ^
Market
85.79%
41.40%
40.46%
Capitalization
as % of GDP
Turnover
38.7
49.9**
42.9
velocity (%) *
Trading equity Statistics
Section Two : Trading Statistics
African Securities Exchanges Association
89
African Securities Exchanges Association
Investors Type
Foreigners vs. Local Investors
Type of Investors
Foreign Investors
Local Investors
Total %
% of the Total Value traded $
2007
31.00
69.00
100%
2009
19.00
81.00
100%
2010
22.00
78.00
100%
2011
29.00
71.00
100%
2012
26.90
73.1
100%
2013
20.5
79.50
100%
52.00
48.00
100%
59.00
41.00
100%
56.40
43.60
100%
49.2
50.80
100%
Insitutions Vs. Individuals
Institutions
Individuals
Total %
39.00
61.00
100%
37.00
63.00
100%
* After excluding deals
Sectors Traded
ASEA
Y E A R B O O K
Sectors traded on the Stock
Exchange
90
Number of Companies Included In Each Sector
2011
2012
2013
Banks
Basic Resources
Chemicals
Construction & Materials
12
9
7
26
10
7
7
21
11
9
7
24
Financial Services excluding
Banks
Food & Beverages
Healthcare & Pharmaceuticals
Industrial goods & Services
and Automobiles
Media
Oil & Gas
Personal & Household
products
Real Estate
Retail
Technology
Telecommunications
Travel & Leisure
29
22
27
27
14
17
26
9
15
27
16
17
1
3
11
1
2
8
1
3
10
29
5
3
3
16
31
7
3
3
11
30
4
3
4
18
1
1
1
Utilities
African Securities Exchanges Association
5 Most Active Sectors in 2013
#
1
2
3
4
5
Sectors
Telecommunications
Financial Services excluding Banks
Real Estate
Construction and Materials
Personal and Household Products
*Most Active Sectors in terms of Volume Traded
ASEA
Y E A R B O O K
91
ASEA
92
96,857,434.06
37,627,167.60
5,056,289,649.99
3,600,159,602.44 10,841,835,284.13
29,852,911.84
2011
5,093,916,817.59
2008
2010
3,630,012,514.28 10,938,692,718.20
*Please note that government bonds are not traded on the exchange.
**Including bonds issued by public firms.
Bonds
Total Value traded
$ (USD)
Value traded
on
governmental
bonds
Value traded on
corporate bonds
Bonds Statistics
Section Three: Bonds Statistics
Y E A R B O O K
10,897,526.73
6,103,408,531.93
2012
6,114,306,058.65
2,680,656.04
4,147,421,670.08
2013
4,149,396,131.78
African Securities Exchanges Association
African Securities Exchanges Association
Section Four : Trading System
Trading System
( X-Stream )
Is this system locally developed or
bought?
If bought, who is the Vendor?
Year of implementing the system:
Bought
NASDAQ OMX Group
2008
Section Five : Clearing and Settlement
Where do Clearing & Settlement take
place?
The Stock
No
Exchange
Separate
Yes
Company
If Separate Company please mention its Misr for Central Clearing, Depository and
name
Registry (MCDR)
Is this system locally developed or Yes
bought?
If bought, who is the Vendor?
N/A
Year of implementing the system:
N/A
Clearing and Settlement is conducted in:
T+ 2
Yes
T+ 3
Yes (OTC)
Others
T+Zero for the securities eligible
for Intra-day trading (Real Time
Gross Settlement)*
T+1 for treasury bonds traded
according to the Primary
Dealers system
Section Six : Products traded on the Stock Exchange
Types of markets in the Stock Exchange
Equity Market
Cash Market
Derivative Market
Bond Market
Yes
Yes
N/A
Yes
ASEA
Y E A R B O O K
93
African Securities Exchanges Association
Products
Product (Stocks,Bonds,
Funds,ETF's,Derivatives ..etc)
Stocks
Description of the Product
All common stocks as well as 3 companies
with preferred stocks
Government and Corporate bonds with
the bulk owed to Treasury Bonds Issued
through the Primary Dealers System
Closed Ended Funds
EDRs are certificates issued by a custodian
bank, which represent ownership of a
specific number of shares of a foreign
company, that can be listed and traded
on EGX
Rules and Regulations are issued
Bonds
Mutual Funds
Egyptian Depository Receipts (EDRs)
ETFs
Section Seven : Trading Mechanism
Margin Trading
Intraday Trading
Online Trading
Yes*
Yes*
Yes
Section Seven : Indices
Indices
ASEA
Y E A R B O O K
Index Name
EGX 30 (Main index)
EGX 70
EGX 100
Dow Jones EGX Egypt Titans 20 Index
S&P/EGX ESG Index
EGX 20 Capped Index
94
Index Type (Price Index, Sector Index,..etc)
free float market capitalization weighted index
Price Index
Price Index
Free float market capitalization weighted index
Enviornmental, Social and Governance Index
Free float market capitalization weighted
index
African Securities Exchanges Association
Closing 2010
EGX 30
EGX 70
EGX 100
DJ EGX
Egypt Titans
20
S&P/EGX
ESG Index
EGX 20
Capped Index
Banks
Banks
Real Estate
Chemicals
Healthcare &
Pharmaceuticals
Personal & Household
Products
Financial Services
excluding Banks
Industrial Goods,
Services &
Automobiles
Construction &
Materials
Basic Resources
Food and Beverages
Travel & Leisure
Telecommunications
Closing 2011 Closing 2012 Closing 2013 % Change
7,142.14
721.54
1166.24
1532.78
3,622.35
415.59
643.07
816.78
5,462.42
477.08
800.35
1,211.41
6782.84
542.19
923.15
1476.83
24%
14%
15%
22%
1112.69
597.96
925.84
1062.3
15%
8024.25
3925.48
6342.16
7899.74
25%
Closing
2010
1,352.26
904.72
1,486.09
Closing
2011
911.67
440.82
675.43
1,244.48
Closing
2012
1,657.20
783.01
724.63
1,408.79
Closing
2013
2,210.76
983.04
911.24
1,501.12
%
change
33%
26%
26%
7%
609.14
458.60
518.47
604.49
17%
810.58
357.25
467.50
417.61
-11%
1,819.58
893.27
994.52
1,206.53
21%
1,610.63
1,129.22
1,403.86
1,630.31
16%
813.92
1,014.33
571.57
422.13
192.25
602.11
195.28
276.37
472.44
939.48
240.95
468.58
687.37
1,675.16
275.68
566.33
45%
78%
14%
21%
ASEA
Y E A R B O O K
95
African Securities Exchanges Association
Section Eight : IPOs
2012
Company
Brothers Solidarity
For Real Estate
Investment & Food
Security*
Vertika*
IPO Thousand
shares
Date of IPO
Value of IPO ($ million)
400
84.167
117.6
1.07
Total
85.24
* Nilex Market
2013
Date of issue
Dec-12
Mar-11
Total
Listing date
March 2013
April 2012
Face Value of Issue ($ million)
110.04
9.68
119.72
2012
ASEA
Y E A R B O O K
Date of issue
Dec-10
Jul-11
Total
96
Listing date
March 2011
September 2011
Face Value of Issue ($ million)
69.63
58.02
127.65
African Securities Exchanges Association
Section Nine : 2012 Rankings of Top 5 Trading
Participants
Broker Name
Beltone Securities
Brokerage
Commercial
International
Brokerage
Company (CIBC)
National Bank Of
Egypt
Hermes
Securities
Brokerage
Commercial
International
Brokerage
Company (CIBC)
Value Traded in USD
(Buy)
2,399,582,131
Value Traded in USD
(Sell)
Total in USD
209,550,499
2,609,132,630
1,759,590,076
314,946,925
2,074,537,001
1,269,352,730
927,848,688
2,197,201,417
1,031,268,609
993,597,704
2,024,866,313
971,868,647
1,032,299,780
2,004,168,427
*In the Main Market
2012 Rankings of Top 5 Trading Participants
Broker Name
Beltone Securities
Brokerage
Commercial
International
Brokerage
company (CIBC)
Financial Brokerage
Group
Hermes Securities
Brokerage
Pioneers Securities
Value Traded in Value Traded in USD
USD (Buy)
(Sell)
3,610,400,843
2,793,539,205
Total in USD
6,403,940,048
1,358,753,812
1,524,811,230
2,883,565,042
1,231,012,304
1,444,185,071
2,675,197,375
1,302,993,607
1,338,433,439
2,641,427,046
989,589,103
974,975,064
1,964,564,166
Members’ Contacts are available on the EGX website
www.egx.com.eg
ASEA
Y E A R B O O K
97
African Securities Exchanges Association
ghana stock
exchange profile
www.gse.com.gh
Securities and Exchange Commission (SEC),
Ghana
Address
No. 30 3rd Circular Road, Cantonments,
Accra, P.O.Box CT 6181, Cantonments,
Accra, Ghana
Trading Session hours (local time)
09h30 - 15h00 (Official Trading Hours)
Time Zone
Greenwich Mean Time (GMT)
Contact Person for ASEA
Diana Okine
Telephone
+233 0302 669908 or 233 0302 669914
Fax
233 0302 669913
E-mail
[email protected] ; [email protected]
Name of Local Currency
Ghana Cedi
Tax Rates (dividends, interest, capital gains) 8% withholding tax on dividends, 0% tax on
capital gains, no stamp duty
Listing of Foreign Domiciled Companies
Available
Commodities Exchange
Not available
ASEA
Y E A R B O O K
Website
Market Regulator
98
African Securities Exchanges Association
Background of the Ghana Stock Exchange
The Ghana Stock Exchange was established in July 1989 as a private company limited by
guarantee under the Ghana Companies Code, 1963. It was given recognition as an authorized
Stock Exchange under the Stock Exchange Act of 1971 (Act 348) in October 1990. The
Exchange was inaugurated on November 12, 1990 and trading commenced on its floor
the same day. The Exchange was officially launched on January 11. 1991 and became a
public company limited by guarantee in April 1994. The Ghana Stock Exchange is a private
sector initiative and is not funded by government. It has however, enjoyed the support of the
Government of Ghana since inception.
The Exchange is governed by a nine member Council - two representatives each from Licensed
Dealing Members and Listed Companies, three independent members and two Executive
Directors of the Exchange. The Council’s Membership includes some of the most distinguished
and competent persons in Ghanaian commerce, industry, finance and public service. The
Council has all the powers and functions of a Board under the Companies Acts. By virtue of
the Stock Exchange Act 1971, such functions include preventing frauds and malpractices,
maintaining good order among members, regulating stock market business, granting listing
and publishing prices as well as maintaining public confidence in the market and promoting the
Exchange.
Trading takes place daily from Monday to Friday from 9.30am to 15.00pm (GMT). It currently
has twenty (20) Licensed Dealing Members. Trading on the Exchange is done through the
GSE Automated Trading System (GATS) using three alternative levels of access namely; on
the trading floor of the Exchange, at the office of the stockbroker through the Wide Area
Network (WAN) or through the internet. Settlement cycle is T+3. Trade commissions have
been liberalized however the maximum commission chargeable by an LDM is 2.5% of the value
of the transaction
Recent Performance / Latest Development
The Ghana Stock Exchange in 2013 experienced another outstanding performance of listed
equities since its establishment in 1990 in spite of challenging macro-economic conditions.
The exceptional 2013 performance was buoyed largely by increased investor awareness and
good operating results of many of the listed companies as well as the 2nd Tier Pension Fund
Managers’ participation in the market which started in November 2012 supported by the
renewed investor confidence in the Ghanaian market and economy.
Index Performance
The GSE – Composite Index (GSE-CI) recorded a year to date gain of 78.81% ending the year
with 2,145.20 point while the GSE Financial Stock Index (GSE-FSI) also recorded a return of
71.81% ending the year with 1,784.05points. The return on index recorded on the Ghana
Stock Exchange for the year 2013 makes the Exchange one of the best performing stock
market in Sub-Saharan Africa. The GSE-CI and the GSE-FSI recorded a return of 23.81% and
20.94% in December 2012.
ASEA
Y E A R B O O K
99
African Securities Exchanges Association
Market Capitalization
Market capitalization of listed securities at the end of December 2013 was GH¢61,158.29million
compared to the December 2012 end figure of GH¢57,264.22million, an increase of 6.80%.
Domestic Market capitalization recorded a 76.68% increase ending December 2014 with
GH¢11,694.93 compared to GH¢6,753.14 recorded for the same period in 2012. This clearly
shows that there were more price increases in the primary listings on the market.
Turnover
Market turnover in 2013 was positively impacted by the increased activities on the floor of
the Exchange. Volume of shares traded for the year stood at 313million shares valued at
GH¢456.14million. This represents a significant 143.5% and 446% over the volume and value
of 218million shares and GH¢102.19m respectively recorded at the end of December 2012.
Listed Company Performance
Listed companies recorded improved company performances in terms of share price appreciation
for the year under review. Interestingly, some of the listed companies recorded returns higher
than the GSE-CI gain of 78.81%. Out of the 34 companies listed on the GSE, ten companies
made gains of more than 100% with PZ Cussons (PZC) leading the pack with 338.89%. The
rest were Enterprise Group Ltd (EGL) – 291.67%; CAL Bank Ltd (CAL)– 155.26%; Mechanical
Lloyd Co. Ltd (MLC) – 153.33%; Guinness Ghana Breweries Ltd ( GGBL) – 136.64%; GCB Ltd
(GCB) – 130.95%; Benso Oil Palm Plantation (BOPP) – 129.29%; Societe General (SOGEGH)
– 120.59%; Unilever Ghana Ltd (UNIL) – 114.91%; and HFC Bank Ltd (HFC) – 113.33%;. Five
companies recorded gains of 50% and above. This category was also led by Ecobank Ghana
Ltd (EBG) with 87%; Fan Milk Ltd (FML) – 86.48%; TOTAL Ghana Ltd (TOTAL) – 72.33%;
Ecobank Transnational Inc (ETI) – 58.33%; and Sam Woode Ltd (SWL) – 50%. Similarly, five
companies recorded gains of up 50%. There were however, eight companies with no change
in their share prices.
On the other hand, TRANSOL led the losers on the market with a
significant loss of 25% in its share price among five other companies that lost between 20% 5% in their share prices.
Latest Developments
ASEA
Y E A R B O O K
• GSE Securities Depository Ltd, a wholly owned subsidiary of the Ghana Stock Exchange,
merged with Bank of Ghana’s Central Securities Depository. An agreement to that effect
was signed on December 24, 2013. The merger became effective on January 1, 2014.
• For the first time, the Government of Ghana listed its ten year 2nd Eurobond of US$1billion
in August 2013 and the GOG’s GH¢101.57million 17.5% seven year bond was also listed
for first time.
• The Capital requirement of Licensed Dealing Members (LDMs) changed from GH¢100,000
to GH¢1million in December 2013. LDMs have up to March 2014 to comply.
• New Market dedicated for small and medium size companies and start-ups (Ghana
Alternative Market) took off. Two companies have accessed the Listing Support Fund
already: Processed Food and Spices Ltd and Meridian Marshall Holdings Ltd.
• Efforts at Integration of West African Capital markets made good progress. First phase
expected to be implemented in the first quarter of 2014.
100
African Securities Exchanges Association
Section One : Economic Indicators
Main Economic Indicators
Indicators
Population
(million)
Real GDP
(USD) (millions)
at market
exchange rates
Inflation rate (%)
Net Foreign
Direct
Investment
(USD) (Millions)
Unemployment
rate (%)
Interest Rate
(T-Bills)
Exchange rate
(local currency
versus US $)
2010
24.30
2011
24.20
2012
25.2
2013
25.2
30
29
31
14,968.52
8.5
N/A
8.5
81
9.3
4,904
13.2
3,946.41
11.0
11.2
11
12.10
22.53
12.57
13.50
19%
1.47
1.66
1.88
2.16
Section Two : Trading Statistics
Trading equity Statistics
Indicators
Total Value traded $
Total volume traded
Total number of transactions
Number of listed companies (Domestic)†
Number of listed companies (Foreign)‡
Number of traded companies
Domestic Market Capitalization (millions) end
of year¤
Market Capitalization as % of GDP
Turnover Velocity (%) ***
2013
211,176,236.80
313,024,312
34,152
29
5
34
5414.32
189.16%
3.85%
***Turnover Velocity = (Monthly value traded of listed shares/month-end market cap) x 12
(annualized).
ASEA
The exchange’s Domestic Market Capitalization should be reported, this excludes foreign
companies
dual listing on the exchange and collective investment funds ie. REITs, unit trusts
¤
Y E A R B O O K
†Number of companies which have shares listed on an exchange at the end of the period,
split into domestic and foreign, excluding investment funds and unit trusts. A company is
considered domestic when it is incorporated in the same country as where the exchange is
located. A company is considered foreign when it is incorporated in a country other than that
where the exchange is located.
101
African Securities Exchanges Association
Investors Type
Foreigners vs . Local Investors
Type of Investors
% of the Total Value traded $
2010
N/A
N/A
Foreign Investors
Local Investors
Total %
2011
N/A
N/A
2012
N/A
N/A
2013
49.69%
50.31%
100%
Institutions Vs.Individuals
Institutions
Individuals
Total %
N/A
N/A
N/A
N/A
N/A
N/A
90.05%
9.95%
100.00%
Sectors Traded
Sectors traded on the Stock
Exchange
Number Of Companies Included In Each Sector
2010
2011
2012
2013
8
4
3
2
9
4
3
2
9
4
3
2
2
10
3
1
0
2
10
3
1
1
2
10
3
1
1
Domestic Board
Finance
Distribution
Food and Beverage
ICT
Insurance
Manufacturing
Mining
Agriculture
Exchange Traded Fund (ETF)
5 Most Active Sectors in 2013
ASEA
Y E A R B O O K
#
1
2
3
4
5
102
Sectors
Finance
Distribution
Insurance
Food and Beverages
Manufacturing
African Securities Exchanges Association
Section Three: Bonds Statistics
Bonds Statistics
Bonds
Total Value
traded $
Value traded on
governmental
bonds ($)
Value traded
on corporate
bonds
2010
2011
2012
N/A
2013
472,522,755.00
N/A
472,522,755.00
N/A
N/A
Section Four : Trading System
Trading System ( GATS )
Is this system locally developed or
bought?
If bought, who is the Vendor?
Year of implementing the system:
Yes
Infotech Global Pty (ltd)
2009
Section Five : Clearing and Settlement
Where do Clearing & Settlement take
place?
If Separate Company please mention its
name
Is this system locally developed or
bought?
If bought, who is the Vendor?
Year of implementing the system:
Clearing and Settlement is conducted in:
The Stock
Exchange
Separate
Company
Yes
Internally
Infotech Global Pty (Ltd)
2009
T+ 2
T+ 3
Others
Yes
ASEA
Y E A R B O O K
103
African Securities Exchanges Association
Section Six : Products traded on the Stock Exchange
Types of markets in the Stock Exchange
Equity Market
Cash Market
Derivative Market
Bond Market
Yes
Yes
Yes
Products
Product (Stocks,Bonds, Funds, ETF's, Description of the Product
Derivatives, etc.)
Stocks
Ordinary Shares, Preference Shares, one
depository shares
Bonds
Government Bonds, Euro Bond
ETF
1 (Gold)
Section Seven : Trading Mechanism
ASEA
Y E A R B O O K
Margin Trading
Intraday Trading
Online Trading
104
Yes
No
Yes
African Securities Exchanges Association
Section Seven : Indices
Indices
Index Name
GSE Composite Index
(GSE-CI)
GSE Financial Stocks
Index (GSE-FSI)
Index Type (Price Index, Sector Index,..etc)
The calculation of the GSE Composite Index (GSE-CI) is based
on the volume weighted average closing price of all listed stocks.
All ordinary shares listed on GSE are included in the GSE-CI at
total market capitalization, with the exception of those of listed
companies which have shares listed on other markets. The GSECI is a market capitalization weighted index, i.e. each constituent is
given weight according to its market capitalization. The base date
for the GSE-CI is December 31, 2010 and the base index value is
1000.
This index have its constituents as listed stocks from the financial
sector including banking and insurance sector stocks. All ordinary
shares of the financial stocks listed on GSE are included in the
GSE-FSI at total market capitalization, except for those of stocks
which are listed on other markets. The base date of GSE-FSI is
also December 31, 2010 and the base index value is 1000.
2012
GSE-CI
GSE-FSI
Closing 2012
1,199.72
1,039.86
Closing 2013
2,145.20
1,786.60
% Change
78.81
71.81
2013
Company
None
Date of IPO
N/A
Value of IPO ($ million)
N/A
ASEA
Y E A R B O O K
105
African Securities Exchanges Association
Section Eight : IPOs
ASEA
Y E A R B O O K
2012
106
Company
GOG
GOG
GOG
GOG
GOG
GOG
GOG
GOG
GOG
GOG
GOG
GOG
GOG
GOG
GOG
GOG
GOG
GOG
GOG
GOG
GOG
GOG
GOG
GOG
GOG
GOG
GOG
GOG
GOG
GOG
GOG
GOG
GOG
GOG
GOG
GOG
GOG
GOG
GOG
Date of Issue
GHGGOG026477
GHGGOG026519
GHGGOG026550
GHGGOG026592
GHGGOG026634
GHGGOG026675
GHGGOG026717
GHGGOG026758
GHGGOG026808
GHGGOG026766
GHGGOG026840
GHGGOG026915
GHGGOG026964
GHGGOG027012
GHGGOG027061
GHGGOG027103
GHGGOG027145
GHGGOG027194
GHGGOG027236
GHGGOG027285
GHGGOG027327
GHGGOG027392
GHGGOG027442
GHGGOG027400
GHGGOG027665
GHGGOG027731
GHGGOG027517
GHGGOG027590
GHGGOG027558
GHGGOG027806
GHGGOG027871
GHGGOG027947
GHGGOG028010
GHGGOG028085
GHGGOG028150
GHGGOG028226
GHGGOG028291
GHGGOG028374
GHGGOG028440
Face Value of Issue
2 January 2012
$5,885,718.09
9 January 2012
$1,417,686.17
16 January 2012
$615,742.02
23 January 2012
$659,329.26
30 January 2012
$1,989,940.43
6 February 2012
$186,409.57
13 February 2012
$486,188.83
20 February 2012
$3,745,319.15
27 February 2012
$1,343,842.02
27 February 2012
$116,885,638.30
5 March 2012
$1,867,613.83
12 March 2012
$2,185,679.79
19 March 2012
$2,764,482.98
26 March 2012
$4,195,231.91
2 April 2012
$1,343,842.02
9 April 2012
$9,218,923.94
16 April 2012
$2,762,579.79
23 April 2012
$1,099,700.53
30 April 2012
$12,605,064.36
7 May 2012
$58,095,058.51
14 May 2012
$782,304.26
21 May 2012
$17,897,605.85
28 May 2012
$11,138,705.32
28 May 2012
$284,129,550.53
18 June 2012
$13,636,711.70
25 June 2012
$10,505,919.15
4 June 2012
$16,956,561.70
11 June 2012
$1,855,652.66
11 June 2012
$142,170,212.77
2 July 2012
$9,916,156.91
9 July 2012
$19,820,289.89
16 July 2012
$13,111,631.91
23 July 2012
$18,935,308.51
30 July 2012
$23,387,460.11
6 August 2012
$43,061,571.28
13 August 2012
$14,676,664.89
20 August 2012
$5,569,546.28
27 August 2012
$56,585,572.87
3 September 2012
$15,253,488.30
African Securities Exchanges Association
Company
GOG
GOG
GOG
GOG
GOG
Date of Issue
GHGGOG028523
GHGGOG028606
GHGGOG028697
GHGGOG028770
GHGGOG028333
Face Value of Issue
10 September 2012
$3,922,893.62
17 September 2012
$27,686,004.26
24 September 2012
$31,569,063.83
1 October 2012
$33,103,824.47
27 August 2012
$477,995,212.77
TOTAL
$1,523,021,905.32
ASEA
Y E A R B O O K
107
African Securities Exchanges Association
2013
ASEA
Y E A R B O O K
Company
108
GHGGOG029877
GHGGOG029968
GHGGOG029927
GHGGOG030032
GHGGOG030107
GHGGOG030172
GHGGOG030248
GHGGOG030313
GHGGOG030388
GHGGOG030453
GHGGOG030537
GHGGOG030495
GHGGOG030602
GHGGOG030685
GHGGOG030750
GHGGOG030826
GHGGOG030891
GHGGOG030966
GHGGOG031030
GHGGOG031105
GHGGOG031170
GHGGOG031246
GHGGOG031311
GHGGOG031410
GHGGOG031378
GHGGOG031493
GHGGOG031568
GHGGOG031634
GHGGOG031717
GHGGOG031782
GHGGOG031865
GHGGOG031931
GHGGOG032004
GHGGOG032095
GHGGOG032160
GHGGOG032236
GHGGOG032319
GHGGOG032400
GHGGOG032509
GHGGOG032277
Date of Issue
7 January 2013
14 January 2013
14 January 2013
21 January 2013
28 January 2013
4 February 2013
11 February 2013
18 February 2013
25 February 2013
4 March 2013
11March 2013
11 March 2013
18 March 2013
25 March 2013
1 April 2013
8 April 2013
15 April 2013
22 April 2013
29 April 2013
6 May 2013
13 May 2013
20 May 2013
27 May 2013
3 June 2013
3 June 2013
10 June 2013
17 June 2013
24 June 2013
1 July 2013
8 July 2013
15 July 2013
22 July 2013
29 July 2013
05 August 2013
12 August 2013
19 August 2013
26 August 2013
02 September 2013
09 September 2013
26 August 2013
Face Value of issue
($ million)
10.41
184.97
402.07
225.96
31.80
46.47
193.15
69.21
30.08
86.96
13.31
416.00
44.27
55.81
9.51
5.32
226.87
71.55
5.96
6.02
5.05
251.67
15.21
82.12
489.40
40.96
32.55
24.13
12.68
1.48
3.43
5.07
32.46
3.24
5.41
4.41
6.85
40.21
8.05
101.57
African Securities Exchanges Association
Section Nine : 2013 Rankings of Top 5 Trading
Participants
Ranking
1
2
3
4
5
Stockbrokerage
Units
Databank
Brokerage Ltd.
African Alliance
Securities Ltd.
IC Securities Ltd.
HFC Brokerage
Services Ltd.
SBG Securities
Ghana Ltd.
Purchases
$
Sales
Total
$
$
121,043,780.00
104,087,578.00
225,131,358.00
76,905,829.00
80,292,914.00
157,198,743.00
67,324,637.00
57,420,016.00
69,876,414.00
48,893,793.00
137,201,051.00
106,313,809.00
40,750,089.00
23,729,013.00
64,479,102.00
ASEA
Y E A R B O O K
109
African Securities Exchanges Association
Johannesburg
stock exchange profile
www.jse.co.za
Johannesburg Stock Exchange (JSE)
One Exchange Square, Gwen Lane, Sandown,
Sandton
Trading Session hours (local time)
09h00 - 17h00 (Official Trading Hours for the
Equity Market)
Time Zone
+2 GMT
Contact Person for ASEA
Geoff Rothschild
Telephone
+27 11 520 7391 or +27 11 520 7114
Fax
27 11 520 8584
E-mail
[email protected]
Name of Local Currency
Rand
Tax Rates (dividends, interest, capital gains) 0% tax on interest, 15% tax on dividends, 10%
tax on capital gains , 0.25 % = Securities
Transfer Tax
Listing of Foreign Domiciled Companies
Available
Commodities Exchange
Available
ASEA
Y E A R B O O K
Website
Market Regulator
Address
110
African Securities Exchanges Association
INTRODUCTION
The JSE aims to be recognised as the South African exchange providing the leading fully
integrated financial market for African securities as well as an effective gateway to international
products and markets for African investors. The JSE is a vertically and horizontally integrated,
fully electronic exchange offering issuance, trade and post-trade services (vertical) across
five markets – namely equity, equity derivatives, commodity derivatives, spot and derivative
interest rate products, and currency derivatives (horizontal). As a self-regulating organisation,
the JSE regulates issuers and investors in terms of the Securities Services Act, 2004, and
is supervised by the exchange’s regulator, the Financial Services Board. The exchange also
packages and sells market-related data. We continue to diversify our product range across
all markets and are recognised for our innovative ability to structure products that meet client
needs. We employ approximately 500 people directly and are a key part of South Africa’s
financial services ecosystem, which has a significant role in the economic development of a
wide range of stakeholders. 2011 marked a time of significant milestones for the JSE including
our fifth year as a listed company, robust operational performance in all our divisions and the
seamless transition of leadership from our long time CEO Russell Loubser to new JSE CEO
Nicky Newton-King who began in January 2012.
History of JSE
2009
In June the Competition Tribunal gave approval to the JSE to acquire the entire issued share
capital of BESA
2010
Ranked No 1 Regulated Stock exchange by the World Economic Forum Competitiveness
Report
2011
Ranked No 1 Regulated Stock exchange by the World Economic Forum Competitiveness
Report
ASEA
Y E A R B O O K
111
African Securities Exchanges Association
Section One : Economic Indicators
Main Economic Indicators
Indicators
Population (million)*
Real GDP (USD) (billion)
at market exchange
rates
Inflation rate (%)
Net Foreign Direct
Investment (USD)
(Millions)
Unemployment rate (%)**
Interest Rate (91 Days
T-Bills) %
Exchange rate (local
currency versus US$)
2010
50.9
251.7
2011
51.6
262.3
2012
52.3
238.3
2013
53.0
4.3
3,710.8
5.0
4,504.7
5.6
1,571.3
5.7
23.9
6.4
23.8
5.5
24.5
5.3
24.1
5.1
7.3
7.3
8.2
9.7
* Mid-year population estimates. Source: Statistics South Africa
** QLFS survey as at Q4
Section Two : Trading Statistics
Trading equity Statistics
9.639462
Indicators
Total Value traded $
(USD)
Total volume traded
ASEA
2012
2013
408,628,960,228
413,053,999,182
71,463,833,873
61,843,720,761
63,891,885,187
23,758,618
26,504,221
26,934,622
38,964,070
Number of listed
companies
407
406
400
386
Number of traded
companies
386
385
375
361
Market Capitalization
(billions) end of year
(USD)
981,436,975,987 845,584,062,317
998,343,749,374
1,102,369,022,272
Market Capitalization
as % of GDP**
30.91
40.93
55.25
Turnover Velocity (%) *
Y E A R B O O K
2010
71,251,655,807
Total number
of transactions
112
2011
438,087,637,674 402,299,570,059
43.26
46.25
* Turnover Velocity (%)= Value traded of domestic equities/domestic equities market
capitalization
African Securities Exchanges Association
Investors Type
Foreigners vs . Local Investors
Type of Investors
% of the Total Value traded $
2010
15.63
84.37
100
Foreign Investors
Local Investors
Total %
2011
14.35
85.65
100
2012
15.35
84.65
100
2013
16.22
83.78
100
Insitutions Vs. Individuals
Institutions
Individuals
Total %
N/A
N/A
N/A
N/A
N/A
N/A
N/A
N/A
N/A
N/A
N/A
N/A
ASEA
Y E A R B O O K
113
African Securities Exchanges Association
Sectors Traded
Number of Companies Included In
Each Sector
Sectors traded on the Stock Exchange
Domestic Board
2010
2011
2012
2013
Automobiles & Parts
2
2
2
3
Banks
7
7
6
6
Beverages
4
4
4
4
Chemicals
7
6
6
6
31
29
28
27
Corporate Debt
1
1
1
1
Electricity
2
2
2
2
Electronic & Electrical Equipment
15
16
17
15
Equity Investment Instruments
10
12
15
13
Financial Services
25
24
27
28
Fixed Line Telecommunications
2
1
1
2
Food & Drug Retailers
5
5
6
6
Food Producers
16
16
16
16
Forestry & Paper
4
4
4
4
General Industrials
9
11
11
11
18
21
24
23
Health Care Equipment & Services
4
4
5
5
Household Goods & Home Construction
2
2
2
2
Industrial Engineering
10
6
8
8
Industrial Metals & Mining
13
14
12
11
Industrial Transportation
8
7
8
8
Leisure Goods
2
2
2
1
Life Insurance
6
6
6
6
Media
6
6
9
6
Mining
53
55
61
59
Mobile Telecommunications
5
5
5
3
Nonlife Insurance
4
3
3
3
Oil & Gas Producers
3
3
5
5
Other Securities
1
1
50
33
Personal Goods
4
4
5
5
Pharmaceuticals & Biotechnology
5
5
5
5
Preference Shares
8
8
42
40
26
29
43
20
Real Estate Investment Trusts
7
7
7
34
Software & Computer Services
18
14
17
16
Support Services
21
23
20
18
Technology Hardware & Equipment
6
6
6
6
Tobacco
1
1
1
1
15
13
14
12
Construction & Materials
General Retailers
ASEA
Y E A R B O O K
Real Estate Investment & Services
114
Travel & Leisure
African Securities Exchanges Association
5 Most Active Sectors in 2013
Rank
Sector
Volume Traded
Rank
1
Mining
9,903,109,578
1
2
Banks
5,272,198,048
2
3
Life Insurance
4,280,662,854
3
4
Financial Services
4,218,859,419
4
5
Real Estate Investment & Services
3,804,759,699
5
6
Real Estate Investment Trusts
3,377,250,952
6
7
General Retailers
2,732,447,118
7
8
Warrants
2,613,914,139
8
9
Mobile Telecommunications
2,241,320,944
9
10
General Industrials
1,975,980,695
10
11
Household Goods & Home Construction
1,880,441,115
11
12
Health Care Equipment & Services
1,866,576,501
12
13
Construction & Materials
1,819,209,493
13
14
Personal Goods
1,625,376,707
14
1,575,753,943
15
1,315,824,336
16
17
Food & Drug Retailers
1,276,633,805
17
18
Exchange Traded Funds
1,268,195,616
18
19
Pharmaceuticals & Biotechnology
1,258,193,709
19
20
Investment Products
1,202,035,172
20
21
Food Producers
953,499,799
21
22
Oil & Gas Producers
836,869,419
22
23
Forestry & Paper
732,139,044
23
24
Electronic & Electrical Equipment
719,468,202
24
25
Industrial Transportation
693,824,516
25
26
Beverages
690,030,119
26
27
Support Services
611,383,364
27
28
Media
506,325,248
28
29
Industrial Engineering
479,299,790
29
30
Industrial Metals & Mining
468,145,383
30
31
Travel & Leisure
405,800,986
31
32
Fixed Line Telecommunications
273,955,724
32
33
Tobacco
235,787,512
33
34
Chemicals
167,736,036
34
35
Technology Hardware & Equipment
163,930,018
35
36
Preference Shares
148,701,339
36
37
Other Securities
105,436,623
37
38
Automobiles & Parts
87,201,106
38
39
Leisure Goods
32,415,879
39
40
Corporate Debt
28,139,283
40
41
Exchange Traded Notes
26,439,117
41
42
Nonlife Insurance
13,690,003
42
43
Electricity
2,920,282
43
44
Kruger Rands
3,106
44
ASEA
Software & Computer Services
Equity Investment Instruments
Y E A R B O O K
15
16
115
ASEA
116
2,423,734,951,761
63,748,455,870
2,326,957,805,323
63,708,864,073
Value traded on
governmental bonds
($)
Value traded on
corporate bonds
2,487,483,407,631
2011
2,390,666,669,396
2010
Total Value traded $
Bonds
Bonds Statistics
Section Three: Bonds Statistics
Y E A R B O O K
97,765,844,327
2,572,531,909,001
2,670,297,753,328
2012
55,571,870,420
2,011,383,919,753
2,066,955,790,173
2013
African Securities Exchanges Association
African Securities Exchanges Association
Section Four : Trading System
Name of the
Trading System
Bought
Vendor
Equity
Market
Millennium IT
Equity
Derivatives
Nutron
Commodity Currency
Derivatives Derivatives
Nutron
Nutron
Interest Rate
Market
Nutron
Yes
Millennium IT
Yes
Securities
Trading
Technology
2008
Yes
Securities
Trading
Technology
2008
Yes
Securities
Trading
Technology
2010
Year of
2012
Implementation
Yes
Securities
Trading
Technology
2008
Section Five : Clearing and Settlement
Clearing &
Settlement
place
Equity
Equity
Market
Derivatives
Stock
SAFCOM
Exchange
Vendor
Year of
1990
Implementation
Clearing and
T+5
settlement
Securities
Trading
Technology
2008
Commodity Currency
Derivatives Derivatives
SAFCOM
SAFCOM
Securities
Trading
Technology
2008
Securities
Trading
Technology
2008
Interest Rate
Market
STRATE
Securities
Trading
Technology
2010
T+3
Section Six : Products traded on the Stock Exchange
Types of markets in the Stock Exchange
Equity Market
Equity Derivatives Market
Commodity Derivatives Market
Interest Rate Market
Currency Derivatives Market
Yes
Yes
Yes
Yes
Yes
ASEA
Y E A R B O O K
117
African Securities Exchanges Association
ASEA
Y E A R B O O K
Equity Market
118
Product (Stocks,Bonds, Funds, ETF's,
Derivatives, etc.)
Description of the Product
B-Ordinary Shares
B- Ordinary shares are subject to the the Articles of
Association of the company concerned. Holders of B-Ordinary
shares have fewer or no voting rights and may not have a right
to any repayment of capital when a company is wound up.
Debentures
A Debenture is a type of debt instrument, similar to a bond,
that is not secured by physical assets or collateral. Debentures
are documented in an indenture which is a written agreement
between the issuer and holder and sets out specific rights as
to repayment of capital and interest.
Depository Receipts
South African Depository Receipts (SADRs) are not actual
shares of stock, but receipts representing shares. They are
handled and traded just like shares. They offer the same
economic, corporate and voting rights enjoyed by investors
holding underlying shares directly. A SADR may represent one
share, several shares or a fraction of a share, so its price may
differ from that of the share it represents, but should still be
reflective of the price.
Depository Receipts have become a globally accepted,
flexible instrument, enabling issuers to reach investors
located outside their home markets while reducing the risk of
cross-border investment, eg. foreign legislation, transaction
costs and delays, currency exposure as well as complicated
settlement transaction processes.
Exchange Traded Funds (ETFs)
Exchange Traded Funds (ETFs) are listed investment products
that track the performance of a basket of shares, bonds or
commodities. These “baskets” are known as indices, for
example the FTSE/JSE Top 40 Index. An ETF can be bought
and sold just like an ordinary share.
Exchange Traded Notes (ETNs)
An Exchange Traded Note is a contractual obligation made by
an issuer to pay the holder a return which may be linked to,
for example, an interest rate, the performance of one or more
shares, an index, an exchange rate or a commodity
Krugerrand
A Krugerrand is a South African gold coin, first minted in 1967
in order to help market South African gold. The coins have
legal tender status in South Africa but are not actually intended
to be used as currency.
Linked Units
Linked Units are issued by Property Loan Stock Companies
and are similar to ordinary shares in all respects except that
a Linked Unit comprises of part share and part debenture
(loan). Property Loan Stock Companies invest in or derive the
majority of their income from immovable property.
N-Ordinary Shares
N-Ordinary shares are the same as ordinary shares except
that they give shareholders minimal or zero voting rights.
N-Ordinary shares often trade at a discount to ordinary shares.
Although they are likely to cost less they pay out the same
dividends as ordinary shares.
Ordinary Shares
Investors gain ownership in a company when buying shares,
which entitles them to vote in proportion to percentage
ownership. Shareholders are entitled to dividends (after
preference shares dividends and bondholders’ interest is
paid) as well as residual economic value should the company
unwind (after bondholders and preference shareholders are
paid).
African Securities Exchanges Association
Equity Market
GParticipatory Interests
Participatory Interests are issued by Collective Investment
Schemes in Property (also known as Property Unit Trusts).
Property Unit Trusts are similar to other types of unit trusts
in that investor funds are pooled together and then used to
purchase a portfolio of assets, in this case, property assets.
Preference Shares
Preference shares are instruments that have debt (fixed
dividends) and equity (capital appreciation) characteristics.
Preference shareholders have a higher claim on assets
(repayment of capital if company is wound up) and
earnings (dividends) than ordinary shareholders. Preference
shareholders are paid fixed-rate dividends before dividends are
paid to ordinary shareholders
Real Estate Investment Trusts (REIT's)
REIT's are tax advantaged investment vehicles that invest
in and derive their income from real estate properties and
mortgages. REIT's profits are distributed pre-tax and then
taxed in the investors’ hands.
Share Instalments
REIT's are tax advantaged investment vehicles that invest
in and derive their income from real estate properties and
mortgages. REIT's profits are distributed pre-tax and then
taxed in the investors’ hands.
Warrants
REIT's are tax advantaged investment vehicles that invest
in and derive their income from real estate properties and
mortgages. REIT's profits are distributed pre-tax and then
taxed in the investors’ hands.
ASEA
Y E A R B O O K
119
African Securities Exchanges Association
Equity Derivatives
Product
Description of the Product
Can-Do Futures and Options
Can-Do Options are derivative products that give investors the
advantages of listed derivatives with the flexibility of “over the
counter” contracts. Investors can negotiate the terms of an
Options contract, choosing the underlying asset as well as the
expiry date.
Exchange-traded CFDs (eCFDs)
A Contract for Difference (CFD) can be defined as an
agreement (contract) to exchange the difference in value
of a particular asset between the time at which a contract
is opened and the time at which it is closed. An eCFD is
an exchange-traded CFD that is listed and traded on the
exchange and cleared by SAFCOM.
Single Stock Futures
Single Stock Futures are derivative instruments that give
investors exposure to price movements of an underlying
financial instrument (shares). A futures contract is a legally
binding agreement that gives the investor the right to buy or
sell an underlying listed share at a fixed price on a future date.
Equity Index Futures
Equity Index Futures give investors exposure to price
movements of an underlying Index. Participants can invest in
a basket of equities without trading the individual constituent
equities. A futures contract gives the investor the right to buy/
sell an underlying listed financial instrument at a fixed price on
a future date.
ASEA
Y E A R B O O K
MSCI South Africa Index
120
SAVI Squared
SAVI Squared contracts are contracts that obligate the holder
to buy or sell variance at predetermined variance strike price at
a specified future time.
Dividend Neutral Stock Future (DNSF)
"Dividend Neutral Stock Futures (DNSF) are derivative
instruments that give investors exposure to price movements
of an underlying financial instrument (shares). A futures
contract is a legally binding agreement that gives the investor
the right to buy or sell an underlying listed share at a fixed
price on a future date. A DNSF (N-contract) is a basket of two
futures contracts, constructed from a Single Stock Futures
Contract (Q- Contract) and a Dividend Futures Contract
(F-Contract). For instance if the client bought AGL shares, the
broker would trade it in the market as an AGLN contract"
African Securities Exchanges Association
Equity Derivatives
SAVI Top40
The SAVI Top40 (South African Volatility Index) is a forecast of
equity market risk in SA. The SAVI Top40 enables investors to
gauge “fear” and market sentiment relating to the local equity
market.
Dividend Futures
Dividend Futures (DIVF) are derivative contracts used to hedge
against dividend risk that accompany trade in Single Stock
Futures (SSF’s). These contracts are booked in conjunction
with a relevant SSF and offer a simple transaction to enable
investors to protect themselves against any perceived dividend
risk.
Equity Options
An option is a derivative instrument that gives the investor the
right (not the obligation) to buy (call option) or sell (put option)
shares at a fixed price on a future date. Options provide a
cost-effective way of obtaining a large amount of exposure
with very little risk.
There is a dedicated options-maker making prices for both onscreen options trading and small volume structured trades."
International Derivatives(IDX
International Derivatives (IDX) give investors exposure to
price movements of internationally listed shares. Investors
are able to trade Single Stock Futures on internationally listed
companies without the restrictions associated with exchange
control regulations or the expense of setting up foreign trading
accounts
ASEA
Y E A R B O O K
121
African Securities Exchanges Association
ASEA
Y E A R B O O K
Commodity Derivatives
122
Product
Description of the Product
Quanto Futures & Options
A quanto future or quanto option is a type of derivative in
which the underlying traded product references a foreign
underlying, but the instrument itself is settled in another
currency at a fixed rate. These products are attractive to
market participants who wish to gain exposure to a foreign
commodity but without the corresponding exchange rate
influence
Diesel Hedge (referencing European Gasoil)
Futures & Options
A diesel futures or option contract is a type of derivative in
which the underlying traded product references a foreign
underlying, but the instrument itself is settled in Rand per litre
with the JSE performing the necessary currency and volume
conversion. This contract give investors exposure to an
efficient hedge for the local diesel pump prices by tracking an
international reference market. The underlying instrument is
traded under license from the CME Group, namely European
Gasoil and is cash settled.
CBOT Soy complex Futures & Options
(includes beans, meal and oil)
The CBOT Soybean complex Futures & Options contract gives
investors exposure to the international commodities market. A
futures contract is a legally binding agreement that gives the
investor the right to buy or sell an underlying commodity at a
fixed price on a future date.
Grain Futures & Options
Grain Futures give investors the opportunity to hedge
agricultural price risk. A futures contract is a legally binding
agreement that gives the investor the right to buy or sell an
underlying commodity at a fixed price on a future date. The
JSE offers Futures on White Maize, Yellow Maize, Wheat,
Sunflower Seeds and Soya Beans and Sweet Sorghum.
Options contracts are also available.
Options on Commodity Futures
An option contract is a legally binding agreement that gives the
option buyer the right, but not the obligation, to either buy (Call
Option) or sell (Put Option) an underlying commodity at a fixed
price on a future date. Buyers of options pay a non-refundable
premium to obtain this right. Note
Chicago Soft Red Wheat Futures & Options
The Chicago Wheat contract gives investors exposure to
the international commodities market. A futures contract is a
legally binding agreement that gives the investor the right to
buy or sell an underlying commodity at a fixed price on a future
date.
Kansas City Board of Trade Hard Red Winter
Wheat
The Hard Red Winter Wheat contract gives investors exposure
to the international milling wheat market. Now that we offer the
CBOT soft red winter wheat, a local physically settled wheat
contract as well as the KCBT hard red winter wheat, market
participants have a choice as to which contract or contracts
they would like to participate in. A futures contract is a legally
binding agreement that gives the investor the right to buy or
sell an underlying commodity at a fixed price on a future date.
Chicago Corn Futures & Options
The Chicago Corn Futures contract gives investors exposure
to the international commodities market. A futures contract is
a legally binding agreement that gives the investor the right to
buy or sell an underlying commodity at a fixed price on a future
date.
African Securities Exchanges Association
Commodity Derivatives
Crude Oil Futures & Options
Copper Futures
Gold Futures & Options
Platinum Futures & Options
SAVI White Maize
Silver Futures
ASEA
Y E A R B O O K
Commodity Derivatives
A futures contract is a legally binding agreement
giving the investor the right to buy/sell an underlying
commodity at a fixed price on a future date.
This contract gives investors exposure to the
international commodities market. The underlying
instrument: light sweet crude oil futures contract
meeting all specifications as listed and traded on
NYMEX, a subsidiary of CME Group Inc.
A futures contract is a legally binding agreement
giving the investor the right to buy/sell an underlying
commodity at a fixed price on a future date.
This contract gives investors exposure to the
international commodities market. The underlying
instrument: copper futures contract meeting
specifications as listed and traded on NYMEX
through its COMEX Division, a subsidiary of CME
Group Inc
A futures contract is a legally binding agreement
giving the investor the right to buy/sell an underlying
commodity at a fixed price on a future date.
This contract gives investors exposure to the
international commodities market. The underlying
instrument: gold futures contract meeting
specifications as listed and traded on NYMEX
through its COMEX Division, a subsidiary of CME
Group Inc.
A futures contract is a legally binding agreement
giving the investor the right to buy/sell an underlying
commodity at a fixed price on a future date.
This contract gives investors exposure to the
international commodities market. The underlying
instrument: platinum futures contract meeting
specifications as listed and traded on NYMEX
through its COMEX Division, a subsidiary of CME
Group Inc.
The SAVI White Maize (South African Volatility Index)
is constructing a 3 month forward looking index. In
essence we want to know what the market volatility
is three months from today, every day.The SAVI
enables investors to gauge “fear” and market
sentiment relating to the local white maize market.
A futures contract is a legally binding agreement
giving the investor the right to buy/sell an underlying
commodity at a fixed price on a future date.
This contract gives investors exposure to the
international commodities market. The underlying
instrument: silver futures contract meeting
specifications as listed and traded on NYMEX
through its COMEX Division, a subsidiary of CME
Group Inc.
123
African Securities Exchanges Association
Currency Derivatives
Product
Currency Futures
Currency Options
Maxi Currency Futures Contract
Quanto Currency Futures and
Options
ASEA
Y E A R B O O K
RAIN (Rand Index)
124
Description of the Product
A Currency Futures contract allows market
participants to trade the underlying exchange rate
for a period in the future. A currency futures contract
is a legally binding agreement that gives the investor
the right to buy or sell an underlying foreign currency
at a fixed price on a future date.
A Currency Options contract gives the investor
the right (but not the obligation) to buy or sell a
Currency Futures contract on a future date at a fixed
price.
The Dollar/Rand Maxi Currency Futures contract
is a currency future with a larger nominal size of
$100,000 per contract instead of the normal size of
$1,000 per contract.
The JSE has expanded its currency derivatives
range to include a currency contract based on the
Euro/ Dollar exchange, the world’s most actively
traded currency. Quanto Futures and Options are
cash-settled derivatives contracts traded on the JSE
and are settled in Rands without being exposed to
risks associated with a fluctuating Rand.
The RAIN tracks the combined movement of the
Rand against a basket of currencies consisting of
South Africa’s 5 most active international trading
partners. The currency index will be calculated and
distributed by the JSE on a daily basis and will be
listed on the Yield-X platform.
African Securities Exchanges Association
Interest Rate
Product
Bonds
Currency Options
Maxi Currency Futures Contract
Quanto Currency Futures and
Options
RAIN (Rand Index
Description of the Product
A debt investment in which an investor loans
money to an entity (corporate or governmental) that
borrows the funds for a defined period of time at a
fixed interest rate.
A Currency Options contract gives the investor
the right (but not the obligation) to buy or sell a
Currency Futures contract on a future date at a fixed
price.
"The Dollar/Rand Maxi Currency Futures contract
is a currency future with a larger nominal size of
$100,000 per contract instead of the normal size of
$1,000 per contract."
The JSE has expanded its currency derivatives
range to include a currency contract based on the
Euro/ Dollar exchange, the world’s most actively
traded currency. Quanto Futures and Options are
cash-settled derivatives contracts traded on the JSE
and are settled in Rands without being exposed to
risks associated with a fluctuating Rand.
The RAIN tracks the combined movement of the
Rand against a basket of currencies consisting of
South Africa’s 5 most active international trading
partners. The currency index will be calculated and
distributed by the JSE on a daily basis and will be
listed on the Yield-X platform.
Section Seven : Trading Mechanism
Margin Trading
Intraday Trading
Online Trading
Yes
Yes
Yes
ASEA
Y E A R B O O K
125
African Securities Exchanges Association
Section Seven : Indices
ASEA
Y E A R B O O K
Indices
126
Index Name
Index Type (Price Index, Sector Index,..etc)
All Share
The All Share (J203-ALSI) is a free float adjusted market
capitalisation-weighted Headline index.It has a variable
number of constituents. All classes of ordinary shares
listed on the Main Board are eligible for inclusion, with
the exception of inward listed securities that are counted
toward foreign portfolio allowances. Instruments require a
minimum free float of 15% to be considered for inclusion,
as well as meeting a minimum liquidity hurdle based on
a turnover of 0.5% per month. The index captures the
largest 99% of eligible companies by market capitalisation
and is reviewed annually in December.
Top 40
The Top 40 (J200-TOPI) is a free float adjusted market
capitalisation-weighted Headline index.It has a fixed
number of 40 constituents. It captures the largest 40
companies included in the All Share Index, measured by
market gross market capitalisation. It is reviewed quarterly
in March, June, September and December.
Mid Cap
The Mid Cap (J201-MIDC) is a free float adjusted market
capitalisation-weighted Headline index.It has a fixed
number of 60 constituents. It captures the next 60
largest companies in the All Share Index following the 40
selected for the Top 40 index, measured by gross market
capitalisation.
Small Cap
The Small Cap (J202-SMLC) is a free float adjusted market
capitalisation-weighted Headline index.It has a variable
number of constituents. It represents the balance of
companies from the All Share Index that are not captured
in either the Top 40 index or the Mid Cap index.
Shareholder Weighted Top 40
The Shareholder Weighted Top 40 (J400-DTOP) is a
domestic free float adjusted market capitalisation-weighted
Specialist index.It has a fixed number of 40 constituents. The index mirrors the All Share index in terms of constituent
selection, but restricts individual weighting based on the
proportion of each company's share register that is
accounted for on the local share register.
Shareholder Weighted All Share
The Shareholder Weighted All Share (J403-DALS) is a
domestic free float adjusted market capitalisation-weighted
Specialist index.It has a variable number of constituents.
The index mirrors the Top 40 index in terms of constituent
selection, but restricts individual weighting based on
the proportion of each company's share register that is
accounted for on the local share register.
Resource 10
The Resource 10 (J210-RESI) is a free float adjusted
market capitalisation-weighted SA Sector index.It has a
fixed number of 10 constituents. The index captures the 10
largest companies in the All Share Index that are clasisified
as a Resource company under the SA Sector classification
system.
African Securities Exchanges Association
Financial 15
The Financial 15 (J212-FINI) is a free float adjusted market
capitalisation-weighted SA Sector index.It has a fixed
number of 15 constituents. The index captures the 15
largest companies in the All Share Index that are clasisified
as a Financial company under the SA Sector classification
system.
Oil & Gas Producers
The Oil & Gas Producers (J055-OILP) is a free float adjusted
market capitalisation-weighted ICB Sector index.It has a
variable number of constituents.
Oil Equipment & Services
The Oil Equipment & Services (J057-OILE) is a free float
adjusted market capitalisation-weighted ICB Sector index.
It has a variable number of constituents.
Chemicals
The Chemicals (J135-CHES) is a free float adjusted market
capitalisation-weighted ICB Sector index.It has a variable
number of constituents.
Shariah Top 40
The Shariah Top 40 (J140-STOP) is a free float adjusted
market capitalisation-weighted Shariah index.It has a
variable number of constituents.
FTSE/JSE Capped Shariah Top 40
The FTSE/JSE Capped Shariah Top 40 (J141-SCTP) is a
free float adjusted market capitalisation-weighted Shariah
index.It has a variable number of constituents.
Shariah All Share
The Shariah All Share (J143-SALS) is a free float adjusted
market capitalisation-weighted Shariah index.It has a
variable number of constituents.
Gold Mining
The Gold Mining (J150-GLDX) is a free float adjusted
market capitalisation-weighted ICB SubSector index.It has
a variable number of constituents.
Coal Mining
The Coal Mining (J151-COAL) is a free float adjusted
market capitalisation-weighted ICB SubSector index.It has
a variable number of constituents.
Diamond & Gemstones
The Diamond & Gemstones (J152-DIAM) is a free float
adjusted market capitalisation-weighted ICB SubSector
index.It has a variable number of constituents.
Platinum & Precious Metals
The Platinum & Precious Metals (J153-PLAT) is a free float
adjusted market capitalisation-weighted ICB SubSector
index.It has a variable number of constituents.
General Mining
The General Mining (J154-METL) is a free float adjusted
market capitalisation-weighted ICB SubSector index.It has
a variable number of constituents.
Forestry & Paper
The Forestry & Paper (J173-FORE) is a free float adjusted
market capitalisation-weighted ICB Sector index.It has a
variable number of constituents.
Industrial Metals & Mining
The Industrial Metals & Mining (J175-INDM) is a free float
adjusted market capitalisation-weighted ICB Sector index.
It has a variable number of constituents.
ASEA
The Industrial 25 (J211-INDI) is a free float adjusted market
capitalisation-weighted SA Sector index.It has a fixed
number of 25 constituents. The index captures the 25
largest companies in the All Share Index that are clasisified
as an Industrial company under the SA Sector classification
system.
Y E A R B O O K
Industrial 25
127
ASEA
Y E A R B O O K
African Securities Exchanges Association
128
Mining
The Mining (J177-MINI) is a free float adjusted market
capitalisation-weighted ICB Sector index.It has a variable
number of constituents.
Fledgling
The Fledgling (J204-FLED) is a free float adjusted market
capitalisation-weighted Headline index.It has a variable
number of constituents.
Financial and Industrial 30
The Financial and Industrial 30 (J213-FNDI) is a free float
adjusted market capitalisation-weighted SA Sector index.It
has a fixed number of 30 constituents.
Development Capital
The Development Capital (J230-DEVC) is a free float
adjusted market capitalisation-weighted Secondary Market
index.It has a variable number of constituents.
Venture Capital
The Venture Capital (J231-VENC) is a free float adjusted
market capitalisation-weighted Secondary Market index.It
has a variable number of constituents.
Alternative Exchange
The Alternative Exchange (J232-ALTI) is a free float adjusted
market capitalisation-weighted Secondary Market index.It
has a variable number of constituents.
ALT X 15
The ALT X 15 (J233-ALTX) is a free float adjusted market
capitalisation-weighted Secondary Market index.It has a
fixed number of 15 constituents.
Construction & Materials
The Construction & Materials (J235-CONM) is a free float
adjusted market capitalisation-weighted ICB Sector index.
It has a variable number of constituents.
SA Financials and Industrials
The SA Financials and Industrials (J250-ALEX) is a free float
adjusted market capitalisation-weighted SA Sector index.It
has a variable number of constituents.
Preference Share
The Preference Share (J251-PREF) is a free float adjusted
market capitalisation-weighted Preference Share index.It
has a variable number of constituents.
SA Listed Property
The SA Listed Property (J253-SAPY) is a free float adjusted
market capitalisation-weighted Property index.It has a fixed
number of 20 constituents.
Capped Property
The Capped Property (J254-PCAP) is a free float adjusted
market capitalisation-weighted Property index.It has a fixed
number of 20 constituents.
Property Unit Trust
The Property Unit Trust (J255-PRUT) is a free float
adjusted market capitalisation-weighted Property index.It
has a variable number of constituents.
Property Loan Stock
The Property Loan Stock (J256-PULS) is a free float
adjusted market capitalisation-weighted Property index.It
has a variable number of constituents.
African Securities Exchanges Association
SA Resources
The SA Resources (J258-SARI) is a free float adjusted
market capitalisation-weighted SA Sector index.It has a
variable number of constituents.
Dividend+
The Dividend+ (J259-DIVP) is a forward dividend yieldweighted Dividend Forecast index.It has a fixed number of
30 constituents.
RAFI 40
The RAFI 40 (J260-RAFI) is a fundamentally-weighted RAFI
index.It has a fixed number of 40 constituents.
Rafi All Share
The Rafi All Share (J263-RALS) is a fundamentally-weighted
RAFI index.It has a variable number of constituents.
Aerospace & Defense
The Aerospace & Defense (J271-AERO) is a free float
adjusted market capitalisation-weighted ICB Sector index.
It has a variable number of constituents.
General Industrials
The General Industrials (J272-GENI) is a free float adjusted
market capitalisation-weighted ICB Sector index.It has a
variable number of constituents.
Electronic & Electrical Equipment
The Electronic & Electrical Equipment (J273-ELEE) is a free
float adjusted market capitalisation-weighted ICB Sector
index.It has a variable number of constituents.
Industrial Engineering
The Industrial Engineering (J275-INDE) is a free float
adjusted market capitalisation-weighted ICB Sector index.
It has a variable number of constituents.
Industrial Transportation
The Industrial Transportation (J277-INDT) is a free float
adjusted market capitalisation-weighted ICB Sector index.
It has a variable number of constituents.
Support Services
The Support Services (J279-SUPS) is a free float adjusted
market capitalisation-weighted ICB Sector index.It has a
variable number of constituents.
Capped Rafi All Share
The Capped Rafi All Share (J283-RALC) is a fundamentallyweighted RAFI index.It has a variable number of
constituents.
Equally Weighted Top 40
The Equally Weighted Top 40 (J2EQ-ETOP) is a n equallyweighted Specialist index.It has a fixed number of 40
constituents.
Capped Top 40
The Capped Top 40 (J300-CTOP) is a free float adjusted
market capitalisation-weighted Specialist index.It has a
fixed number of 40 constituents.
Capped All Share
The Capped All Share (J303-CALS) is a free float adjusted
market capitalisation-weighted Specialist index.It has a
variable number of constituents.
Value
The Value (J330-FJVI) is a fundamentally-weighted Style
index.It has a variable number of constituents.
ASEA
The SA Industrials (J257-ASIN) is a free float adjusted
market capitalisation-weighted SA Sector index.It has a
variable number of constituents.
Y E A R B O O K
SA Industrials
129
ASEA
Y E A R B O O K
African Securities Exchanges Association
130
Growth
The Growth (J331-FJGI) is a fundamentally-weighted Style
index.It has a variable number of constituents.
Automobiles & Parts
The Automobiles & Parts (J335-AUTM) is a free float
adjusted market capitalisation-weighted ICB Sector index.
It has a variable number of constituents.
Beverages
The Beverages (J353-BEVR) is a free float adjusted market
capitalisation-weighted ICB Sector index.It has a variable
number of constituents.
Food Producers
The Food Producers (J357-FOOD) is a free float adjusted
market capitalisation-weighted ICB Sector index.It has a
variable number of constituents.
Household Goods & Home Construction
The Household Goods & Home Construction (J372-HOUS)
is a free float adjusted market capitalisation-weighted ICB
Sector index.It has a variable number of constituents.
Leisure Goods
The Leisure Goods (J374-LEIS) is a free float adjusted
market capitalisation-weighted ICB Sector index.It has a
variable number of constituents.
Personal Goods
The Personal Goods (J376-PERG) is a free float adjusted
market capitalisation-weighted ICB Sector index.It has a
variable number of constituents.
Tobacco
The Tobacco (J378-TABA) is a free float adjusted market
capitalisation-weighted ICB Sector index.It has a variable
number of constituents.
Equally Weighted Resource 10
The Equally Weighted Resource 10 (J3EQ-ERES) is a n
equally-weighted SA Sector index.It has a fixed number of
10 constituents.
Health Care Equipment & Services
The Health Care Equipment & Services (J453-HEES) is
a free float adjusted market capitalisation-weighted ICB
Sector index.It has a variable number of constituents.
Pharmaceuticals & Biotechnology
The Pharmaceuticals & Biotechnology (J457-PHAR) is
a free float adjusted market capitalisation-weighted ICB
Sector index.It has a variable number of constituents.
Equally Weighted Financial 15
The Equally Weighted Financial 15 (J4EQ-EFIN) is a n
equally-weighted SA Sector index.It has a fixed number of
15 constituents.
Oil & Gas
The Oil & Gas (J500-OILG) is a free float adjusted market
capitalisation-weighted ICB Industry index.It has a variable
number of constituents.
Alternative Energy
The Alternative Energy (J508-ALEN) is a free float adjusted
market capitalisation-weighted ICB Sector index.It has a
variable number of constituents.
Basic Materials
The Basic Materials (J510-BASM) is a free float adjusted
market capitalisation-weighted ICB Industry index.It has a
variable number of constituents.
Industrials
The Industrials (J520-IIND) is a free float adjusted market
capitalisation-weighted ICB Industry index.It has a variable
number of constituents.
Consumer Goods
The Consumer Goods (J530-CONG) is a free float adjusted
market capitalisation-weighted ICB Industry index.It has a
variable number of constituents.
African Securities Exchanges Association
General Retailers
The General Retailers (J537-GERE) is a free float adjusted
market capitalisation-weighted ICB Sector index.It has a
variable number of constituents.
Health Care
The Health Care (J540-HEAL) is a free float adjusted market
capitalisation-weighted ICB Industry index.It has a variable
number of constituents.
Consumer Services
The Consumer Services (J550-CONS) is a free float adjusted
market capitalisation-weighted ICB Industry index.It has a
variable number of constituents.
Media
The Media (J555-MEDI) is a free float adjusted market
capitalisation-weighted ICB Sector index.It has a variable
number of constituents.
Telecommunication
The Telecommunication (J560-TELE) is a free float adjusted
market capitalisation-weighted ICB Industry index.It has a
variable number of constituents.
Utilities
The Utilities (J570-UTLS) is a free float adjusted market
capitalisation-weighted ICB Industry index.It has a variable
number of constituents.
Travel & Leisure
The Travel & Leisure (J575-TRAV) is a free float adjusted
market capitalisation-weighted ICB Sector index.It has a
variable number of constituents.
Financials
The Financials (J580-FINA) is a free float adjusted market
capitalisation-weighted SA Sector index.It has a variable
number of constituents.
Technology
The Technology (J590-TECH) is a free float adjusted market
capitalisation-weighted ICB Industry index.It has a variable
number of constituents.
Equally Weighted Industrial 25
The Equally Weighted Industrial 25 (J5EQ-EIND) is a n
equally-weighted SA Sector index.It has a fixed number of
25 constituents.
Fixed Line Telecommunications
The Fixed Line Telecommunications (J653-FTEL) is a free
float adjusted market capitalisation-weighted ICB Sector
index.It has a variable number of constituents.
Mobile Telecommunications
The Mobile Telecommunications (J657-MTEL) is a free float
adjusted market capitalisation-weighted ICB Sector index.
It has a variable number of constituents.
Electricity
The Electricity (J753-ELET) is a free float adjusted market
capitalisation-weighted ICB Sector index.It has a variable
number of constituents.
Gas, Water & Multiutilities
The Gas, Water & Multiutilities (J757-GWMU) is a free float
adjusted market capitalisation-weighted ICB Sector index.
It has a variable number of constituents.
Banks
The Banks (J835-BANK) is a free float adjusted market
capitalisation-weighted ICB Sector index.It has a variable
number of constituents.
Nonlife Insurance
The Nonlife Insurance (J853-NLIF) is a free float adjusted
market capitalisation-weighted ICB Sector index.It has a
variable number of constituents.
ASEA
The Food & Drug Retailers (J533-FOOR) is a free float
adjusted market capitalisation-weighted ICB Sector index.
It has a variable number of constituents.
Y E A R B O O K
Food & Drug Retailers
131
African Securities Exchanges Association
Life Insurance
The Life Insurance (J857-LIFE) is a free float adjusted
market capitalisation-weighted ICB Sector index.It has a
variable number of constituents.
Real Estate Development & Services
The Real Estate Development & Services (J863-REDS) is
a free float adjusted market capitalisation-weighted ICB
Sector index.It has a variable number of constituents.
Real Estate Investment Trusts
The Real Estate Investment Trusts (J867-REIV) is a free
float adjusted market capitalisation-weighted ICB Sector
index.It has a variable number of constituents.
General Financial
The General Financial (J877-GENF) is a free float adjusted
market capitalisation-weighted ICB Sector index.It has a
variable number of constituents.
Equity Investment Instruments
The Equity Investment Instruments (J898-EQII) is a free
float adjusted market capitalisation-weighted ICB Sector
index.It has a variable number of constituents.
Software & Computer Services
The Software & Computer Services (J953-SCOM) is a free
float adjusted market capitalisation-weighted ICB Sector
index.It has a variable number of constituents.
Technology Hardware & Equipment
The Technology Hardware & Equipment (J957-HCOM) is
a free float adjusted market capitalisation-weighted ICB
Sector index.It has a variable number of constituents.
Section Eight : IPOs
2013
Company
N/A
Date of IPO
N/A
Value of IPO (USD)
N/A
2012
ASEA
Y E A R B O O K
Company
N/A
132
Date of IPO
N/A
Value of IPO (USD)
N/A
African Securities Exchanges Association
Section Nine : 2013 Rankings of Top 5 Trading
Participants
Ranking
1
2
3
4
5
Stockbrokerage
Units
Merrill Lynch South
Africa (Pty) Ltd
Deutsche Securities
(Pty) Ltd
UBS South Africa
(Pty) Ltd
ABSA Capital
Securities (Pty) Ltd
Citigroup Global
Markets (Pty) Ltd
Buy
USD
Sell
USD
Total
USD
43,306,477,880
42,037,543,400
85,344,021,280
40,899,370,234
40,402,461,639
81,301,831,873
38,161,170,485
37,724,283,783
75,885,454,267
32,924,795,224
33,495,137,822
66,419,933,046
31,219,343,217
34,249,826,923
65,469,170,140
Section Nine : 2012 Rankings of Top 5 Trading
Participants
Ranking
1
2
3
4
5
Stockbrokerage
Units
Deutsche Securities
(Pty) Ltd
Merrill Lynch South
Africa (Pty) Ltd
ABSA Capital
Securities (Pty) Ltd
UBS South Africa
(Pty) Ltd
Credit Suisse
Securities
Johannesburg (Pty)
Limited
Buy
USD
Sell
USD
Total
USD
40,624,240,907
40,558,056,635
81,182,297,542
37,587,555,991
36,588,996,544
74,176,552,535
33,700,282,959
34,705,144,108
68,405,427,067
33,694,638,293
33,603,800,949
67,298,439,242
31,738,144,609
30,573,318,610
62,311,463,219
ASEA
Y E A R B O O K
133
African Securities Exchanges Association
Section Nine : 2011 Rankings of Top 5 Trading
Participants
Ranking
1
2
3
4
5
Stockbrokerage Units
Deutsche Securities (Pty)
Ltd
UBS South Africa (Pty) Ltd
ABSA Capital Securities
(Pty) Ltd
Credit Suisse Securities
Johannesburg (Pty)
Limited
Merrill Lynch South Africa
(Pty) Ltd
Buy
Sell
Total
USD
USD
USD
42,736,269,665 42,260,722,753 84,996,992,418
35,155,293,012 35,254,128,073 70,409,421,085
30,947,730,986 32,203,474,765 63,151,205,751
28,783,464,285 29,615,172,276 58,398,636,561
29,006,988,468 27,850,086,585 56,857,075,053
Section Nine : 2010 Rankings of Top 5 Trading
Participants
]
Ranking
Buy
Sell
Total
USD
USD
USD
42,853,599,888 41,748,973,173 84,602,573,061
ASEA
Y E A R B O O K
Stockbrokerage Units
1
Deutsche Securities (Pty)
Ltd
2
SBG Assets (Pty) Ltd
37,270,018,592 36,170,357,702 73,440,376,294
3
Citigroup Global Markets 31,360,285,675 32,222,907,137 63,583,192,812
(Pty) Ltd
4
UBS South Africa (Pty) Ltd 31,428,251,826 31,864,269,666 63,292,521,492
5
JP Morgan Equities Ltd
26,499,579,276 25,721,701,865 52,221,281,141
073 70,409,421,085
3ABSA Capital Securities (Pty) Ltd 30,947,730,986 32,203,474,765 63,151,205,751
4
Credit Suisse Securities Johannesburg (Pty) Limited 28,783,464,285 29,615,172,276 58,398,636,561
5
Merrill Lynch South Africa (Pty) Ltd
29,006,988,468 27,850,086,585 56,857,075,053
134
African Securities Exchanges Association
rwanda stock
exchange profile
Website
www.rse.rw
Market Regulator
Address
Capital Market Authority
1st Floor, Kigali City Tower,( KCT),P.O.Box
3882, Kigali Rwanda,KN 81 ST"
09:00-12:00
Trading Session hours (local time)
Time Zone
Contact Person for ASEA
Telephone
Fax
E-mail
Name of Local Currency
Tax Rates (dividends, interest, capital gains)
Listing of Foreign Domiciled Companies
Celestine Rwabukumba, CEO
250-788516021
[email protected] , [email protected]
Rwandan Franc
The Rwanda Stock Exchange Limited
was incorporated on 7th October 2005
with the objective of carrying out stock
market operations. The Stock Exchange
was demutualised from the start as it was
registered as a company limited by shares.
The Rwanda Stock Exchange Board is
comprised of 7 members distributed as
follows:
ASEA
Commodities Exchange
Y E A R B O O K
1. Government of Rwanda will have one
representative
2. Members will have three representatives
3. Institutional investors will have one
representative
4. Members of the public and/or professional
bodies will have one representative
5. Listed companies will have one
representative
135
African Securities Exchanges Association
RWANDA STOCK EXCHANGE PROFILE
BACKGROUND
The Rwanda Stock Exchange (RSE) was incorporated on October 7th, 2005 to carry out
stock market operations in Rwanda but the company was kept in shelf registration as other
developments were taking place. The Rwanda Stock Exchange Limited was officially launched
on January 31st, 2011 as a fully demutualized company. The ownership structure of the stock
exchange consists of Members of the exchange (60%), Government of Rwanda (20%) and
Institutional investors (20%). The governance structure has three levels namely, The General
Assembly of shareholders, The Board of Directors and Management. The membership structure
consists of three categories namely the Stock brokers, Dealers and Advisors or Sponsors. The
RSE has eight full stock brokers and two Advisors or Sponsors who are actively conducting
business on the Rwandan stock market.
MARKET PERFORMANCE IN 2012
The market continued an upward trend after the first two IPOs from domestic companies Bralirwa
and Bank of Kigali, a Brewery and a Bank, respecively joined two cross listed companies from
the region: KCB Bank and Nation Media Group both from Kenya. RSE launched its first Index
RSE comprised of a domestic share index Rwanda Share Index(RSI) and and an All share
Index( ALSI). The two indices went up 61% and 11%, respectively. Activity also contunued its
momentum on RSE despite the lack of new IPOs in 2012. The market registered a turnover
of USD 28 Million compared to USD 35.3 Million in 2011 and 103.5 million shares exchanged
hands in 2012 compared to 118.4 million shares in 2011. The bond market registered a turnover
of USD 158,220 during the period under review from compared to USD 823.7 thousand in
2011.
FUTURE OUTLOOK
ASEA
Y E A R B O O K
The RSE is planning to continue conducting public awareness campaigns that will involve the
media, the law makers, potential issuers, the intermediaries and other stakeholders. The stock
exchange plans to increase listings building on privatization issues from the government por
tfolio, private companies, more cross listings as well as public and private debt issues. On the
number of listings, there are first of all a number of companies that government has significant
shareholding and it has adopted a policy of privatizing its own companies through capital
market. RSE is also planning to launch an alternative market for Small and Medium Enterprise
market before end of the second quar ter of the year and plans are under way to fully automate
trading and integrate it to the rest of the region through an Inter depository Transfer Mechanism
(IDT) by July this year so that the market becomes more efficient and more liquid.
136
African Securities Exchanges Association
Section One : Economic Indicators
Main Economic Indicators
Indicators
Population *
Real GDP
(USD) (billions)
at market
exchange
rates**
Inflation rate
(%)***
Net Foreign
Direct
Investment
(USD) (Millions)**
Unemployment
rate (%)
Interest Rate
(T-Bills)-13
weeks***
Exchange rate
(local currency
versus US$)
2010
8,128,553
13.5 2011
8,128,553
14.62 4.58
3.42
343.000
356.700
Currency: USD
2012
2013
10,515,973
12,012,589
15.74
4,805
3.45
3.0
34.00%
N/A
N/A
N/A
N/A
540.00
560.00
580.00
600.00
ASEA
Y E A R B O O K
137
African Securities Exchanges Association
Section Two : Trading Statistics
Trading equity Statistics
Indicators
Total Value traded $ (1)
Total volume traded (1)
Total number of transactions (1)
Number of listed companies (Domestic)†
Number of listed companies (Foreign)‡
Number of traded companies
Domestic Market Capitalization (billions) end of
year¤ ($)
Market Capitalization as % of GDP
Turnover Velocity (%) ***
2013
83,313,691.66
108,437,200
5
2
3
5
2.048
2,048,512,305
406703398560.90%
Number of companies which have shares listed on an exchange at the end of the period,
split into domestic and foreign, excluding investment funds and unit trusts. A company is
considered domestic when it is incorporated in the same country as where the exchange is
located. A company is considered foreign when it is incorporated in a country other than that
where the exchange is located.
¤The exchange’s Domestic Market Capitalization should be reported, this excludes foreign
companies dual listing on the exchange and collective investment funds ie. REITs, unit trusts
***Turnover Velocity = (Monthly value traded of listed shares/month-end market cap) x 12
(annualized).
†
(1) = one way counted-Central Market and Block Market - Rights are included
Investors Type
Foreigners vs. Local Investors
Type of Investors
% of the Total Value traded $
Foreign Investors*
Local Investors
Total %
2011
100
8469
8,569
2012
183
9463
9,646
2013
239
10572
10,811
ASEA
Y E A R B O O K
*Foreign institutional investors(individuals are not considered)
**Traded Value Both Cental and Bloc Markets(Excluding capital raises, public offers, Ipos..)
138
African Securities Exchanges Association
Insitutions Vs. Individuals
Institutions
Individuals*
Total %
*Including foreign individuals
**Traded Value Both Cental and Bloc Markets(Excluding capital raises, public offers, Ipos..)
Sectors Traded
Sectors traded on the Stock Number of companies included in each sector
Exchange
2010
2011
2012
2013
Banks
1
1
2
2
Beverages
0
0
0
0
Food producers & Processors
0
0
0
1
Investment Companies & Other
2
Finance
ASEA
Y E A R B O O K
139
African Securities Exchanges Association
5 Most Active Sectors in 2013
#
1
2
3
4
5
Sectors
Banks
Manufacturing
Electricity
Real Estate
Telecommunications
Section Three : Bonds Statistics
Bonds Statistics
Bonds
Total Value
traded $
Value traded on
governmental
bonds ($)*
Value traded
on corporate
bonds**
2010
N/A
2011
N/A
2012
N/A
2013
N/A
N/A
N/A
N/A
N/A
N/A
N/A
N/A
N/A
*Please note that government bonds are not traded on the exchange
Section Four : Trading System
Trading System
( OMX NASDAQ )
ASEA
Y E A R B O O K
Is this system locally developed or
bought?
If bought, who is the Vendor?
Year of implementing the system:
140
NO
NASDAQ
2014
African Securities Exchanges Association
Section Five : Clearing and Settlement
Where do Clearing & Settlement take
place?
If Separate Company please mention its
name
Is this system locally developed or
bought?
If bought, who is the Vendor?
Year of implementing the system:
Clearing and Settlement is conducted
in:
The Stock
Exchange
Separate
BNR
Company
National Bank of Rwanda
No
CMA SMALL SYSTEMS
2012
T+ 2
T+ 3
Others
Yes
Section Six : Products traded on the Stock
Exchange
Types of markets in the Stock Exchange
Types of markets in the Stock Exchange
Equity Market
Cash Market
Derivative Market
Bond Market
Yes
Yes
:Products
Product (Stocks,Bonds, Funds,
ETF's, Derivatives, etc.)
STOCKS
BONDS
Description of the Product
ASEA
Y E A R B O O K
141
African Securities Exchanges Association
Section Seven : Trading Mechanism
Margin Trading
Intraday Trading
Online Trading
Yes*
Section Seven : Indices
Indices
Index Name
Index Type (Price Index, Sector Index,..etc)
N/A
Closing 2012
Closing 2013
% Change
N/A
Section Eight : IPOs
2012
Company
N/A
Date of IPO
N/A
Value of IPO ($ million)
N/A
2013
Company
N/A
Date of IPO
N/A
Value of IPO ($ million)
N/A
2012
ASEA
Y E A R B O O K
Company
N/A
142
Date of Issue
N/A
Face Value of Issue ($ million)
N/A
African Securities Exchanges Association
2013
Company
N/A
Date of Issue
N/A
Face Value of Issue ($ million)
N/A
Section Nine : 2013 Rankings of Top 5 Trading
Participants
Ranking
1
2
3
4
5
Stockbrokerage
Units
Baraka Capital
MBEA
African Alliance
CDH Capital
SBG Securities
Purchases
$
Sales
$
Total
$
N/A
N/A
N/A
N/A
N/A
N/A
N/A
N/A
N/A
N/A
N/A
N/A
N/A
N/A
N/A
ASEA
Y E A R B O O K
143
African Securities Exchanges Association
LUSAKA stock exchange
profile
Website
Market Regulator
Address
www.luse.co.zm
Securities and Exchange Commiccion (SEC)
Zambia
3rd Floor, Exchange Building, Central Park,
Cairo Road. P.o. Box 34523 Lusaka, Zambia
Trading session hours ( Local time )
1100 to 1400 hrs
Time Zone
GMT +2:00
Contact Person for ASEA
Mrs. Beatrice Nkanza
Telephone
(+260) 1228391 / 228537 / 228594
Fax
(+260) 1225969
E-mail
[email protected]
Name of Local Currency
Zambia Kwacha
ASEA
Y E A R B O O K
Tax Rates (dividends, interest, capital gains)
144
Listing of Foreign Domiciled Companies
Allowed
Commodities Exchange
ZAMACE
(Zambia Agricultural Commodities Exchange)
African Securities Exchanges Association
OVERVIEW
BACKGROUND
The Lusaka Stock Exchange (LuSE) began operations in February 1994. Its formation was
directlylinked to the economic reforms and liberalisation of the Zambian economy that began in
1991,a key feature of which was the privatisation of state-owned enterprises. A stock exchange
was viewed as pivotal to the success of the privatisation programme which was also intended
to facilitate foreign investment.
The securities market in Zambia was formalised by the enactment of the Securities Act in
December 1993. The Securities Act, and its subsidiary legislation in the form of rules, provides
for the operation of a market that is fair, orderly, secure, and transparent. It provides for investor
protection and the licensing of all market players. The Act also provides for the establishment
of the Securities and Exchange Commission (SEC-Zambia) as the regulatory agency for the
Zambian securities market. LuSE is also a self regulatory organisation (SRO) which creates
rules for its members, listed companies and for trading.
Structure
The LuSE is incorporated as a private limited liability company owned by the broker members.
To participate in the Zambian securities market, the first requirement is to incorporate as a
company and thereafter to apply to the SEC for selection as a licensed dealer. Licensed dealers
are qualified to provide financial advisory services to issuers and investors. To buy or sell
securities on behalf of clients (secondary market trading), licensed dealers apply for admission
into membership of the LuSE and thereby become formalised as stock brokers. The LuSE is
therefore a broker-dealer market whereby broker members have dual capacity roles, acting as
agents (brokers) as well being qualified to act as principals (dealers) for their own accounts.
The Articles of Association of the LuSE had provided for a board of eight directors of which six
directors were from the broker members and the other two directors separately represented the
public and the listed companies respectively. However, in line with good corporate governance
practices LuSE broadened its board by allowing for two more independent directors. The LuSE
is licensed by the SEC-Zambia and also has membership, trading, clearing and settlement
rules. The Exchange in 2005 introduced a Corporate Governance Code for listed and quoted
companies.
Markets
LuSE operates a unified market dealing in both equity and debt.
The equity market has two tiers – the listed or main board, and the quoted or second tier
market.
Currently, upon successful registration of equity securities with the Securities and Exchange
Commission Zambia, the company is automatically quoted. Registration of securities is a legal
requirement whereas listing is a matter of contract between the company and the Exchange.
ASEA
Y E A R B O O K
145
African Securities Exchanges Association
To list, a company has to satisfy the LuSE Listing Requirements which are mostly harmonised
with those obtaining in the SADC region. The Listing Requirements specify the minimum free
float, number of public shareholders, profitability period, prescribed share capita and number
of shares in issue. Details of these requirements and rules are available from the Exchange.
To promote listing the Government has established tax incentives that only apply to listed
companies and stocks.
The debt or bond market deals with primary issuance and secondary tatistics
Section One : Economic Indicators
Main Economic Indicators
Indicators
Population*
Real GDP (USD)
(billions) at market
exchange rates**
Inflation rate (%)***
Net Foreign Direct
Investment (USD)
(Millions)**(*as % of
GDP)
Unemployment rate
(%)
Interest Rate
(T-Bills)-13 weeks***
Exchange rate (local
currency versus US$)
2010
2011
2012
2013
13,092,666
13,718,722
14,145,327
14,580,290
334
351.75
377.489
7.90%
7.20%
7.30%
10.680
5.770
8.000
17%
14%
13.00%
9.4
9.2
9.5
9.4
4,796.11
5,117.04
5,146.61
5,512.60
ASEA
Y E A R B O O K
*HCP: hcp.ma
**World Bank
***The central Bank: bkam.ma
146
7.10%
African Securities Exchanges Association
Section Two : Trading Statistics
Trading equity Statistics
Indicators
Total Value traded $ (1)
Total volume traded (1)
Total number of transactions (1)
Number of listed companies (Domestic)†
Number of listed companies (Foreign)‡
Number of traded companies
Domestic Market Capitalization $
end of year ¤
Market Capitalization as % of GDP
2013
38,294,175.37
275,907,714
5,829
20
1
21
10,545,889,517.18
52.40%
Turnover Velocity (%) ***
†Number of companies which have shares listed on an exchange at the end of the period,
split into domestic and foreign, excluding investment funds and unit trusts. A company is
considered domestic when it is incorporated in the same country as where the exchange is
located. A company is considered foreign when it is incorporated in a country other than that
where the exchange is located.
The exchange’s Domestic Market Capitalization should be reported, this excludes foreign
companies dual listing on the exchange and collective investment funds ie. REITs, unit trusts
*** Turnover Velocity = (Monthly value traded of listed shares/month-end market cap) x 12
(annualized).
(1) = one way counted-Central Market and Block Market - Rights are included
Investors Type
Foreigners vs. Local Investors
Type of Investors
Foreign Investors*
Local Investors
Total %
% of the Total Value traded $
2011
2012
19%
21%
81%
79%
100%
100%
2013
36%
64%
100%
*Foreign institutional investors(individuals are not considered)
**Traded Value Both Cental and Bloc Markets (Excluding capital raises, public offers, IPOs..)
ASEA
Y E A R B O O K
147
African Securities Exchanges Association
Insitutions Vs. Individuals
Institutions
Individuals*
Total %
n/a
n/a
n/a
n/a
n/a
n/a
n/a
n/a
n/a
*Including foreign individuals
**Traded Value Both Cental and Bloc Markets(Excluding capital raises, public offers, IPOs..)
Sectors Traded
Sectors traded on the Stock
Exchange
Shares Market Segment
Banks
Beverages
Chemicals
Construction & Building
Materials
Distributors
Electrical & Electronic
Equipment
Electricity
Engineering & Equipment
Industrial Goods
Food producers & Processors
Forestry & Paper
Holding Companies
Insurance
Investment Companies & Other
Finance
Leisures and Hotels
ASEA
Y E A R B O O K
Mining
Oil & Gas
Pharmaceutical Industry
Real Estate
Software & Computer Services
Telecommunications
Transport
Utilities
148
Number of Companies Included in Each Sector
2010
2011
2012
2013
3
2
0
1
3
2
0
1
3
2
0
1
3
2
0
1
0
0
0
0
1
1
1
1
0
1
0
0
1
0
0
1
0
0
1
1
1
1
1
1
1
1
0
1
0
1
0
0
1
1
0
1
0
1
0
0
1
1
0
1
0
1
0
0
1
1
0
1
0
1
0
0
African Securities Exchanges Association
5 Most Active Sectors
#
1
2
3
4
5
Sectors
Banks
Food producers & Processors
Electricity
Real Estate
Telecommunications
Section Three: Bonds Statistics
Bonds Statistics
Bonds
Total Value
traded $
Value traded on
governmental
bonds ($)*
Value traded
on corporate
bonds**
2010
2011
2012
668,935,849.29
1,320,059,828.84
1,659,334,491.00
594,803,753.14
744,389,482.50
1,659,244,491.00
74,132,096.15
575,670,346.34
90,000.00
2013
2,465,057,352.50
2,182,837,362.00
282,219,990.50
Section Four : Trading System
Trading System ( Automated Trading System )
Is this system locally developed or bought?
If bought, who is the Vendor?
Year of implementing the system:
No
MillenniumIT
2008
ASEA
Y E A R B O O K
149
African Securities Exchanges Association
Section Five : Clearing and Settlement
Where do Clearing & Settlement take
place?
The Stock Exchange Central Depository
System
Separate Company
If Separate Company please mention its
name
Is this system locally developed
or bought?
If bought, who is the Vendor?
Year of implementing the system:
Clearing and Settlement is conducted in:
T+ 2
T+ 3
Others
Yes
Section Six : Products traded on the Stock
Exchange
Types of markets in the Stock Exchange
Equity Market
Cash Market
Derivative Market
Bond Market
Yes
Yes
ASEA
Y E A R B O O K
Products
150
Product (Stocks,Bonds, Funds, ETF's,
Derivatives, etc.)
Description of the Product
Stocks
Bonds
Equity
Government
African Securities Exchanges Association
Section Seven : Trading Mechanism
Margin Trading
Intraday Trading
Online Trading
Section Seven : Indices
Indices
Index Name
LASI
Index Type (Price Index, Sector Index,..etc)
Price index
Closing 2012
Closing 2013
% Change
N/A
Section Eight : IPOs
Company
N/A
2012
Date of IPO
Value of IPO ($ million)
2013
Company
N/A
Date of IPO
Value of IPO ($ million)
ASEA
Y E A R B O O K
151
African Securities Exchanges Association
2012
Company
N/A
Date of Issue
Face Value of Issue ($ million)
2013
Company
International Finance
Corporation
Izwe Finance
Date of Issue
26 September 2013
Face Value of Issue ($ million)
2.72
15 July 2013
0.45
Section Nine : 2013 Rankings of Top 5 Trading
Participants
Ranking
1
ASEA
Y E A R B O O K
2
3
4
5
152
Stockbrokerage
Units
Stockbrokers
Zambia
Pangaea
African Alliance
Madison
Inter Market
Purchases
$
Sales
$
Total
$
19,526,768.40
8,269,944.57
27,796,712.97
9,625,855.65
3,104,990.02
2,411,661.60
189,410.94
15,753,218.92
5,779,501.79
4,190,814.41
904,786.62
25,379,074.58
8,884,491.81
6,602,476.01
1,094,197.56
African Securities Exchanges Association
MALAWI stock exchange
profile
Website
www.mse.co.mw
Market Regulator
Reserve Bank Of Malawi
Address
Private Bag 270, Blantyre, Malawi
Trading Session hours (local time)
10:30 am
Time Zone
GMT + 2
Contact Person for ASEA
Symon Msefula
Telephone
265 01 824 233
Fax
265 01 823 636
E-mail
[email protected]
Name of Local Currency
Malawi Kwacha
Tax Rates (dividends, interest, capital gains)
10 % on dividends; 30% on capital gains if
shares owned for less than 12 months.
Listing of Foreign Domiciled Companies
Available
Commodities Exchange
Not available
ASEA
Y E A R B O O K
153
African Securities Exchanges Association
MALAWI STOCK EXCHANGE
1.0REVIEW OF MARKET PERFORMANCE IN 2013
The Malawi Stock Exchange registered a positive return on index of 108.31% (97.26% in US$
terms) compared to 12.03%(-44.34% in US$ terms) registered in 2012 and an increase in both
traded volume and value.
The Malawi Stock Exchange transacted a total of 4,409,237,082 shares at a total consideration
of MK13,331,050,694.05 (US$34,556,393.34) in 1,261 trades. In the corresponding period
2012, the market transacted a total of 667,221,045 shares at a total consideration of
MK3,973,446,152.07 (US$16,183,918.70) in 1,041 trades, reflecting a 560.84% decrease in
terms of share volume and a 235.50% (113.52% in US Dollar terms) increase in value.
The turnover velocity as measured by the ratio of Total Value of Trades to Market Capitalisation
(TVT/MCAP*) was 2.52% in 2013 compared to 1.57% recorded in 2012. The ratio of Total
Value of Trades to Gross Domestic Product (TVT/GDP) recorded a liquidity level of 0.19% in the
review period while in 2012 liquidity was at 0.11%.
2.0LATEST ACHIEVEMENTS
Market Development
• There was no activity in the primary market in 2013 but the Exchange is still optimistic of
listing a bond in Q4 2014.
• We held a financial literacy week under the theme “Promoting personal and household
development through financial literacy” from 9th-13th December at Comesa Hall in Blantyre
where the exchange conducted the first ever live offsite trading.
• In order to stimulate activity on the market, the Stock Exchange held a number of sensitization
workshops throughout the country on stock investment and listing opportunities on the
Exchange.
3.0FUTURE OUTLOOK
ASEA
Y E A R B O O K
Despite the general economic challenges and the uncertainty relating to the general elections on
20 May 2014, the market continued attracting foreign portfolio investors and remained buoyant
in 2014 with a YTD return on index of 8.70%. Liquidity remains a challenge as investors take
a hold strategy in anticipation of share price gains at the back of strong trading statements by
most counters coupled with marginal floats in some counters.
The Exchange will continue;
• To hold sensitization workshops throughout the country on stock investment and listing
opportunities on the exchange.
• To encourage the listing of both corporate and government bonds on the mse.
• Working with the central bank and other stakeholders in the establishment of the central
share depository system in 2014.
154
African Securities Exchanges Association
Statistics
Section One : Economic Indicators
Main Economic Indicators
Indicators
2010
2011
2012
2013
Population (million)
Real GDP (USD)
(millions) at market
exchange rates
Inflation rate (%)
Net Foreign Direct
Investment (USD)
(Millions)
Unemployment rate
(%)
Interest Rate (T-Bills)
13.80
14.40
14.8
15.3
369.0
390.6
344.0(Oct)
295.2(Oct)
7
10
34.6
23.5
N/A
N/A
N/A
N/A
N/A
N/A
N/A
N/A
10.26
9.78
20.11
36.47
150.8010
163.7515
337.0000
433.1431
Exchange rate (local
currency versus US$)
Section Two : Trading Statistics
Trading equity Statistics
Indicators
2010
2011
2012
Total Value traded $
12,361,586 53,346,694.93 16,183,918.70
Total volume traded 241,957,941 1,590,006,071
667,221,045
Total number of
1,541
1,425
1,041
transactions
Number of listed
15
14
14
companies
Number of traded
13
14
14
companies
Market Capitalization
8.48
16.37
10.57
(billions) end of year
Market Capitalization
36.95%
30.98%
19.95%
as % of GDP**
Turnover Velocity
0.9
3.15
1.57
(%) *
2013
34,556,325.81
4,409,235,132
1,261
14
14.00
16.58
28.57%
2.52
* Turnover Velocity (%)= value traded of domestic equities/domestic equities market
capitalization
ASEA
Y E A R B O O K
155
African Securities Exchanges Association
Investors Type
Foreigners vs. Local Investors
Type of Investors
2010
1%
99%
100%
Foreign Investors
Local Investors
Total %
% of the Total Value traded $
2011
2012
1%
14%
99%
86%
100%
100%
2013
39%
61%
100%
Insitutions Vs. Individuals
Institutions
Individuals
Total %
N/A
N/A
N/A
N/A
N/A
N/A
N/A
N/A
N/A
N/A
N/A
N/A
Sectors Traded
Sectors traded on
the Stock Exchange
ASEA
Y E A R B O O K
Domestic Board
Agriculture
Conglomerates
Construction/Real
Estate
Tourism
Financial Services
Information
Communication
Technology (ICT)
Insurance
Investment Vehicle
156
Number of Companies Included in Each Sector
2010
2011
2012
2013
1
1
1
1
1
1
1
1
1
1
1
1
2
6
1
2
6
1
2
6
1
2
6
1
1
1
1
1
1
1
1
1
African Securities Exchanges Association
5 Most Active Sectors
2013
#
1
2
3
4
5
Sectors
Information Communication Technology (ICT)
Financial Services
Construction/Real Estate
Investment Vehicle
Conglomerates
Section Three: Bonds Statistics
Bonds Statistics
Bonds
Total Value traded $
Value traded on
governmental
bonds ($)
Value traded on
corporate bonds
2010
N/A
N/A
2011
N/A
N/A
2012
N/A
N/A
2013
N/A
N/A
N/A
N/A
N/A
N/A
Section Four : Trading System
Trading System ( N/A )
Is this system locally developed or bought?
If bought, who is the Vendor?
Year of implementing the system:
No
N/A
1996
Section Five : Clearing and Settlement
Where do Clearing & Settlement take
place?
If Separate Company please mention its
name
Is this system locally developed
or bought?
If bought, who is the Vendor?
Year of implementing the system:
Clearing and Settlement is conducted in:
The Stock Exchange No
Separate Company
Central Securities Clearing System Plc. (CSCS)
No
Yes
N/A
1996
ASEA
T+ 5
Y E A R B O O K
T+ 2
T+ 3
Others
Yes
157
African Securities Exchanges Association
Section Six : Products traded on the Stock
Exchange
Types of markets in the Stock Exchange
Equity Market
Cash Market
Derivative Market
Bond Market
Yes
Products
Product (Stocks,Bonds, Funds, ETF's,
Derivatives, etc.)
Stocks
Description of the Product
Oridnary Shares and Preference Shares
Section Seven : Trading Mechanism
Margin Trading
Intraday Trading
Online Trading
Yes
Yes
Yes
Section Seven : Indices
Indices
Index Name
Malawi All Share Index (MASI)
Domestic Share Index (DSI)
ASEA
Y E A R B O O K
Foreign Share Index (FSI)
158
Index Type (Price Index, Sector Index,..etc)
The MASI (Malawi All Share Index) is a market
capitalization index and measures the perfomance
of the entire market. The start date for the MASI is
November 11, 1996 the base value is 100 points.
The Domestic Share Index (DSI) is a market
capitalisation index that tracks all domestically
listed equities. The start date is November 11,
1996 just like the MASI.
The Foreign Share Index (DSI) is a market
capitalisation index that tracks foreign listed
equities and currently tracks only Malawi register
Old Mutual plc shares. The start date is July 12,
1999.
African Securities Exchanges Association
Closing 2012
6,015.51
Closing 2013
12,531.04
% Change
108.31
DSI
4,725.51
9,850.19
108.45
FSI
854.67
1,709.34
100.00
MASI
Section Eight : IPOs
Company
2012
Date of IPO
Value of IPO ($ million)
None
2013
Company
Date of IPO
Value of IPO ($ million)
None
2012
Company
Date of Issue
N/A
N/A
Face Value of Issue
($ million)
N/A
2013
Company
Date of Issue
N/A
N/A
Face Value of Issue
($ million)
N/A
Section Nine : 2013 Rankings of Top 5 Trading
Participants
Ranking
1
Stockbrokerage Units
N/A
Purchases
$
N/A
Sales
$
N/A
Total
$
N/A
ASEA
Y E A R B O O K
159
African Securities Exchanges Association
THE stock exchange OF Mauritius
profile
Website
www.stockexchangeofmauritius.com
Market Regulator
Financial Services Commission
Address
4th Floor,One Cathedral Square
16, Jules Koenig Street
Port-Louis ,Mauritius
Trading Session hours (local time)
9 a.m -1.30 p.m (Official and Development &
Enterprise Markets)
ASEA
Y E A R B O O K
9.30 a.m-1.30 p.m Debt Market
160
Time Zone
GMT +4h
Contact Person for ASEA
Sunil Benimadhu, Chief Executive
Telephone
230 2129541
Fax
230 2088409
E-mail
[email protected]
Name of Local Currency
Mauritian Rupees
Tax Rates (dividends, interest, capital gain)
No Tax on dividends,No tax on interests,No
capital gains tax
African Securities Exchanges Association
History of the Stock Exchange of Mauritius Ltd (SEM)
• The Stock Exchange of Mauritius Ltd (SEM) was incorporated in Mauritius on March 30,
1989 under the Stock Exchange Act 1988, as a private limited company responsible for
the operation and promotion of an efficient and regulated securities market in Mauritius.
Since October 6th, 2008, the SEM has become a public company, and over the years the
Exchange has witnessed a significant overhaul of its operational, regulatory and technical
framework to reflect the ever-changing standards of the stock market environment
worldwide. SEM is today one of the leading Exchanges in Africa, a member of the World
Federation of Exchanges (WFE), and designated by the United Kingdom’s Her Majesty’s
Revenue and Customs (HMRC), as a “recognised Stock Exchange”.
• The SEM operates two markets: the Official Market, the Development & Enterprise Market
(DEM). The Official Market star ted its operations in 1989 with five listed companies and
a market capitalisation of nearly USD 92 million. Currently, there are 41 companies listed
on the Official Market representing a market capitalisation of nearly US$ 6 billion as at 31
January 2013. The DEM has been launched on 4 August 2006 and there are presently 47
companies listed on this market with a market capitalisation of nearly US$ 1.5 billion as at
31 January 2013.
• The stock market was opened to foreign investors following the lifting of exchange control
in 1994.
• Foreign investors do not need approval to trade shares, unless investment is for the purpose
of legal or management control of a Mauritian company or for the holding of more than 15%
in a sugar company. Foreign investors benefit from numerous incentives such as revenue
on sale of shares can be freely repatriated and there are no withholding tax on dividends
and no tax on capital gains.
• SEM’s Automated Trading System (SEMATS) was launched on 29th June 2001, putting an
end to traditional trading patterns which have typified the Stock Exchange of Mauritius since
its inception. Likewise, the successful implementation of the Central Depository System
(CDS) since January 1997 has brought about prompt, efficient clearing and settlement
of trades and at the same time reduced some of the inherent risks in the process. With
the suppor t of the Bank of Mauritius which acts as clearing bank, CDS ensures delivery
versus payment (DVP) on a T+3 rolling basis. The CDS also provides for a Guarantee Fund
Mechanism to guarantee settlement failures of participants.
• The trading of treasury bills on the market has been introduced by the SEM in December
2003, a first step of a process aimed at the setting up of an active secondary market
for government instruments. Lately, SEM has been working closely with the Central Bank
and Commercial Banks to set up a platform to trade medium and long term government
securities on the Exchange.
ASEA
Y E A R B O O K
• The attainment of Membership status of the World Federation of Exchanges (WFE) in
November 2005 also constituted an impor tant milestone that has enabled the SEM to
join the league of stock exchanges that are compliant with the stringent standards and
market principles established by the WFE. This WFE membership status underpins the
growing role that foreign investors are today playing in our market. In a typical year, foreign
investments represent 25–35% of trading activities on our market.
161
African Securities Exchanges Association
• SEM set up in 2006 the Development & Enterprise Market (DEM), which is a market
designed for Small and Medium-sized Enterprises (SME’s) and newly set-up companies
which possess a sound business plan and demonstrate a good growth potential. It is meant
for companies wishing to avail themselves of the advantages and facilities provided by an
organised and regulated market to raise capital to fund their future growth, improve liquidity
in their shares, obtain an objective market valuation of their shares and enhance their overall
corporate image.
• Over the last two years, the SEM is going through a strategic reorientation of its activities
and gradually moving away from an equity-based domestic Exchange to a multi-product
internationally oriented Exchange, in the pursuit of its internationalisation strategy. This
internationalisation process is aiming at moving up the value-chain of products listed/traded
on the SEM platform and setting the stage for the Stock Exchange of Mauritius to gradually
emerge as an attractive listing, trading and capital-raising platform offering a diversity of
products and services for Global funds, Global business companies, Mining and Mineral
companies, specialist-debt products, Africa-based ventures, Government securities, and
become a centre of attraction for regional and global capital.
• In early 2010, SEM brought major changes to its Listing Rules to align them with the
Collective Investment Schemes Regulations 2008 with a view to positioning the SEM
as an attractive venue for the Listing of Global and Specialised Funds. Changes to our
Listing Rules to attract the listing of Global and Specialised Funds on the Exchange fits
very well with the strategic shift currently underway at the SEM. The Exchange has made
its Listing Rules more flexible to reflect the specific attributes and characteristics of the
Specialised Funds it would like to list on the SEM. This initiative goes a long way in making
the SEM a platform of choice for the listing of a wide variety of funds such as Specialised
Collective Investment Schemes, Professional Collective Schemes Expor t Funds, Global
Schemes, and the SEM is keen in diversifying its products offerings and gradually emerge
as an international exchange. The SEM has also a commitment to aggressive timings
on processing of listing applications and has adopted a listing fee structure which is very
competitive.
• Since 2010, SEM can trade and settle equity and debt products in Euro and GBP. SEM
became in June 2011 the first Exchange in Africa to list, trade and settle equity products
in USD. This innovative thrust positions SEM very favourably on the international front and
contributes to the internationalisation of the Exchange.
• In March 2010, the SEM was designated by the Cayman Islands Monetary Authority
(CIMA), and in January 2011 , SEM has also been designated by the United Kingdom’s Her
Majesty’s Revenue and Customs (HMRC), as a “recognised Stock Exchange”.
• SEM introduced in April 2012 listing rules for Depositary Receipts and Mineral Companies
on the Official.
ASEA
Y E A R B O O K
• Market of the SEM as well as Requirements for the listing of junior Mineral Companies and
Exploration.
162
• Companies on the Development and Enterprise Market (DEM).
African Securities Exchanges Association
• In September 2012, SEM was awarded for the second consecutive year the “Most
Innovative African Stock Exchange of the Year Award” at the Africa investor (Ai) prestigious
annual Index Series Awards held at the New York Stock Exchange (NYSE). The Award in
the “Most Innovative African Stock Exchange” category was given on the basis of a number
of criteria, including, amongst others, initiatives implemented by the Exchange to embrace
new areas of development, programmes in place to enhance the services it provides to its
key stakeholders and compliance of the Exchange’s regulatory and operational set-up with
international standards.
• SEM is today connected live to a top bracket of global vendors including the likes of Thompson
Reuters, Interactive Data and more recently Financial Times, Factset, Bloomberg and Inet
Bridge since 2010, enabling therefore both retail and institutional investors worldwide
to follow our market on a real- time basis. The coverage of SEM’s data by global data
vendors is a powerful marketing medium to enhance SEM’s visibility internationally and put
the Exchange on the radar screen of a wider spectrum of institutional investors in par ticular
which are all subscribers to global data vending terminals, thus attracting more foreign
investor interest on our market. SEM is in fact one of the few Exchanges in Africa to be
connected to Bloomberg and Thompson Reuters on a real-time basis. Similarly. the growing
interest from international investors in recent years, has prompted well-known Index and
Data Providers like Standard & Poors, Morgan Stanley, Dow Jones and FTSE to include
our stock market in a number of new indexes they launched recently to track the evolution
of some key frontier emerging markets.
• Looking forward, SEM is committed to reinforcing its foundations and maintaining
its development momentum in line with its multi-pronged internationalisation strategy
of steadily moving from a domestic- equity-focused Exchange to a multi-productinternationally-focused Exchange. In the years to come, the split of listings on SEM is
expected to overwhelmingly consist of international funds, international issuers, specialised
debt instruments, Africa-based ventures, African-focused Exchange-traded funds and
other structured products. The value of products traded and settled in USD, Euro, etc. is
expected to increase over time, confirming the internationalised status of the SEM over time.
As SEM also aspires to emerge as a capital raising platform for Africa-focused investments
routed through the Global Business Sector, the SEM platform will growingly be used
to channel investment flows from SA/Europe/Asia into Africa and from USA/Europe into
Asia. The number of issuers, players and investors in our market will increase over time,
increasing the breadth and depth of our market in Mauritius, and thereby also bringing a
meaningful contribution to the integration of the Mauritius financial services sector within the
international financial system. SEM also aims at consolidating its position with a view to fur
ther contributing more broadly to the development of the Mauritian economy and of capital
market activities on the national and regional fronts.
ASEA
Y E A R B O O K
163
African Securities Exchanges Association
Statistics
Section One : Economic Indicators
Main Economic Indicators
Indicators
2010
2011
2012
2013
Population (million)
Real GDP (USD)
(millions) at market
exchange rates
Inflation rate (%)
Foreign Direct
Investment (USD)
(Millions)
Unemployment rate
(%)
Interest Rate (T-Bills)
1.29
1.29
1.29
1.26
9,427
10,832
11,150
12,001
2.90
6.50
3.90
3.60
445.05
315.41
410.00
311.00
7.5
7.9
8
7.8
3.07
4.33
3
4.3
31.34
29.98
30.9
30.53
Exchange rate (local
currency versus US$)
Section Two : Trading Statistics
Trading equity Statistics
ASEA
Y E A R B O O K
Indicators
Total Value traded $
Total volume traded
Total number of transactions
Number of listed companies (Domestic)
Number of listed companies (Foreign)
Number of traded companies
Domestic Market Capitalization (billions) end
of year
164
2013
468,720,173.76
2,110,898,169.00
71,668
90
1
91
8.80
Market Capitalization as % of GDP
73.34
Turnover Velocity (%)
5.33
†Number of companies which have shares listed on an exchange at the end of the period,
split into domestic and foreign, excluding investment funds and unit trusts. A company is
considered domestic when it is incorporated in the same country as where the exchange is
located. A company is considered foreign when it is incorporated in a country other than that
where the exchange is located.
¤
The exchange’s Domestic Market Capitalization should be reported, this excludes foreign
companies dual listing on the exchange and collective investment funds ie. REITs, unit trusts
*** Turnover Velocity = (Monthly value traded of listed shares/month-end market cap) x 12
(annualized).
African Securities Exchanges Association
Investors Type
Foreigners vs. Local Investors
Type of Investors
Foreign Investors
Local Investors
Total %
% of the Total Value traded $
2011
2012
38.87
26.64
61.13
73.36
100%
100%
2010
21.16
78.24
100%
2013
29.36
70.64
100%
Insitutions Vs. Individuals
Institutions
Individuals
Total %
73.65
26.35
100%
78.91
21.09
100%
74.77
25.23
100%
86.67
13.33
100%
Sectors Traded
Sectors traded on
the Stock Exchange
Banks, Insurance and
other Finance
Commerce
Industry
Investments
Leisure & Hotels
Sugar
Transport
Foreign
Others
Information
Communication &
Technology
Property Development
Funds / GBL
Companies
Number of Companies Included in each Sector
2010
7
2011
7
2012
8
2013
8
11
20
25
8
8
1
1
6
-
11
21
23
8
8
2
1
6
-
9
21
27
8
5
2
1
6
1
9
21
28
8
5
2
1
6
1
1
1
ASEA
Y E A R B O O K
165
African Securities Exchanges Association
5 Most Active Sectors
#
1
2
3
4
5
Sectors
Banks, Insurance and other Finance
Investments
Leisure & Hotels
Others
Industry
Based on Volume Traded
Section Three: Bonds Statistics
Bonds Statistics
Bonds
Total Value traded $
Value traded on
governmental
bonds ($)
Value traded on
corporate bonds
2010
-
2011
934,767.00
-
2012
1,335,048.60
-
2013
6,857,159.73
-
-
934767.0048
1,335,048.60
6,857,159.73
Section Four : Trading System
Trading System ( SEMATS )
Is this system bought?
If bought, who is the Vendor?
ASEA
Y E A R B O O K
Year of implementing the system:
166
Yes
Millenium Information Technology
(MIT)-Sril Lanka
2001
African Securities Exchanges Association
Section Five : Clearing and Settlement
Where do Clearing & Settlement take
place?
The Stock Exchange
Separate Company
Yes
If Separate Company please mention its
Central Securities Depository
name
Is this system locally developed
or bought?
Yes
If bought, who is the Vendor?
Millenium Information Technology (MIT)-Sril Lanka
Year of implementing the system:
2001
Clearing and Settlement is conducted in:
T+ 2
T+ 3
Yes
Others
Section Six : Products traded on the Stock
Exchange
Types of markets in the Stock Exchange
Equity Market
Cash Market
Derivative Market
Bond Market
Yes
Yes
Products
Product (Stocks,Bonds,
Funds,ETF's,Derivatives ..etc)
Stocks
Treasury bills
Debentures
ETFs
Funds
Description of the Product
Ordinary shares and preference shares
Government bonds issued through the
Primary Dealers System
Bonds issued by listed issuers
Investment Funds that track different Indices,
Baskets of Assets or Commodities - ETF
NewGold and ETF Platinum
Specialised Collective Investment Schemes,
Professional Collective Schemes Export
Funds, Global Scheme ASEA
Y E A R B O O K
167
African Securities Exchanges Association
Section Seven : Trading Mechanism
Margin Trading
Intraday Trading
Online Trading
Yes
Yes
Section Seven : Indices
Indices
Index Name
Index Type (Price Index, Sector Index,..etc)
SEMDEX
The SEMDEX is a capital-weighted price index
which trades the price movements of all the
shares listed on the Official Market."
The Total Return Index, the SEMTRI, was
launched in October 2002. Besides capturing
the price movements of listed stocks, common
to the already published all-share index SEMDEX,
the Total Return Index, SEMTRI, incorporates the
added feature of providing investors, in general,
and long-term investors like pensions funds, in
particular, a good measurement of total return
which combines both capital gains/losses on
listed stocks and gross dividends obtained on
these stocks since the inception of the local
stock market on 5 July 1989. Gross dividends
are assumed to be re-invested in the stocks
underlying the capital index, SEMDEX.
The SEM-7 index was introduced in March 1998.
Designed to meet international standards and
provide an investible benchmark for domestic
and foreign market participants, the SEM-7
comprises the seven largest eligible shares of
the Official Market, measured in terms of market
capitalisation, liquidity and investibility criteria.
The DEMEX is a capital-weighted index which
tracks the price weights of the shares listed on
the DEM.
The DEMTRI is a total-return index for the DEM
market.
SEMTRI
SEM-7
DEMEX
DEMTRI
ASEA
Y E A R B O O K
SEMDEX
168
SEM-7
Closing 2012
1,732.06
Closing 2013
2,095.69
337.28
403.64
% change
21%
20%
African Securities Exchanges Association
Section Eight : IPOs
Company
Le Meritt Holdings Ltd
2012
Date of IPO
24-January-13
-
Value of IPO ($ million)
24.73
24.73
2013
Company
None
Date of IPO
-
Value of IPO ($ million)
-
2012
Company
United Investment Ltd- Bond
Omnicane Medium Term
Note
Total
Date of issue
3.07.2012
Face Value of Issue ($ million)
12.74
17.8.2012
34.62
47.36
2013
Company
Date of issue
Face Value of Issue
($ million)
Omnicane Ltd - 2nd
Issue of Notes
Mauritius Commercial
Bank - Notes
United Basalt Products Bond
Total
21 January 13
30
22 August 13
147.40
6 November 13
18.34
195.74
ASEA
Y E A R B O O K
169
African Securities Exchanges Association
Section Nine : 2013 Rankings of Top 5 Trading
Participants
Ranking
1
Stockbrokerage
Units
N/A
Ranking
1
Stockbrokerage
Units
N/A
Purchases
$
Sales
$
Total
$
N/A
N/A
N/A
Purchases
$
Sales
$
Total
$
N/A
N/A
N/A
Members’ Contacts are available on the SEM website the SEM website
ASEA
Y E A R B O O K
www.stockexchangeofmauritius.com
170
African Securities Exchanges Association
MOZAMBIQUE stock exchange
profile
Website
www.bvm.co.mz
Market Regulator
Banco de Mocambique (Central Bank)
Address
Av. 25th September, 5th floor, 5th block,
Maputo - Mozambique
Trading Session hours (local time)
08h00 - 16h00 (Official Trading Hours)
Time Zone
Southern Africa
Contact Person for ASEA
Rodrigues Ernesto Paruque; Pedro Frederico
Cossa
Telephone
+258 21 30 88 26 (8)
Fax
+258 21 31 05 59
E-mail
[email protected]; pedro.cossa@bvm.
co.mz
Name of Local Currency
Metical
Tax Rates (dividends, interest, capital gains)
10% tax on interest, 10% tax on dividends,
0% tax on capital gains
Listing of Foreign Domiciled Companies
Available
Commodities Exchange
Not available
ASEA
Y E A R B O O K
171
African Securities Exchanges Association
OVERVIEW
HISTORICAL BACKGROUND
Mozambique Stock Exchange (BVM) is a public institution under the umbrella of the Ministry
of Finance. It was inaugurated on the 14th October 1999, after being formed, by the Mozambican
Government, and through the Ministry of Planning and Finance, a “Commission for the
installation of a Stock Exchange in Mozambique.
BVM initiated its activities with only one security “Treasury Bond 1999”. Trading has always
been carried out through an electronic system. From 2000 the members began to trade through
a remote trading network which provided direct access for the stockbrokers to the trading
sessions through the internet.
BVM is the management entity of the securities market endowed with necessary means to
ensure continuity in an open and free market, and also has competence to regulate operational
issues by generating conditions for the effective functioning of the market in accordance to high
standards of integrity, regulation, normality and transparency.
The Primary Market
During 2011, the BVM registered five (5) bond issues and four (4) commercial papers issues,
totalizing 9 issues. This is a very positive point compared to the 5 issues from 2010. Also in the
primary market, the shareholders of the “CDM - Cervejas de Moçambique”, decided to perform
a right issue of 9.681.244 shares at a price of USD4,17 each to riase USD40.370,787,48.
Secondary Market
The BVM registered an increase on the number of securities listed. Compared to 2010, where
the BVM counted with 19 listed securities, in 2011, this number increased to a total of 25 listed
securities; increasing as well the market capitalization in 77,08%, from USD352.651.010,91 in
2010 to USD 624.475.972,15 in 2011.
Furthermore, during the same year, there was registered the extinction of one of the listed
treasury bonds which has reached its maturity, and four (4) private bonds have gone through
partial amortizations on its capital issues.
Regarding to tradings, the value of transactions registered a decline of 15,94%. While in 2010
the value of transactions was USD 17.239.852,68, in 2011 it decreased to USD 14.491.448,20.
Structural Reforms
ASEA
Y E A R B O O K
The BVM Central Securities Depository (CSD) is scheduled to start its operations by June 2012.
The system permits the registration of market participants who are recognized and accepted
as members of the system. In 2011, the BVM has gone through the process that has been
initiated
in 2010, in establishing the necessary conditions for the set up of the CSD. The Millennium IT
has been identified as the most appropriate to the Mozambican environment, not only because
172
African Securities Exchanges Association
of the great functionalities it offers but also because it is the software most used among
the
SADC countries.
External Relations
The BVM participated regularly in diverse international forums regarding financial markets.
The most relevant were the ones promoted by the CoSSE – Committee of SADC Stock
Exchanges, the ASEA – African Securities Exchanges Association, the WFE - World
Federation of Exchanges
and the Islamic Securities Exchanges. BVM has also participated in two workshops
regarding Mozambique Stock Exchange
Financial Literacy and Bond Markets, promoted by CoSSE, in a partnership with the
SADC
Executive Secretariat and the Johannesburg Stock Exchange (JSE Limited).
Regulations
During 2011, the BVM upgraded the regulation Nº 3/GPCABVM/2010, of 28 May, after
the approval of the regulation Nº 1/GPCABVM/2011 of the 31st March, which dictates
the minimum quantities for listing at BVM.
FUTURE OUTLOOK
• Once operational by june 2012 the Central Securities Depository (CSD) is scheduled
to start
• its operations by June 2012, which will convey many benefits such as the administration
and control of registered securities, members´ accounts and an internal clearing and
settlement
system of transactions;
The BVM expects to have three (3) more companies listed in the institution;
• The BVM is also working with the Central Bank to create conditions to enable the
use of Treasury Bonds as collateral in the Interbank Money Market operations. At the
moment only Treasury Bills are used for this purpose. The deadline for this project is
June 2012.
• Responsiveness Engagement
• In order to respond to the needs of investors and listed companies, BVM:
launched the upgrading of its technological infrastructure, with the installation of a
data
center according to international standards.
• Developed and upgraded the Institution’s Service of Securities Holders Information
software
(SIAE), in order to increase its functionalities, to better serve the issuers.
• With the same objective mentioned above, the BVM registered the SIAE software
Industrial
Property.
• Upgraded the Institution’s website, in order to provide a more user-friendly interface
for users (investors, listed companies and the public in general).
ASEA
Y E A R B O O K
173
African Securities Exchanges Association
Statistics
Section One : Economic Indicators
Main Economic Indicators
Indicators
2010
2011
2012
2013
Population (million)
Real GDP (USD)
(billions) at market
exchange rates
Inflation rate (%)
Net Foreign Direct
Investment (USD)
(Millions)
Unemployment rate
(%)
Interest Rate (T-Bills)
22.06
22.95
23.52
N/A
21.81
24.19
26.25
N/A
12.4
11.2
2.6
4.2
N/A
N/A
N/A
N/A
21.1
23.9
23.9
N/A
N/A
N/A
N/A
N/A
32.99
27.21
29.65
30.03
Exchange rate (local
currency versus US$)
Section Two : Trading Statistics
Trading equity Statistics
Indicators
Total Value traded $
Total volume traded
Total number of transactions
Number of listed companies (Domestic)†
Number of listed companies (Foreign)‡
Number of traded companies
Domestic Market Capitalization (millions) end
of year ¤
Market Capitalization as % of GDP
Turnover Velocity (%) ***
ASEA
Y E A R B O O K
NA
1.54
Number of companies which have shares listed on an exchange at the end of the period,
split into domestic and foreign, excluding investment funds and unit trusts. A company is
considered domestic when it is incorporated in the same country as where the exchange is
located. A company is considered foreign when it is incorporated in a country other than that
where the exchange is located.
‡
A company is considered foreign when it is incorporated in a country other than that where
the exchange is located.
¤
The exchange’s Domestic Market Capitalization should be reported, this excludes foreign
companies dual listing on the exchange and collective investment funds ie. REITs, unit trusts
*** Turnover Velocity = (Monthly value traded of listed shares/month-end market cap) x 12
(annualized).
†
174
2013
8,424,064.13
766,275.00
NA
4
0
3
0.55
African Securities Exchanges Association
Investors Type
Foreigners vs. Local Investors
Type of Investors
Foreign Investors
Local Investors
Total %
% of the Total Value traded $
2011
2012
Not available
Not available
Not available
Not available
2010
Not available
Not available
2013
33%
67%
100%
Insitutions Vs. Individuals
Type of Investors
Institutions
Individuals
Total %
% of the Total Value traded $
2010
2011
2012
N/A
N/A
N/A
N/A
N/A
N/A
N/A
N/A
N/A
2013
N/A
N/A
N/A
Sectors Traded
Sectors traded on
the Stock Exchange
Domestic Board
Construction/Real
Estate
Consumer Goods
Financial Services
Healthcare
Information
Communication
Technology (ICT)
Industrial Goods
Natural Resources
Oil and Gas
Services
Number Of Companies Included In Each Sector
2010
2011
2012
2013
N/A
N/A
1
1
1
4
N/A
N/A
1
4
N/A
N/A
1
5
N/A
N/A
1
5
N/A
N/A
NA
N/A
2
1
NA
N/A
2
1
NA
N/A
2
1
N/A
N/A
2
1
ASEA
Y E A R B O O K
175
African Securities Exchanges Association
5 Most Active Sectors
#
1
2
3
4
5
Sectors
Consumer Goods
Oil & Gas
Financial Services
Services
N/A
Bonds Statistics
Bonds
Total Value traded $
Value traded on
governmental
bonds ($)
Value traded on
corporate bonds
2010
19,421,320.89
19,365,840.44
2011
13,351,220.97
7,490,031.72
2012
74,450,571.55
70,191,331.53
2013
65,164,155.34
58,702,266.07
55,480.45
5,861,189.25
4,259,240.01
6,461,889.28
Section Four : Trading System
Trading System ( BVM Trading System )
Is this system locally developed or bought?
If bought, who is the Vendor?
Year of implementing the system:
Yes
N/A
1999
Section Five : Clearing and Settlement
Where do Clearing & Settlement take
place?
If Separate Company please mention its
name
Is this system locally developed
or bought?
If bought, who is the Vendor?
Year of implementing the system:
Clearing and Settlement is conducted in:
The Stock Exchange No
Separate Company
Banco de Mocambique
(Mozambique Central Bank)
Yes
No
N/A
1999
ASEA
Y E A R B O O K
T+ 2
T+ 3
Others
176
Yes
Yes
African Securities Exchanges Association
Section Six : Products traded on the Stock
Exchange
Types of markets in the Stock Exchange
Equity Market
Cash Market
Derivative Market
Bond Market
Yes
Yes
Products
Product (Stocks,Bonds, Funds, ETF's,
Derivatives, etc.)
Stocks
Bonds
Commercial Paper
Description of the Product
Oridnary Shares
Governmental Bonds and Corporate Bonds
Short term dept security with a fixed and or
floating rates and maturity up to 1 year
Section Seven : Trading Mechanism
Margin Trading
Intraday Trading
Online Trading
No
Yes
Yes
Section Seven : Indices
Indices
Index Name
N/A
N/A
Index Type (Price Index, Sector Index,..etc)
N/A
Closing 2012
N/A
Closing 2013
N/A
% change
N/A
ASEA
Y E A R B O O K
177
African Securities Exchanges Association
Section Eight : IPOs
2012
Company
None
Date of IPO
Value of IPO ($ million)
2013
Company
EMOSE - Empresa
Moçambicana de
Seguros
Total
Date of IPO
10/17/2013
Value of IPO ($ million)
10.46
10.46
2012
Company
Commercial Paper Petromoc 2012 - I
Commercial Paper Petromoc 2012 - II
Ceta - Equity
Commercial Paper Petromoc 2012 - III
Government Bond 2012
Commercial Paper Petromoc 2012 - IV
Commercial Paper - Moza
Banco 2012
Commercial Paper Petromoc 2012 - V
ASEA
Y E A R B O O K
Total
178
Date of Issue
5 April 2012
Face Value of Issue
($ million)
0.01
18 May 2012
0.10
19 June 2012
25 July 2012
0.59
0.05
22 August 2012
1.06
26 October 12
0.10
15 November 2012
0.24
28 December 2012
0.10
12.71
African Securities Exchanges Association
2013
Company
Commercial Paper Petromoc 2013 - I
Commercial Paper Petromoc 2013 - II
Commercial Paper Petromoc 2013 - III
Government Bond 1st
Serie
Commercial Paper Petromoc 2013 - IV
Commercial Paper Petromoc 2013 - V
Government Bond 2nd
Serie
Government Bond 3rd
Serie
Bonds Companhia de
Mocambique 2013
Bonds Moza Banco 2013
Government Bond 4th
Serie
Bonds Companhia de
Mocambique 2013 - 2nd
Serie
Government Bond 5th
Serie
Bonds Moza Banco 2013
- Subordinated
Date of Issue
25-February-2013
Face Value of Issue
($ million)
0.10
4-April-2013
0.08
11 April 2013
0.10
30 April 2013
0.15
20 May 2013
0.12
28 June 2013
0.10
22 July 2013
0.15
19-September-2013
0.32
30 October 2013
0.07
11/15/2013
3 December 2013
0.08
0.25
12 December 2013
0.03
18 December 2013
0.18
27 December 2013
0.25
ASEA
Y E A R B O O K
179
African Securities Exchanges Association
nairobi sECURITIES exchange
profile
Website
www.nse.co.ke
Market Regulator
Capital Markets Authority (Kenya)
Address
Trading Session hours (local time)
Time Zone
Greenwich Mean Time + 3 hours
Contact Person for ASEA
Telephone
Fax
E-mail
Name of Local Currency
Donald Atieno Ouma
+254 20 2831000
+254 20 2224200
[email protected]
Kenya Shilling
Dividend withholding taxes 5% (domestic
investors) 10% (foreign investors); Withholding
tax on interest income 15%; Capital gains
taxes suspended since 1985
Company must register in Kenya - Registrar
of Companies. If already listed, it must get
a letter of comfort from its listing authority.
It must also get a letter of comfort from its
sector regulator.
Establishment of a futures exchange in
advanced stage
Tax Rates (dividends, interest, capital gain)
Listing of Foreign Domiciled Companies
ASEA
Y E A R B O O K
Commodities Exchange
180
The Exchange Building, 55 Westlands Road,
P O Box 43633 - 00100 Nairobi Kenya
Preopen: 9:00am - 9:30am; Opening Auction:
9:30 am: Continous Trading: 9:30am - 3:00
pm; Close: 3:00pm
African Securities Exchanges Association
The NSE continues to innovate, transform and adapt to fulfil the needs of our stakeholders and
to live up to our own mission of providing a world class securities trading facility. Our long-term
objective is to position Kenya as the financial services hub of the East African Region. The 2012
performance of the NSE was commendable. The NSE 20 Share Index ended 2012 at 4,133.02
points and has been on an upward trend since crossing the 4,000 mark on October 15 2012.
For 2012, the NSE 20 Share Index is up 28.64%. Other indices are also performing well:
Index
NSE All Share
FTSE NSE 15
FTSE NSE 25
Level (December 31 2012)
94.86
125.75
128.46
Performance (%)
38.72
40.11
39.64
Market capitalisation has risen 46.5% to Kshs.1.27 trillion ($14.53 billion).
Capital Transactions
In 2012, the Government of Kenya raised Kshs.115.4 billion ($1.32 billion) through the
issuance and listing of Government of Kenya Treasury Bonds with maturities ranging from one
– twenty years. Corporate debt issues amounted to Kshs.6.97 billion ($79.73 million); rights
issues raised an aggregate amount of Kshs.27.06 billion ($309.54 million) and introductions
increased market capitalization by Kshs.22.46 billion ($256.92 million). 2012 also saw the first
inward cross listing of an East African company on the NSE since the incorporation of the East
African Securities Exchanges Association (EASEA) on May 15 2009, when Umeme Holdings
Ltd., cross listed on the Main Investment Market Segment of the NSE on December 14,
2012. In 2012 capital markets transactions were valued at Kshs.171.89 billion ($1.97 billion).
The NSE Strategic Initiatives
In light of the dynamic environment within which the NSE operates, the NSE Board of Directors
on February 25, 2012 reviewed and approved the revised NSE 5 Year Corporate Plan for the
years between 2010 and 2014 and included Regionalization as a key objective for the NSE
during this period to its previous 5 key objectives.
The revised Corporate Plan reiterates our vision and mission which are:
Vision
“To be a leading securities exchange in Africa, with a global reach”
Mission
“To provide a world class securities trading facility”
The NSE Corporate Plan therefore has six objectives namely:
ASEA
Y E A R B O O K
181
African Securities Exchanges Association
1.
2.
3.
4.
5.
6.
Conver ting from a mutual entity to a corporate entity;
Growing the Existing Business;
Diversifying Revenue Streams;
Enhancing the value of the Brand;
Building Institutional Capacity; and
Regionalization.
THE GROWTH ENTERPRISE MARKET SEGMENT (GEMS)
On June 14 2012, the Minister for Finance gazetted the amendments to the Capital Markets
(Securities) (Public Offers, Listings and Disclosures), operationalising the Growth Enterprise
Market Segment (GEMS) Listing Requirements. The Capital Markets Authority approved the
Nairobi Securities Exchange (Nominated Advisors) Rules, 2012 on September 6, 2012. On
December 10 2012, the Board of Directors of the Exchange approved the registration of the
first four (4) firms as Nominated Advisors and their Authorized Representatives to GEMS. An additional four (4) firms as Nominated Advisors and their Authorized Representatives to
GEMS were registered on January 21 2013. The NOMADS will assist companies to list on
GEMS and to comply with good corporate governance practices. We also believe that GEMS
provides an oppor tunity for firms par ticipating in Kenya’s natural resources and mining sector
to raise capital and also comply with the thirty five percent (35%) local equity component under
Legal Notice No. 118.
THE NSE BROKER BACK OFFICE :
Following the successful launch of the Broker Back Office system on September 5, 2012, the
entire process of transacting in securities has minimal manual intervention and is interfaced
with the trading and settlement platforms. This reduces the risk of trading in securities listed
on the Exchange, which has helped boost investor confidence and facilitate greater access
by enabling internet trading. The system also improves the integrity of the Exchange trading
system and facilitates greater access to our securities markets.
EASEA has since adopted the technical specifications for the Kenya BBO System as the regional standard and to source for funding for the implementation of a Regional Broker Back
Office System.
REGIONALIZATION INITIATIVES
Memorandum of Understanding with Somalia Stock
Exchange
ASEA
Y E A R B O O K
On August 8 2012, the Nairobi Securities Exchange entered into a Memorandum of
Understanding with the Somalia Stock Exchange Investment Corporation (SSE) regarding the
possibility of co-operating to establish a securities exchange business involving the trading,
settlement, delivery and other stockbrokerage activities. The Memorandum of Understanding
was the first step in the journey that would see the development and implementation of a
self sustaining stock exchange in Somalia. The NSE shall have primary responsibility for the
technical development of the Somalia Stock Exchange including identifying the most suitable
par tners and exper tise for the operations of the Somalia Stock Exchange.
182
African Securities Exchanges Association
East African Securities Exchanges Association (EASEA)
The NSE also remains an active member of the East African Securities Exchange Association
(EASEA), whose aim is to standardize regulations and operations within the region to make
cross border investing easier for citizens of the East African Community.
The members of EASEA are the Dar es Salaam Stock Exchange (DSE), the Rwanda Stock
Exchange (RSE), the Uganda Securities Exchange (USE), and the Central Depository and
Settlement Corporation (CDSC). The NSE is also represented in the East African Community
Consultative Forum on the Capital Markets whose long term goal is to establish a regional
capital market. The listing of Umeme Holdings Ltd., is a testament to the commitment of the
members of EASEA to build regional capital markets and the NSE is grateful to the USE for
facilitating the cross listing of Umeme Holdings Ltd. In recognition of the challenges faced by
investors when transacting in cross listed securities, on February 8, 2013, the members of
EASEA unanimously approved an inter-depository transfer mechanism with a commencement
date of March 1, 2013.
Membership of the World Federation of Exchanges (WFE)
The Nairobi Securities Exchange is interested in becoming a full member of the World
Federation of Exchanges. The NSE which is currently an Associate member of the WFE,
has formally written to the WFE to confirm our intention to pursue full membership. In 2013,
the NSE will par ticipate in the evaluation process for full membership to the WFE. The NSE
believes that participating in the evaluation process provides an oppor tunity to audit operational
systems, regulatory framework and corporate governance framework of the Exchange and
benchmark with international best practice.
ASEA
Y E A R B O O K
183
African Securities Exchanges Association
Statistics
Section One : Economic Indicators
Main Economic Indicators
Indicators
Population (million)
Real GDP (USD)
(millions) at market
exchange rates
Inflation rate (%)
Net Foreign Direct
Investment (USD)
(Millions)
Unemployment rate
(%)
Interest Rate (T-Bills)
2011
2012
2013
40
N/A
N/A
29,989
37,810
40,001
19
3
7
833
N/A
N/A
40
N/A
N/A
17
10
9
85
86
86
Exchange rate (local
currency versus US $)
Note: Where (N/A) data is not available
Section Two : Trading Statistics
Trading equity Statistics
Indicators
Total Value traded $
Total volume traded
Total number of
transactions
Number of listed
companies
Number of traded
companies
Market Capitalization
(billions) end of year
Market Capitalization
as % of GDP
ASEA
Y E A R B O O K
Turnover Velocity(%)
*
184
2011
917,577,424
5,721,825,694
382,175
2012
1,084,933,729
5,464,227,641
342,235
2013
1,811,033,172
7,665,919,336
426,372
58
60
61
54
56
57
10
16
22
34%
42%
56%
9%
7%
8%
* Turnover Velocity = (Monthly value traded of listed shares/month-end market cap) x 12
(annualized).
African Securities Exchanges Association
Investors Type
Foreigners vs. Local Investors
Type of Investors
Foreign Investors
Local Investors
Total %
% of the Total Value traded $
2011
2012
52
49
48
51
100%
100%
2013
47
53
100%
Insitutions Vs. Individuals
Institutions
Individuals
Total %
75
25
100%
80
20
100%
75
25
100%
Sectors Traded
Sectors traded on
the Stock Exchange
Commercial and
Services
Banking
Automobiles &
Accessories
Construction & Allied
Energy and Petroleum
Insurance
Investment
Manufacturing & Allied
Telecommunication &
Technology
Agricultural
Fixed Income Market
Segment
Preference shares
Government of Kenya
Treasury Bonds
Corporate Bonds
Number of Companies Included in each Sector
2011
8
2012
9
2013
9
10
4
10
4
11
4
5
4
5
4
9
2
5
5
6
4
9
2
5
5
6
4
9
1
7
7
7
2
60
2
60
1
57
9
22
29
ASEA
Y E A R B O O K
185
African Securities Exchanges Association
5 Most Active Sectors
#
1
2
3
4
5
Sectors
Telecommunication & Technology
Banking
Manufacturing & Allied
Commercial & Services
Construction & Allied
Section Three: Bonds Statistics
Bonds Statistics
Bonds
Total Value traded
Value traded on
governmental bonds
Value traded on corporate
bonds
2011
5,351,069,753
5,298,705,561
2012
6,577,611,159
6,556,035,053
2013
5,261,161,194
5,208,549,582
52,364,191
21,576,106
52,611,612
Section Four : Trading System
Trading System
Is this system locally developed or bought?
If bought, who is the Vendor?
Year of implementing the system:
Bought
MillenniumIT
2006
Section Five : Clearing and Settlement
Where do Clearing & Settlement take
place?
ASEA
Y E A R B O O K
If Separate Company please mention its
name
Is this system locally developed
or bought?
If bought, who is the Vendor?
Year of implementing the system:
Clearing and Settlement is conducted in:
186
The Stock Exchange
Separate Company
Central Depository & Settlement Corporation
Kenya Limited
Yes
MillenniumIT
2004
T+ 2
T+ 3
Others
Yes
Yes
African Securities Exchanges Association
Section Six : Products traded on the Stock
Exchange
Types of markets in the Stock Exchange
Equity Market
Cash Market
Derivative Market
Bond Market
Yes
Being developed and at advanced stage
Yes
Products
Product (Stocks,Bonds,
Funds,ETF's,Derivatives ..etc)
Shares
Description of the Product
Bonds
Government and Corporate Bonds
Common and Preference Shares
Section Seven : Trading Mechanis
Margin Trading
Intraday Trading
Online Trading
Yes
Section Seven : Indices
Indices
Index Name
NSE 20 Share Index
NSE All Share Index (NASI)
FTSE NSE Kenya 15
FTSE NSE Kenya 25
ASEA
Y E A R B O O K
FTSE NSE Kenyan Shilling Government
Bond Index Series
Index Type (Price Index, Sector Index,..etc)
Price index. The index returns are based on capital
gains/losses of the largest 20 securities listed on
the NSE, valued by full market capitalisation.
The NASI calculated using the base-weighted
aggregate methodology also known as the market
value weighted methodology, and encompasses
all equities listed on the Nairobi Stock Exchange.
This tradable index reflects the performance
of the largest 15 stocks, ranked by full market
capitalisation trading on the Nairobi Securities
Exchange.
This tradable index reflects the performance of
the 25 most liquid stocks trading on the Nairobi
Securities Exchange.
This tradable index reflects the performance
of Government Bonds trading on the Nairobi
Securities Exchange.
187
African Securities Exchanges Association
NSE 20 Share Index
Closing 2012
4133
Closing 2013
4,927
% Change
19.21
95
137
43.84
126
129
93
173
174
92
37.30
34.88
-1.08
NSE All Share Index
(NASI)
FTSE NSE Kenya 15
FTSE NSE Kenya 25
FTSE NSE Bond
Index ( Launched in
on 3 october 2012,
index value was 97
points
Section Eight : IPOs
Company
Home Africa Ltd listed
405,255,320 shares at
a price Kshs 12.00 per
share via introduction
I&M Holdings listed
392,000,000 shares at
a price Kshs 50.00 per
share via introduction
2012
Date of Introduction
15 July 2013
Value ($ million)
56
25 June 2013
228
284
Corporate Bonds - 2013
Company
ASEA
Y E A R B O O K
Shelter Afrique Medium
Term Notes
FXD 1/13/05Yr
FR 1/13/05Yr
188
Date of Issue
Face Value of Issue
($ million)
30 September 2013
30 September 2013
49
9
58
African Securities Exchanges Association
Government bonds - 2013
Company
FXD 1/2013/2Yr
FXD 2/2013/2Yr
FXD 3/2013/2Yr
FXD 4/2013/2Yr
FXD 1/2012/5Yr
FXD 1/2013/5Yr
FXD 2/2013/5Yr
FXD 3/2013/5Yr
FXD 1/2012/10Yr
( re-opened)
FXD 1/2013/10Yr
( re-opened)
FXD1/2013/15Yr
( re-opened)
FXD2/2013/15Yr
FXD1/2012/20Yr
( re-opened)
IFB 1/2013/12Yr
Total
Date of Issue
25 February 2013
25 March 2013
26 August 2013
24 December 2013
28 January 2013
29 April 2013
1 July 2013
25 November 2013
25 March 2013
Face Value of Issue
($ million)
238
232
208
294
206
234
150
174
122
26 August 2013
6
29 July 2013
74
29 April 2013
27 May 2013
182
51
30 September 2013
430
2,601
ASEA
Y E A R B O O K
189
African Securities Exchanges Association
Section Nine : 2013 Rankings of Top 5 Trading
Participants
Ranking
Equities
1
2
3
4
5
Bonds
1
2
3
4
5
Stockbrokerage
Units
Kestrel Capital
(E.A)
Renaissance
Capital (K)
SBG Securities
African Alliance
(K)-Stockbroking
Dyer & Blair
Investment
Bank-Broker
Dyer & Blair
Investment
Bank-Broker
Kestrel Capital
(E.A)
Standard
Investment Bank
African Alliance
(K)-Stockbroking
SBG Securities
Purchases
$
Sales
$
Total
$
378,373,044
347,037,591
62,385,314,546
250,994,182
211,064,620
39,737,056,957
214,337,909
190,925,814
226,916,270
190,645,560
37,947,859,371
32,815,138,160
177,018,234
185,575,349
31,183,048,078
1,375,178,264.07 1,404,631,326.45
2,779,809,590.52
1,217,319,434.58 1,204,919,173.28
2,422,238,607.86
686,359,690.18
678,807,737.81
1,365,167,427.99
530,573,212.52
516,139,204.39
1,046,712,416.91
513,988,462.90
520,984,264.70
1,034,972,727.59
ASEA
Y E A R B O O K
Members’ Contacts are available on the NSE website www.nse.co.ke
190
African Securities Exchanges Association
namibia Stock Exchange
profile
Website
www.nsx.com.na
Market Regulator
NAMFISA - Namibia Financial Institutions
Supervisory Authority
Address
Robert Mugabe Avenue 4, Windhoek, Namibia
Trading Session hours (local time)
09h00 - 17h10 in summer and 08h00 - 16h10
in winter
Time Zone
GMT+2 in summer & +1 in winter
Contact Person for ASEA
Tiaan Bazuin
Telephone
264-61-227 647
Fax
264-61-245 831
E-mail
[email protected]
Name of Local Currency
Namibia dollar
Tax Rates (dividends, interest, capital gains)
Listing of Foreign Domiciled Companies
Commodities Exchange
Non-resident shareholders Tax @ 10% of
dividends
The NSX will list a foreign company that is
listed on another recognised stock exchange
and encourages the use depository receipts
N/A
ASEA
Y E A R B O O K
191
African Securities Exchanges Association
Statistics
Section One : Economic Indicators
Main Economic Indicators
Indicators
2010
2011
2012
2013
Population (million)
Real GDP (USD)
(millions) at market
exchange rates
Inflation rate (%)
Net Foreign Direct
Investment (USD)
(Millions)
Unemployment rate
(%)
Interest Rate (T-Bills)
1.80
2.10
2.14
2.18
11,069
12,525
12175
Not yet
available
8.8
6.0
7.6
4.4
798
798
357
Not yet
available
51.0
51.2
28.6
27.4
6.68
6.65
5.42
5.52
6.64
8.14
8.4726
10.4878
Exchange rate (local
currency versus US$)
Section Two : Trading Statistics
ASEA
Y E A R B O O K
Trading equity Statistics
192
Indicators
2010
Total Value traded $ 1,019,677,970
Total volume traded
214,523
Total number
3,071
of transactions
Number of listed
33
companies
(Domestic)
Number of
listed companies
(Foreign)
Number of traded
27
companies
Market Capitalization
173.44
(billions) end of year
Market Capitalization
2186.57%
as % of GDP**
Turnover Velocity
0.59%
(%) *
2011
448,519,339
98,864,818
2,765
2012
494,505,000.00
110,936,000
2,700
2013
574,053,470.45
112,666,861
3,788
32
33
8
26
27
27
21
137.857
159.937
134.052
1100.65%
1184.00%
not yet available
0.32%
0.34%
not yet available
* Turnover Velocity (%)= value traded of domestic equities/domestic
equities market capitalization
African Securities Exchanges Association
Investors Type
Foreigners vs. Local Investors
Type of Investors
Foreign Investors
Local Investors
Total %
% of the Total Value traded $
2010
2011
2012
N/A
N/A
N/A
N/A
N/A
N/A
N/A
N/A
N/A
2013
N/A
N/A
N/A
Insitutions Vs. Individuals
Institutions
Individuals
Total %
N/A
N/A
N/A
N/A
N/A
N/A
N/A
N/A
N/A
N/A
N/A
N/A
Sectors Traded
Sectors traded on the
Stock Exchange
Domestic Board
Industrials Materials
Mining
Chemicals
General Industrials
Support Services
Food Processor
Beverages
Food Producers
General Retailers
Food and Drug Retailers
Banks
Nonlife Insurances
Life Assurance
Real Estate
General Finance
Devx
Bonds
Number of companies included in each sector
2010
2011
2012
2013
1
2
1
1
1
0
1
1
2
1
4
1
3
2
4
8
20
1
2
1
1
0
1
1
1
2
1
4
1
3
2
5
9
25
1
3
1
1
0
1
1
1
2
1
4
1
3
2
4
7
29
1
2
1
1
0
1
1
1
3
1
5
1
3
2
4
7
34
ASEA
Y E A R B O O K
193
African Securities Exchanges Association
5 Most Active Sectors
#
1
2
3
4
5
Sectors
Financial
Basic Materials
Consumer Services
Consumer Goods
Industrials
Section Three: Bonds Statistics
Bonds Statistics
Bonds
Total Value traded $
Value traded on
governmental
bonds ($)
Value traded on
corporate bonds
2010
71742837.11
46,291,914.16
2011
31303963.35
29,461,686.79
2012
57,682,679.54
55,995,179.54
25,450,922.95
1,842,276.56
1,687,500.00
2013
24,690,975.94
24,690,975.94
Section Four : Trading System
Trading System ( JSE - Millenium Exchange )
Is this system locally developed or bought?
If bought, who is the Vendor?
Year of implementing the system:
No
JSE Limited
2012 updated
Section Five : Clearing and Settlement
Where do Clearing & Settlement take
place?
ASEA
Y E A R B O O K
If Separate Company please mention its
name
Is this system locally developed
or bought?
If bought, who is the Vendor?
Year of implementing the system:
Clearing and Settlement is conducted in:
194
The Stock Exchange No
Separate Company
STRATE on dual listed companies
No
No ( We use the system but don’t own it )
STRATE
2000
T+ 2
T+ 3
Others
Yes
NO
NO
T+5
African Securities Exchanges Association
Section Six : Products traded on the Stock
Exchange
Types of markets in the Stock Exchange
Equity Market
Cash Market
Derivative Market
Bond Market
Yes
No
No
Yes
Products
Product (Stocks,Bonds, Funds, ETF's,
Derivatives, etc.)
Equities
Bonds
Description of the Product
An instrument that signifies an ownership
position, or equity, in a corporation, and
represents a claim on its proportionate share in
the corporation's assets and profits. Ordinary
and Preference shares
Secondary trades in Government, State Owned
Enterprise bonds and Corporate bonds
ETF
Section Seven : Trading Mechanism
Margin Trading
Intraday Trading
Online Trading
Yes
Yes
No
ASEA
Y E A R B O O K
195
African Securities Exchanges Association
Section Seven : Indices
Indices
Index Name
Index Type (Price Index, Sector Index,..etc)
NSX Overall Index
The NSX Overall Index is a price index based on the free
float market capital value of all ordinary securities listed
on the main board of the NSX which qualify as eligible for
inclusion in the index.
The NSX Local Index is a price index based on the free
float market capital value of all the ordinary Namibian
registered securities listed on the main board of the NSX
which qualify as eligible for inclusion in the index.
NSX Local Index
Closing 2012
Closing 2013
% Change
NSX Overall Index
983.79
996.73
1.32
NSX Local Index
273.56
331.72
21.26
Section Eight : IPOs
2012
Company
None
Date of IPO
Value of IPO ($ million)
2013
Company
Bank Windhoek
Date of IPO
Value of IPO ($ million)
6/1/2013
34440
2012
Company
ASEA
Y E A R B O O K
None
196
Date of Issue
Face Value of issue ($ million)
African Securities Exchanges Association
2013
Company
Date of Issue
Face Value of Issue ($ million)
None
Section Nine : 2012 Rankings of Top 5 Trading
Participants
Ranking
1
Stockbrokerage Units
N/A
Purchases
$
Sales
$
Total
$
ASEA
Y E A R B O O K
197
African Securities Exchanges Association
THE nIGERIAN stock exchange
profile
Website
Market Regulator
ASEA
Y E A R B O O K
Address
198
www.nse.com.ng
Securities and Exchange Commission (SEC),
Nigeria
Stock Exchange House, 2/4 Customs Street,
P.O.Box 2457, Marina, Lagos, NIGERIA
Trading Session hours (local time)
09h30 - 14h30 (Official Trading Hours)
Time Zone
West Central Africa
Contact Person for ASEA
N. Yvonne Emordi
Telephone
+234 (0)1 463 8333 or +234 (0)1 463 8334
Fax
-
E-mail
[email protected] ; contactcentre@nse.
com.ng
Name of Local Currency
Naira
Tax Rates (dividends, interest, capital gains)
10% tax on interest, 10% tax on dividends, 0%
tax on capital gains
Listing of Foreign Domiciled Companies
Available
Commodities Exchange
Not available
African Securities Exchanges Association
1960
The Lagos Stock Exchange is incorporated as a company Limited by Guarantee. Trading begins
one year later.
1977
The Lagos Stock Exchange is rebranded The Nigerian Stock Exchange.
1984
The Nigerian Stock Exchange launches the All Share Index, a value-weighted market
capitalization index with a base value of 100.
1985
The Second-Tier Securities Market (SSM) is launched to accommodate small and medium
sized companies interested raise capital from the market.
1986
The Exchange moves to its new headquarters at 2/4 Customs Street, Lagos.
1987
The Exchange connects to the Reuters Electronic Contributor System for greater international
exposure.
1992
The All Share Index hits 1,000 points.
1993
The Nigerian Capital Market is deregulated improving the competitiveness of the market and
making it more investor-friendly.
1995
The Exchange Control Act of 1962 and the Nigerian Enterprises Promotion Decree of
1989 are abolished, removing constraints on foreign participation; and the Nigerian
Investment Promotion Commission Decree No.16 and Foreign Exchange (Monitoring &
Miscellaneous) Provisions Decree No.17 are promulgated to encourage international
participation.
The same year, the Board of Trustees of the Investors Protection Fund is inaugurated.
1996
A 5% band limit in daily fluctuation of any equity is imposed, and the Exchange moves from
T+14 clearing and settlement to T+5.
162
1997
The Central Securities Clearing System Limited (CSCS), a subsidiary of the NSE, commences
operations, providing automated clearing, settlement and delivery services, as well as custodian
services.
1998
ASEA
Y E A R B O O K
Trading Rights commences on the exchange. The NSE is elected President of the African
Securities Exchanges Association (ASEA); and the Exchange signs an MOU with the Ghana
Stock Exchange (GSE) to encourage cross border listings.
199
African Securities Exchanges Association
1999
The Exchange moves from the Open Outcry system to the NASDAQ OMX Horizon automated
trading system (ATS); the Investments & Securities Decree No. 45 of 1999 is promulgated
to promote a more efficient and virile capital market; and the NSE signs an MOU with the
Johannesburg Securities Exchange (JSE Ltd.) to encourage cross-border listings. The same
year,the first cross-listed company is admitted to the Main Board.
2000
Ndi Okereke-Onyiuke, OON resumes as the first female Director General of the Exchange; the
NSE signs an MOU with the Nairobi Securities Exchange(NSE) to encourage cross-border
listings; and the Exchange moves to T+3 clearing and settlement. The same year, the Trade
Guarantee
Fund is launched and funded to guarantee the settlement of bona fide market transactions; the
National Annual Essay competition is kicked off at universities all around Nigeria. The NSE
signs MOUs with the International Stock Exchange of London and the Egyptian Exchange
(EGX); and the All Share Index crosses the 10,000 mark.
2002
The Exchange launches its first Web site.
2003
The Exchange extends trading hours – 10:00 to 12:00.
2004
The Exchange admits its first Federal Government Bond to the market.
2005
The NSE and CSCS launch a trade alert notification service, and a digital storage and retrieval
programme for investors.
2007
The Exchange celebrates the opening of its modern electronic trading floor, extends trading
hours by one hour – 09:30 to 12:30, and celebrates a record N1 trillion in the value of trades
transacted upon.
2009
ASEA
Y E A R B O O K
The Exchange begins publishing daily values for the NSE 30 index and for four sector indices –
Banking, Insurance, Food & Beverages and Oil & Gas.
200
African Securities Exchanges Association
Statistics
Section One : Economic Indicators
Main Economic Indicators
Indicators
Population (million)
Real GDP (USD)
(millions) at market
exchange rates
Inflation rate (%)
Net Foreign Direct
Investment (USD)
(Millions)
Unemployment rate
(%)
Interest Rate (T-Bills)
Exchange rate (local
currency versus US$)
2010
2011
2012
2013
155
160
174
174
216,803
247,100
262,610
N/A
13.8
10.9
12.0
8.0
6,200
6,099
7,101
NA
21.1
23.9
23.9
NA
6.85
11.94
11.77
10.97
148.31
151.82
155.44
159.79
ASEA
Y E A R B O O K
201
African Securities Exchanges Association
Section Two : Trading Statistics
Trading equity Statistics
Indicators
Total Value traded $
Total volume traded
Total number of transactions
Number of listed companies
(Domestic)†
Number of listed companies
(Foreign)‡
Number of traded companies
Domestic Market Capitalization
(billions) end of year ¤ ($)
Market Capitalization as % of GDP
2013
6,529,285,578.24
106,539,868,178.00
1,380,789.00
188
2
176.00
80.69
NA
Turnover Velocity (%) ***
7.89
Number of companies which have shares listed on an exchange at the end of the period,
split into domestic and foreign, excluding investment funds and unit trusts. A company is
considered domestic when it is incorporated in the same country as where the exchange is
located. A company is considered foreign when it is incorporated in a country other than that
where the exchange is located.
‡
A company is considered foreign when it is incorporated in a country other than that where
the exchange is located.
¤
The exchange’s Domestic Market Capitalization should be reported, this excludes foreign
companies dual listing on the exchange and collective investment funds ie. REITs, unit trusts
*** Turnover Velocity = (Monthly value traded of listed shares/month-end market cap) x 12
(annualized).
†
Investors Type
Foreigners vs. Local Investors
Type of Investors
Foreign Investors
Local Investors
Total %
2010
49%
51%
100%
% of the Total Value traded $
2011
2012
81%
56%
19%
44%
100%
100%
2013
51%
49%
100%
ASEA
Y E A R B O O K
Insitutions Vs. Individuals
202
Institutions
Individuals
Total %
N/A
N/A
N/A
N/A
N/A
N/A
N/A
N/A
N/A
N/A
N/A
N/A
African Securities Exchanges Association
Sectors Traded
Sectors traded on
the Stock Exchange
Number of Companies Included in each Sector
2010
2011
2012
2013
6
6
11
5
6
11
5
6
9
5
6
8
33
62
11
10
30
56
11
10
29
56
11
10
29
56
11
11
30
9
15
24
26
7
14
22
27
6
14
21
24
5
14
21
Domestic Board
Agriculture
Conglomerates
Construction/Real
Estate
Consumer Goods
Financial Services
Healthcare
Information
Communication
Technology (ICT)
Industrial Goods
Natural Resources
Oil and Gas
Services
* Specify the sector and the number of companies in each
5 Most Active Sectors
#
1
2
3
4
5
6
Sectors
Financial Services
Conglomerates
Consumer Goods
Oil & Gas
ICT
Telecommunications
Section Three: Bonds Statistics
Bonds Statistics
2010
95,332.75
95,332.75
2011
N/A
N/A
2012
53,006.30
46,274.37
2013
1,270,871.65
1,270,871.65
0.00
N/A
6,731.92
N/A
ASEA
Y E A R B O O K
Bonds
Total Value traded $
Value traded on
governmental
bonds ($)
Value traded on
corporate bonds
203
African Securities Exchanges Association
Section Four : Trading System
Trading System ( X-GEN )
Is this system locally developed or bought?
If bought, who is the Vendor?
Year of implementing the system:
Bought
NASDAQ OMX
2013
Section Five : Clearing and Settlement
Where do Clearing & Settlement take
place?
If Separate Company please mention its
name
Is this system locally developed
or bought?
If bought, who is the Vendor?
Year of implementing the system:
Clearing and Settlement is conducted in:
The Stock Exchange No
Separate Company
Yes
Central Securities Clearing System Plc. (CSCS)
No
Yes
NASDAQ OMX
2013
T+ 2
T+ 3
Others
Yes
Section Six : Products traded on the Stock
Exchange
Types of markets in the Stock Exchange
ASEA
Y E A R B O O K
Equity Market
Cash Market
Derivative Market
Bond Market
204
Yes
Yes
African Securities Exchanges Association
Products
Product (Stocks,Bonds, Funds, ETF's,
Derivatives, etc.)
Stocks
Bonds
ETFs
Description of the Product
Oridnary Shares and Preference Shares
Federal Bonds, State and Local (Municipal)
Bonds, and Corporate Bonds
Investment Funds that track different Indices,
Baskets of Assets or Commodities
Section Seven : Trading Mechanism
Margin Trading
Intraday Trading
Online Trading
Yes
Yes
Yes
ASEA
Y E A R B O O K
205
African Securities Exchanges Association
Section Seven : Indices
ASEA
Y E A R B O O K
Indices
206
Index Name
Index Type (Price Index, Sector Index,..etc)
NSE All Share Index (ASI)
The NSE ASI (All Share Index) is a value-weighted market
capitalization index. The start date for the NSE ASI is
January 3, 1984; the base value is 100 points.
NSE 30
The NSE 30 Index comprises the top 30 equities in terms of
market capitalization and liquidity. Only fully-paid common
shares, denominated in the Nigerian currency (naira) are
included in the index. The number of equities in the index is
fixed at 30. The start date for the NSE 30 Index is January
1, 2007; the base value is 1,000 points. The index is
rebalanced on a semi-annual basis, on the first business
day in January and July.
NSE 50
The NSE 50 Index tracks the top 50 companies in terms of
market capitalization and liquidity. It is a price index and is
weighted by adjusted market capitalization—the number of
a company’s listed shares, multiplied by the closing price
of that company, multiplied by a capping factor. Only fully
paid-up common shares are included in the index.
NSE Consumer Goods Index (formerly Food/
Beverage Index)
The NSE Consumer Goods Index is one-of-four indices
designed to provide a benchmark to capture the
performance of a specific sector. The number of stocks in
this index is fixed at 15. The start date for the Consumer
Index is July 1, 2008; the base value is 1,000 points. The
index is rebalanced on a semi-annual basis, on the first
business day in January and July.
NSE Banking Index
The NSE Banking Index is one-of-four indices designed
to provide a benchmark to capture the performance of a
specific sector. The number of stocks fixed at 10. The
start date for the Banking Index is July 1, 2008; the base
value is 1,000 points. The index is rebalanced on a semianunual basis, on the first business day in January and July.
NSE ASeM Index
The NSE ASeM Index tracks price movements of all
equities listed on the Alternative Securities Market. It is a
value-based index.
NSE Industrial Index
This index is designed to provide an investable benchmark
to capture the performance of the Industrial Sector. It
comprises the most capitalized and liquid companies in the
industrial sector and is based on the market capitalization
methodology.
NSE Oil & Gas Index
The NSE Oil & Gas Index is one-of-four indices designed
to provide a benchmark to capture the performance of a
specific sector. The number of stocks fixed at 7. The start
date for the Oil & Gas Index is July 1, 2008; the base value
is 1,000 points. The index is rebalanced on a semi-anunual
basis, on the first business day in January and July.
NSE Insurance Index
The NSE Insurance Index is one-of-four indices designed
to provide a benchmark to capture the performance of a
specific sector. The number of stocks fixed at 15. The
eligible equity universe is the top 15 most capitalized and
liquid companies in the Insurance sector. The start date for
the NSE Insurance Index is July 1, 2008; the base value is
1,000 points. The index is rebalanced on a semi-anunual
basis, on the first business day in January and July.
African Securities Exchanges Association
Section Eight : IPOs
2012
Company
None
Date of IPO
Value of IPO ($ million)
2013
Company
Date of IPO
Value of IPO ($ million)
None
Company
UBA PLC 2nd Tranche
16.39% FGN January 2022
Tower Funding Plc Tranche A
Tower Funding Plc Tranche B
Austin Laz and Co. Plc
Lafarge Cement Wapco Nigeria
Plc
Ekiti State Government Bond
Chellarams Plc
Benue State Government Bond
15.10% FGN April 2017
Fortis Microfinance Bank Plc
16.00% FGN JUN 2019
Date of issue
Face Value of Issue
($ million)
5-January-2012
25-January-2012
9-February-2012
9-February-2012
29-February-2012
5-March-2012
225.17
225.17
23.40
6.40
2.16
76.40
13-March-2012
20-March-2012
26-March-2012
25-April-2012
20-June-2012
27-June-2012
128.66
3.40
83.63
225.17
8.15
193.00
ASEA
Y E A R B O O K
207
African Securities Exchanges Association
Company
Date of issue
International Finance Corporation
(IFC) Bond
Osun State Government Bond
Osun State Government Bond
Gombe State Government
Lagos State Government Bond
Lagos State Government Bond
C & I Leasing Plc
Face Value of issue
($ million)
23-February-2012
75.10
28-May-2013
20-July-2012
3-August-2012
7-August-2012
4-September-2013
71.34
187.75
125.16
500.66
547.59
21-September-2012
5.88
Section Nine : 2012 Rankings of Top 5 Trading
Participants
Ranking
1
2
3
4
ASEA
Y E A R B O O K
5
208
Stockbrokerage
Units
Stanbic IBTC
Stockbrokers
Limited
Rencap Securities
(Nig) Limited
CSL Stockbrokers
Limited
FBN Securities
Limited
BGL Securities
Limited
Purchases
Sales
Total
$
$
N/A
N/A
2,486,195,131.06
N/A
N/A
2,123,414,213.94
N/A
N/A
877,062,124.80
N/A
N/A
507,503,627.62
N/A
N/A
477,108,328.66
$
African Securities Exchanges Association
UGANDA SECURITIES exchange
profile
Website
www.use.or.ug
Market Regulator
Capital Markets Authority (Uganda)
Address
4th Floor, Prism Building, Kampala Road,
P O Box 23552 Kampala UGANDA
Trading Session hours (local time)
10am - 12 noon
Time Zone
Greenwich Mean Time + 3 hours
Contact Person for ASEA
Innocent Dankaine / Jonathan Bushara
Telephone
+256 41 7705550
Fax
+256 41 4342841
E-mail
[email protected] / [email protected] /
[email protected]
Name of Local Currency
Uganda Shilling
Tax Rates (dividends, interest, capital gain)
Listing of Foreign Domiciled Companies
ASEA
N/A
Y E A R B O O K
Commodities Exchange
• Withholding tax on Dividends;
10% for resident investors
15% for non-resident investors
• Withholding tax on interest (general)
15% for both residents & non-residents
• Withholding tax on interest paid on
government securities
20% for both residents & non-residents
• No Capital gains taxes
Company must register in Uganda - Registrar
of Companies. If already listed, it must get a
letter of comfort from its listing authority. It
must also get a letter of comfort from its sector
regulator.
209
African Securities Exchanges Association
OVERVIEW
COUNTRY ANNUAL REVIEW - 2012
1.ECONOMIC & FINANCIAL DEVELOPMENTS
The Bank of Uganda (BoU) started the year to a slow ease to tighten monetary policy that
had been adopted for most of 2011.During the year, the BoU reduced the Central Bank Rate
(CBR) from 21 percent in March to 20 percent in June 2012 and eventually to 12 percent
in December 2012. This was motivated by the decline in inflation and the need to boost
economic activity.
The lowering of the CBR thus reflected efforts by the BoU to encourage commercial banks to
reduce their lending rates in order to increase the growth of their lending to the private sector
which has remained weak since September 2011 due to high lending rates. In response, the
commercial banks reduced their lending rates marginally from 27.6 percent in March to 27
percent in June and 23.2 percent in December 2012.
Inflation – Domestic and Global Developments
Inflationary pressures continued to ease throughout the year under review and eventually hit
the single digit mark at the end of the year. Headline inflation fell consistently from 21.2
percent in March 2012 to 18 percent in June and 5.5 percent in December 2012, while core
inflation also declined from 23.6 percent to 4.6 percent in the same period.
Food inflation continued the downward trend that began in March, and ended at 7.3 percent
in December reflecting improved supplies with the onset of the rainy season. The most
spectacular decline, however, was inflation in Electricity, Fuel and Utilities (EFU) in which the
rate fell by 8.3 percentage points to end at 12.9 percent in December 2012. This mainly
reflected a decline in oil prices that had risen early in the first quarter but have been steadily
falling since April to an 18-month low in June.
Foreign Exchange Rates – Shilling steady
ASEA
Y E A R B O O K
The shilling remained volatile against the US dollar to trade at UGX 2,484.36 in June 2012
from UGX 2,485.02 in March 2012. By December 2012, the shilling had settled at UGX
2,688.17. This marked a reversal in the trend as the shilling, on an average basis had steadily
appreciated since October 2011. This points to a recovery in capital inflows and a reduction
in demand for foreign exchange from the major sectors (energy and telecommunications) that
made it possible to meet the available supply.
210
African Securities Exchanges Association
Statistics
Section One : Economic Indicators
Main Economic Indicators
Indicators
2011
2012
2013
Population (million)
Real GDP (USD)
(millions) at market
exchange rates
Inflation rate (%)
Net Foreign Direct
Investment (USD)
(Millions)
Unemployment rate
(%) of total labour
force
Interest Rate (T-Bills)
34.50
34.51
34.76
18,280.00
16,810.00
17,325.00
18.80
14.00
6.30
648.00
796.00
823.00
N/A
N/A
N/A
22.34
9.71
9.364
2336
2661
2530
Exchange rate (local
currency versus US$)
Section Two : Trading Statistics
Trading equity Statistics
Indicators
Total Value traded $
Total volume traded
Total number of
transactions
Number of listed
companies
Number of traded
companies
Market
Capitalization
(billions) end of year
Market
Capitalization as %
of GDP
Turnover Velocity(%)
*
2011
17,459,293.07
168,299,763
4,748
2012
9,936,234.06
345,054,996
3,668
2013
96,887,799.40
2,353,987,917
5,205
14
15
16
7
8
12
4.12
5.88
8.26
22.54%
34.98%
47.68%
4,237,692.49
1,689,835.72
11,729,757.80
ASEA
Y E A R B O O K
* Turnover Velocity = (Monthly value traded of listed shares/month-end market cap) x 12
(annualized).
211
African Securities Exchanges Association
Investors Type
Foreigners vs. Local Investors
Type of Investors
Foreign Investors
Local Investors
Total %
% of the Total Value traded $
2012
N/A
N/A
N/A
2011
N/A
N/A
N/A
2013
N/A
N/A
N/A
Insitutions Vs. Individuals
Institutions
Individuals
Total %
N/A
N/A
N/A
N/A
N/A
N/A
N/A
N/A
N/A
Please note that due to Uganda’s open capital account poilicy, there is no real aggregate of
foreign vs. local tradng information.
Sectors Traded
Sectors traded on
the Stock Exchange
ASEA
Y E A R B O O K
MIMS Board
Banking
Commercial & Services
Finance & Investment
Insurance
Construction & Allied
Manufacturing & Allied
Information Technology
Energy
Tourism
Health
Mining & Minerals
Retail &wholesaling
Corporate Bonds
212
Number of Companies Included in each Sector
2011
2012
2013
5
3
1
2
1
2
0
0
0
0
0
0
5
5
3
1
2
1
2
0
1
0
0
0
0
5
5
3
1
2
1
2
0
1
0
0
0
1
5
African Securities Exchanges Association
5 Most Active Sectors
#
1
2
3
4
5
6
Sectors
Banking, Finance and Investment
Industrial, Manufacturing and Allied
Commercial and Services
Energy
Retail & Wholesaling
Telecommunications
Section Three: Bonds Statistics
Bonds Statistics
Bonds
Total Value traded $
Value traded on
governmental
bonds ($)
Value traded on
corporate bonds
2011
2012
2013
N/A
N/A
N/A
N/A
N/A
200,740,000
Section Four : Trading System
Trading System
Is this system locally developed or bought?
If bought, who is the Vendor?
Year of implementing the system:
N/A
N/A
N/A
Section Five : Clearing and Settlement
Where do Clearing & Settlement take
place?
The Stock Exchange Yes
Separate Company
If Separate Company please mention its
name
Is this system locally developed
or bought?
If bought, who is the Vendor?
Year of implementing the system:
Clearing and Settlement is conducted in:
N/A
No
Yes
Millennium IT
2010
T+5
ASEA
Y E A R B O O K
T+ 2
T+ 3
Others
213
African Securities Exchanges Association
Section Six : Products traded on the Stock
Exchange
Types of markets in the Stock Exchange
Equity Market
Cash Market
Derivative Market
Bond Market
Yes
Yes
No
Yes
Products
Product (Stocks,Bonds, Funds,ETF's,
Derivatives ..etc)
Stocks
Bonds
ETF
Derivatives
Description of the Product
Common Shares
Government and Corporate Bonds
Section Seven : Trading Mechanism
Margin Trading
Intraday Trading
Online Trading
No
No
No
Section Seven : Indices
Indices
Index Name
USE ALL Share Index (ALSI)
ASEA
Y E A R B O O K
USE Local Company Index (LCI)
214
USE ALSI
USE LCI
Index Type (Price Index, Sector Index,..etc)
The ALSI calculated using the base-weighted
aggregate methodology also known as the
market value weighted methodology, and
encompasses all equities listed on the Uganda
Securities Exchange
The LCI calculated using market value weighted
methodology, and encompasses only local
equities listed on the Uganda Securities Exchange
Closing 2012
1,203.79
Closing 2013
1,522.46
% Change
26.5%
193.49
265.11
3702%
African Securities Exchanges Association
Section Eight : IPOs
2011
Company
None
Date of IPO
Value of IPO ($)
2012
Company
Date of IPO
UMEME Limited
Value of IPO ($)
30-Nov-12
167,860,372.56
2013
Company
Date of IPO
Value of IPO ($)
None
2011
Company
Date of Issue
Government of Uganda Treasury
Bond-2 years
Government of Uganda Treasury
Bond-3 years
Government of Uganda Treasury
Bond-5 years
Government of Uganda Treasury
Bond-10 years
Face Value of Issue ($)
124,143,835.62
415,239,726.03
177,654,109.59
66,352,739.73
Total
783,390,411
2012
Company
Face Value of Issue ($)
338,218,714.77
400,225,479.14
20,668,921.46
236,753,100.34
114,618,564.45
1,110,484,780
ASEA
Y E A R B O O K
Government of Uganda Treasury
Bond-2 years
Government of Uganda Treasury
Bond-3 years
Government of Uganda Treasury
Bond-4 years
Government of Uganda Treasury
Bond-5 years
Government of Uganda Treasury
Bond-10 years
Total
Date of Issue
215
African Securities Exchanges Association
Company
Date of Issue
Government of Uganda Treasury
Bond-2 years
Government of Uganda Treasury
Bond-3 years
Government of Uganda Treasury
Bond-4 years
Government of Uganda Treasury
Bond-5 years
Government of Uganda Treasury
Bond-10 years
Government of Uganda Treasury
Bond-15 years
Total
Face Value of Issue ($ million)
256,916,996.05
454,545,454.55
21,739,130.43
390,830,514.84
167,984,189.72
31,620,553.36
1,323,636,839
Section Nine : 2013 Rankings of Top 5 Trading
Participants
turnover 2013
ASEA
Y E A R B O O K
Ranking
Equities
1
2
3
4
5
Bonds
1
216
Stockbrokerage Units
African Alliance Uganda
SBG Securities
Dyer & Blair
Crane Financial Services
Crested Stocks & Securities
African Alliance Uganda
Purchases
$
Sales
$
Total
$
83,402,557
80,456,107
11,087,774
8,721,998
8,578,913
African Securities Exchanges Association
ZIMBABWE stock exchange
profile
Website
Market Regulator
Address
www.zimbabwe-stock-exchange.com
Securities and Exchange Commission of
Zimbabwe (SECZ)
4th Floor, 101 Building, Corner Third Street/
Kwame Nkrumah Avenue, HARARE
Trading Session hours (local time)
1000 hrs-1130 hrs
Time Zone
Greenwich Mean Time + 2 hours
Contact Person for ASEA
Martin Matanda
Telephone
+263 4 701096/7, 252779-80
Fax
+263 4 762348
E-mail
[email protected]
Name of Local Currency
United States Dollar
Dividend withholding taxes 10% (domestic
investors) 10% (foreign investors); Withholding
Tax Rates (dividends, interest, capital gains)
tax on interest income 15%; Capital gains
taxes 1% on the sale side
Listing of Foreign Domiciled Companies
Available
Commodities Exchange
Not available
ASEA
Y E A R B O O K
217
African Securities Exchanges Association
ZIMBABWE STOCK EXCHANGE
EXCHANGE BACKGROUND
Brief History
The first stock exchange in Zimbabwe opened its doors shortly after the arrival of the Pioneer
Column in Bulawayo 1896. It was however only operative for about 6 years. Other stock
exchanges were established in Gwelo (Gweru) and Umtali (Mutare).The latter, also founded in
1896, thrived on the success of local mining, but with the realization that deposits in the area
were not extensive, activity declined and it closed in 1924.
After World War II a new exchange was founded in Bulawayo and dealing started in 1946.
A second floor was opened in Salisbury (Harare) in December 1951 and trading between the
two centres was by telephone. They continued operating until it was decided that legislation
should be enacted to govern the rights and obligations of, both members of the Exchange and
the general investing public.
The Zimbabwe Stock Exchange Act reached the statute book in January 1974. The members
of the Exchange continued to trade as before, but it become necessary for legal reasons to
bring into being a new Exchange coincidental with the passing of the legislation. The present
Exchange therefore dates back from the passing of the Act. In 2004, The Securities and
Exchange Act was promulgated to repeal the ZSE Act and became operational in September
2008.
Zimbabwe has a fully developed Capital market with an active and equally developed
institutional base. As a result of a long tradition of investing on the Market, an entire industry
has been created. Zimbabwe has a pension fund industry, insurance industry, and local asset
management industry supported by a number of registered stockbroking firms.
Change in Functional Currency in 2009
In November 2008, the Zimbabwe Stock Exchange temporarily stopped trading following intervention by The Reserve Bank of Zimbabwe and reopened on 19 February 2009. The Zimbabwe economy dollarized in 2009 and the Zimbabwe Stock Exchange similarly adopted the
US dollar as its primary trading currency. Indices were rebased to 100 for both the Industrial
and Mining indices.
Transaction costs on the ZSE
ASEA
Y E A R B O O K
Transaction costs for trading on the ZSE are determined from time to time by the Ministry of
Finance. The fees are structured as follows:
218
Brokers Commission
Securities Commission Levy
ZSE Levy
VAT
Capital Gains Withholding Tax
Stamp Duty
Investor Protection Levy
Basic charge
Buying
1.00%
0.18%
0.10%
0.15%
0.25%
0.05%
$2
Selling
1.00%
0.18%
0.10%
0.15%
1.00%
0.05%
$2
African Securities Exchanges Association
LATEST ACHIEVEMENTS
Proposed SME Bourse for the ZSE
The ZSE aims to establish a regulated platform on which SMEs can be listed. In 2013, a Working
Party comprising the Ministries of Small to Medium Enterprises and Co-operatives; Ministry
of Finance and Economic Development; stockbrokers; corporate financiers; an accounting
firm; the Zimbabwe National Chamber of Commerce and ZSE was put together. The Working
Party also formed an informal consultative group including all stakeholders, for the purpose
of engagement over the course of the project. Another key deliverable in the year was the
project’s blueprint.
A successful first SME Workshop was held in the year, resulting in the first draft of the Rules for
the board. The processes involved in finalising the Rules will include ZSE Board’s approval with
the Securities and Exchange Commission of Zimbabwe (SECZ) giving the final approval. SECZ
has thus been kept apprised of the project through various interactions.
The ZSE started working more closely with Corporate Financiers and Advisors in its Market
Development, and also held discussions with The World Bank and the African Development
Bank on the project. A group of potential issuers was identified and has been engaged. Work
on the project will also involve looking for a new class of underwriters who will act as market
makers. Additionally, an active process is underway to get a suitable name for the bourse.
Central Securities Depository (CSD)
Chengetedzai Depository Company (CDC) was mandated by SECZ to set up the CSD. CDC is
a company independent from the ZSE which however is a shareholder in the company. CDC
acquired the DepoX System from CMA of Sweden in January 2013 and has been working to
operationalize the depository. It is expected that the CSD will go live in 2014.
Automated Trading System
On 1 August 2013 the ZSE contracted a Consultant (Central Depository and Settlement
Company of Mauritius) to lead the automation project. A representative of CDSM, Manoven
Sadayen, visited the ZSE in September 2013 as progress on the project started gathering
momentum. Among activities lined up during his visit were consultations with key ZSE
stakeholders including members and other key market players. A stakeholders’ meeting was
held on the 20th of September 2013, in which Mr Sadayen introduced the project.
Following the request for an expression of Interest in September 2013, eleven vendors
responded. Only four however submitted full responses to the request for Proposals on the
supply and installation of an ATS.
ASEA
Y E A R B O O K
The initial valuation of all bids submitted narrowed down the competing vendors to a short list
of two – CIS/ CMA Small systems and InfoTech Middle East. During the last week of November
the shortlisted two vendors were given the opportunity to give oral presentations and demos to
support their bids. The CSI /CMA Small Systems consortium was however unable to participate
in the demo exercises due to other circumstances beyond their control. Additional due diligence
measures were taken during the month of December and as a result of the report outcome
of these efforts the Board of the Zimbabwe Stock Exchange approved the engagement of
InfoTech Middle East FZ-LLC.
219
African Securities Exchanges Association
Following the conclusion of successful contract negotiations on 19 March 2014 with InfoTech
Middle East, the final live date has been targeted for the third quarter of 2014.
Revision of Listings Rules
A proposal for input on the current Listings Rules, which were last reviewed in February 2002,
was sent by the ZSE in June 2013 to a targeted group of stakeholders. The comments received
thereon, were considered in the preparation of the First Draft of the revised Listings Rules.
The First Draft was issued to all stakeholders for consideration in March 2014. The project is
expected to be completed during the course of 2014.
Awareness Initiatives
In December 2013, the ZSE introduced its monthly e-newsletter, ATS Watch. The main
objectives of the newsletter include the following.
• Keeping ZSE stakeholders informed on the Auto-mated Trading System (‘ATS’) and other
projects’ progress;
• giving an insight into issues surrounding automated trading;
• preparing stakeholders for a fundamental change in the market mechanism; and
• promoting dialogue be-tween the ZSE and its key stakeholders.
ZSE Data Portal
ASEA
Y E A R B O O K
In March 2013, the ZSE launched an improved website as part of an effort to address the
information gap regarding our market. By using comprehensive data on our listed companies,
world-class functionality, social media and continuously engaging our investment communities
individually online, we hope to go a long way in providing information about investing on the
ZSE. Visit the ZSE on www.zimbabwe-stock-exchange.com
220
African Securities Exchanges Association
FUTURE OUTLOOK
Automation
The ZSE expects to have an automated trading system in place this year. The experiences
of markets that have automated before us show that automation makes the market more
attractive, and therefore volumes will grow. We trust that ZSE will be no different and that the
modernisation effort will result in more business for our Members. If this is achieved we expect
jobs in the industry to be preserved and the revenue collected by our industry for the state
should also improve.
Improving Corporate Governance
• New listing requirements
As we prepare to adopt the new listing rules, due this year, we anticipate that the wider investment
options and the greater transparency they foster will significantly deepen Zimbabwe’s Capital
markets.
• Human Capital and talent management
This will facilitate the separation of the regulatory function from normal commercial operations.
Automation will entail strengthening of the ICT function to meet the new challenges.
• Improving Quality of Earnings
Our objective is to broaden our product offering to include bonds, EFTs and other types of
tradable instruments.
Retention of Listed Companies
Our drive is to retain quality listed companies through
• Improved communication with company ceos and executives based on one-on-one
meetings at their premises,
• Company tours to enhance our understanding of stakeholder operations and unique
circumstance, and
• Attending all agms as observers
Participation in regional initiatives with other exchanges
As ZSE we have taken it upon ourselves to align our strategic plan to CoSSE and ASEA’s
Strategic Plans and in this way achieve goal congruence.
Investor awareness initiatives
ASEA
Y E A R B O O K
Developing the domestic investor base is of strategic importance. To achieve this goal it
naturally entails investing in investor education. However, we believe we can leverage on the
impressive literacy level of the Zimbabwean populace (Zimbabwe has had the highest literacy
level in Africa for the past two years), to increase financial literacy and hopefully capital markets
knowledge.
221
African Securities Exchanges Association
Statistics
Section One : Economic Indicators
Main Economic Indicators
Indicators
2010
2011
2012
2013 Estimates
Population (million)
Real GDP (USD)
(millions) at market
exchange rates
Inflation rate (%)
Net Foreign Direct
Investment (USD)
(Millions)*
Unemployment rate
(%)
Interest Rate (T-Bills)
12.78
12.92
13.06
13.20
9,085
10,167
11,241
11,626
3.0
3.5
3.8
1.7
123
373
354
NA
N/A
N/A
N/A
NA
N/A
N/A
N/A
N/A
N/A
N/A
N/A
N/A
Exchange rate (local
currency versus US$)
ASEA
Y E A R B O O K
* Data from UNCTAD World Investment Report 2013
222
African Securities Exchanges Association
Section Two : Trading Statistics
Trading equity Statistics
Indicators
Total Value
traded $
Total volume
traded
Total number of
transactions
Number of listed
companies
Number
of traded
companies
Market
Capitalization
(billions) end of
year
Market
Capitalization as
% of GDP**
Turnover
Velocity(%) *
2010
391,572,192.31
2011
477,523,919.44
2012
448,179,265.90
2013
485,719,802.03
6,800,155,462
4,610,008,413
3,513,176,891
2,996,886,088
39,655
30,983
21,426
19,000
79
78
79
67
76
74
70
63
3.88
3.69
3.964
5.203
42.75
36.29
35.26
44.75
10.08
12.94
11.31
9.34
*Turnover Velocity = (Monthly value traded of listed shares/month-end market cap) x 12
(annualized).
Investors Type
Foreigners vs. Local Investors
Type of Investors
Foreign Investors
Local Investors
Total %
2010
23%
77%
100%
% of the Total Value traded $
2011
2012
36%
41%
64%
59%
100%
100%
2013
50%
50%
100%
Insitutions Vs. Individuals
Institutions
Individuals
Total %
N/A
N/A
N/A
N/A
N/A
N/A
N/A
N/A
N/A
N/A
N/A
N/A
ASEA
Y E A R B O O K
223
African Securities Exchanges Association
Sectors Traded
Sectors traded on
the Stock Exchange
Number of Companies Included in each Sector
TOTAL
Agri-Industrial
Banking And Financial
Beverages
Conglomerate
Construction And
Materials
Food Processing
Industrial And
Industrial Engineering
Insurance
Media
Mining
Paper, Packaging And
Printing
Pharmaceutical
Property
Retail
Telecommunication
Tourism
Transport
2010
79
8
9
2
5
7
2011
78
8
9
2
5
7
2012
79
8
10
2
5
7
2013
67
7
7
2
5
7
6
12
6
12
6
12
4
8
5
1
4
1
5
1
4
1
5
1
4
1
5
1
4
1
1
4
9
1
3
1
0
4
9
1
3
1
0
4
9
1
3
1
0
4
8
1
2
1
5 Most Active Sectors
ASEA
Y E A R B O O K
#
1
2
3
4
5
224
Sectors
Beverages
Telecommunication
Conglomerate
Banking and Financial
Agri-industrial
African Securities Exchanges Association
Section Three: Bonds Statistics
Bonds Statistics
Bonds
Total Value traded $
Value traded on
governmental
bonds ($)
Value traded on
corporate bonds
2010
N/A
N/A
2011
N/A
N/A
2012
N/A
N/A
2013
N/A
N/A
N/A
N/A
N/A
N/A
Section Four : Trading System
Trading System ( MANUAL )
Is this system locally developed or bought?
If bought, who is the Vendor?
Year of implementing the system:
Section Five : Clearing and Settlement
Where do Clearing & Settlement take
place?
The Stock Exchange
Separate Company
MANUAL
If Separate Company please mention its
name
Is this system locally developed
or bought?
If bought, who is the Vendor?
Year of implementing the system:
Clearing and Settlement is conducted in:
T+ 2
T+ 3
Others
T+7
ASEA
Y E A R B O O K
225
African Securities Exchanges Association
Section Six : Products traded on the Stock
Exchange
Types of markets in the Stock Exchange
Equity Market
Cash Market
Derivative Market
Bond Market
Yes
Products
Product (Stocks,Bonds, Funds, ETF's,
Derivatives, etc.)
Stocks
Debt Instruments
Description of the Product
Ordnary Shares and Preference Shares
Corporate Debt Instruments
Section Seven : Trading Mechanism
Margin Trading
Intraday Trading
Online Trading
Yes
Section Seven : Indices
Indices
Index Name
ZSE Industrial Index
Index Type (Price Index, Sector Index,..etc)
The ZSE Industrial index is a value-weighted index
for stocks in all sectors excluiding the mining
sector. The start date is 19 February 2009; the
base value is 100 points.
The ZSE Mining index is a value-weighted index
for stocks in the mining sector. The start date is
19 February 2009; the base value is 100 points.
ZSE Mining Index
ZSE Industrial Index
ASEA
Y E A R B O O K
ZSE Mining Index
226
Closing 2012
152.40
Closing 2013
202.12
% Change
32.62
65.12
45.79
-29.68
African Securities Exchanges Association
Section Eight : IPOs
Please fill in the following table with the IPOs if you had any in your market in 2012-2013
2012
Company
None
Date of IPO
Value of IPO ($ million)
2013
Company
Date of IPO
Value of IPO ($ million)
None
2012
Company
Date of Issue
Face Value of Issue ($ million)
None
2013
Company
Date of Issue
Face Value of Issue ($ million)
None
Section Nine : 2013 Rankings of Top 5 Trading
Participants
Ranking
1
Stockbrokerage
Units
N/A
Purchases
$
Sales
$
Total
$
ASEA
Y E A R B O O K
227
African Securities Exchanges Association
KHARTOUM stock exchange
profile
Website
www.kse.com.sd
Market Regulator
None
Al baraka Tower, El Qasr Ave. P.O. Box 10835,
Khartoum
ASEA
Y E A R B O O K
Address
228
Trading Session hours (local time)
1000-1100 hrs
Time Zone
GMT +3:00
Contact Person for ASEA
Dr. Issam Elzein Elmahi
Telephone
(+249) 782152,(+ 249) 782250
Fax
(+249) 782225
E-mail
[email protected]
Name of Local Currency
Sudanese Pounds
Listing of Foreign Domiciled Companies
Allowed
African Securities Exchanges Association
Exchange background &
2013 market review
About the KSE
In the year 2013 most of trading indicator
was rose from the previous year, where the
Khartoum index raised from 2748.26 in the
year 2012 to 3178.07 in 2013 this represent an
increase of 15.6%. The market capitalization
also increased from 9,634,988,645 in the
year2012 to 11,154,927,797 in the year 2013
and this represent an increase of 22%. There
were also increase in both the number of
transactions, certificates traded and the total
volume, while there were decrease in both
the number of shares traded and the number
of instruments traded.
2013 highlights
In 2013, the KSE developed several strategies to provide an environment capable of
attracting investment capital – (1) Providing
investment environment capable of attracting capital, (2) Regulation and development
of the capital market to ensure fairness, efficiency and transparency, (3) 21st century
technology strategies, (4) enhanced market
structure, and (5) investor protection initiatives. The Exchange continued its capital
market development efforts to create a modern establishment that competes effectively
with other exchanges, globally.
Executive management
The new organization structure of KSE
consists of:
• The general manager
• Legal Advisor
• Head of Markets
• Head of Marketing and Research &
Development
• Head of the Administrative and Finance
ASEA
Y E A R B O O K
the idea of establishing a stock exchange
in Sudan started in 1962 whereby many
formalities such as studies and communication
had been started by ministry of finance and
bank of Sudan jointly with IFC one of the arms
of the world bank. In 1992 a serious step was
taken to establish a stock exchange in Sudan
in line with economic liberalization policy
called the three years salvation program.
The Khartoum stock exchange (KSE) was
officially started operating in 1994, with the
objective of regulating and controlling the
issuance of securities, and mobilizing private
savings for investment in securities. The
traditional national assembly passed the
KSE act, through which KSE acquired its
independent legal status.
In 2007 Khartoum stock exchanges joint the
African markets union which is going to open
new horizons of co- operation with regional
stock markets. In the year 2010 was the
adoption of market as observer in the union of
Arab stock exchange to enjoy full membership
but in 2011 Khartoum stock exchange was
accepted as permanent member of the union
of Arab stock exchange.
Since the changes in technology and the
economy moving in successive steps, It
was necessary for the market to update
regulations on an ongoing basis to allow him
to work under the competition act in regional
and global markets witnessed sharp, so in
the beginning of the year 2012 was opened
by the Minister of Finance and National
Economy of the electronic trading system
under the auspices of the President of the
Republic. KSE was signed a memorandum
of understanding with the national council for
press and publication in the year 2013.
KSE works in accordance with the principles
of Islamic laws where there is a legitimate
oversight body in KSE which oversees the
legitimacy of the deals; and therefore the
securities or financial instruments by a dealer.
2013 market review
229
African Securities Exchanges Association
KSE Departments
•
•
•
•
•
•
•
•
•
Brokers & Trading Floor Affairs department
Companies & Issues department
Studies & Information department
Central Depositary & saving department
Financial department
Administrative department
Internal Auditing department
Inspection & Audit department
I T Department
Targeted business
development
During the year 2013 Khartoum stock
exchange continued its effort in the process
of transforming sports club to public joint
stock companies.
Also in the same year Draft was prepared
for the law of the market and because the
current law has not seen any adjustments to
keep pace with developments in the financial
markets.
Enhanced Regulatory
Programs
In 1994 the transitional national assembly
passed the Khartoum stock exchange and
since that date has not seen any adjustments
so it was necessary to reconsider this law, so
the market prepared a new one the capital
market side and anther one for regulating
the capital markets, which will take over the
process of supervision and control and the
development of the market.
ASEA
Y E A R B O O K
21st Century Technology
Strategies
230
Work began on the new website of Khartoum
stock exchange to keep pace with the
electronic development that occurs in the
regional and international markets. The
market also began the second phase of
electronic trading, which includes linking the
market with brokerage firms (FIX ENGINE &
FIX INTERFACE). Also the market will launch
information dissemination system which is
going to provide a marketing information
services through what is known as investor
gallery.
Enhanced market
structure (NA)
Investor Protection
Initiatives
KSE’s management aims to protect investors
in securities and to develop legislations
relevant to the capital market to enhance
transparency and implement the instructions
of disclosure. Moreover, KSE’s management
aims to disseminate awareness in the
investment culture and follow up that parties
subject to its supervision will adhere to the
law and regulations and enhance the rule of
law.
KSE’s management also aims to:
1. Issue legislations that regulate and
develop the capital market and assist
in providing a proper environment for
investing in securities.
2. Provide the investor with all necessary
information needed to support
his investment decision, including
transparency and disclosure whether for
issuing companies performance or for
the trading process.
3. Develop the necessary financial services
of the capital market.
4. Promote the establishment of mutual
funds and regulate these funds to
provide investment opportunities for
small investors and efficient investment
management.
5. Implement up to date international
standards in the capital market and
related entities for disclosure, electronic
trading, electronic keeping and price
settlement of securities, as well as upto-date International Accounting and
Auditing Standards on parties subject to
the KSE monitoring and supervision.
African Securities Exchanges Association
6. Accredit the Standards of Professional Conduct for people working at the KSE, and their
members.
7. Improve penalties on violators of the Law and those who commit prohibited acts.
8. Disseminate awareness among investors and the public in general in issues relevant to
the national capital market and its entities, as well as other issues related to investing in
securities.
9. Receive and investigate complaints from the public and investors, to undertake proper
procedures by imposing penalties on violators of the provisions of Law, instructions, and
regulations issued pursuant to it.
10.Enhance monitoring software on parties subject to the KSE surveillance and enhance daily
supervision on trading at KSE.
11.Provide continuous training for KSE staff to enhance their academic and professional
levels, in addition to people working in licensed financial services companies and registered
persons.
2014 OUTLOOK
Economy is affected by the Sudanese secession of the South and exit of oil revenues from the
state budget, which led to a decrease in public revenues of the state and returns to export and
foreign investment flows and the subsequent decreases in foreign reserves and the consequent
pressure on foreign exchange as well as the high rate of inflation.
Central Bank of Sudan is trying to maintain the stability of exchange rates and the development
of monetary policies help to achieve the national goals of the national economy, this leads to a
reduction in the poverty rate in the near term and long term and raise growth rate and attract
foreign investment.
Khartoum stock exchange seeks to promote a culture of investment in the securities and
dissemination of knowledge among the public to attract the largest number of investors.
The KSE is seek to Expand investment opportunities and work on removing constraints and
Conversion of private companies to public joint stock companies and inclusion it in the market.
other contribution factors to optimism about the KSE is find a permanent location for KSE,
open new commodity exchange and Transform sports clubs to public joint stock companies.
ASEA
Y E A R B O O K
231
African Securities Exchanges Association
Statistics
Section One : Economic Indicators
Main Economic Indicators
Indicators
2009
2010
2011
2012
2013
Population (million)
Real GDP (USD)
(millions) at market
exchange rates
Inflation rate (%)
Net Foreign Direct
Investment (USD)
(Millions) (UNCTAD)
Unemployment rate
(%)*
Interest Rate (T-Bills)
31.9
32.9
34.0
30.00
31.50
60,421
64,881
69,610
55,192
53,850
11.20
15.4
18.91
30.25
40.3
N/A
N/A
N/A
N/A
N/A
50
55
60
60
58
N/A
N/A
N/A
N/A
N/A
2.24
2.5
2.68
4.41
5.7
Exchange rate (local
currency versus US$)
ASEA
Y E A R B O O K
* Source Khartoum Stock Exchange
Annual Reports
Source: Central Bank of Sudan
232
ASEA
Y E A R B O O K
9.45
3.95%
2.56
50
55
8,266
968,926,001
903,848,881
2010
2011
8.87
4.74%
3.3
54
56
8,069
956,204,095
956,204,095
9.50
4.00%
2.2
54
59
12,689
172,581,304
698,529,550
2012
* Turnover Velocity = (Monthly value traded of listed shares/month-end market cap) x 12 (annualized).
4.59
2.6
Market Capitalization
(billions) end of year
Turnover Velocity(%) *
50
Number of traded
companies
4.01%
53
Number of listed
companies
Market Capitalization as
% of GDP
7,870
100,292,423
Total volume traded
Total number of
transactions
1,002,925,012.00
2009
Total Value traded $
Indicators
Trading equity Statistics
Section Two : Trading Statistics
9.60
4.16%
2.1
31
60
16,435
15,676,127
682,152,754
2013
African Securities Exchanges Association
233
African Securities Exchanges Association
Investors Type
Foreigners vs. Local Investors
Type of Investors
Foreign Investors
Local Investors
Total %
2009
29.9
70.1
100%
% of the Total Value traded $
2010
2011
2012
35.8
40.1
42.8
64.2
59.9
57.2
100%
100%
100%
2013
33.2
66.8
100%
Insitutions Vs. Individuals
Institutions
Individuals
Total %
70.3
29.7
100%
77.5
22.5
100%
79.9
20.1
100%
80
20
100%
66.4
33.6
100%
Sectors Traded
Sectors traded on
the Stock Exchange
Banking
Insurance
Commercial
Industrial
Agricultural
Communication
Services
Other
Investment funds
Certificates
Number of Companies Included in each Sector
2009
20
8
7
2
3
5
5
4
34
34
ASEA
Y E A R B O O K
Fixed Income Market Segment
Preference shares
N/A
Government of sudan
N/A
Treasury Bonds
Corporate Bonds
N/A
234
2010
20
8
7
2
3
5
5
5
34
45
2011
21
8
7
2
3
5
5
5
25
40
2012
23
8
7
2
3
5
5
6
25
40
2013
23
8
7
2
3
5
6
6
25
40
N/A
N/A
N/A
N/A
N/A
N/A
N/A
N/A
N/A
N/A
N/A
N/A
African Securities Exchanges Association
5 Most Active Sectors
#
1
2
3
4
5
Sectors
Government Musharaka Certificates
Investment Funds
Banking
Insurance
Telecommunication and Media
Section Three: Bonds Statistics
Bonds Statistics
Bonds
Total Value traded $
Value traded on
governmental
bonds ($)
Value traded on
corporate bonds
2009
N/A
N/A
2010
N/A
N/A
2011
N/A
N/A
2012
N/A
N/A
2013
N/A
N/A
N/A
N/A
N/A
N/A
N/A
Section Four : Trading System
Trading System ( Electronic trading system )
Is this system locally developed or bought?
If bought, who is the Vendor?
Year of implementing the system:
Bought
First Information Technology (FIT)
2012
Section Five : Clearing and Settlement
Where do Clearing & Settlement take
place?
If Separate Company please mention its
name
Is this system locally developed
or bought?
If bought, who is the Vendor?
Year of implementing the system:
Clearing and Settlement is conducted in:
The Stock Exchange
Separate Company
Yes
First Information Technology(Fit)
2012
Yes
ASEA
Y E A R B O O K
T+ 2
T+ 3
Others
Yes
235
African Securities Exchanges Association
Section Six : Products traded on the Stock
Exchange
Types of markets in the Stock Exchange
Equity Market
Cash Market
Derivative Market
Bond Market
Yes
Products
Product (Stocks,Bonds,
Funds,ETF's,Derivatives ..etc)
Shares
Sukkuk
Description of the Product
Common Shares
Government investment sukkuk &
Government Musharka Certificates
Section Seven : Trading Mechanism
Margin Trading
Intraday Trading
Online Trading
Yes
Section Seven : Indices
Indices
ASEA
Y E A R B O O K
Index Name
Khartoum Index
236
Index Type (Price Index, Sector Index,..etc)
Price index. The index returns are based on capital
gains / losses of the largest 20 securities listed on
the KSE, valued by full market capitalisation.
Khartoum Index
Closing 2010
2,267.92
Closing 2011
2,286.46
% Change
0.82
Khartoum Index
Closing 2011
2,286.46
Closing 2012
2,748.26
% Change
20.20
African Securities Exchanges Association
Khartoum Index
Closing 2012
2748.26
Closing 2013
3178.07
% Change
15.64
Note: Khartoum Index series were launched on October 2003
Section Eight : IPOs
2009
Company
None
Date of Issue
None
Value of Issue ( $ million )
None
There was no IPOs/Rights Issues in 2009.
2010
Company
N/A
Date of Issue
Value of Issue ( $ million )
2011
Company
N/A
Date of Issue
Value of Issue ( $ million )
2009
Company
None
Date of Issue
None
Value of IPO ($ million)
None
There was no IPOs/Rights Issues in 2009.
2010
Company
N/A
Date of Issue
Value of IPO ($ million)
2011
Company
N/A
Date of Issue
Value of IPO ($ million)
2012
Company
N/A
Date of Issue
Value of IPO ($ million)
2013
Value of IPO ($ million)
ASEA
Date of Issue
Y E A R B O O K
Company
N/A
237
African Securities Exchanges Association
Section Nine : 2011 Rankings of Top 5 Trading
Participants
Ranking
1
Ranking
1
Equity Transactions
Section Nine :
2011 Rankings
of Top 5 Trading
Participants
$
Sales
Purchases
$
Sales
$
$
ASEA
Y E A R B O O K
$
N/A
Bond Transactions
N/A
Members’ Contacts are available on the KSE website www.kse.com.sd
238
Total
Total
$
African Securities Exchanges Association
Cape Verde Stock Exchange
profile
Website
Market Regulator
Address
www.bvc.cv
General Auditor of Securities Market - AGMVM
(Cape Verde)
16st Floor, Lg Europe, Achada Santo António,
P O Box 115/A Praia CAPE VERDE
Trading Session hours (local time)
8:30 am - 3:00 pm
Time Zone
Greenwich Mean Time - 1 hours
Contact Person for ASEA
Manuel Lima / Radhia Leal
Telephone
+238 2603030 / 2603031
Fax
+238 2603038
E-mail
[email protected] / [email protected]
Name of Local Currency
ECV - Capeverdian Escudos
Tax Rates (dividends, interest, capital gain)
dividends 0% (domestic investors and foreign
investors); interest-Corporate Bonds 5%;
interest-Treasury Bonds 0% capital gains 15%
Listing of Foreign Domiciled Companies
N/A
Commodities Exchange
N/A
ASEA
Y E A R B O O K
239
African Securities Exchanges Association
Cape Verde Stock Exchange Background
Introduction
The Cape Verde Stock Exchange (BVC) Exchange is a Limited Liability Corporation of public
capital endowed with financial autonomy as well as administrative, established under Law nº
51/V/98 of 1998. It became fully functional in 2005, after changes to its systems.
The BVC underwent a deep financial reform, which now, renders it more modern and effective
and, is structured in accordance with international standards with the goal to transform Cape
Verde into an attractive and competitive financial platform.
The Market is regulated by the Bank of Cape Verde (BCV) through General Auditing of the
Securities Market (AGMVM) and as member of ANNA - Association of National Numbering
Agencies acts as the Cape Verde National Agency of Codification.
BVC’s mission is to promote a dynamic, sustainable and credible capital market, attractive
and alternative for the creation of an efficient market, modern and at par with the international
standards.
2013 Market Review
Overall, actions that focus on developing the market and, simultaneously, increase its quality,
stability, sustainability, strengthening the corporate brand and its structure, internal functioning,
boost the Public Debt Market, promoting financial literacy, were carried out throughout 2013.
The year was marked by the effectiveness of some important projects and activities such as:
• Launch of the new corporate website,
• Two Public Offerings (Inpharma S.A. and IFH S.A.);
• Official launch of the Platform Auction
• First Strategic and Business Roundtable,
• Automation (real Time) for settlement of transactions with the Bank of Cape Verde (BCV),
among others.
Financial Benefits
Given the strategic importance of the capital market to the Cape Verdean economy, a seductive
financial sector was created for companies and investors interested in investing in the Stock
Exchange.
Bonds yield or products of a similar nature, that are not Treasury Securities, listed on the Cape
Verde Stock Exchange are taxed at a rate of 5% (five percent) until December 31st of 2017, the
incomes earned from that date are applied the normal rate applicable to income of type. (Under
Article 23 of Law no. 26 /VIII/2013, 21.
ASEA
Y E A R B O O K
As for Treasury Securities, the incomes / interests are exempt from income tax and stamp duty.
Capital gains resulting from purchase/sale are taxed 15% of the income tax.
The BVC has been a valuable and necessary partner to the growth of the Cape Verdean
economy as well as the country´s overall development.
240
Treasury Securities Reform and Admission to Market on Stock Exchange
Treasury securities reform was carried out with the objective to guarantee adequate Government
financing over the long run, increasing the number of participants in the primary market as
well as increasing the potential of saving mechanisms, including: respective settlement in the
African Securities Exchanges Association
secondary market, improving management emissions and creating mechanisms that would
permit the control and effective follow-up of the treasury securities before and after emission.
This reform permits all investor direct access to the primary Treasury bond market, having
positive implications on Market Capitalization and on the financial cost to the State.
In 2013, Treasury Bills and Treasury Bonds increased from 46 to 221 Titles due to the transfer
of custody from Bank of Cape Verde (BCV) to BVC, as well as the admission to the market on
the Stock Exchange of all existing Treasury Securities on May 2013.
Quoted Companies and Market Capitalization
Currently, market capitalization is about 55.196.494.698, 00 CVE divided amongst listed
Securities in the Equity, Corporate Bonds and the Treasury Bond segments.
In 2013, the Volume of Emission in the Primary Market decreased slightly, closing at
9,603,930,051 CVE and the Secondary Market continued the downward trend as the volume
of transactions decreased to the lowest record of 105.929.839 CVE.
There was an increase of 6, 97% in the number of Corporate Bond Listed, registering no
change to the number of Listed Companies - Equity (4) and to the number of Listed Municipal
Bond (2).
The Treasury Securities admission to the market, have spurred an increase of 95.65% of the
global market capitalization over 2012, making the global market capitalization weight in GDP
increase to 31%.
As for the listed companies in the Equity market segmentation, BVC faced the devaluation
of Sociedade Caboverdiana de Tabacos equity, which, from December 2012 to December
2013, decreased around 38%. On the other hand, there was a slight increase in the remaining
quotations, being Enacol with 19%, Caixa Económica de Cabo Verde with 11% and BCA with
0.33%.
Negotiation and Settlement System
In the context of the development of the new Auctions platform, in 2013 was developed and
materialized the automatic settlement process, real-time stock operations within the Bank of
Cape Verde, namely, operations in the primary and secondary market and, corporate events.
The developments made, aims the creation of an automatic process that allow interaction
between Sifox BackOffice and Management Deposit and Settlement System of the Bank of
Cape Verde.
Partnership and Associations
Through the years, the BVC has strengthened its principle partners, such as, Euronext Lisbon
and; Interbolsa, which is an agency of Euronext Lisbon, with the Caixa de Crédito Agrícola, with
the OPACCV which is a Professional Association of Accountants and Auditors of Cape Verde
and the Ministry of the Finances and Public Administration.
ASEA
Y E A R B O O K
In 2013 has celebrate a partnership with the Universidade de Mindelo in the ambit of Financial
Literacy Program.
During 2013 BVC attended most of the General Meetings and events organized by national
and international Associations which BVC is part/member of, with the goal to maximize its
activities and internationalize the market.
241
African Securities Exchanges Association
Perspectives for 2014
There are still many challenges to be addressed in order for the BVC to reach its potential. This
includes the following:
For the year 2014, it is expected further expansion of activities, as for the 2014 Activities Plan
and, continuing the plans outlined and started in the previous year.
The main objectives remain the boost of the Secondary Market of Public Debt, the creation of
Market Makers, the consolidation of international partnerships aiming emissions in the Diaspora,
especially the Diaspora Bond. International publicity for the Cape Verde Stock Exchange
on major channels aiming towards increased notoriety and in doing so, attracting investors
from diverse corners of the world. Staff training in financial systems in a way to reinforce staff
capacity with the purpose to accompany international dynamics. Financial Literacy Project,
strengthening contacts with schools and Universities, aware that a continual flow of information
versus education among young people is essential for the expansion of greater Financial Culture.
In another perspective, Cape Verde Stock Exchange, taking advantage of the same strategy,
intend to expand the business world seeking for a commitment to trade on the Stock Exchange.
To this end, BVC intends to reinforce bonds with local entrepreneurs, listen to their questions,
doubts and concerns with purpose of taking every possible opportunity of funding.
ASEA
Y E A R B O O K
Although believing that our capital market has developed, there are several levels to be
achieved, among them, the development of new financial products and the enhancement of
the secondary market, key points for affirmation and consolidation of Cape Verdean capital
market.
BOLSA DE VALORES DE CABO VERDE
242
African Securities Exchanges Association
Statistics
Section One : Economic Indicators
Main Economic Indicators
Indicators *
2010
2011
2012
2013
Population (million)
Real GDP (USD)
(millions) at market
exchange rates
Inflation rate (%)
Net Foreign Direct
Investment (USD)
(Millions)
Unemployment rate
(%)
Interest Rate (T-Bills)
0.53
0.53
0.56
0.56
1,938.00
1,890.00
3.2
1.5
1,900.00
1,856.00
Exchange rate (local
currency versus US$)
1.41
6.50
1767.44
112.00
93.00
71.00
10.7
12.70
12.20
16.80
3.625
4.06
6.6
3.2578
83.03
81.6
85.2
83.169
“* Source www.worldbank.org; www.imf.org; www.tradingeconomics.com; www.minfin.gov.
cv; www.bcv.cv; www.ine.cv“
Section Two : Trading Statistics
Trading equity Statistics
2011
533,310.93
2012
271,933.69
2013
446,318.09
120,502.00
17,126.00
156,690.00
11,513.00
215.00
71.00
301
55
4
4
4
4
4
4
4
4
84,913,010.47
75,556,452.41
84,430,843.68
89,364,316.03
4.58%
3.98%
0.043565967
0.047282707
4.89%
0.71%
0.003220786
0.004994366
* Turnover Ratio (%)= value traded of listed securities/market capitalization
ASEA
2010
4,156,256.95
Y E A R B O O K
Indicators
Total value
traded
Total volume
traded
Total number of
transactions
Number of listed
companies
Number
of traded
companies
Market
Capitalization ($)
end of year
Market
Capitalization as
% of GDP
Turnover Ratio
(%) *
243
African Securities Exchanges Association
Investors Type
Foreigners vs. Local Investors
Type of Investors
2009
N/A
N/A
Foreign Investors
Local Investors
Total %
N/A
% of the Total Value Traded
2010
2012
N/A
N/A
N/A
N/A
N/A
N/A
2013
N/A
N/A
N/A
Insitutions Vs. Individuals
Institutions
Individuals
Total %
N/A
N/A
N/A
N/A
N/A
N/A
N/A
N/A
N/A
N/A
N/A
N/A
Sectors Traded
Sectors traded
on the Stock
Exchange
ASEA
Y E A R B O O K
Domestic Board
Banking
244
Financial Services
Retail &
Wholesaling
Property
Funeral Services
Security Services
Information
Tecchnology
Energy
Tourism
Fuel And Oil
Industrial and Allied
Health
Foreign Board
Financial Services
Mining & Minerals
Retail &
Wholesaling
Corporate Bonds
Number of companies included in each sector
2010
2011
2012
2013
2
2
2
2
1
1
1
1
1
1
1
1
16
16
16
18
African Securities Exchanges Association
Table 5: 5 Most Active Sectors in 2013
#
1
2
3
4
Sectors
Comercial Banks
Fuel and Oil
Corporate Bonds
Industrial and Allied
ASEA
Y E A R B O O K
245
ASEA
246
827,351.66
2013
16,477,848.44 7,796,866.80
8,322,167.72
3,852,528.09
59,277.01
3,852,528.09
2012
Value traded on
corporate bonds
8,322,167.72
2011
768,074.64
16,477,848.44 7,796,866.80
2009 2010
Value traded on
governmental
bonds
Total Value traded
Bonds
Table 6: Bonds Statistics
Section Three: Bonds Statistics
Y E A R B O O K
African Securities Exchanges Association
African Securities Exchanges Association
Section Four : Trading System
Trading System ( SIFOX DEAL )
Is this system locally developed or bought?
If bought, who is the Vendor?
Year of implementing the system:
Bought
Finantech - Portugal
2005
Section Five : Clearing and Settlement
Where do Clearing & Settlement take
place?
The Stock Exchange
Yes
Separate Company
If Separate Company please mention its Central Securities Depository Botswana
name
Is this system locally developed
or bought?
Yes
If bought, who is the Vendor?
Finantech - Portugal
Year of implementing the system:
2005
Clearing and Settlement is conducted in:
T+ 2
T+ 3
Others
T+0
Section Six : Products traded on the Stock
Exchange
Types of markets in the Stock Exchange
Equity Market
Cash Market
Derivative Market
Bond Market
Yes
Yes
Products
Product (Stocks,Bonds,
Funds,ETF's,Derivatives ..etc)
Stocks
Bonds
Description of the Product
Common shares
Government and Corporate bonds
ASEA
Y E A R B O O K
247
African Securities Exchanges Association
Section Seven : Trading Mechanism
Margin Trading
Intraday Trading
Online Trading
Yes
Section Seven : Indices
Indices
Index Name
Domestic company Index
Foreign company index
ASEA
Y E A R B O O K
Domestic Company
Index
Foreign Company
Index
248
Index Type (Price Index, Sector Index,..etc)
N/A
N/A
Closing 2012
N/A
Closing 2013
N/A
N/A
N/A
% change
African Securities Exchanges Association
Section Eight : IPOs
Company
None
2012
Date of IPO
Value of IPO ($ million)
0
0
Debt securities
2012
Company
ELECTRA
ASA
Tecnicil Imobiliária
Value of IPO ($ million)
0
2013
Company
IFH
INPHARMA
Value of Issue ( $ million )
Section Nine : 2011 Rankings of Top 5 Trading
Participants
Ranking
1
2
3
4
5
Stockbrokerage Units
BCN
BCA
CECV
BIA
BAI
Purchases
$
643,568.34
235,608.94
153,559.02
226,312.50
14,248.10
1,273,296.89
Sales
$
677,547.16
212,945.51
187,828.93
48,466.38
146,508.92
1,273,296.89
Total
$
1,321,115.50
448,554.45
341,387.95
274,778.87
160,757.01
2,546,593.78
ASEA
Y E A R B O O K
249
ASEA
Y E A R B O O K
African Securities Exchanges Association
250
AFRICAN SECURITIES EXCHANGES ASSOCIATION
ASEA SECRETARIAT
THE EXCHANGE BUILDING, 55 WESTLANDS ROAD,
P. O. BOX 43633 - 00100 NAIROBI KENYA
TEL: + 254 (20) 2831000
EMAIL: [email protected]
www.african-exchanges.org


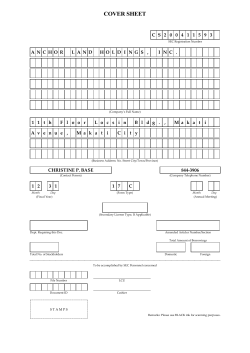
© Copyright 2026