
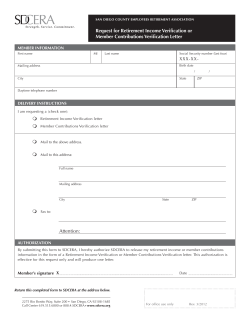
CRC Memorandum M S
CRC Memorandum
No. 1130
A publication of the Citizens Research Council of Michigan October 2014
Making Sense of K-12 Funding
The current political debate seems fixated, at times,
on the issue of state funding for public K-12 schools.
Specifically, claims and counterclaims have been
leveled about whether state funding has increased
or decreased in recent years. Although disputes over
public education finances are nothing new, recent
changes in the way the state allocates funds to local
school districts has created confusion and has fueled
the present debate. These changes have made it
more difficult to provide straightforward, simple
answers to questions about school funding. Today,
accurate and comprehensive responses to questions
about school funding require additional explanation,
much more than may have been required in the past.
This Memorandum answers three fundamental
questions surrounding the issue of school funding.
1) Is school funding up or down compared to four
years ago? 2) Over this period, has funding gone up
as much as it could have? 3) Are individual school
districts better off today than they were four years
ago?
Is Funding Up or Down?
Billions
State education appropriations are financed almost
The answer to this basic question is an unequivocal
exclusively by the School Aid Fund (SAF) with the
“up” when just the raw numbers are considered.
General Fund responsible for a couple line items.
However, providing this simple answer requires additional explanation to understand the larger fiscal
Chart 1 shows the most recent five-year total
picture facing schools, including where the additional
appropriations history, by major fund source, for
funding is being directed and how the
money is being used.
Chart 1
Public schools receive operating funding Total K-12 Education Funding by Major Source: FY2011
FY2015
from federal, state, and local sources; to $16
however, it is state lawmakers, not local
$14
school boards, that have sole control
$11.8
$11.3
over funding decisions involving state
$11.1
$12
$10.8
$10.7
funds – including the amount of funding
$10
available for public education and the
per-pupil dollar amounts allocated to
$8
each school district. State dollars have
State
$6
financed the majority of local school
Sources
$4
district budgets since the adoption
of Proposal A in the mid-1990s when
$2
state taxes replaced local property
$0
taxes as the primary revenue source
FY2011
FY2012
FY2013
FY2014
FY2015
for public schools. Most of a district’s
general operations are financed from
School Aid Fund
General Fund
a combination general state aid (e.g.,
School Aid Fund - Retirement
Federal - Regular
Federal - Stimulus
Total State
foundation allowance) and categorical
grants (e.g., at-risk student funds)
Source: Senate Fiscal Agency and House Fiscal Agency reports
allocated through the state budget.
CITIZENS
R E S E A R C H C O U N C I L OF MICHIGAN
Eric W. Lupher, President
MAIN OFFICE 38777 Six Mile Road, Suite 208 • Livonia, MI 48152-3974 • 734-542-8001 • Fax 734-542-8004
LANSING OFFICE 115 West Allegan, Suite 480 • Lansing, MI 48933-1738 • 517-485-9444
CRCMICH.ORG
CRC Memorandum
Total appropriations increased from $12.9 billion in
FY2011 to $13.6 billion for the current fiscal year
(FY2015), with annual increases in every year since
FY2012. The decline from FY2011 to FY2012 was
the result of the phase-out of temporary federal
education dollars (i.e., stimulus funding); in FY2011,
Michigan received about $500 million from federal
sources to maintain state spending. With the end of
the federal stimulus dollars, state lawmakers chose to
reduce appropriations rather than replace the funds
with state dollars.
To address these growing liabilities and provide districts with more predictability in financial planning,
the state enacted reforms to the retirement system in
2012 to cap the schools’ contributions for unfunded
retirement liabilities to 20.96 percent of payroll. Under the law, required retirement payments above the
cap are satisfied by the state from a separate School
Aid Fund appropriation ($675 million in FY2015). In
addition to this direct state funding, an additional
$100 million appropriation is allocated to help individual districts meet their annual retirement contributions. Combined, total MPSERS-specific funding
increased more than five-fold from $155 million in
FY2012 to $883 million in FY2015.
In terms of K-12 resources that lawmakers control
directly, state-source appropriations rose from $10.7
billion to $11.8 billion over the five-year period, a
total increase of $1.1 billion or about 2.5 percent per
year. Much of the increase, beginning in FY2012,
was used for SAF-financed appropriations specifically
to address public schools’ legacy costs associated
with the state-administered Michigan Public School
Employees Retirement System (MPSERS). School
districts’ unfunded retirement liabilities are up significantly because of the financial market downturn in
2008 and the decision by state lawmakers to begin
prefunding retiree health care benefits. Even with
the increase in funding, the total unfunded accrued
liability increased from $12 billion in 2009 to $25
billion in 2013.
While it is the case that state-sourced funding to K-12
education increased in recent years, this growth has
funded appropriations intended to address schools’
retirement obligations, specifically the unfunded
liabilities resulting from past years’ underfunding.
These retirement payments are mandatory and have
to be satisfied one way or another, either through direct state appropriations or via the state aid provided
to individual school districts through their foundation
allowances. While districts continue to finance the
majority of their unfunded retirement liabilities from
a portion of the foundation allowance they receive,
under the current arrangement, the state budget is
providing specific funding to help finance a share of
these liabilities. In both cases, retirement contributions are funded with SAF dollars.
K-12 education (excludes adult education and early
childhood funding).
Is Funding Up As Much As It Could Have Been?
Public education funding trends are directly influenced by other state policy decisions, including tax
policy changes affecting the School Aid Fund revenues and budget decisions regarding the allocation
of the School Aid Fund. Recent major tax and budget policy decisions have stretched the School Aid
Fund and cannot be ignored in the current debate
surrounding education funding.
Michigan made significant changes to its overall tax
structure with legislation enacted in 2011. An over-
haul of the individual income tax and business taxes
took effect in 2012 and was fully phased in over two
fiscal years. Key provisions of the reforms included
eliminating the Michigan Business Tax, imposing a
new Corporate Income Tax, expanding the base of
the Personal Income Tax, and freezing a scheduled
Personal Income Tax rate reduction. The changes in
expected revenues that resulted from the tax reforms
had to be incorporated in the state spending plan
beginning in FY2012.
CRC Board of Directors
JEFFREY D. BERGERON, Chair
TERENCE M. DONNELLY, Vice Chair
ALEKSANDRA A. MIZIOLEK, Treasurer
MICHAEL G. BICKERS
BETH CHAPPELL
RANDALL W. EBERTS
2
SHERRIE L. FARRELL
EUGENE A. GARGARO, Jr.
JOHN J. GASPAROVIC
INGRID A. GREGG
JUNE SUMMERS HAAS
MARYBETH S. HOWE
NICK A. KHOURI
WILLIAM J. LAWRENCE III
DANIEL T. LIS
KRISTEN McDONALD
MICHAEL P. McGEE
PAUL OBERMEYER
BRIAN PETERS
KEVIN PROKOP
JAY RISING
KELLY ROSSMAN-McKINNEY
CANDEE SAFERIAN
CHRISTINE MASON SONERAL
TERENCE A. THOMAS, Sr.
THEODORE J. VOGEL
CRC Memorandum
Chart 2 highlights the recent
revenue history of the School
Aid Fund by major source (excludes General Fund deposit).
Chart 2
Total School Aid Fund Revenue by Major Source: FY2011 to
FY2015
$14
$12
$11.2
$10.9
$11.3
$11.5
$11.9
FY2011
FY2012
FY2013
FY2014
FY2015
$10
Billions
Overall, the School Aid Fund
s h o u l d e re d a s i g n i f i c a n t
amount of the net $1.8 billion business tax cut portion
of the tax reform package.
The School Aid Fund picked
up some additional revenue
through the changes made
to the Personal Income Tax,
but not enough to offset the
revenue lost because of the
Michigan Business Tax elimination. The Senate Fiscal
Agency estimates that the
School Aid Fund will experience
a net revenue decline of $688
million from the tax changes
and that the General Fund will
net an additional $714 million
in FY2015.
$8
$6
$4
$2
$0
Sales and Use Tax
Michigan Business Tax
Lottery Revenue
Income Tax
State Education Tax
Other
Source: Senate Fiscal Agency reports
The loss of the Michigan Business Tax earmark ($662 milthe amount of resources available for K-12 education
lion) is clearly visible in the change from FY2011
each year.
to FY2012 in total School Aid Fund. Total revenue
declined from $11.2 billion in FY2011 to $10.9 billion
The recent increase in state support for early childin FY2012. Since that time, total revenue increased
hood programming was another important policy
to $11.9 billion in FY2015.
decision affecting K-12 education funding. The Great
Budgetary decisions to shift more funding responsibilities from the General Fund created additional
strain on the School Aid Fund. Most significantly, as
part of the FY2012 budget, $460 million in School
Aid Fund resources were used to support the Higher
Education and Community Colleges budgets, offsetting an equal amount of General Fund appropriation
reductions. Prior to this change, the School Aid
Fund resources were reserved almost exclusively to
finance K-12 education.1 This fiscal policy change
helped lawmakers balance the FY2012 General Fund
budget. Since that time, the School Aid Fund has
been responsible for financing about $400 million
of combined university/college state appropriations
each fiscal year.2 This has had the effect of reducing
Start Readiness Program provides preschool services
to needy four year olds. State lawmakers expanded the program in the last two years by more than
doubling its School Aid Fund allocation from $120
million in FY2013 to $250 million in FY2015. The
annual $65 million bumps in funding each of the last
1
In FY2010, the School Aid Fund financed $208 million of
state appropriations to Michigan community colleges in an
effort to address a projected General Fund budget deficit. At
the time, this appropriation was viewed as one-time in nature.
The constitutional language establishing the School Aid Fund
allows the fund to be used to provide aid to higher education
institutions. Specifically, Article IX, Section 11 of the 1963
Constitution states that the fund “shall be used exclusively for aid to school districts, higher education, and school
employees’ retirement systems, as provided by law (emphasis
added).”
2
3
CRC Memorandum
two years meant that fewer resources were available
for K-12 education.
At the same time that the School Aid Fund’s responsibilities have expanded, state General Fund support
for K-12 education has dwindled. In FY2015, the
state General Fund budget allocates $115 million for
K-12 education, down from $282 million in FY2013.
Are Individual Districts Better Off?
It is a little more difficult to provide a definitive answer to this question because the factors influencing
a school district’s total funding vary across districts.
Total operational funding is primarily a function of
a district’s per-pupil foundation allowance and the
number of students it enrolls. At the individual district level, each of these components is influenced
differently by state policy decisions as well as circumstances unique to a district.
Chart 3 examines recent changes in total statesourced K-12 appropriations on a per-pupil basis,
again excluding allocations for adult education and
preschool. The story here is clear and consistent
with that of Chart 1; funding increases each year.
Total per-pupil funding (both general and categorical aid) rose nearly $1,000 per pupil, from $6,800
in FY2011 to $7,797 in FY2015. While the amount
of total state per-pupil funding has grown, much of
the increase is earmarked for specific purposes (e.g.,
retirement obligations) as opposed to unrestricted
state aid. Similarly, state lawmakers have used some
of the additional state funds to incent school districts
to adopt certain practices or engage in specific behaviors as a condition of receiving state aid (e.g.,
adopt best practices, improve student performance).
Previously, these funds would have been provided
to schools through the foundation allowance without
any strings attached.
Historically, the foundation allowance has been used
as the measuring stick when discussing per-pupil
funding in Michigan because it is the largest funding source supporting each district’s general fund
budget. Also, since the adoption of Proposal A, the
foundation allowance has been used to finance a
school district’s share of required retirement costs
related to MPSERS.
Chart 3
State-Funded Per-Pupil Appropriations for K-12 Education: FY2011 to FY2015*
$9,000
$8,000
$7,000
$6,800
$6,967
$7,201
$7,420
FY2011
FY2012
FY2013
FY2014
$7,797
Per-Pupil
$6,000
$5,000
$4,000
$3,000
$2,000
$1,000
$0
School Aid Fund
General Fund
FY2015
School Aid Fund - Retirement
* Excludes early childhood and adult education funding.
Source: Senate Fiscal Agency and House Fiscal Agency reports
4
Chart 4 shows the effects of total MPSERS
retirement costs on the minimum foundation allowance from FY2011 to FY2015. On
average, a district receiving the minimum
foundation grant in FY2011 ($7,316 per pupil) was required to use $1,135 per pupil (16
percent) of the grant to satisfy retirement
obligations, effectively leaving $6,181 per
pupil for other general fund expenses (e.g.,
salaries, other benefits, supplies, utilities,
etc.). The growth of these obligations,
along with reductions made to the foundation allowance in FY2012, have resulted in
fewer resources available to school districts
to meet other, non-retirement expenses. In
FY2015, the minimum foundation grant is
set at $7,251 per pupil, but approximately
$1,304 per pupil (18 percent) must be used
to meet retirement obligations. This leaves
$5,947 per pupil for all other educational
spending, about $234 less compared to
FY2011.
CRC Memorandum
Chart 4
Effect of MPSERS Costs on Minimum Foundation: FY2011
to FY2015
$9,000
$6,946
$7,171
$7,409
$5,862
$7,316
$5,774
$8,000
$7,835
Fewer students effectively allows
the amount of state funds to be
stretched and permits per-pupil
funding to increase at a faster annual clip (3.5 percent) than total state
funding (2.5 percent).
Per-Pupil Funding
The amount of per-pupil funding a school district receives is
only one part of the equation
that determines the overall
funding available to a district
each year. The other key
factor is enrollment. Statewide enrollment dropped 3.7
percent from 2011 to 2014.
$5,947
$6,181
$5,641
For many districts, declining enrollment has been a permanent
$6,000
fixture of their fiscal planning for
$5,000
a number of years. The causes
$4,000
of declining enrollment are many
Minimum
$3,000
Foundation
and each school district is affected
$7,251
$2,000
differently by each cause. One
$1,000
important, over-arching contributor
is statewide enrollment, which has
$0
FY2011
FY2012
FY2013
FY2014
FY2015
been on a downward trend since
the early 2000s and does not show
Foundation: Discretionary
Foundation: Retirement
State: Retirement
signs of changing course in the
immediate future. Also, districts’
Source: Senate Fiscal Agency and House Fiscal Agency Reports; Office of Reenrollments are affected by the
tirement Services
increased competition for students
(and foundation allowance dollars)
As a result of the MPSERS reforms in 2012 (discussed
that has grown with the expansion
above), the state now meets a portion of a district’s
of school choice options in their communities, includunfunded retirement liabilities. For all intents and
ing charter schools and inter-district choice options.
purposes, this state funding, absent the reforms,
Table 1 shows the enrollment experience among
would have been distributed to districts via the
traditional public school districts and charter schools
foundation allowance and paid from that source. For
over the most recent five-year period. Generally
this reason, the state share of the retirement costs
speaking, traditional public school districts saw enare included in Chart 4. It is clear that MPSERS
rollment declines, while charter schools experienced
costs, in the aggregate, have
grown significantly over the
five-year period and that Table 1
the share of the foundation Enrollment Changes in Traditional Public School Districts and
allowance available for other Charter Schools, 2009-10 to 2013-14*
typical classroom expenses
Traditional Public
has increased very modestly,
School Districts
Charter Schools
Enrollment Change:
Share of
Share of
but has not kept up with gen2009-10 to 2013-14
Number Total
Number Total
eral inflation.
$7,000
Enrollment Gain
153
28%
Enrollment Loss
Greater than 50%
1
0
25% to 50%
16
3
10% to 25%
137
25
0 to 10%
235
43
126
5
13
27
28
63%
3
7
14
14
* Enrollment data is total full-time equivalency (FTE) K-12 student count in fall of each
year.
Source: Center for Educational Performance and Information
5
CRC Memorandum
increases.
Table 2
Two-thirds of
Enrollment Changes and Staffing Changes in Traditional Public School Districts,
all traditional
2009-10 to 2013-14*
public school
EnrollmentTeachers
Total StaffMemo:
districts (360 Annual
Annual
Annual
Student/
of 543 dis
Students
Change
FTE Change
FTE
Change Teacher Ratio
tricts) saw
2009-10
1,487,297 79,956 176,277 18.6
their enroll2010-11
1,457,160 (2.0%)
75,951 (5.0%)
166,766 (5.4%)
19.2
ment decline
2011-12
1,432,200 (1.7%)
74,323 (2.1%)
159,342 (4.5%)
19.3
from 2012-13
2012-13
1,405,599 (1.9%)
72,921 (1.9%)
157,484 (1.2%)
19.3
2013-14
1,374,800 (2.2%)
72,014 (1.2%)
154,293 (2.0%)
19.1
to 2013-14.
Change:
Looking at
2009-10 to
the five-year
2013-14
(112,497) (7.6%)
(7,942) (9.9%)
(21,984) (12.5%)
period reveals
that over 70
* Staffing data is total full-time equivalency (FTE) positions.
percent of all
Source: Center for Educational Performance and Information
districts saw
some amount
The general effect of declining enrollment means less
of enrollment decline and over one-quarter of all
demand for educational personnel, including instrucdistricts had declines of 10 percent or more (about
tional and non-instructional staff. Declining student
2.6 percent annual decline).
enrollment in traditional public school districts was
matched by a corresponding contraction in the school
As enrollment declines, school districts are left with
workforce from 2009-10 to 2013-14 (see Table 2).
fewer resources in total. Managing in an environment of declining resources, at least in the short
A common metric used to analyze staffing levels in
term, can be difficult, especially when the funding
the public school setting over time is student/teachreduction is sizeable. All schools face some fixed
er ratio. This ratio describes the average number
(or semi-fixed) costs for building operations (i.e.,
of students per teacher at a given point in time for
lighting, heating), employing teachers, and staffing
a specific educational setting (e.g., state, district,
various non-instructional positions. When students
school). In general, an increasing ratio indicates that
leave a district, many of these costs remain with the
the average class size is growing, while a decreasing
district. The reality is that the relationship between
number suggests class size is declining. From a
enrollment and district costs is not completely linear,
statewide perspective, the average student/teacher
at least in the near term.
Over time, districts are able to “right size” their budget to accommodate a significantly smaller student
body, for instance, by closing buildings or reducing
staff. But, in the short run, declining enrollment
can increase fiscal stress associated with meeting
the “sticky” fixed/semi-fixed costs. The bottom line
is that declining enrollment will continue to be a
challenge requiring affected districts to think long
term to effectively manage their resources without
incurring undue fiscal stress.
Despite the challenges associated with managing
down, there is evidence, both statewide and at the
individual district level, that schools are making
changes in their operations to meet financial realities.
6
Table 3
Student/Teacher Ratios in Traditional Public
School Districts, 2009-10 to 2013-14
Change in
Number
Share
Student/Teacher Ratio
of Districts
of Total
Ratio increase of:
0 to 2 275
50.8%
2 to 5
84
15.5
Greater than 5 9
1.7
Ratio decrease of:
0 to -2 145
26.8
-2 to -5 244.4
Less than -5 4
0.7
Source: Center for Educational Performance and Information
CRC Memorandum
ratio increased from 18.6 students in 2009-10 to 19.1
students in 2013-14. A total of 368 districts, more
than two-thirds of all districts, saw their student/
teacher ratio increase between 2009-10 and 2013-14
(see Table 3). The student/teacher ratio increases
suggest that districts reduced the number of classroom teachers employed in greater proportions than
the declines in student enrollment during the fiveyear period. More than one-half of all districts had
a ratio increase of less than 2.0 students.
Final Assessment
Making sense of school funding is never an easy task.
Because of changes made to the way state funding
is shared with public schools in recent years, the
task has been made slightly more difficult. Also,
because school funding has taken a front-row seat in
the current political debate, there has been a flurry
of claims and counter-claims about changes in state
funding for K-12 education. As a result, citizens are
left scratching their heads about what to believe. To
help clear up some of the confusion surrounding this
important public policy issue, the Citizens Research
Council of Michigan set out to answer three fundamental questions.
As to the first question, “Is school funding up or
down compared to four years ago?” the answer is
an unequivocal “up”. While total state funding is up
over $1 billion from FY2011 to FY2015, the increase
is almost exclusively earmarked to satisfy school
employee retirement costs, specifically legacy costs
arising from the financial market downturn and state
retirement system reforms.
With respect to the second question, “Has education funding gone up as much as it could have?”
the answer is “no”. State tax policy and budget
decisions effectively stretched the School Aid Fund,
leaving fewer dollars available for distribution to K-12
schools. The personal income tax and business tax
reforms of 2012 substantially reduced the amount
of state tax revenue deposited in the School Aid
Fund. Also, policymakers decided to fund certain
state higher education appropriations from the
School Aid Fund. Combined, these decisions have
effectively reduced the amount of state resources
schools receive.
Finally, the answer to the third question, “Are individual school districts better off today than they
were four years ago?” is less definitive. While the
amount of per-pupil funding is up, districts are paying
higher retirement bills. This leaves fewer resources
for other school expenses. Also, total funding at the
district level is greatly influenced by the number of
students enrolled. Because declining enrollment is
a pervasive issue across the state, the vast majority
of traditional public school districts must manage the
fiscal effects of having less non-retirement funding
to operate.
7
CRC Memorandum
Do you find this report useful?
The Citizens Research Council of Michigan is a non-profit organization that can only provide
information to policy makers and citizens with support from people like you. You can learn
more about the organization at www.crcmich.org/information/info.html. If you found the contents of this report useful and wish to provide financial support to help carry on CRC’s mission,
please fill out the form below and send it to:
Citizens Research Council of Michigan
38777 Six Mile Road, Suite 208
Livonia, MI 48152-3974
YES! I want to help in the support of
sound public policy in Michigan!
NAME________________________________________________________________
ADDRESS________________________________________________________________
EMAIL / PHONE
_______________________________________________________
• I wish to make a one-time, tax-deductible gift of: $ __________
• I wish to pledge a total of $ __________ with an initital payment of $ __________ .
• I would like my contribution to support:
Annual Fund
Endowment
• Please mark my gift:
Anonymous
• Gift will be matched by:
In Honor Of:
__________________________________
In Memory Of: __________________________________
____________________________________________________
Or donate online at www.crcmich.org
8


© Copyright 2026