
For personal use only
For personal use only
PRODUCTS FOR TODAY AND EVERYDAY
In the ever-changing Australian market, we remain a market
For personal use only
leader by delivering high quality, dependable products.
They’re simple, efficient household companions that after 60
years on the shelf, still perform.
By choosing Pental you’re choosing a product that’s made by
Australians, for Australians.
Household Cleaning
Fire Needs
Personal Care
Laundry
Kitchen
Oral Care
For personal use only
CONTENTS
5
CHAIRMAN’S
REVIEW
9
CORPORATE
GOVERNANCE
STATEMENT
17
DIRECTORS’
REPORT
39 40 42
AUDITOR’S
INDEPENDENCE
DECLARATION
INDEPENDENT
AUDITOR’S REPORT
DIRECTORS’
DECLARATION
43 44 45
CONSOLIDATED
CONSOLIDATED
STATEMENT OF PROFIT
STATEMENT OF
OR LOSS AND OTHER FINANCIAL POSITION
COMPREHENSIVE
INCOME
CONSOLIDATED
STATEMENT OF
CHANGES IN EQUITY
48 49 91
CONSOLIDATED
STATEMENT OF
CASH FLOWS
NOTES TO THE
FINANCIAL
STATEMENTS
ADDITIONAL
STOCK EXCHANGE
INFORMATION
Pental Limited 2014 Financial Report | 3 |
For personal use only
For personal use only
CHAIRMAN’S
REVIEW
On behalf of the Directors of Pental Limited, I am
pleased to present the 2014 Annual Report.
During 2014 financial year management and the
Board continued to implement the next phase of its
re-invigoration strategy before moving onto the next
phase of its growth strategy. The cornerstone of this
strategy for 2014 financial year was “consolidating and
securing” its position in the Australia and New Zealand
markets. This was achieved through:
š 7KHFRQWLQXHGSXUVXLWRIJURZWKWKURXJKQHZSURGXFW
development and innovation;
š $XVWUDOLDQPDGHDQGRZQHGFUHGHQWLDOVODXQFKHG
on all key brand products;
š ,PSURYLQJRQRXUPDQXIDFWXULQJFDSDELOLW\WKURXJK
capital investment and commitment to a continuous
improvement/lean manufacturing disciplines;
š %HFRPLQJWKHGRPLQDQWSURYLGHURIGRPHVWLFEOHDFK
through our White King brand and new private label
business;
š 3ODQQLQJIRUWKHQH[WVLJQLıFDQWFDSLWDOLQYHVWPHQW
– being a high speed liquid line, which will allow the
business to grow its existing private label business
and become more cost competitive;
š ,QYHVWLQJLQXSJUDGLQJWKH(QWHUSULVH5HVRXUFH
Planning (ERP) system and a new forecast and
promotional management system, to sharpen the
business processes and disciplines;
š )XUWKHUVWUHQJWKHQLQJWKH%DODQFH6KHHWZLWKWKH
issuance of Piggy Back Options to Loyalty Option
holders who had exercised their Loyalty Options
early) via a capital raising of $5.705 million (net of
costs and tax). This enabled Pental to normalise its
banking arrangements and set the foundation for
future capital investment and growth; and
š 5HLQVWDWHPHQWRIGLYLGHQGVVXSSRUWHGE\LPSURYHG
profitability and a more predictable business model
with strong underlying cash flows.
OVERVIEW
The net profit after tax of $5.336 million for the year
(52 weeks) was a $3.443 million improvement on last
year. Whilst the Board was pleased with the result, the
reduction of debt from $8.212 million to zero and the
completion of the bleach plant relocation and upgrade,
the expected bleach plant efficiency improvements have
taken much longer than initially anticipated. In the more
recent months, with a disciplined process of resolving
production shortcomings, efficient production output
has since substantially improved.
Net Profit after tax of
$5.336 million
(52 weeks) was a $3.443 million
improvement on last year
Pental gross sales of $109.4 million were 1.38% up
on last year, with the main focus on maintaining/
growing acceptable margins rather than participating
in aggressive price reduction campaigns. Although the
business continued to be under pressure from major
retail customers to increase promotional allowances
and reduce prices, it was able to reduce promotional
spend which did not provide acceptable returns. As a
result, a solid underlying EBITDA of $9.690 million was
achieved - marginally above last year.
The underlying EBITDA margin to gross sales of
8.8% (2013: 8.9%) was broadly in line with last year,
considering:
š WKHLQFUHDVHGFRVWRIUDZPDWHULDOVWKDWFRXOG
not be recovered through price increases;
š H[WUDFRVWRIUHQWDOPLOOLRQIROORZLQJWKH
sale and leaseback of the Shepparton properties and
relocation of the corporate office in the prior year; and
š DGGLWLRQDOFRVWVRIPLOOLRQLQFXUUHGGXULQJWKH
relocation/upgrade of the bleach plant and delayed
promotional sales, as it proved more challenging than
originally foreseen to achieve a consistent output from
the bleach plant during this period of consolidation.
The underlying EBIT of $7.897 million was $0.652 million
down on last year due to the increased depreciation
expense arising from new capital investment, in
particular the relocated and upgraded bleach plant.
To enhance our overall manufacturing and supply chain
capability, the business also commenced the review
of a number of manufacturing processes utilising
continuous improvement/lean manufacturing principles.
This will streamline many processes leading to further
improvements in productivity and cost reductions. To
improve margins and offset supplier cost pressures,
Pental has and will continue to invest in new capital
projects targeted to providing a short term payback (as
a key priority) and proactively sourcing raw material
and products from the most cost effective destination,
whilst still maintaining our Australian Made and Owned
credentials where strategically appropriate.
Pental Limited 2014 Financial Report | 5 |
For personal use only
A year of consolidation, with the
business
on target
For personal use only
with strategy
Table(i) below shows a reconciliation between the reported net profit after tax and the underlying EBITDA.
FY 14 (i)
$’000
FY 13 (i)
$’000
% Change
5,336
1,893
+100%
–
310
2,002
556
960
5,663
-83.0%
8,298
8,422
-1.5%
(401)
127
Underlying EBIT
7,897
8,549
Depreciation and amortisation
1,793
1,069
Underlying EBITDA
9,690
9,618
Reported profit after tax
Net loss from discontinued operations
Income tax expense
Finance and borrowings costs
EBIT from continuing operations
Net one off/significant (income)/expense(ii)
-7.6%
0.7%
(i) Unaudited non-IFRS financial table.
(ii) Refer to consolidated statement of profit or loss and other comprehensive income.
On achieving a solid net profit for the year and by
completing the capital raising of $5.705 million net
of costs and tax (through the issuance of Piggy Back
Options to Loyalty Option holders who had exercised
their Loyalty Options early), this has enabled Pental
to return to a net cash position and is now in a sound
position to invest in the high speed liquid line and other
capital projects to grow the business and reduce costs.
With the improved profitability, the Board has
recommended payment of a fully franked full year
dividend of 0.12 cents per ordinary share, payable to
shareholders on 30 September 2014, with a record date
of 12 September 2014.
OUTLOOK
The Board is comfortable that the repositioning of the
Group has resulted in a more predictable underlying
cash flows business. This has been demonstrated
through achieving a solid result in the 2014 financial
year, bearing in mind in the recent prior years the
business has endured a number of significant structural
changes. As a result, following the payment of a full year
dividend, the Board also plan to reinstate the payment
of sustainable interim dividends, subject to performance
and outlook of the business.
The pursuit of growth continues to be through new
product innovation and competing on value rather
than price alone, whilst progressively evolving our key
brands into new categories and channels, supported by
further growth expected through meeting the increasing
demands of private label.
Similarly with manufacturing improvements being made
and the ongoing refresh of its manufacturing capability
through improved disciplines and further capital
investment, such as the high speed liquid line (to be
installed during 2015 financial year), and modernisation
and consolidation of its soap manufacturing processes,
Pental will be well placed to capitalise on future brand
and private label growth opportunities, whilst leveraging
its Australian made and owned credentials.
Whilst the highly competitive nature of the grocery retail
market remains consistent to the prior years and this is
expected in the foreseeable future, the business is better
equipped to move forward and to take advantage of any
value-creating acquisition or distributorship opportunities
that may arise, as the Board is committed to pursuing all
avenues of growth that will improve shareholder returns.
Furthermore, with the improved financial position,
the Board now considers a share consolidation is
appropriate due to the significant number of shares on
issue. As shareholder approval is required, this will be
submitted for shareholders’ consideration at the Annual
General Meeting.
The Directors would like to thank all of our staff,
shareholders, suppliers and customers for their
ongoing loyalty and support.
Peter Robinson
Chairman
Pental Limited 2014 Financial Report | 7 |
For personal use only
For personal use only
CORPORATE
GOVERNANCE
STATEMENT
This Corporate Governance Statement sets out the
Company’s current compliance with the ASX Corporate
Governance Council’s Principles of Good Corporate
Governance and Best Practice Recommendations (Best
Practice Recommendations).
Best Practice Recommendation
1.
Lay solid foundations for management
and oversight
1.1
Companies should establish the functions reserved
to the board and those delegated to senior
executives and disclose those functions.
1.2
The Company’s website www.pental.com.au contains an
Investor Section, which details the Company’s Corporate
Governance policies and procedures. This provides
public access to all the information relevant to the
Company meeting its corporate governance obligations.
Comment
The Corporate Governance Policies include a Board
Charter, which discloses the specific responsibilities
of the Board and provides that the Board shall
delegate responsibility for the day-to-day operations
and administration of the Company to the Chief
Executive Officer.
The responsibilities of the Board, which are reserved
for the Board and not delegated to management,
include:
š 2YHUVLJKWRIWKHEXVLQHVVDQGDijDLUVRIWKH
Company;
š (VWDEOLVKPHQWRIFRQWURODQGDFFRXQWDELOLW\
systems;
š (VWDEOLVKPHQWZLWKPDQDJHPHQWRIDVWUDWHJLF
direction, supporting strategies and operating
performance objectives;
š $SSRLQWLQJWKH&KLHI([HFXWLYH2ĴFHU&(2DQG
any Executive Director; and
š 5HYLHZLQJDQGUDWLI\LQJV\VWHPVRIULVN
management and internal compliance and control,
codes of conduct and legal compliance.
The Board Charter is available on the Company’s
website.
Companies should disclose the process for
evaluating the performance of senior executives.
The Chief Executive Officer is responsible for
assessing the performance of the key executives
within the Company, in conjunction with the Board.
Executive assessments are conducted annually.
Formal appraisals are conducted at least annually
for other staff and key performance indicators are
set.
Pental Limited 2014 Financial Report | 9 |
For personal use only
CORPORATE
GOVERNANCE
STATEMENT CONTINUED
1.3
Best Practice Recommendation
Comment
Companies should provide the information indicated
in the Guide to reporting on Principle 1 as follows:
A performance evaluation for senior executives
has taken place during the year under the process
disclosed.
− an explanation of any departures from any
Principle 1 recommendation;
− whether a performance evaluation for senior
executives has taken place during the reporting
period under the process disclosed; and
− the board charter should be made publicly
available.
2.
Structure the board to add value
2.1
A majority of the board should be independent
directors.
The names and details of Directors in office at
the date of this Annual Report, including skills,
experience, term of office and expertise, are included
in the Directors’ Report Section of this Annual Report.
Directors of Pental are considered to be independent
when they are independent of management and
free from any business or other relationship that
could materially interfere with the exercise of their
independent judgment. The following Directors are
considered to be Independent: Mr Peter Robinson,
Mr John Rishworth, Mr John Etherington and Mr Mel
Sutton. Mr Alan Johnstone is not considered to be
independent as he is a substantial shareholder of
the Company. At the date of this report and during
the period a majority of directors were independent
directors.
Directors are able to seek independent professional
advice at the expense of the Company with the
permission of the Chairman.
2.2
The chairperson should be an independent director.
The Chairperson is an independent director.
2.3
The roles of chairperson and chief executive officer
should not be exercised by the same individual.
The Chief Executive Officer is not the Chairman.
| 10 | Pental Limited 2014 Financial Report
For personal use only
2.4
2.5
2.6
Best Practice Recommendation
Comment
The board should establish a nomination committee.
The Board has not established a Nominations
Committee. The Board as a whole carries out the
functions of a Nominations Committee, and Pental
believes this is appropriate for a Company of its size
and business. The Board seeks to ensure that it has
an appropriate mix of skills necessary to fulfil its
obligations. During the period the Board appointed
Mr Mel Sutton as an independent director. His skills
and background are set out in the Directors Report
section of this Annual Report.
In line with the Board’s view on gender diversity, the
Board does not believe it is appropriate to appoint
a director on the basis of gender alone, and new
director appointments will be made on the basis
of the skill sets required at that time regardless of
gender.
Companies should disclose the process for
evaluating the performance of the Board, its
committees and individual directors.
During the previous period the Board used a
third party firm to carry out an assessment of
the Board skill sets and come up with a series of
recommendations regarding the future composition
of the Board. The Board used this review in
appointing Mr Mel Sutton as an independent director.
His skills and background are set out in the Directors
Report section of this Annual Report.
The Board did not consider it necessary to carry out
a further evaluation of the performance of the Board
during the year.
Provide the information indicated in
Guide to Reporting on Principle 2.
This information is detailed above.
Pental’s firelighter
brands, Jiffy & Little
Lucifer, have been
lighting Australian
fireplaces and BBQs
for over 40 years.
Pental Limited 2014 Financial Report | 11 |
For personal use only
CORPORATE
GOVERNANCE
STATEMENT CONTINUED
Best Practice Recommendation
3.
Promote ethical and responsible decision-making
3.1
Establish a code of conduct and disclose the code
or a summary of the code as to:
(a) the practices necessary to maintain confidence
in the company’s integrity;
Comment
The Company has a formal Code of Conduct, which
applies to all Pental directors, employees, and
contractors. A summary of this policy is available
on the Company website within the Corporate
Governance Section.
(b) the practices necessary to take into account their
legal obligations and the reasonable expectations The Company’s Corporate Governance Section
includes the Securities Trading Policy, which
of their stakeholders; and
regulates dealings by directors, officers and
(c) the responsibility and accountability of
employees in securities issued by the Company.
individuals for reporting and investigating
reports of unethical practices.
3.2
Companies should disclose in each annual report the
measurable objectives for achieving gender diversity.
The Company does not have a specific policy or
measurable objectives for achieving gender diversity.
The Board believes the existing Code of Conduct
anti-discrimination provisions provides for this.
The Company does not believe it is appropriate to
establish a quota system for measuring gender
diversity, and indeed such a quota system could itself
lead to discrimination.
The Company has instead required management to
monitor gender diversity in line with the Corporate
Governance Council Recommendations and intends
to take appropriate action should it be of the view
that there is insufficient gender diversity within the
business.
3.3
Companies should disclose in each annual report
the proportion of women employees in the whole
organisation, women in senior executive positions
and women on the board.
As at 29 June 2014, there were 30 women employed
representing 21% of total employees. There were no
women on the Board of Directors nor as part of the
executive team.
3.4
Provide the information indicated in
Guide to Reporting on Principle 3.
This information is detailed above.
White King celebrates
60 years in 2014.
| 12 | Pental Limited 2014 Financial Report
For personal use only
Best Practice Recommendation
Comment
4.
Safeguard integrity in financial reporting
4.1
The board should establish an audit committee.
The Board has established an Audit Committee.
4.2
Structure the audit committee so that it:
The Audit Committee consisted of four members, all
of whom were independent directors.
(a) consists only of non-executive directors;
(b) consists of a majority of independent directors;
(c) is chaired by an independent chairperson, who is
not chair of the board; and
(d) has at least three members.
The Chair of the Committee was and is not the Chair
of the Board during the period.
The names of the members of the Committee, and
details of the number of meetings held during the
period, are contained in the Directors’ Report.
4.3
The audit committee should have a formal charter.
The Audit Committee operates under a Charter
which is available on the Company website within
the Corporate Governance Section.
4.4
Provide the information indicated in
Guide to Reporting on Principle 4.
This information is detailed above.
5.
Make timely and balanced disclosure
5.1
Establish written policies and procedures designed
to ensure compliance with ASX Listing Rule
disclosure requirements and to ensure accountability
at a senior executive level for that compliance
and disclose those policies or a summary of those
policies.
The Company has in place a Continuous Disclosure
Policy, which has been implemented across the
Company. The Policy is available on the Corporate
Governance section of the Company website.
5.2
Provide the information indicated in
Guide to Reporting on Principle 5.
This information is detailed above.
6.
Respect the rights of shareholders
6.1
Design a communications policy for promoting
effective communication with shareholders and
encouraging their participation at general meetings
and disclose their policy or a summary of that policy.
The Company has in place a Shareholder
Communication Policy, which promotes effective
communication with shareholders. The Policy is
available on the Corporate Governance section of the
Company website
6.2
Provide the information indicated in the
Guide to reporting on Principle 6.
This information is detailed above.
Pental Limited 2014 Financial Report | 13 |
For personal use only
CORPORATE
GOVERNANCE
STATEMENT CONTINUED
Best Practice Recommendation
7.
Recognise and manage risk
7.1
Establish policies for the oversight and management
of material business risks and disclose a summary
of those policies.
Comment
During the year, the Company operated a risk
management and internal control framework that
can be described as follows:
š )LQDQFLDOUHSRUWLQJDFWXDOUHVXOWVDUHUHJXODUO\
reported against budget and revised forecasts for
the year are prepared regularly.
š 7KH&RPSDQ\UHSRUWVWRVKDUHKROGHUVKDOI\HDUO\
Procedures are also in place to ensure that
price-sensitive information is reported to the ASX
in accordance with the Continuous Disclosure
requirements of the ASX Listing Rules and the
Corporation Act 2001.
š 7KH&KLHI([HFXWLYH2ĴFHUDQG&KLHI)LQDQFLDO
Officer (or an appropriate representative, if the
positions were vacant) have signed a statement
to the Board for the full and half year financial
reports confirming:
o the Company’s financial reports present a true
and fair view, in all material respects of the
Company’s financial condition and operational
results and are in accordance with relevant
accounting standards;
o the Statement given above is founded on a
sound system of risk management and internal
compliance and control which implements the
policies adopted by the Board; and
o the statement given above is founded on a
sound system of risk management and an
internal compliance and control system is
operating efficiently in all material respects.
During the year the Board established a Strategy
Committee, the purpose of which includes
overseeing the Strategic Planning function and
implementation of strategy including risk mitigation.
White King’s Stain
Lift Stain Remover
trigger has seen a
33% increase in sales.
Source AZTEC Data, moving annual total to 24/08/2014.
| 14 | Pental Limited 2014 Financial Report
For personal use only
Best Practice Recommendation
Comment
7.2
The board should require management to design and
implement the risk management and internal control
system to manage the company’s material business
risks and report to it on whether those risks are
being managed effectively. The board should
disclose that management has reported to it as to
the effectiveness of the company’s management of
its material business risks.
During the year the Audit Committee has overseen a
refresh of the Company’s risk management process
and has ensured management has implemented
appropriate internal controls or strategies to mitigate
the business risk. Management has reported to the
Board on key risks associated with the Company’s
business, and management’s response in mitigating
those risks. Key risks is a standing item on Board
meeting agendas, and management reports on
whether risk is being effectively managed.
7.3
The board should disclose whether it has
received assurance from the Chief Executive
Officer (or equivalent) and the Chief Financial
Officer (or equivalent) that the declaration
provided in accordance with section 295A of the
Corporations Act is founded on a sound system
of risk management and internal control and that
the system is operating effectively in all material
respects in relation to financial reporting risks.
The Board has obtained the relevant assurance
from management.
7.4
Provide the information indicated in
Guide to Reporting on Principle 7.
This information is detailed above.
8.
Remunerate fairly and responsibly
8.1
The board should establish a remuneration
committee.
The Board has established a Remuneration Committee.
The Remuneration Committee operates under a
Charter, which is available on the Company’s website.
Memberships of the Committee, and details of
meetings held during the period, are contained in the
Directors’ Report section.
of shareholders, and shareholders alone, to remove directors from office.
Pental Limited 2014 Financial Report | 15 |
For personal use only
For personal use only
DIRECTORS’
REPORT
The directors of Pental Limited submit herewith the annual financial report of the company for the year (52 weeks)
ended 29 June 2014. In order to comply with the provisions of the Corporations Act 2001, the directors report as follows:
INFORMATION ABOUT THE DIRECTORS
The names and particulars of the directors of the company during or since the end of the financial year are:
Name and Qualifications
Experience and Responsibilities
Mr Peter Robinson B.Eco (Mon)
Non-Executive Independent Chairman
Mr Alan Johnstone
Mr John Rishworth
Peter has a wealth of experience in the manufacturing sector within Australia
and internationally. He was the Chief Executive of ACI Packaging Group and Vice
President of Owens-Illinois Inc, the parent company of ACI Packaging Group.
Previous roles include Chief Operating Officer and Director of BTR Nylex Limited,
and General Manager of Bowater Scott, where he held substantial marketing roles.
Appointed Director on 29 November 2002.
Appointed Chairman on 5 March 2009.
Member of the Audit Committee, Member of the Strategy Committee and
Chairman of Remuneration Committee.
Non-Executive Director
Alan has extensive experience in retailing and is the founder and Chairman
of the Penfold Motors Group which is one of the largest car retailers in Victoria.
Appointed Director 3 September 2003.
Member of Remuneration Committee.
Non-Executive Independent Director
John has worked in the Fast Moving Consumer Goods sector for over 30 years.
He held significant senior positions within Woolworths before founding his own
successful retail brokerage business in 1987. Since selling that business he has
taken on a number of consultancy assignments within the retail sector.
Appointed Director 8 September 2004.
Member of Audit Committee, Member of Remuneration Committee and Member
of Strategy Committee.
Mr John Etherington B.Ec, FCA, FAICD Non-Executive Independent Director
John is a former senior partner of Deloitte, where he held both senior leadership
positions and provided audit and advisory services to public, private and not
for profit organisations, with a particular specialisation on rapidly growing
Australian listed entities. He is also currently a non-executive director on a range
of public and private organisations.
Appointed Director 2 April 2013.
Chairman of Audit Committee and Member of Remuneration Committee.
Pental Limited 2014 Financial Report | 17 |
For personal use only
DIRECTORS’
REPORT CONTINUED
Name and Qualifications
Experience and Responsibilities
Mr Mel Sutton
Non-Executive Independent Director
Mel Sutton has extensive experience and a diverse background across a number
of key sectors, including food – production, wholesale and retail; facility services;
apparel and footwear - wholesale and retail; consumer goods – beverage; and
Sporting goods – wholesale and retail. Mel was CEO and a Managing Director of
Nike Pacific, Globe International, Colorado Group and a Divisional Chief Executive
of George Weston Foods Limited and Spotless Group. Previous roles also include
senior executive positions with Lion Nathan and Fosters. Mel is currently the
Director of Strategy at Lion – Dairy & Drink based in Melbourne.
Appointed Director 3 October 2013.
Chairman of Strategy Committee and Member of Audit Committee.
The above named directors held office during the whole of the financial year and since the end of the financial year,
except Mel Sutton who was appointed on 3 October 2013.
Any directorships of other listed companies held by directors in the 3 years immediately before the end of the financial
year are indicated above under “experience and responsibilities”.
| 18 | Pental Limited 2014 Financial Report
Basic earnings per share
For personal use only
increased
41.67%
DIRECTORS’ SHAREHOLDINGS
The following table sets out each director’s relevant interest in shares, debentures, and rights or options in shares or
debentures of the company or a related body corporate as at the date of this report.
Directors
Fully paid ordinary shares
Number
Share options
Number
Peter Robinson
49,661,570
9,932,314
Alan Johnstone
374,037,176
73,698,530
John Rishworth
165,080
33,016
John Etherington
–
–
Mel Sutton
–
–
Share options granted to directors and senior management
During and since the end of the financial year, no share options were granted to directors or senior management.
On 15 November 2013 the Company issued a Piggy Back Options Prospectus to encourage Loyalty Option holders
to exercise their Loyalty Options early. Loyalty Options holders which included Directors that exercised their right
by 29 November 2013 to acquire one fully paid ordinary share were granted one $0.03 (Piggy Back) call option.
COMPANY SECRETARY
Name & Qualifications
Experience and Responsibilities
Mr Oliver Carton B Juris LL.B
Company Secretary
Oliver is a qualified lawyer with over 26 years’ experience in a variety of
corporate roles. He currently runs his own consulting business, and was
previously a Director of the Chartered Accounting firm KPMG where he
managed its Corporate Secretarial Group. Prior to that, he was a senior legal
officer with ASIC.
Oliver is an experienced company secretary and is currently company secretary
of a number of listed and unlisted companies, ranging from Pental Limited to
the not for profit Melbourne Symphony Orchestra Pty Ltd.
PRINCIPAL ACTIVITIES
The principal activities of the Group during the course of the financial year were the manufacturing and distribution of
personal care and home products.
Pental Limited 2014 Financial Report | 19 |
For personal use only
DIRECTORS’
REPORT CONTINUED
REVIEW OF OPERATIONS
Key Strategic Achievements
š 5HORFDWLRQDQGXSJUDGHRIEOHDFKSODQWVWDJHV
& 2) completed, with plant efficiency progressively
improving (alas slower than initially anticipated),
supported by a reinvigorated continuous
improvement/lean manufacturing program
throughout the Shepparton manufacturing facility
š &HPHQWHGRXUSRVLWLRQDV1RVXSSOLHURIOLTXLG
bleach with the White King brand and in private label
š 1HZSDFNDJLQJODXQFKHGUHLQIRUFLQJWKH
“Australia Made and Owned” credentials for
all our brand products
š 9HOYHWVRDSVXFFHVVIXOO\UHSRVLWLRQHGDVDEHDXW\EDU
š /HDGHUVKLSWHDPHQKDQFHGLQUHVHDUFKDQG
development, procurement/supply chain and private
label account management, and the former CEO role
held by Alan Fisher absorbed within the existing
management team, led by Charlie McLeish as the
new CEO from 1 January 2014
š 1RUPDOLVHGDQGVWUHQJWKHQHG%DODQFH6KHHW
following the significant restructure of the Group
in the prior year
š %RDUG6WUDWHJ\&RPPLWWHHIRUPHGWRRYHUVHH
strategic planning and a structured pursuit of
any strategic growth opportunities
š 5HVHDUFKDQGGHYHORSPHQWZRUNIRUQHZKLJK
speed liquid line completed and to be installed
during 2015 financial year
š 7KHFORVXUHRIWKH6SHFLDOLW\&KHPLFDOVEXVLQHVV
(discontinued operations) has been completed,
including clearance of any environmental matters
Brand and Private label sales mix – Financial Year 2014
Private Label
14.9%
Personal Care
17.9%
Personal Care
Laundry Care
Fire Needs
Household Cleaning
Country Life
Velvet
Pears
Knights Castle
Natural
Pental
Dishwasher
8.3%
Sunlight
Laundry Care
11.4%
Household
Cleaning
40.0%
White King
Janola
Softly
Lux
Martha’s
Sureguard
Huggie
Oral Care
1.6%
Aim
| 20 | Pental Limited 2014 Financial Report
Fire Needs
5.8%
Little Lucifer
Jiffy
For personal use only
Key Financial Outcomes
Consolidated net profit after tax for the year (52 weeks) ended 29 June 2014 was $5.336 million (2013: $1.893 million).
FY 14 (i)
$’000
FY 13 (i)
$’000
Change
$’000
109,376
107,891
1,485
+1.38%
9,690
9,618
72
+0.75%
8.9%
8.9%
(1,793)
(1,069)
(724)
7,897
8.549
(652)
7.2%
7.9%
5,336
1,893
0.34
0.24
18,568
19,192
(624)
-3.25%
Net Cash/(Debt)
25
(8,212)
(8,237)
+100%
Gearing
0%
13.2%
Gross Sales (ii)
Underlying EBITDA
(ii)
EBITDA to gross sales
Depreciation & Amortisation
(ii)
Underlying EBIT (i)
EBIT to gross sales
Profit after Tax
Basic EPS (cents)
(ii)
Working Capital (iii)
(iv)
%
–
-7.63%
-0.7%
3,443
+100%
+41.67%
+100%
(i) Unaudited non-IFRS financial table.
(ii) Continuing operations.
(iii) Receivables plus inventory less trade and other payables.
(iv) Net debt to equity.
š *URVVVDOHVRIPLOOLRQZHUHXSE\
on last year, with the main focus on maintaining/
growing acceptable margins rather than participating
in aggressive price reduction campaigns for the sake
of higher sales growth
š 8QGHUO\LQJ(%,7'$FRQWLQXLQJRSHUDWLRQVRI
million, marginally (0.75%) above last year, after
absorbing:
− rental expense of $0.786 million following the sale
and leaseback of the Shepparton properties and
relocation of the corporate office that occurred on
30 June 2013;
− the increased cost of raw materials that could not
be recovered through price increases;
− additional temporary resources ($0.307 million –
one off cost) required to bed down the relocated/
upgraded bleach plant (that was more challenging
than originally foreseen), whilst also phasing in
production of the new private label bleach business
which commenced February 2014; and.
− one off costs of $0.225 million incurred from
outsourcing some of the bleach manufacturing
during the relocation/upgrade of the bleach plant,
to ensure that customer delivery targets were
achieved.
š (%,7ZDVGRZQRQODVW\HDUPDLQO\GXHWRWKH
increase in depreciation arising from new capital
investment, in particular the relocated and upgraded
bleach plant
š )LQDQFHFRVWVGHFUHDVHGE\PLOOLRQWR
million, which included the exit costs of $0.150
million to terminate the GE receivable finance facility,
previously imposed on the Group by its banker
š 1HWSURıWDIWHUWD[LQFUHDVHGE\PLOOLRQWR
$5.336 million
š 5HLQVWDWHPHQWRILQWHULPDQGıQDOGLYLGHQG
payments, commencing with a fully franked full year
dividend of 0.12 cents per ordinary share, payable to
shareholders on 30 September 2014, with a record
date of 12 September 2014.
š %DVLFFRQWLQXLQJRSHUDWLRQVHDUQLQJVSHUVKDUHRI
0.34 cents (2013: 0.24 cents)
š 1HZQRUPDOLVHGDQGFRPSHWLWLYHEDQNLQJ
arrangement, following a difficult restructure of the
Group which commenced in the prior year
š ,PSURYHGZRUNLQJFDSLWDOSRVLWLRQRIPLOOLRQ
mainly due to reduction in inventory
š 1HWFDVKSRVLWLRQRIPLOOLRQDQGLQDıW
position for further capital investment - focused on
maximising growth opportunities and reducing costs
Pental Limited 2014 Financial Report | 21 |
For personal use only
DIRECTORS’
REPORT CONTINUED
š &ORVH8SEUDQGDQGWUDGHPDUNIRU6XQOLJKWIRUWKH
Pacific Islands only) which did not form part of the
long term brand strategy was sold for $0.600 million,
resulting in a profit on sale of $0.401 million
š 7KHHDUO\H[HUFLVHRIWKH/R\DOW\2SWLRQVUDLVHG
$5.705 million (net of costs and tax), with Piggy Back
options issued to Loyalty option holders who had
exercised early
FY 14 (i)
$’000
FY 13 (i)
$’000
% Change
9,690
9,618
0.7%
(1,793)
(1,069)
67.7%
7,897
8,549
-7.6%
(960)
(4,335)
-77.9%
6,937
4,214
+100%
Brand name impairment
–
(357)
Brand name impairment write back
–
500
Deferred and current year borrowing costs – written off
–
(1,328)
Loss on sale of Shepparton properties (marketing and legal costs)
–
(67)
Impairment of property plant and equipment
–
(103)
Rectifications work – on sale of Shepparton properties
–
(100)
401
–
7,338
2,759
Underlying EBITDA
Depreciation and amortisation
Underlying EBIT
Finance costs excluding one off borrowing costs
Underlying Net Profit Before Tax – Continuing Operations
One off/Significant items:
Profit on sale of Close Up brand name
Net Profit Before Tax – Continuing Operations
(i) Unaudited non-IFRS financial table.
Cash generation and capital management
A solid operating cash flow of $6.991 million and the
capital raising (net of cost and tax) of $5.705 million
(through the issuance of Piggy Back Options to Loyalty
Option holders who had exercised their Loyalty Options
early), covered capital expenditure of $5.015 million and
returned Pental to a net cash position of $0.025 million
at 29 June 2014. The debt free position now places
the business in a healthy situation to invest in the high
speed liquid line (as detailed in the 14 November 2013
Piggy back Options Prospectus) and in other projects for
future growth and cost reduction opportunities.
| 22 | Pental Limited 2014 Financial Report
With the much improved financial position, on 25
February 2014, following a competitive tender, the
Company entered into a new three year banking
arrangement with its principal banker, ANZ. This
allowed the business to consolidate its funding facilities
to one provider at a more competitive interest rate, with
normalised terms and conditions, and removed any
restrictions on future dividend payments and capital
investment. The multi option facility is for $16 million.
The Receivable Finance Facility with GE Capital was
discontinued.
Net working capital (receivables, inventories less trade
and other payables) of $18.568 million, was $0.624
million better than last year predominately from the
improved inventory management driven by a reinvigorated Sales and Operational Planning (S&OP)
working group.
For personal use only
Investing in the re-invigoration of iconic brands,
whilst building private label
Through the work undertaken during the year, Pental’s
brands continue to hold solid market positions:
Product innovation continues to be the cornerstone
of maintaining and growing the business with sales
focused on generating sustainable margins in both
brand and private label products. While sales were
1.38% up on last year, supported by favourable
exchange rate between Australia/New Zealand, gross
margins increased from 34.08% to 34.34% through
launch of new products, improved sourcing of raw
materials (offsetting increases in some raw materials,
such as tallow, sustainable vegetable palm noodles
and bottle prices) and by focusing on maintaining/
growing acceptable margins rather than participating
in aggressive price reduction campaigns for the sake of
higher sales growth.
š :KLWH.LQJKDVDVWURQJ$XVWUDOLDQPDUNHWSRVLWLRQ
of a 79% share of the retail liquid bleach market plus
Pental supplies Woolworths, Coles and Aldi private
label bleach;
Trading terms and promotional spend (i.e. sale rebates
and discounts) decreased from 26.27% to 26.18%,
through improved return on investment management,
however the pressure to increase promotional
allowances and fully fund promotional activities from
major retail customers continues to apply, and this is
unlikely to subside. Management of these activities is
a critical element of the business and during the year
Pental invested in a new sales forecast and promotional
management system, to sharpen the business
processes and disciplines of continuing to ensure sales
growth is underpinned by sustainable margins.
With the business winning a number of new private
label tenders on the back of the upgraded bleach
plant, the 2014 marketing strategy focused around
reinvigorating and strengthening the foundations of
Pental’s key heritage brands for future development and
growth. Marketing costs of $3.162 million, representing
3.50% of branded sales, was marginally up on last
year’s investment of 3.29% of branded sales.
Most of our major brands, including White King, Velvet,
Softly and Country Life have had a packaging revamp
to modernise their appeal and maintain their relevance.
On the back of these packaging revamps, our Australian
made and owned credentials were embodied on all key
brand products. Pental also invested in research and
strategic planning for the majority of our brands to lay
the foundation for sustained growth over the coming
years. Many brands are taking a fresh new direction in
our three year strategic plan, with some brands moving
into higher-growth categories and others moving into
different segments in order to effectively compete in
the market, without competing against each other in the
same category.
š -DQRODDOVRKDVDVWURQJ1HZ=HDODQGPDUNHW
position of 63% of the retail liquid bleach market;
š :KLWH.LQJPDLQWDLQHGDKHDOWK\PDUNHWLQWKH
manual toilet cleaners category - ranked as No. 2;
š 6XQOLJKWGLVKZDVKLQJOLTXLGFRQWLQXHVWRKROGD
market share in New Zealand dishwashing segment;
š 6RIWO\DQG0DUWKD*DUGHQHUKDYHDVKDUHRIWKH
retail wool wash category – ranked as No 1 and 3;
and
š &XEH)LUHOLJKWHUV/LWWOH/XFLIHU-Lij\DQGSULYDWH
label) have a 62% market share in the major grocery
channel.
As part of the ongoing review of brand leverage and
future growth opportunities, the Close-Up brand and
trademark for Sunlight (for the Pacific Islands only) was
disposed of for $0.600 million, resulting in a profit on
sale of brands of $0.401 million.
The marketing investment in the coming year will
build on this foundation and focus on innovation and
marketing communications based on the research and
strategies now in place. A communication plan has been
put into place to build awareness, encourage trial of
our products amongst newer, younger consumers and
create emotional relationships with our brands.
The 2014 marketing
strategy focused
around reinvigorating
and strengthening the
foundations of key
heritage brands for
future development
and growth
Pental Limited 2014 Financial Report | 23 |
For personal use only
DIRECTORS’
REPORT CONTINUED
New product development
Manufacturing and planning efficiency
Stemming from the research and strategic planning
conducted over the prior years, several products were
launched into the Australian and NZ markets which
embody the re-positioning and new direction of some of
our brands.
Following the investment to relocate and upgrade the
bleach plant, which commenced during 2013 financial
year, the key focus during the financial year was to
complete the installation of the new case packer (to
enable expansion into private label) and to improve the
efficiency of the bleach plant. Although the projected
plant efficiency was not achieved from the outset, as
it took longer than expected to calibrate the new case
packer (installed in January 2014) and to normalise
production throughputs for the new bleach private label
ranges, the plant continues to progressively improve.
However these interruptions had caused the need for
additional temporary resources which are not expected
to reoccur.
White King’s focus on leveraging the growth of Toilet
and Household Cleaning categories has led to the
launch of the White King Bleach & Blue Power Blocks
for the cistern. Over the past two years, White King
has not played in the largest segment within the Toilet
category (known as “in-the-bowl”), and this has now
been rectified with the launch of the White King 4-in-1
Power Hanger.
To drive category value growth and mitigate the
seasonality of firelighters, Pental also launched the
Little Lucifer “individually wrapped wax firelighters”.
This format has led overseas markets for years and
is now available in Australia, exclusively from Pental.
The format suits BBQs, hikers and campers, as well as
core fireplace users to bring new consumers into the
category and to encourage current users to trade up for
a higher value product.
During the relocation and integration of bleach
manufacturing into the Shepparton site, the business
also initiated the review of its manufacturing processes
utilising continuous improvement/lean manufacturing
principles. This has allowed for and will enable many
processes to be streamlined and lead to further
improvements in productivity and cost reductions over
the coming years.
Velvet has also been repositioned as a range of beauty
bars. In line with this new strategy, we have launched
the Velvet Moisturising Bar to provide consumers with
affordable beauty.
The launch of Little Lucifer “individually wrapped
wax firelighters” during the financial year also saw
Pental invest in new plant and equipment to efficiently
distribute this product exclusively to the Australian
market alongside its cube firelighter range.
The new product development pipeline for the coming
years is also reflective of the strategies put into place
for each brand over the past year.
These front end manufacturing initiatives were
supported by the business upgrading its Enterprise
Resource Planning (ERP) systems and implementing
a new sales/ trade spend planning/forecast system
in late June 2014. This will provide the foundation
to streamline many processes leading to further
improvements in productivity, alignment of raw material
and packaging procurement (with supplier demand and
planned promotional activity), and providing extra value
to our customers with more effective investment of
promotional funds/rebates.
The next phases of the manufacturing/sourcing strategy
will be the installation of a new high speed liquid line
(to be installed during 2015 financial year), which
will enable Pental to compete in a number of new
categories for both brand and private label products;
and modernise and consolidate its soap manufacturing
processes.
| 24 | Pental Limited 2014 Financial Report
For personal use only
Procurement and supply chain efficiency
Business strategy and operational risks
Coupled with investing in manufacturing efficiency,
procurement and supply chain improvements remain
the centre of attention. During the financial year
Pental continued to trial and approve suppliers of raw
materials to mitigate supply risks and to deliver the
lowest cost position for the business. This included
engaging both local and overseas manufacturers
to ensure Pental is benchmarking products both in
Australia and globally. For example, Pental’s Australian
Made soap is now produced from either tallow or
sustainable palm based raw materials, depending
on customer needs and the most cost effective raw
material price. This ensures Pental remains at the
forefront of providing a quality product at a competitive
price.
Pental’s vision is to be a leading supplier of shelf
stable (non-food) products to its chosen markets built
around a reputation of delivering quality, innovation
and sustainability to the satisfaction of customer needs
whilst enhancing shareholder value.
To improve margins and offset supplier cost pressures,
Pental will continue work with suppliers who can
provide new innovation and product development
to support our brands and category growth plans.
Simultaneously, the cost of outsourced production,
co-packing and other raw materials (such as perfumes,
bottles, triggers and caps) continue to be vigorously
reviewed via a tender process and/or are being
considered to be manufactured in-house supported by
capital investment.
From a supply chain perspective, following the
successful consolidation to one central distribution
platform in Shepparton in the prior year, the planned
savings have been embedded in the business which
saw freight and distribution expenses improve from
8.41% to 8.04% of gross sales. Following this successful
initiative, a business review has been initiated to focus
on outbound interstate freight consolidation to deliver
freight savings and improve delivery lead times into our
customers.
A key attribute for future growth is supplier versatility
and Pental will continue to work with suppliers who
provide shorter lead times to market and support
changing market conditions.
Pental’s strategy to deliver the vision (which remains
unchanged and on course) focuses on:
š ,QYHVWLQJLQEUDQGVXSSRUWDQGIXUWKHUGHYHORSLQJ
customer channel plans;
š &RQWLQXLQJWREXLOGLWVQHZSURGXFWSLSHOLQHVDQG
launching new products to the market;
š *URZLQJWKHSULYDWHODEHOEXVLQHVV
š ,QYHVWLQJLQLWVPDQXIDFWXULQJFDSDELOLW\WRPDLQWDLQ
and improve efficiency of the current products
manufactured and for future growth opportunities,
where importation of the product is not cost effective
and/or not aligned with its Australia made, Australia
owned market positioning;
š ,QYHVWLQJLQSODQQLQJDQGUHSRUWLQJV\VWHPVLQNH\
areas of trade spend, freight and manufacturing; and
š 3URDFWLYHO\VHDUFKLQJIRUQHZGLVWULEXWRUVKLSVDQG
acquisitions that will complement Pental’s product
range/expertise and scope to leverage the company’s
infrastructure, and/or provide the ability to expand
into new channels.
The next phase of
the manufacturing
strategy will be the
installation of a new
high speed liquid line,
enabling Pental to
compete in existing
and new categories
Pental Limited 2014 Financial Report | 25 |
For personal use only
DIRECTORS’
REPORT CONTINUED
To deliver this strategy, Pental believes a
strong company culture with highly engaged
employees through training and development
of high achievers, and establishment of
a culture of continuous improvement are
critical organisational enablers, supported by
its core values of:
CUSTOMER
The key to
our success
SAFETY
PEOPLE
Must always
come first
A focus on what
matters most
CORE
VALUES
FAIRNESS
Integrity and
consistency
There are a number of operational risks, both specific
to Pental and of a general nature, which may impact the
future operating and financial performance of the Group.
There can be no guarantee that Pental will achieve
its objectives or that forward looking statements will
be realised. The operating and financial performance
is influenced by a variety of general economic and
business conditions including levels of consumer
spending, inflation, interest and exchange rates, and
certain raw material prices such as tallow and/or
sustainable palm noodles used in some soap products
and price of resin affecting the cost of bottles. The
specific material business risks faced by the Group and
how the Group manages these risks are set out below:
š Competition: the majority of Pental’s products are
sold in supermarkets in Australia and New Zealand
which are dominated by two major participants in
Australia. These retailers have been aggressively
reviewing their product mix and also implementing
a move towards own or private label products. This
has the potential to lead to delisting of Pental’s
products by one or both of those retailers which
could cause a significant drop in sales of any product
delisted. The two major participants have also been
engaging in an aggressive campaign for market
| 26 | Pental Limited 2014 Financial Report
QUALITY
Is everything
we do
share, primarily through product price reductions.
This has made it difficult for Pental to pass on price
rises, despite rising production costs, thus impacting
margins. This situation is not expected to change
in the short to medium term. Pental believes it
can continue to successfully operate in the Fast
Moving Consumer Goods (FMCG) market through
strong product innovation and managing its product
sourcing and manufacturing costs;
š Product sourcing: Pental relies on a range of parties
for its product sourcing strategy. Any change in
existing relationships (including the termination
of any key supply arrangements) or any change in
terms or conditions of overseas/local suppliers and
any change in the political or economic environment
may lead to material adverse changes to Pental’s
operational and financial performance. Pental is
continually refining its sourcing arrangements and
has in many instances dual sourcing arrangements
that facilitates in reducing this risk;
š Supply chain: Pental has established an extensive
and reliable supply chain that allows it to procure
and deliver products to customers in a timely and
efficient manner. Disruption to any aspect of this
For personal use only
supply chain could have a material adverse impact
on Pental’s operational and financial performance.
Pental’s ongoing review of supply chain costs and the
corresponding change of supply chain arrangements
with minimal disruption, shows that Pental is able to
effectively manage this risk;
š Loss of key personnel: Pental’s future success
depends to a significant extent on the retention of
key personnel, in particular its management team.
These individuals have extensive experience in,
and knowledge of the market Pental operates in
and Pental’s business. The loss of key personnel
and the time taken to recruit suitable replacements
or additional personnel could adversely affect the
Company’s future financial performance. The Board
has reviewed the organisational structure of the
business and will continue to do so to ensure the best
people are retained, whilst investing in developing
other key people in the business; and
š Damage to Pental’s brands: the reputation and value
associated with Pental’s brand names could be
adversely impacted by a number of factors including
failure to provide customers with the quality of
products they expect, disputes with third parties
such as suppliers or customers or adverse media
coverage. Significant erosion in the reputation of,
or value associated with, Pental’s brands could
have an adverse effect on Pental’s future financial
performance. Pental believes that its processes and
systems, and pro-active tracking and management of
any disputes minimises this risk.
Outlook
The outlook for the Group is contained in the Chairman’s
report.
Health and Safety
The Group is committed to the health and safety of
all its employees. It believes that all incidents are
preventable. There is a continuing commitment to
identify and eliminate risks with the prime objective
being to prevent injuries from occurring. The Group’s
core value of “safety must always come first” has been
set at the top of the organisation and is reinforced
through commitment of resources at its Shepparton
manufacturing and distribution site.
CHANGES IN THE STATE OF AFFAIRS
During the financial year there were no significant
changes in the state of affairs of the Group, other than
as referred to in this Annual Report.
FUTURE DEVELOPMENTS
Information regarding likely developments in the
operations of the Group in future financial years is set
out in the Review of operations and elsewhere in the
Annual Report.
Subsequent events
There has not been any matter or circumstance
occurring subsequent to the end of financial year that
has significantly affected, or may affect, the operations
of the Group, the results of those operations, or the state
of affairs of the Group in future financial years, except
for:
Dividends
In respect of the year (52 weeks) ended 29 June 2014
the Company will pay a full year fully franked dividend of
0.12 cents per ordinary share, payable to shareholders
on 30 September 2014, with a record date of 12
September 2014.
ENVIRONMENTAL REGULATIONS
The Shepparton manufacturing site is subject to various
pieces of environmental legislation. Licences and
Agreements relevant to the environmental performance
of its operations are currently held with Goulbourn
Valley Water and the Environment Protection Authority
(EPA).
In conjunction with the sale of the Shepparton site in
the prior financial year, an environmental audit was
conducted on the underground storage units (UST)
which highlighted potential contamination; however
further testing was required once the UST/lines were
removed. Following the removal of the unused UST
during the financial year, an independent assessment
of the site on 16 April 2014 concluded that the site was
suitable for continued commercial / industrial land use
and no further remedial work was required.
Furthermore, on 29 January 2014, the Pollution
Abatement Notice (PAN) issued in January 2013, was
revoked by the Environmental Protection Authority (EPA)
following the EPA’s appointed auditor recommendation
that no further work or remedial action be required
to be undertaken by the Company on its former Port
Melbourne site.
Environmental performance is reported to the Site
Management Group and to the Board as required.
All environmental aspects of the Shepparton
manufacturing site were in line with the license
requirements.
Pental Limited 2014 Financial Report | 27 |
For personal use only
For personal use only
SHARES UNDER OPTION
OR ISSUED ON EXERCISE OF OPTIONS
INDEMNIFICATION OF OFFICERS
AND AUDITORS
There were no unissued shares under options as at the
date of this report.
During the financial year, the company paid a premium
in respect of a contract insuring the directors of the
company (as named above), the company secretary,
Oliver Carton, and all executive officers of the company
and of any related body corporate against a liability
incurred as such a director, secretary or executive
officer to the extent permitted by the Corporations Act
2001. The contract of insurance prohibits disclosure
of the nature of the liability and the amount of the
premium.
As at 29 June 2014, the Company had 85,657,987
(2013: 375,181,180) Loyalty Options (ASX code: PTLO)
on issue, exercisable on a 1:1 basis for entitled ordinary
shareholders at an exercise price of $0.02. The Loyalty
Options expire on 11 September 2014 and carry no
rights to dividends and no voting rights. During the
financial year 289,523,193 Loyalty Options were
exercised and as a result 289,523,193 ordinary shares
were issued amounting to $5.791 million.
During the year the Company issued 287,838,746 Piggy
Back Options (ASX code: PTLOA). As at 29 June 2014,
the company also had 287,331,469 Piggy Back Options
on issue exercisable on a 1:1 basis for entitled ordinary
shareholders at an exercise price of $0.03. The Piggy
Back Options expire on 6 June 2015 and carry no rights
to dividends and no voting rights. During the financial
year 507,277 Piggy Back Options were exercised
and as a result 507,277 ordinary shares were issued
amounting to $.015 million.
The company has not otherwise, during or since the end
of the financial year, except to the extent permitted by
law, indemnified or agreed to indemnify an officer or
auditor of the company or of any related body corporate
against a liability incurred as such an officer or auditor.
Softly enjoys 36% of
the total Australian
Grocery market share
of the Woolwash
category, making it
the market leader
by a 10% margin.
Source AZTEC Data, moving annual total to 24/08/2014.
Pental Limited 2014 Financial Report | 29 |
For personal use only
DIRECTORS’
REPORT CONTINUED
REMUNERATION REPORT - AUDITED
This remuneration report details the nature and
amount of remuneration for each director and senior
management personnel of Pental Limited.
The directors and other members of key management
personnel of the Group during the year were:
Peter Robinson
Non-executive Independent Chairman
Alan Johnstone
Non-executive Director
John Rishworth
Non-executive Independent Director
John Etherington Non-executive Independent Director
Mel Sutton
Non-executive Independent Director
Charlie McLeish
Chief Executive Officer
Alan Fisher
Chief Executive Officer
(Resigned on 31 December 2013)
Albert Zago
Chief Financial Officer
Remuneration Policy
The remuneration policy of Pental Limited has been
designed to align director and executive objectives with
shareholder and business objectives by providing a fixed
remuneration component and offering specific short term
and long-term incentives based upon key performance
areas affecting the Group’s financial results. The board
of Pental Limited believes the remuneration policy to be
appropriate and effective in its ability to attract and retain
the best executives and directors to run and manage
the Group, as well as create goal congruence between
directors, executives and shareholders.
The Board’s policy for determining the nature and
amount of remuneration for board members and senior
executives of the Group is as follows:
The remuneration policy, setting the terms and
conditions for the executive directors and other senior
executives, was developed and approved by the board.
Executive packages are reviewed annually by reference
to the Group’s performance, executive performance
and comparable information from industry sectors
and other listed companies in similar industries. The
performance of executives is measured regularly
against agreed criteria and is based predominantly
on the forecast growth of the Group’s profits and
shareholders’ value. All bonuses and incentives are
linked to predetermined operational and financial
performance criteria. Executives are also entitled to
participate in a performance rights plan.
| 30 | Pental Limited 2014 Financial Report
The executive directors and executives receive a
superannuation guarantee contribution required by the
law, and do not receive any other retirement benefits.
Some individuals, however, have chosen to sacrifice
part of their salary to increase payments towards
superannuation.
All remuneration paid to directors and executives
is valued at the cost to the company and expensed.
Shares granted to directors and executives are valued
as the difference between the market price of those
shares and the amount paid by the director or executive.
Options are valued using the Binomial methodology.
The Board policy is to remunerate non-executive
directors at market rates for comparable companies
for time, commitment and responsibilities. The
Board determines payments to the non-executive
directors and reviews their remuneration annually,
based on market practice, duties and accountability.
The maximum aggregate amount of fees that can be
paid to non-executive directors is subject to approval
by shareholders at the annual general meeting. The
maximum aggregate amount of fees that can be paid to
non-executive directors as per last approval is $0.750
million. Fees for non-executive directors are not linked
to the performance of the Group. No shares or options
have been issued to non-executive directors, under the
performance rights plan or the option scheme, within
the last five years.
Key terms of employment contracts
Mr Charlie McLeish is employed by the Group under a
three year contract which was renewed on 1 August
2012. The period of notice required by either party
to terminate the contract is nine months’ notice for
termination without cause. Mr McLeish is entitled to
receive a maximum yearly bonus of thirty five per cent
of his base salary plus superannuation. The Company is
reviewing an executive performance rights plan (Plan)
to provide long term incentives aligned to Company
performance. Mr McLeish will be entitled to participate
in the executive rights Plan.
Mr Albert Zago is employed by the Group under an
ongoing contract which may be terminated on 3 months
notice by either the Company or the executive. Mr Zago
is entitled to receive a maximum yearly bonus of thirty
per cent of his base salary plus superannuation. Mr
Zago will also be entitled to participate in the executive
rights plan.
For personal use only
DIRECTORS’ MEETINGS
The following table sets out the number of directors’ meetings (including meetings of committees of directors)
held during the financial year and the number of meetings attended by each director (while they were a director or
committee member). During the financial year, 11 board, 4 audit committee, 2 remuneration committee and 3 strategy
committee meetings were held.
Board
of Directors
Audit
Committee
Remuneration
Committee
Strategy
Committee
Eligible
to Attend
Attended
Eligible
to Attend
Attended
Eligible
to Attend
Attended
Eligible
to Attend
Attended
Peter Robinson
11
10
4
4
2
2
3
3
Alan Johnstone
11
9
-
-
2
1
-
-
John Rishworth
11
11
4
4
2
2
3
3
John Etherington
11
11
4
4
2
2
-
-
Mel Sutton
9
8
3
1
-
-
3
2
Directors
PROCEEDINGS ON BEHALF
OF THE COMPANY
AUDITOR’S INDEPENDENCE
DECLARATION
No proceedings have been brought against the company.
The auditor’s independence declaration is included on
page 21 of the annual report.
NON-AUDIT SERVICES
Details of amounts paid or payable to the auditor for nonaudit services provided during the year by the auditor
are outlined in note 32 to the financial statements.
The directors are satisfied that the provision of nonaudit services during the year, by the auditor (or by
another person or firm on the auditor’s behalf) is
compatible with the general standard of independence
for auditors imposed by the Corporations Act 2001.
ROUNDING OFF OF AMOUNTS
The company is a company of the kind referred to in
ASIC Class Order 98/0100, dated 10 July 1998, and
in accordance with that Class Order amounts in the
directors’ report and the financial report are rounded
off to the nearest thousand dollars, unless otherwise
indicated.
The directors are of the opinion that the services as
disclosed in note 32 to the financial statements do not
compromise the external auditor’s independence, based
on advice received from the Audit Committee, for the
following reasons:
š DOOQRQDXGLWVHUYLFHVKDYHEHHQUHYLHZHGDQG
approved to ensure that they do not impact the
integrity and objectivity of the auditor, and
š QRQHRIWKHVHUYLFHVXQGHUPLQHWKHJHQHUDO
principles relating to auditor independence as set
out in Code of Conduct APES 110 Code of Ethics for
Professional Accountants issued by the Accounting
Professional & Ethical Standards Board, including
reviewing or auditing the auditor’s own work, acting
in a management or decision-making capacity for
the company, acting as advocate for the company or
jointly sharing economic risks and rewards.
Pental Limited 2014 Financial Report | 31 |
For personal use only
DIRECTORS’
REPORT CONTINUED
Relationship between the remuneration policy and company performance
The remuneration policy has been tailored to increase goal congruence between shareholders and directors and
executives. This has been achieved through a performance based bonus system based on key performance indicators.
The tables below set out summary information about the Group’s earnings and movements in shareholder wealth for
the five years to June 2014. It has been the focus of the Board of Directors to retain management personnel essential
to the profitable operations of the Group, and to attract suitable executives.
29 June
2014 $’000
Gross sales
30 June
2013 $’000
30 June
2012 $’000
30 June
2011 $’000
30 June
2010 $’000
109,376
141,060
191,049
166,099
147,488
Net profit/(loss) before tax from
continuing operations
7,338
739
(66,578)
9,572
12,534
Net profit/(loss) after tax attributable to
members of the parent entity
5,336
1,893
(61,386)
4,758
9,666
29 June
2014
Share price at start of year
30 June
2013
30 June
2012
30 June
2011
30 June
2010
$0.020
$0.075
$0.40
$0.53
$0.46
$0.033
$0.020
$0.075
$0.40
$0.53
-
-
-
1.0
1.0
Final dividend (cents) per share
0.12
-
-
1.5
3.0
Basic earnings (cents) per share
0.34
0.20
(32.16)
3.99
7.55
Diluted earnings (cents) per share
0.33
0.20
(32.16)
3.99
7.55
Share price at end of year
Interim dividend (cents) per share
1
1, 2
1 Franked to 100% at 30% corporate income tax rate.
2 Declared after the balance date and not reflected in the financial statements of that year.
No.1 supplier of Liquid
Bleach to the retail
Market – White King
and Private Label.
| 32 | Pental Limited 2014 Financial Report
For personal use only
The compensation of each member of the key management personnel of the Group
for the current year is set out below:
Short-term employee
benefits
Postemployment
benefits
2014
Salary & Fees
$
Bonus
$
Non-monetary(iii) Superannuation
$
$
Total
$
Non Executive Directors
Peter Robinson
66,779
-
-
33,567
100,346
Alan Johnstone
54,930
-
-
5,081
60,011
John Rishworth
54,930
-
-
5,081
60,011
John Etherington
44,173
-
-
15,408
59,581
Mel Sutton (i)
40,894
-
-
3,783
44,677
261,706
-
-
62,920
324,626
Alan Fisher (ii)
339,766
-
18,944
19,514
378,224
Charlie McLeish
322,541
-
2,876
38,249
363,666
Albert Zago
261,070
-
3,657
22,867
287,594
Total Executives
923,377
-
25,477
80,630
1,029,484
1,185,083
-
25,477
143,550
1,354,110
Total Directors
Executives
Total Remuneration
(i) Mr Sutton commenced on 3 October 2013
(ii) Mr Fisher resigned as the Chief Executive on 31 December 2013, but continued in a consulting capacity until 16 April 2014.
(iii) Non-monetary benefits include novated car lease, car parking & motor vehicle toll tags.
Pental Limited 2014 Financial Report | 33 |
For personal use only
DIRECTORS’
REPORT CONTINUED
The compensation of each member of the key management personnel of the Group for the prior year is set out below:
Short-term employee
benefits
Postemployment
benefits
Bonus
$
Non-monetary
$
Superannuation
$
2013
Salary & Fees
$
Total
$
Non Executive Directors
Peter Robinson
49,746
-
-
23,086
72,832
Alan Johnstone
27,522
-
-
2,477
29,999
John Rishworth
55,045
-
-
4,954
59,999
John Etherington
13,761
-
-
1,238
14,999
146,074
-
-
31,755
177,829
Alan Fisher
403,208
-
21,616
37,325
462,149
Charlie McLeish
267,849
92,750
-
32,197
392,796
Albert Zago
223,501
55,046
1,280
22,796
302,623
Total Executives
894,558
147,796
22,896
92,318
1,157,568
1,040,632
147,796
22,896
124,073
1,335,397
Total Directors
Executives
Total Remuneration
| 34 | Pental Limited 2014 Financial Report
For personal use only
Share-based payments
The Company is reviewing an executive performance rights plan to provide long term incentives aligned
to Company performance.
Under the previous executive option incentive plan (that will be replaced by a new executive performance rights plan),
there were no share options granted during the 2014 year (2013: nil).
During or since the end of the financial year, no fully paid ordinary shares were issued by the Group as a result
of the exercise of options under the executive option incentive plan.
Key management personnel equity holdings
Fully paid ordinary shares of Pental Limited held by key management personnel:
Balance
at
30/6/12
Options Net change
exercised
other
Balance
at
30/6/13 (iv)
Options Net change
exercised
other
Balance
at
29/6/14 (iv)
Non Executive Directors
Peter Robinson
Alan Johnstone
3,111,099
(i)
John Rishworth
29,882,598
- 36,618,157 39,729,256
9,932,314
- 49,661,570
- 267,106,296 296,988,894 73,698,530
3,349,752 374,037,176
16,508
-
115,556
132,064
33,016
-
165,080
John Etherington
-
-
-
-
-
-
-
Mel Sutton
-
-
-
-
-
-
-
Charlie McLeish (iii)
-
-
-
-
-
-
-
Alan Fisher
-
-
2,533,068
2,533,068
633,272 (3,166,340)
-
-
-
-
-
Executives
(ii) (iii)
Albert Zago (iii)
-
-
-
(i) Net change other relates to shares purchased and sold during the financial year.
(ii) Net change other relates to removal of shares owned by Mr Fisher who resigned on 31 December 2013.
(iii) Mr McLeish and Mr Zago will be invited to participate in an executive incentive rights Plan currently being prepared.
No equity was issued under the previous executive option incentive plan to Mr McLeish, Mr Fisher or Mr Zago during 2013 and 2014 financial years.
(iv) There has been no change in shareholdings from 29 June 2014 to the date of this report.
White King’s Mould &
Soap Scum Remover
has been tested to
be the most effective
mould & soap scum
remover in the
Australian market.
Pental Limited 2014 Financial Report | 35 |
For personal use only
When only a powerful
clean will do
For personal use only
DIRECTORS’
REPORT CONTINUED
Key management personnel share option holdings
This directors’ report is signed in accordance with a
resolution of directors made pursuant to s.298 (2) of the
Corporations Act 2001.
Number of share options of Pental Limited held by key
management personnel:
š 'XULQJWKHıQDQFLDO\HDUQRRSWLRQVZHUHJUDQWHGRU
exercised by key management personnel, except as
set out below (2013: nil).
On behalf of the Directors
š 'LUHFWRUVDQGH[HFXWLYHVZKRKHOG/R\DOW\2SWLRQVDW
an exercise price of $0.02) and exercised their right
by 29 November 2013, as prescribed in the Piggy
Back Options Prospectus dated 15 November 2013, to
acquire one fully paid ordinary share were issued one
free Piggy Back option at an exercise price of $0.03.
š 0U0F/HLVKDQG0U=DJRZLOOEHRijHUHGVHFXULWLHV
under an executive performance rights Plan to be
agreed between the parties. No equity or options
under the Company performance rights Plan were
issued to Mr Fisher, Mr Zago and Mr McLeish during
2013 and 2014 financial years.
Balance
at
30/6/13(i)
Balance
at
30/6/14(ii)
9,932,314
9,932,314
Peter Robinson
Chairman
Melbourne, 22 August 2014.
Non Executive Directors
Peter Robinson
Alan Johnstone
John Rishworth
73,698,530 73,698,530
33,016
33,016
633,272
-
Executive
Alan Fisher (iii)
(i) Options shown are Loyalty Options.
(ii) Options shown are Piggy Back Options.
(iii) Mr Fisher resigned on 31 December 2013.
(iv) There have been no changes in options from 29 June 2014
to the date of this report
White King is the proud
new sponsor of the
Western Bulldogs.
Pental Limited 2014 Financial Report | 37 |
For personal use only
For personal use only
AUDITOR’S INDEPENDENCE
DECLARATION
Deloitte Touche Tohmatsu
A.B.N. 74 490 121 060
550 Bourke Street
Melbourne VIC 3000
GPO Box 78
Melbourne VIC 3001 Australia
DX: 111
Tel: +61 (0) 3 9671 7000
Fax: +61 (0) 3 9671 7001
www.deloitte.com.au
Board of Directors
Pental Limited
Level 6, 390 St Kilda Road
MELBOURNE, VIC 3004
22 August 2014
Dear Board Members
Auditor’s Independence Declaration – Pental Limited
In accordance with section 307C of the Corporations Act 2001, I am pleased to provide the following declaration of independence to the directors of Pental Limited.
As audit partner for the audit of the financial statements of Pental Limited for the financial year ended 29
June 2014, I declare that to the best of my knowledge and belief, there have been no contraventions of:
(i) the auditor independence requirements of the Corporations Act 2001 in relation to the audit;; and
(ii) any applicable code of professional conduct in relation to the audit.
Yours sincerely
DELOITTE TOUCHE TOHMATSU
Andrew Reid
Partner
Chartered Accountants
Liability limited by a scheme approved under Professional Standards Legislation
Member of Deloitte Touche Tohmatsu Limited.
Pental Limited 2014 Financial Report | 39 |
For personal use only
INDEPENDENT
AUDITOR’S REPORT
Deloitte Touche Tohmatsu
A.B.N. 74 490 121 060
550 Bourke Street
Melbourne VIC 3000
GPO Box 78
Melbourne VIC 3001 Australia
DX: 111
Tel: +61 (0) 3 9671 7000
Fax: +61 (0) 3 9671 7001
www.deloitte.com.au
Independent Auditor’s Report
to the Members of Pental Limited
Report on the Financial Report We have audited the accompanying financial report of Pental Limited, which comprises the consolidated statement of financial position as at 29 June 2014, the consolidated statement of profit or loss and other comprehensive income, the consolidated statement of cash flows and the consolidated statement of changes in equity for the year ended on that date, notes comprising a summary of significant accounting policies and other explanatory information, and the directors’ declaration of the consolidated entity, comprising the company and the entities it controlled at the year’s end pages 42 to 90.
or from time to time during the financial year as set out on pages 42
Directors’ Responsibility for the Financial Report
The directors of the company are responsible for the preparation of the financial report that gives a true and fair view in accordance with Australian Accounting Standards and the Corporations Act 2001 and for such internal control as the directors determine is necessary to enable the preparation of the financial report that gives a true and fair view and is free from material misstatement, whether due to fraud or error. In Note 2, the directors also state, in accordance with
Accounting Standard AASB 101 Presentation of Financial Statements, that the financial statements comply with International Financial Reporting Standards.
Auditor’s Responsibility
Our responsibility is to express an opinion on the financial report based on our audit. We conducted our audit in accordance with Australian Auditing Standards. Those standards require that we comply with relevant ethical requirements relating to audit engagements and plan and perform the audit to obtain reasonable assurance whether the financial report is free from material misstatement. An audit involves performing procedures to obtain audit evidence about the amounts and disclosures in the financial report. The procedures selected depend on the auditor’s judgement, including the assessment of the risks of material misstatement of the financial report, whether due to fraud or error. In making those risk assessments, the auditor considers internal control, relevant to the company’s preparation of the financial report that gives a true and fair view, in order to design audit procedures that are appropriate in the circumstances, but not for the purpose of expressing an opinion on the effectiveness of the company’s internal control. An audit also includes evaluating the appropriateness of accounting policies used and the reasonableness of accounting estimates made by the directors, as well as evaluating the overall presentation of the financial report.
We believe that the audit evidence we have obtained is sufficient and appropriate to provide a basis for our audit opinion.
Liability limited by a scheme approved under Professional Standards Legislation
Member of Deloitte Touche Tohmatsu Limited.
| 40 | Pental Limited 2014 Financial Report
For personal use only
INDEPENDENT
AUDITOR’S REPORT CONTINUED
Auditor’s Independence Declaration
In conducting our audit, we have complied with the independence requirements of the Corporations Act 2001. We confirm that the independence declaration required by the Corporations Act 2001, which has been given to the directors of Pental Limited, would be in the same terms if given to the directors as at the time of this auditor’s report. Opinion In our opinion: (a) the financial report of Pental Limited is in accordance with the Corporations Act 2001, including:
(i)
giving a true and fair view of the consolidated entity’s financial position as at 29 June 2014 and of its performance for the year ended on that date;; and (ii)
complying with Australian Accounting Standards and the Corporations Regulations 2001;; and
(b) The consolidated financial statements also comply with International Financial Reporting Standards as disclosed in Note 2. Report on the Remuneration Report We have audited the Remuneration Report included on pages 30
31 to
to 37
37 of the directors’ report for the year ended 29 June
2014. The directors of the company are responsible for the preparation and presentation of the Remuneration Report in accordance with section 300A of the Corporations Act 2001. Our responsibility is to express an opinion on the Remuneration Report, based on our audit conducted in accordance with Australian Auditing Standards.
Opinion In our opinion the Remuneration Report of Pental Limited for the year ended 29 June 2014, complies with section 300A of the Corporations Act 2001. DELOITTE TOUCHE TOHMATSU
Andrew Reid
Partner
Chartered Accountants
Melbourne, 22 August 2014 Pental Limited 2014 Financial Report | 41 |
For personal use only
DIRECTORS’
DECLARATION
DIRECTORS’ DECLARATION
The directors declare that:
(a) in the directors’ opinion, there are reasonable grounds to believe that the company will be able to pay its debts as
and when they become due and payable;
(b) in the directors’ opinion, the attached financial statements and notes thereto are in accordance with the Corporations
Act 2001, including compliance with accounting standards and giving a true and fair view of the financial position
and performance of the Group;
(c) in the director’s opinion the financial statements and notes thereto are in accordance with International Financial
Reporting Standards issued by the International Accounting Standards Board as stated in Note 2 to the financial
statements; and
(d) the directors have been given the declarations required by s.295A of the Corporations Act 2001.
At the date of this declaration, the company is within the class of companies affected by ASIC Class Order 98/1418.
The nature of the deed of cross guarantee is such that each company which is party to the deed guarantees to each
creditor payment in full of any debt in accordance with the deed of cross guarantee.
In the directors’ opinion, there are reasonable grounds to believe that the company and the companies to which
the ASIC Class Order applies, as detailed in Note 11 to the financial statements will, as a group, be able to meet any
obligations or liabilities to which they are, or may become, subject by virtue of the deed of cross guarantee.
Signed in accordance with a resolution of the directors made pursuant to s.295 (5) of the Corporations Act 2001.
On behalf of the Directors
Peter Robinson
Chairman
Melbourne, 22 August 2014.
| 42 | Pental Limited 2014 Financial Report
CONSOLIDATED STATEMENT
OF PROFIT OR LOSS AND OTHER
COMPREHENSIVE INCOME
For personal use only
for the year (52 weeks) ended 29 June 2014
Continuing Operations
Gross sales revenue
Sales rebates and discounts
Sales revenue
Note
2014
$’000
2013
$’000
109,376
(28,654)
80,722
107,891
(28,830)
79,061
336
1,257
(44,416)
(11,588)
(1,793)
(8,794)
(853)
(3,162)
(3,812)
466
2,795
(45,090)
(10,894)
(1,069)
(9,070)
(891)
(2,945)
(3,814)
401
8,298
(960)
7,338
(2,002)
5,336
5,336
(103)
143
(67)
(100)
8,422
(5,663)
2,759
(556)
2,203
(310)
1,893
Other comprehensive income
Items that may be classified subsequently to profit or loss:
Gain/(loss) on cash flow hedges taken to equity
Income tax relating to components of other comprehensive income
Other comprehensive income for the year (net of tax)
Total comprehensive income for the year
(154)
46
(108)
5,228
4
(1)
3
1,896
Profit attributable to equity holders of the parent
Total comprehensive income attributable to equity holders of the parent
5,336
5,228
1,893
1,896
8
8
0.34
0.33
0.20
0.20
8
8
0.34
0.33
0.24
0.24
Other revenue and income
Changes in inventory of finished goods and work in progress
Raw materials, consumables used and utilities
Employee benefits expense (excluding termination benefits)
Depreciation and amortisation expense
Freight and distribution expense
Repairs and maintenance expense
Marketing expenses
Other expenses
Significant Income and Expenses:
− Profit on sale of brand
− Impairment of property, plant and equipment
− Net impairments / reversal of brand names
− Loss on sale of property
−Rectification works
Profit from continuing operations before interest and tax
Finance costs
Profit from continuing operations before tax
Income tax expense
Net Profit for the year from continuing operations
Net (loss) for the year from discontinued operations
Profit Attributable to Members of the Parent Entity
Earnings per share Attributable to the Members of the Parent Entity from
Continuing and Discontinued Operations
From continuing and discontinued operations:
Basic (cents per share)
Diluted (cents per share)
From continuing operations
Basic (cents per share)
Diluted (cents per share)
3
3
7
7
7
12
14
7
5
34
Notes to the financial statements are included on pages 49 to 90.
Pental Limited 2014 Financial Report | 43 |
CONSOLIDATED STATEMENT
OF FINANCIAL POSITION
For personal use only
as at 29 June 2014
Note
29 June 2014 30 June 2013
$’000
$’000
Current assets
Cash and cash equivalents
28(a)
548
5,476
Trade and other receivables
9
24,726
22,434
Inventories
10
8,945
10,264
Other
15
419
380
34,638
38,554
Total current assets
Non-current assets
Plant and equipment
12
13,745
10,699
Deferred tax assets
6
1,567
3,418
Goodwill
13
25,084
25,084
Other intangible assets
14
15,237
15,249
Total non-current assets
55,633
54,450
Total assets
90,271
93,004
Current liabilities
Trade and other payables
16
15,103
13,506
Borrowings
18
523
1,632
Other financial liabilities
17
154
810
Provisions
19
1,364
2,810
17,144
18,758
Total current liabilities
Non-current liabilities
Borrowings
18
-
12,056
Provisions
19
112
108
Total non-current liabilities
112
12,164
Total liabilities
17,256
30,922
Net assets
73,015
62,082
84,014
78,309
Equity
Issued capital
20
Reserves
21
(108)
-
Accumulated losses
22
(10,891)
(16,227)
73,015
62,082
Total equity
Notes to the financial statements are included on pages 49 to 90.
Strong Balance
Sheet with no
gearing
| 44 | Pental Limited 2014 Financial Report
CONSOLIDATED STATEMENT
OF CHANGES IN EQUITY
For personal use only
for the year (52 weeks) ended 29 June 2014
Note
Balance at 30 June 2012
Restatement
Issued
capital
$’000
Hedging
reserve
$’000
59,783
2
Retained
earnings
$’000
(3)
Total
$’000
(16,203)
43,577
-
-
(1,917)
(1,917)
59,783
(3)
(18,120)
41,660
Profit for the year
-
-
1,893
1,893
Gain/(loss) on cash flow hedges
-
4
-
4
Deferred tax arising on hedges
-
(1)
-
(1)
Balance at 1 July 2012
Total comprehensive income for the year
-
3
1,893
1,896
Share issue
19,693
-
-
19,693
Share issue costs
(1,683)
-
-
(1,683)
516
-
-
516
Balance at 30 June 2013
78,309
-
(16,227)
62,082
Balance at 1 July 2013
78,309
-
(16,227)
62,082
Income tax on share issue costs
Profit for the year
-
-
5,336
5,336
Gain/(loss) on cash flow hedges
-
(154)
-
(154)
Deferred tax arising on hedges
-
46
-
46
Total comprehensive income for the year
-
(108)
5,336
5,228
Share issue
5,806
-
-
5,806
Share issue costs
(145)
-
-
(145)
44
-
-
44
84,014
(108)
(10,891)
73,015
Income tax on share issue costs
Balance at 29 June 2014
Notes to the financial statements are included on pages 49 to 90.
Pental Limited 2014 Financial Report | 45 |
By choosing
Pental, you’re
choosing a
product made by
Australians, for
Australians”
For personal use only
“
For personal use only
PENTAL IN THE MARKET
4,000
• More than
supermarkets
700 pharmacies
• More than 300 petrol and
More than
convenience, corner, outdoor
and hardware stores
7
CONSOLIDATED STATEMENT
OF CASH FLOWS
For personal use only
for the year (52 weeks) ended 29 June 2014
Note
2014
$’000
2013
$’000
Cash flows from operating activities
Receipts from customers
128,666
191,005
(120,111)
(188,641)
52
179
(1,616)
(5,566)
-
92
28(b)
6,991
(2,931)
Payments for plant and equipment
12
(4,628)
(2,199)
Payments for intangible assets
14
(387)
(209)
600
30,000
(4,415)
27,592
Payments to suppliers and employees
Interest received
Interest and other costs of finance paid
Income taxes (paid) / refunded
Net cash provided by/ (used in) operating activities
Cash flows from investing activities
Proceeds from sale of property, plant & equipment
Net cash provided by/(used in) investing activities
Cash flows from financing activities
Proceeds from issue of shares
20
5,806
19,693
Payment for share issue costs
20
(145)
(1,683)
Repayment of borrowings
18
(12,556)
(42,049)
Net cash provided by/(used in) financing activities
(6,895)
(24,039)
Net increase/(decrease) in cash and cash equivalents
(4,319)
622
4,344
3,722
25
4,344
Cash and cash equivalents at the beginning of the financial year
Cash and cash equivalents at the end of the financial year
Notes to the financial statements are included on pages 49 to 90.
| 48 | Pental Limited 2014 Financial Report
28(a)
NOTES TO THE
FINANCIAL STATEMENTS
For personal use only
for the year (52 weeks) ended 29 June 2014
1. GENERAL INFORMATION
Pental Limited, incorporated and domiciled in Australia, is a publicly listed company on the Australian Stock Exchange,
limited by shares.
Company Secretary
Mr Oliver Carton
Principal Registered office
Pental Limited
Level 6, 390 St. Kilda Road
Melbourne Victoria 3004
Telephone: (03) 9251 2311
Facsimile: (03) 9645 3001
www.pental.com.au
Share Registry
Boardroom Pty Limited
Level 7, 207 Kent Street
Sydney NSW 2000
Telephone: (02) 9290 9600
Facsimile: (02) 9279 0664
www.boardroomlimited.com.au
2. SIGNIFICANT ACCOUNTING POLICIES
Statement of compliance
Basis of preparation
These financial statements are general purpose
financial statements which have been prepared in
accordance with the Corporations Act 2001, Accounting
Standards and Interpretations, and complies with other
requirements of the law. The financial statements
comprise consolidated financial statements of the
consolidated entity (the “Group”). For the purposes of
preparing the consolidated financial statements, the
Company is a for-profit entity.
The financial statements have been prepared on the
basis of historical cost, except for the revaluation of
certain non-current assets and financial instruments.
Cost is based on the fair values of the consideration
given in exchange for assets. All amounts are presented
in Australian dollars, unless otherwise noted.
Accounting Standards include Australian equivalents to
International Financial Reporting Standards (‘A-IFRS’).
Compliance with A-IFRS ensures that the financial
statements and notes of the Group comply with
International Financial Reporting Standards (‘IFRS’).
The company is a company of the kind referred to in
ASIC Class Order 98/0100, dated 10 July 1998, and
in accordance with that Class Order amounts in the
financial report are rounded off to the nearest thousand
dollars, unless otherwise indicated.
The financial statements were authorised for issue
by the directors on 22 August 2014.
White King has been
voted one of the
Most Trusted
Brands in the
laundry category for
the fourth year in a row
in 2014.
Source: Reader’s Digest Survey 2014.
Pental Limited 2014 Financial Report | 49 |
NOTES TO THE
FINANCIAL STATEMENTS
For personal use only
for the year (52 weeks) ended 29 June 2014
(Continued)
Critical accounting judgments and key sources of
estimation uncertainty
In the application of the Group’s accounting policies,
management is required to make judgments, estimates
and assumptions about carrying values of assets and
liabilities that are not readily apparent from other
sources. The estimates and associated assumptions are
based on historical experience and other factors that
are considered to be relevant. Actual results may differ
from these estimates.
The estimates and underlying assumptions are
reviewed on an ongoing basis. Revisions to accounting
estimates are recognised in the period in which the
estimate is revised if the revision affects only that period
or in the period of the revision and future periods if the
revision affects both current and future periods.
The following are the key assumptions concerning the
future, and other key sources of estimation uncertainty
at balance sheet date, that have a significant risk of
causing a material adjustment to the carrying amounts
of assets and liabilities within the next financial year:
Impairment of goodwill and brand names
Determining whether goodwill and brand names are
impaired requires an estimation of the value in use of
the cash-generating units to which goodwill and brand
names have been allocated. The value in use calculation
requires the entity to estimate the future cash flows
expected to arise from the cash-generating unit and a
suitable discount rate in order to calculate present value.
The carrying amount of goodwill at 29 June 2014 was
$25.084 million (30 June 2013: $25.084 million). Details
of the impairment testing are set out in Note 13.
The carrying amount of brand names at 29 June 2014
was $14.539 million (30 June 2013: $14.728 million). The
decrease in the value of brands was due to the sale of
the Close Up brand. Details of movements are set out in
Note 14.
Impairment of property, plant and equipment
Determining whether property, plant and equipment
are impaired requires an estimation of the value in use
of the cash-generating units to which property, plant
and equipment have been allocated. The value in use
calculation requires the entity to estimate the future
cash flows expected to arise from the cash-generating
unit and a suitable discount rate in order to calculate
present value.
The carrying amount of property, plant and equipment
at 29 June 2014 was $13.745 million (30 June 2013:
$10.699 million). Details of movements are set out in
Note 12.
Adoption of new and revised Accounting Standards
In the current year, the Group has adopted all of
the following new and revised Standards and
Interpretations issued by the Australian Accounting
Standards Board (the AASB) that are relevant to its
operations and effective for the current annual reporting
period:
(i)
AASB 10 ‘Consolidated Financial Statements’
and AASB 2011-7 ‘Amendments to Australian
Accounting Standards arising from the
consolidation and Joint Arrangements standards’
(ii) AASB 12 ‘Disclosure of Interests in Other
Entities’ and AASB 2011-7 ‘Amendments to
Australian Accounting Standards arising from the
consolidation and Joint Arrangements standards’
(iii) AASB 13 ‘Fair Value Measurement’ and AASB 20118 ‘Amendments to Australian Accounting Standards
arising from AASB 13’
(iv) AASB 119 ‘Employee Benefits’ (2011) and AASB
2011-10 ‘Amendments to Australian Accounting
Standards arising from AASB 119 (2011)’
(v) AASB 2011-4 ‘Amendments to Australian
Accounting Standards to Remove Individual Key
Management Personnel Disclosure Requirements’
(vi) AASB 2012-2 ‘Amendments to Australian
Accounting Standards – Disclosures – Offsetting
Financial Assets and Financial Liabilities’
(vii) AASB 2012-5 ‘Amendments to Australian
Accounting Standards arising from Annual
Improvements 2009–2011 Cycle’
| 50 | Pental Limited 2014 Financial Report
For personal use only
Restatement of trade and other payables (trade spend
liability) relating to the prior financial years
Following the restructure of the Group in the 2013
financial year, the then new management team
conducted a review of all sales related balances of the
Consumer Products business. The review highlighted
the need to improve its processes around tracking
trade spend and promotional activities. As a result,
new processes were implemented to increase the
granularity of information captured and improve the
ability to measure the success of sales promotions
activities, and the tracking of related trade spend
liabilities.
The review highlighted that, in prior periods, Pental
had consistently but incorrectly estimated period-end
trade spend liabilities. Pental believed that this estimate
fully accounted for trade spend liabilities to customers
relating to the relevant period end.
It was impracticable to allocate the increased sales
promotions liability between opening balance liabilities
due to the level of granularity of information available in
prior periods. Accordingly, opening retained earnings for
the period ended 30 June 2013 was reduced by $1.917
million as a result of an increase in the opening trade
spend liability of $2.739 million and a net decrease in
tax liabilities of $0.822 million. These adjustments do
not affect the current year profit or the result of the
prior year.
Accounting policies
The following significant accounting policies have been
adopted in the preparation and presentation of the
financial statements:
(a) Basis of consolidation
The consolidated financial statements are prepared
by combining the financial statements of all the
entities that comprise the consolidated entity, being
the company (the parent entity) and its subsidiaries
(referred to as “the Group” in these financial
statements) as defined in Accounting Standard
AASB 10 ‘Consolidated Financial Statements’. A list
of subsidiaries appears in Note 11 to the financial
statements. Consistent accounting policies are
employed in the preparation and presentation of the
consolidated financial statements.
On acquisition, the assets, liabilities and contingent
liabilities of a subsidiary are measured at their fair
values at the date of acquisition. Any excess of the cost
of acquisition over the fair values of the identifiable
net assets acquired is recognised as goodwill. If, after
reassessment, the fair values of the identifiable net
assets acquired exceed the cost of acquisition, the
deficiency is credited to profit and loss in the period
of acquisition.
In preparing the consolidated financial statements,
all intercompany balances and transactions, and
unrealised profits arising within the Group are
eliminated in full.
Pental Limited 2014 Financial Report | 51 |
NOTES TO THE
FINANCIAL STATEMENTS
For personal use only
for the year (52 weeks) ended 29 June 2014
(Continued)
(b) Business combinations
(c) Foreign currency
Acquisitions of subsidiaries and businesses are
accounted for using the acquisition method. The
consideration for each acquisition is measured as the
aggregate of the fair values (at the date of exchange) of
assets given, liabilities incurred or assumed, and equity
instruments issued by the Group in exchange for control
of the acquiree. Acquisition related costs are recognised
in profit and loss as incurred. The acquiree’s identifiable
assets, liabilities and contingent liabilities that meet
the conditions for recognition under AASB 3 ‘Business
Combinations’ are recognised at their fair values at
the acquisition date, except for non-current assets (or
disposal groups) that are classified as held for sale in
accordance with AASB 5 ‘Non-current Assets Held for
Sale and Discontinued Operations’, which are recognised
and measured at fair value less costs to sell.
The presentation and functional currency of the Group is
Australian dollars.
Goodwill arising on acquisition is recognised as an asset
and initially measured at cost, being the excess of the
consideration transferred, the amount of any noncontrolling interests in the acquiree, and the fair value of
acquirer’s previously held equity interest in the acquiree
(if any) over the net of the acquisition-date amounts
of the identifiable assets acquired and the liabilities
assumed. If, after reassessment, the Group’s interest in
the net fair value of the acquiree’s identifiable net assets
exceeds the sum of the consideration transferred, the
amount of any non-controlling interests in the acquiree
and the fair value of the acquirer’s previously held
equity interest in the acquiree, the excess is recognised
immediately in profit or loss as a bargain purchase gain.
Foreign currency transactions
All foreign currency transactions during the financial
year are brought to account using the exchange rate in
effect at the date of the transaction. Foreign currency
monetary items at reporting date are translated at the
exchange rate existing at reporting date. Non-monetary
assets and liabilities carried at fair value that are
denominated in foreign currencies are translated at
the rates prevailing at the date when the fair value was
determined.
Exchange differences are recognised in profit or loss in
the period in which they arise except that:
š H[FKDQJHGLijHUHQFHVRQWUDQVDFWLRQVHQWHUHGLQWRLQ
order to hedge certain foreign currency risks (refer
Note 24); and
š H[FKDQJHGLijHUHQFHVRQPRQHWDU\LWHPVUHFHLYDEOH
from or payable to a foreign operation for which
settlement is neither planned or likely to occur, which
form part of the net investment in a foreign operation,
are recognised in the foreign currency translation
reserve and recognised in profit or loss on disposal of
the net investment.
(d) Goods and services tax
Revenues, expenses and assets are recognised net of
the amount of goods and services tax (GST), except:
i. where the amount of GST incurred is not recoverable
from the taxation authority, it is recognised as part
of the cost of acquisition of an asset or as part of an
item of expense; or
ii. for receivables and payables which are recognised
inclusive of GST.
The net amount of GST recoverable from, or payable to,
the taxation authority is included as part of receivables
or payables. Cash flows are included in the cash flow
statement on a gross basis. The GST component of cash
flows arising from investing and financing activities
which is recoverable from, or payable to, the taxation
authority is classified within operating cash flows.
| 52 | Pental Limited 2014 Financial Report
For personal use only
(e) Revenue
(g) Income tax
Revenues are recognised at fair value of the
consideration received net of the amount of goods and
services tax (GST) payable to the taxation authority.
Current tax
Sale of goods
Revenue from the sale of goods is recognised (net of
returns, rebates, discounts and allowances) when the
Group has transferred to the buyer control and the
significant risks and rewards of ownership of the goods.
Interest revenue
Interest revenue is recognised on a time proportionate
basis that takes into account the effective yield on the
financial asset.
(f) Share-based payments
Equity-settled share-based payments with employees
and others providing similar services are measured
at the fair value of the equity instrument at the grant
date. Fair value is measured by use of a binomial
model. The expected life used in the model has been
adjusted, based on management’s best estimate, for the
effects of non-transferability, exercise restrictions, and
behavioural considerations.
The fair value determined at the grant date of the
equity-settled share-based payments is expensed on a
straight-line basis over the vesting period, based on the
Group’s estimate of shares that will eventually vest.
Equity-settled share-based payment transactions with
other parties are measured at the fair value of the
goods and services received, except where the fair value
cannot be estimated reliably, in which case they are
measured at the fair value of the equity instruments
granted, measured at the date the entity obtains the
goods or the counterparty renders the service.
For cash-settled share-based payments, a liability
equal to the portion of the goods or services received is
recognised at the current fair value determined at each
reporting date.
Current tax is calculated by reference to the amount of
income taxes payable or recoverable in respect of the
taxable profit or tax loss for the period. It is calculated
using tax rates and tax laws that have been enacted or
substantively enacted by reporting date. Current tax for
current and prior periods is recognised as a liability (or
asset) to the extent that it is unpaid (or refundable).
Deferred tax
Deferred tax is accounted for using the comprehensive
balance sheet liability method in respect of temporary
differences arising from differences between the
carrying amount of assets and liabilities in the financial
statements and the corresponding tax base of those
items.
In principle, deferred tax liabilities are recognised for
all taxable temporary differences. Deferred tax assets
are recognised to the extent that it is probable that
sufficient taxable amounts will be available against
which deductible temporary differences or unused tax
losses and tax offsets can be utilised.
However, deferred tax assets and liabilities are not
recognised if the temporary differences giving rise
to them arise from the initial recognition of assets
and liabilities (other than as a result of a business
combination) which affects neither taxable income nor
accounting profit. Furthermore, a deferred tax liability
is not recognised in relation to taxable temporary
differences arising from goodwill.
Deferred tax liabilities are recognised for taxable
temporary differences arising on investments in
subsidiaries, branches, associates and joint ventures
except where the Group is able to control the reversal
of the temporary differences and it is probable that
the temporary differences will not reverse in the
foreseeable future. Deferred tax assets arising from
deductible temporary differences associated with these
investments and interests are only recognised to the
extent that it is probable that there will be sufficient
taxable profits against which to utilise the benefits of
the temporary differences and they are expected to
reverse in the foreseeable future.
Deferred tax assets and liabilities are measured at the
tax rates that are expected to apply to the period(s)
when the asset and liability giving rise to them are
realised or settled, based on tax rates (and tax laws)
that have been enacted or substantively enacted by
Pental Limited 2014 Financial Report | 53 |
NOTES TO THE
FINANCIAL STATEMENTS
For personal use only
for the year (52 weeks) ended 29 June 2014
(Continued)
reporting date. The measurement of deferred tax
liabilities and assets reflects the tax consequences
that would follow from the manner in which the Group
expects, at the reporting date, to recover or settle the
carrying amount of its assets and liabilities.
Deferred tax assets and liabilities are offset when they
relate to income taxes levied by the same taxation
authority and the company/Group intends to settle its
current tax assets and liabilities on a net basis.
Current and deferred tax for the period
Current and deferred tax is recognised as an expense
or income in the statement of comprehensive income,
except when it relates to items credited or debited
directly to equity, in which case the deferred tax is also
recognised directly in equity, or where it arises from the
initial accounting for a business combination, in which
case it is taken into account in the determination of
goodwill or excess.
Tax consolidation
The company and all its wholly-owned Australian
resident entities are part of a tax consolidated group
under Australian taxation law. Pental Limited is the
head entity in the tax-consolidated group. Tax expense/
income, deferred tax liabilities and deferred tax assets
arising from temporary differences of the members
of the tax consolidated group are recognised in the
separate financial statements of the members of the
tax-consolidated group using the ‘separate taxpayer
within group’ approach.
Current tax liabilities and assets and deferred tax
assets arising from unused tax losses and tax credits
of the members of the tax-consolidated group are
recognised by the company (as head entity in the
tax-consolidated group). Due to the existence of a tax
funding arrangement between the entities in the tax
consolidated group, amounts are recognised as payable
to or receivable by the company and each member of
the group in relation to the tax contribution amounts
paid or payable between the parent entity and the other
members of the tax-consolidated group in accordance
with the arrangement.
Where the tax contribution amount recognised by each
member of the tax-consolidated group for a particular
period is different to the aggregate of the current tax
liability or asset and any deferred tax asset arising from
unused tax losses and tax credits in respect of that
period, the difference is recognised as a contribution
from (or distribution to) equity participants.
| 54 | Pental Limited 2014 Financial Report
(h) Cash and cash equivalents
Cash and cash equivalents comprise cash on hand, cash
in banks and investments in money market instruments,
net of outstanding bank overdrafts. Bank overdrafts
are shown within borrowings in current liabilities in the
statement of financial position.
(i) Financial assets
Investments in subsidiaries and other corporations
are recognised and derecognised on trade date where
purchase or sale of an investment is under a contract
whose terms require delivery of the investment
within the timeframe established by the market
concerned, and are initially measured at fair value, net
of transaction costs. Subsequent to initial recognition,
investments are measured at cost.
Loans and receivables
Trade receivables, loans, and other receivables are
recorded at amortised cost less impairment.
Other financial assets
For the accounting policy on derivatives – refer Note 2(s)
and Note 24.
(j) Inventories
Inventories are carried at the lower of cost and net
realisable value.
Cost includes direct materials, direct labour, other direct
variable costs and allocated production overheads
necessary to bring inventories to their present location
and condition, based on normal operating capacity of
the production facilities.
Manufacturing activities
The cost of manufacturing inventories and work-inprogress are assigned on a first-in first-out basis.
Costs arising from exceptional wastage are expensed
as incurred.
Net realisable value
Net realisable value is determined on the basis of each
inventory line’s normal selling pattern. Expenses of
marketing, selling and distribution to customers are
estimated and are deducted to establish net realisable
value.
For personal use only
(k) Plant and equipment
(l) Borrowing costs
The carrying amount of plant and equipment which
is valued on the cost basis, is subject to impairment
testing and is reviewed to determine whether they are
in excess of their recoverable amount at balance date.
Borrowing costs include interest, amortisation of
discounts or premiums relating to borrowings,
amortisation of ancillary costs incurred in connection
with arrangement of borrowings, foreign exchange
differences net of hedged amounts on borrowings,
including trade creditors and lease finance charges.
If the carrying amount of plant and equipment exceeds
its recoverable amount, the asset is written down to
the lower amount. The write-down is expensed in the
reporting period in which it occurs.
Depreciation is calculated on a straight line basis so
as to write off the net cost or other revalued amount
of each asset over its expected useful life to its
estimated residual value. Leasehold improvements are
depreciated over the period of the lease or estimated
useful life, whichever is the shorter, using the straight
line method. The estimated useful lives, residual values
and depreciation method are reviewed at the end of
each annual reporting period. Plant and equipment
estimated useful life used in the calculation of
depreciation is 3 to 20 years.
Ancillary costs incurred in connection with the
arrangement of borrowings are capitalised and
amortised over the life of the borrowings.
Borrowing costs are expensed as incurred unless they
relate to qualifying assets. Qualifying assets are assets
which take more than 12 months to get ready for their
intended use or sale. In these circumstances, borrowing
costs are capitalised to the cost of the assets. Where
funds are borrowed specifically for the acquisition,
construction or production of a qualifying asset, the
amount of borrowing costs capitalised is those incurred
in relation to that borrowing, net of any interest earned
on those borrowings. Where funds are borrowed
generally, borrowing costs are capitalised using a
weighted average capitalisation rate.
Pental Limited 2014 Financial Report | 55 |
NOTES TO THE
FINANCIAL STATEMENTS
For personal use only
for the year (52 weeks) ended 29 June 2014
(Continued)
(m) Leased assets
Leases are classified as finance leases whenever the
terms of the lease transfer substantially all the risks
and rewards of ownership to the lessee. All other leases
are classified as operating leases.
Assets held under finance leases are initially recognised
at their fair value or, if lower, at amounts equal to
the present value of the minimum lease payments,
each determined at the inception of the lease. The
corresponding liability to the lessor is included in
the statement of financial position as a finance lease
obligation.
Lease payments are apportioned between finance
charges and reduction of the lease obligation so as to
achieve a constant rate of interest on the remaining
balance of the liability. Finance charges are charged
directly against income, unless they are directly
attributable to qualifying assets, in which case they
are capitalised in accordance with the Group’s general
policy on borrowing costs.
Operating lease payments are recognised as an expense
on a straight line basis over the lease term.
(n) Intangible assets
Goodwill
Goodwill, representing the excess of the sum
of the consideration transferred, the amount of any
non-controlling interests in the acquiree (if any), and
the fair value of the acquirer’s previously held equity
interest in the acquiree (if any), identifiable assets
acquired, and liabilities assumed. Goodwill is not
amortised, but tested for impairment annually and
whenever there is an indication that the goodwill may
be impaired. Any impairment is recognised immediately
in the profit or loss and is not subsequently reversed.
Refer also to Note 13.
Brand names
The Pental brand names are not amortised as the
Directors believe the brands have an indefinite useful
life. Brand names with indefinite useful lives are tested
for impairment annually and whenever there is an
indication that the asset may be impaired. Brand names
are recorded at fair value at the time of acquisition, less
any impairment subsequently recorded.
Computer Software
All costs directly incurred in the purchase or
development of major computer software or
| 56 | Pental Limited 2014 Financial Report
subsequent upgrades and material enhancements,
which can be reliably measured and are not integral to a
related asset, are capitalised as intangible assets. Costs
capitalised include external direct costs of materials
and service and direct travel, payroll and payroll related
costs of employees’ time spent on the project. Costs
incurred on computer maintenance or during planning
phase are expensed as incurred. Computer software
is amortised over the period of time during which the
benefits are expected to arise being 3 to 5 years.
(o) Impairment of assets
At each reporting date, the Group reviews the carrying
amounts of its tangible and intangible assets to
determine whether there is any indication that those
assets have suffered an impairment loss. If any such
indication exists, the recoverable amount of the asset
is estimated in order to determine the extent of the
impairment loss (if any). Where the asset does not
generate cash flows that are independent from other
assets, the Group estimates the recoverable amount of
the cash-generating unit to which the asset belongs.
Recoverable amount is the higher of fair value less
costs to sell and value in use. In assessing value in use,
the estimated future cash flows are discounted to their
present value using a pre-tax discount rate that reflects
current market assessments of the time value of
money and the risks specific to the asset for which the
estimates of future cash flows have not been adjusted.
If the recoverable amount of an asset (or cashgenerating unit) is estimated to be less than its carrying
amount, the carrying amount of the asset (or cashgenerating unit) is reduced to its recoverable amount.
An impairment loss is recognised in the profit or loss
immediately, unless the relevant asset is carried at fair
value, in which case the impairment loss is treated as a
revaluation decrease.
Where an impairment loss subsequently reverses, the
carrying amount of the asset (or cash-generating unit)
is increased to the revised estimate of its recoverable
amount, but only to the extent that the increased
carrying amount does not exceed the carrying amount
that would have been determined had no impairment
loss been recognised for the asset (or cash-generating
unit) in prior years. A reversal of an impairment loss
is recognised in profit or loss immediately, unless the
relevant asset is carried at fair value, in which case
the reversal of the impairment loss is treated as a
revaluation increase.
For personal use only
(p) Employee benefits
Provision is made for benefits accruing to employees
in respect of wages and salaries, annual leave, long
service leave, and sick leave when it is probable that
settlement will be required and they are capable of
being measured reliably. Provisions made in respect of
employee benefits are measured as the present value
of estimated future cash outflows to be made by the
Group in respect of services provided by employees up
to reporting date.
(q) Provisions
Provisions are recognised when the Group has a
present obligation (legal or constructive) as a result of a
past event, it is probable that the Group will be required
to settle the obligation, and a reliable estimate can be
made of the amount of the obligation.
The amount recognised as a provision is the best
estimate of the consideration required to settle the
present obligation at reporting date, taking into account
the risks and uncertainties surrounding the obligation.
Where a provision is measured using the cash flows
estimated to settle the present obligation, its carrying
amount is the present value of those cash flows.
(r) Financial instruments issued
by the company
Debt and equity instruments
Debt and equity instruments are classified as either
liabilities or as equity in accordance with the substance
of the contractual arrangement
Transaction costs on the issue
of equity instruments
Transaction costs arising on the issue of equity
instruments are recognised directly in equity as a
reduction of the proceeds of the equity instruments to
which the costs relate. Transaction costs are the costs
that are incurred directly in connection with the issue
of those equity instruments and which would not have
been incurred had those instruments not been issued.
Interest and dividends
Interest and dividends are classified as expenses or as
distributions of profit consistent with the statement of
financial position classification of the related debt or
equity instruments or component parts of compound
instruments.
When some or all of the economic benefits required to
settle a provision are expected to be recovered from a
third party, the receivable is recognised as an asset if it
is virtually certain that reimbursement will be received
and the amount of the receivable can be measured
reliably.
Dividends
A provision for dividends payable is recognised in the
reporting period in which the dividends are declared,
for the entire undistributed amount, regardless of the
extent to which they will be paid in cash.
Pental Limited 2014 Financial Report | 57 |
NOTES TO THE
FINANCIAL STATEMENTS
For personal use only
for the year (52 weeks) ended 29 June 2014
(Continued)
(s) Derivative financial instruments
The Group is exposed to changes in interest rates and
foreign exchange rates from its activities. The Group
uses interest rate swaps and forward foreign exchange
contracts to hedge these risks. Derivative financial
instruments are not held for speculative purposes.
The Group uses derivative financial instruments, being
interest rate swaps and forward foreign currency
contracts to hedge the risk associated with interest rate
and foreign currency fluctuations. Such derivatives are
stated at fair value. The fair value of forward exchange
contracts is calculated by reference to current forward
exchange rates for contracts with similar maturity
profiles. The fair value of interest swaps are calculated
by reference to current rates for contracts with similar
maturity profiles.
Derivatives are initially recognised at fair value on
the date a derivative contract is entered into and are
subsequently remeasured to their fair value at each
reporting date. For derivatives that do not qualify for
hedge accounting, any gains or losses arising from
changes in fair value are taken directly to profit or loss
for the year. All Interest rates swaps do not qualify for
hedge accounting and have been taken directly to the
profit and loss for the year.
For derivatives that qualify for hedge accounting, the
method for recognising gains and losses on changes
in fair value depends on whether the derivative is
classified as a fair value hedge or a cash flow hedge.
Derivatives are classified as fair value hedges when
they hedge the exposure to changes in the fair value
of a recognised asset or liability and as cash flow
hedges when they hedge exposure to variability in cash
flows that are attributable to either a particular risk
associated with a recognised asset or liability or to a
forecast transaction. The Group documents at inception
of the hedge the relationship between the hedging
instruments (derivatives) and the hedged items,
as well as the risk management objective and strategy
for undertaking the hedge transaction.
The Group also documents, both at inception of the
hedge and on an ongoing basis whether the derivatives
that are used in the hedging transactions have been,
and will continue to be, highly effective in offsetting
changes in fair values or cash flows of hedged items.
| 58 | Pental Limited 2014 Financial Report
Changes in the fair value of derivatives that are
designated and qualify as fair value hedges are
recorded in the income statement, together with any
changes in the fair value of the hedged asset or liability
that are attributable to the hedged risk.
The effective portion of changes in the fair value of
derivatives that are designated and qualify as cash flow
hedges is recognised in equity in the hedging reserve
and transferred to profit or loss when the hedged item
affects profit or loss. The gain or loss relating to the
ineffective portion is recognised immediately in the
profit or loss. However, when the cash flow hedge
relates to a forward foreign exchange contract to
hedge a highly probable forecast transaction or firm
commitment that results in a non-financial asset
(e.g. inventory) or a non-financial liability, the gains
and losses previously deferred in equity are transferred
from equity and included in the initial measurement
of the initial cost or carrying amount of the asset
or liability.
Hedge accounting is discontinued when the hedging
instrument expires, or is sold, terminated or exercised,
or no longer qualifies for hedge accounting. At that
point in time, any cumulative gains or losses on the
hedging instrument recognised in equity is kept in
equity until the forecast transaction occurs. If the
forecast transaction is no longer expected to occur,
the net cumulative gain or loss recognised in equity is
transferred to the statement of comprehensive income
and recognised in net profit or loss for the year.
(t) Financial year
As allowed under Section 323D(2) of the Corporations
Act 2001, the Directors have determined the financial
year to be a fixed period of 52 calendar or 53 calendar
weeks. For the period to 29 June 2014, the Group is
reporting on the 52 week period that began 1 July 2013
and ended 29 June 2014. For the period to 30 June
2013, the Group is reporting on the period commencing
1 July 2012 and ended on 30 June 2013.
For personal use only
(u) Standards and Interpretations issued not yet effective
At the date of authorisation of the financial report, the Standards and Interpretations
listed below were in issue but not yet effective.
Standard/Interpretation
Effective for annual
Expected to be
reporting period
initially applied in the
beginning on or after financial year ending
AASB 9 ‘Financial Instruments’, and the relevant amending standards1
1 January 2018
30 June 2019
AASB 1031 ‘Materiality’ (2013)
1 January 2014
30 June 2015
AASB 2012-3 ‘Amendments to Australian Accounting Standards
– Offsetting Financial Assets and Financial Liabilities’
1 January 2014
30 June 2015
AASB 2013-3 ‘Amendments to AASB 136
– Recoverable Amount Disclosures for Non-Financial Assets’
1 January 2014
30 June 2015
AASB 2013-4 ‘Amendments to Australian Accounting Standards
– Novation of Derivatives and Continuation of Hedge Accounting’
1 January 2014
30 June 2015
AASB 2013-9 ‘Amendments to Australian Accounting Standards
– Conceptual Framework, Materiality and Financial Instruments’
1 January 2014
30 June 2015
AASB 2014-1 ‘Amendments to Australian Accounting Standards’
- Part A: ‘Annual Improvements 2010–2012 and 2011–2013 Cycles’
- Part B: ‘Defined Benefit Plans: Employee Contributions (Amendments
to AASB 119)’
- Part C: ‘Materiality’
1 January 2014
30 June 2015
AASB 2014-1 ‘Amendments to Australian Accounting Standards’
– Part D: ‘Consequential Amendments arising from AASB 14’
1 January 2016
30 June 2017
AASB 2014-1 ‘Amendments to Australian Accounting Standards’
– Part E: ‘Financial Instruments’
1 July 2015
30 June 2016
1 The AASB has issued the following versions of AASB 9 and the relevant amending standards;
š$$6%ŕ)LQDQFLDO,QVWUXPHQWVŖ'HFHPEHU$$6%ŕ$PHQGPHQWVWR$XVWUDOLDQ$FFRXQWLQJ6WDQGDUGVDULVLQJIURP$$6%Ŗ
AASB 2012-6 ‘Amendments to Australian Accounting Standards – Mandatory Effective Date of AASB 9 and Transition Disclosures’
š$$6%ŕ)LQDQFLDO,QVWUXPHQWVŖ'HFHPEHU$$6%ŕ$PHQGPHQWVWR$XVWUDOLDQ$FFRXQWLQJ6WDQGDUGVDULVLQJIURP$$6%'HFHPEHUŖ
AASB 2012-6 ‘Amendments to Australian Accounting Standards – Mandatory Effective Date of AASB 9 and Transition Disclosure’.
š,Q-XQHWKH$$6%LVVXHG$PHQGPHQWVWR$XVWUDOLDQ$FFRXQWLQJ6WDQGDUGV3DUW(RI$$6%)LQDQFLDO,QVWUXPHQWVGHIHUVWKHDSSOLFDWLRQGDWH
of AASB 9 (December 2009) and the related consequential amendments in AASB 2009-11 to 1 January 2018.
š,Q'HFHPEHUWKH$$6%LVVXHG$$6%ŕ$PHQGPHQWWR$XVWUDOLDQ$FFRXQWLQJ6WDQGDUGVş&RQFHSWXDO)UDPHZRUN0DWHULDOLW\DQG)LQDQFLDO,QVWUXPHQWVŖ
Part C – Financial Instruments. This amending standard has amended the mandatory effective date of AASB 9 to 1 January 2017. For annual reporting periods beginning
before 1 January 2017, an entity may early adopt either AASB 9 (December 2009) or AASB 9 (December 2010) and the relevant amending standards.
At the date of authorisation of the financial statements, the following IASB Standards and IFRIC Interpretations were also
in issue but not yet effective, although Australian equivalent Standards and Interpretations have not yet been issued.
Standard/Interpretation
Effective for annual
Expected to be
reporting period
initially applied in the
beginning on or after financial year ending
Clarification of Acceptable Methods of Depreciation and Amortisation
(Amendments to IAS 16 and IAS 38)
1 January 2016
30 June 2017
IFRS 15 ‘Revenue from Contracts with Customers’
1 January 2017
30 June 2018
The Directors have not yet assessed the impact the adoption of these Standards and Interpretations in future periods
will have on the financial statements of the Group.
These Standards and Interpretations will be first applied in the financial statements of the Group that relates to the
annual reporting period beginning after the effective date of each pronouncement. In addition to the standards issued
above, other standards have been issued by the Australian Accounting Standards Board (the AASB), these standards are
not relevant to the operations of the Group.
Pental Limited 2014 Financial Report | 59 |
NOTES TO THE
FINANCIAL STATEMENTS
For personal use only
for the year (52 weeks) ended 29 June 2014
(Continued)
3. REVENUE
An analysis of the Group’s revenue for the year is as follows:
2014
$’000
2012
$’000
Sales revenue
Revenue from the sale of goods
80,722
79,061
80,722
79,061
Other revenue and income
Interest on bank deposits
52
84
Other revenue and income
284
382
Total Revenue from continuing operations
| 60 | Pental Limited 2014 Financial Report
336
466
81,058
79,527
For personal use only
4. SEGMENT INFORMATION
AASB 8 Operating Segments requires operating segments to be identified on the basis of internal reports about
components of the Group that are regularly reviewed by the chief operating decision maker in order to allocate
resources to the segment and to assess its performance. Information reported to the Group’s chief operating decision
maker for the purposes of resource allocation and assessment of performance is more specifically focused on the
Group’s one operating division, since the closure of its Speciality Chemicals business (discontinuing operations)
on 1 February 2013.
Information on segments
Inter-segment pricing is determined on an arm’s length basis.
Segment results, assets and liabilities include items directly attributable to a segment as well as those that can be
allocated on a reasonable basis. Unallocated items mainly comprise income-earning assets and revenue, interestbearing loans, borrowings and expenses, and corporate assets and expenses.
Segment capital expenditure is the total cost incurred during the period to acquire segment assets that are expected to
be used for more than one period.
Products and services within each segment
The Group comprises the following main segments, based on the Group’s management reporting system:
Segment
Product
Consumer Products (continuing operations)
Soaps, Detergents, Bleach and other fast moving consumer goods
Specialty Chemicals (discontinuing operations)
Oleine, Stearine, Glycerine, Distilled Fatty Acids
In presenting information on the basis of geographical segments, segment revenue is based on the geographical
location of customers. Segment assets and liabilities are located in Australia and are unable to be allocated to
individual geographical segments by location of customers on a reasonable basis. The Group’s segment revenue is
geographically as follows:
Geographical Location
Product
Australia
Soaps, Detergents and Bleach (Discontinued Operations: Oleine, Stearine, Glycerine)
New Zealand
Soaps, Detergents and Bleach (Discontinued Operations: Oleine, Stearine, Glycerine)
Africa
(Discontinued Operations: Oleine, Stearine, Glycerine)
Asia
(Discontinued Operations: Oleine, Stearine, Glycerine)
Europe
(Discontinued Operations: Oleine, Stearine, Glycerine)
Middle East
(Discontinued Operations: Oleine, Stearine, Glycerine)
Other
(Discontinued Operations: Oleine, Stearine, Glycerine)
Pental Limited 2014 Financial Report | 61 |
NOTES TO THE
FINANCIAL STATEMENTS
For personal use only
for the year (52 weeks) ended 29 June 2014
(Continued)
4. SEGMENT INFORMATION (CONTINUED)
Segment revenue and results
The following is an analysis of the Group’s revenue and results by primary business operating division.
Consumer Products
Specialty Chemicals
(Continuing Operations)
Segment revenue
Gross Sales
Less rebates and discounts
Segment results
Profit/(Loss) before significant income
and expenses, finance costs and tax
Significant items:
- profit on sale of brand
- loss on disposal of property, plant &
equipment
- business review costs and related
consultants costs
- impairment of property plant and
equipment
- profit on sale of property plant &
equipment
- debt forgiveness
- net impairment of brand names
- other closure costs
- employee restructuring costs
- rectification works
Total Significant Items
Segment earnings before interest & tax
Eliminations
Finance costs
Profit before tax
Income tax benefit/(expense)
Consolidated Profit for the year
Segment assets
Segment Assets
Eliminations
Total Assets
Segment liabilities
Segment Liabilities
Unallocated
Eliminations
Total Liabilities
Other segment information
Segment depreciation and amortisation
Additions to non-current assets
| 62 | Pental Limited 2014 Financial Report
Total
(Discontinuing operations)
2014
$’000
2013
$’000
2014
$’000
2014
$’000
2013
$’000
109,376
(28,654)
80,722
107,891
(28,830)
79,061
-
33,169
33,169
109,376
(28,654)
80,722
141,060
(28,830)
112,230
7,897
8,549
-
(1,806)
7,897
6,743
401
-
-
-
401
-
-
(67)
-
-
-
(67)
-
(61)
-
(61)
-
2013
$’000
-
(103)
-
-
-
(103)
-
-
-
3,466
-
3,466
401
8,298
143
(100)
(127)
8,422
-
10,000
(5,422)
(8,197)
(214)
(2,020)
401
8,298
(960)
7,338
(2,002)
5,336
10,000
143
(5,422)
(8,197)
(100)
(341)
6,402
(5,663)
739
1,154
1,893
90,108
90,536
70,780
80,288
160,888
(70,617)
90,271
170,823
(77,819)
93,004
(85,818)
(90,864)
(72)
(2,728)
(85,890)
(93,592)
(523)
69,157
(17,256)
(13,688)
76,358
(30,922)
1,793
1,069
-
-
1,793
1,069
5,016
2,306
-
102
5,015
2,408
For personal use only
Geographical information
The Group’s revenue by geographical location is detailed below.
2014
$’000
2013
$’000
Geographical sales from continuing operations
Australia
66,446
66,328
New Zealand
14,726
12,733
Total sales from continuing operations
80,722
79,061
-
33,169
80,722
112,230
Sales from discontinued operations
Total geographical sales
5. FINANCE COSTS
Interest on bank overdrafts and loans
Amortisation of borrowing costs
Other borrowing costs
Bank loan restructure fees
(Gain)/loss on derivative instruments (interest rate swap)
at fair value through profit and loss
2014
$’000
2013
$’000
1,610
4,928
-
1,178
160
150
-
468
(810)
(1,076)
Other interest expense
-
15
Total interest expense
960
5,663
Pental Limited 2014 Financial Report | 63 |
NOTES TO THE
FINANCIAL STATEMENTS
For personal use only
for the year (52 weeks) ended 29 June 2014
(Continued)
6. INCOME TAXES
Income tax recognised in profit or loss
2014
$’000
2013
$’000
Tax expense/(benefit) comprises:
Current tax expense/(benefit) in respect of the current year
Deferred tax expense/(income) relating to the origination
and reversal of temporary differences
Recognition of previously unrecognised tax losses
Total tax expense/(benefit)
242
(434)
1,941
(1,059)
(181)
339
2,002
(1,154)
The prima facie income tax expense/(benefit) on pre-tax accounting profit/ (loss) reconciles
to the income tax (benefit)/expense in the financial statements as follows:
2014
$’000
2013
$’000
Profit/(Loss) from operations
7,338
739
Income tax expense/(benefit) calculated at 30%
2,201
222
Non-assessable income
(18)
(3,000)
Non-assessable impairment losses/(write back) of brand names
-
(43)
Recognition of capital losses on disposal of property
-
(326)
Other
-
(5)
-
2,451
(181)
(792)
Impact of tax losses as a result of debt forgiveness
Recognition of previously unrecognised tax losses
Current year adjustments for prior years taxes
Income tax expense/(benefit) recognised in profit/(loss)
-
339
2,002
(1,154)
2,002
556
-
(1,710)
2,002
(1,154)
Comprising of:
Income tax expense from continuing operations
Income tax expense/(benefit) from discontinued operations
The tax rate used in the above reconciliation is the corporate tax rate of 30% payable by Australian corporate entities
on taxable profits under Australian tax law. There has been no change in the corporate tax rate when compared with
the previous reporting period.
| 64 | Pental Limited 2014 Financial Report
For personal use only
Income tax recognised directly in equity
2014
$’000
Deferred tax
Income and expenses taken directly to equity:
Share issue costs
Revaluations of financial instruments treated as cash flow hedges
2013
$’000
44
46
90
516
(1)
515
Deferred tax balances
Deferred tax assets/(liabilities) arise from the following:
Deferred tax assets
Doubtful debts
Provisions
Share issue costs
Foreign currency items
and interest rate swap
Stock obsolescence
Accruals
Tax losses
Deferred tax liabilities
Property, plant and
equipment
Cash flow hedges
Foreign currency items
Other
Net deferred tax asset
2014
Opening
balance
$’000
2013
Charged
to income
$’000
Charged
to equity
$’000
Closing
balance
$’000
53
575
567
(14)
(80)
(189)
44
39
495
422
243
(243)
46
24
25
1,487
3,229
4,716
19
4
(503)
(1,401)
(1,904)
(1,164)
(20)
(114)
(1,298)
3,418
Opening
balance
$’000
Charged
to income
$’000
Charged
to equity
$’000
Closing
balance
$’000
1
906
255
52
(331)
(204)
516
53
575
567
46
567
(324)
-
243
90
90
43
29
1,074
1,828
2,902
89
113
1,931
3,376
5,307
(65)
(88)
(960)
(147)
(1,107)
516
516
24
25
1,487
3,229
4,716
(41)
-
(1,205)
(3,463)
2,299
-
(1,164)
16
(12)
(37)
(1,941)
90
(4)
(126)
(1,335)
1,567
(3,463)
1,844
(19)
(114)
2,166
1,059
(1)
(1)
515
(20)
(114)
(1,298)
3,418
Based on the year ending 28 June 2015 financial budgets approved by the Board, the Group is confident that it will
be able to generate future taxable profits in excess of the profits arising from the reversal of existing temporary
differences to enable the utilisation and recovery of its deferred tax assets.
Pental Limited 2014 Financial Report | 65 |
For personal use only
NOTES TO THE
FINANCIAL STATEMENTS
For personal use only
for the year (52 weeks) ended 29 June 2014
(Continued)
6. INCOME TAXES (CONTINUED)
Tax consolidation
Relevance of tax consolidation to the Group
The company and its wholly-owned Australian resident entities have formed a tax-consolidated group, and are
therefore taxed as a single entity from that date. The head entity within the tax-consolidated group is Pental Limited.
The members of the tax-consolidated group are identified at Note 11.
Nature of tax funding arrangements and tax sharing agreements
Entities within the tax-consolidated group have entered into a tax funding arrangement and a tax-sharing agreement
with the head entity. Under the terms of the tax funding arrangement, Pental Limited and each of the entities in the
tax-consolidated group has agreed to pay a tax equivalent payment to or from the head entity, based on the current
tax liability or current tax asset of the entity. Such amounts are reflected in amounts receivable from or payable to
other entities in the tax-consolidated group. The tax sharing agreement entered into between members of the taxconsolidated group provides for the determination of the allocation of income tax liabilities between the entities should
the head entity default on its tax payment obligations or if an entity should leave the tax-consolidated group. The effect
of the tax sharing agreement is that each member’s liability for tax payable by the tax-consolidated group is limited to
the amount payable to the head entity under the tax funding arrangement.
Unrecognised taxable temporary differences associated with investments and interests
In accordance with AASB112.81, there are no taxable temporary differences in relation to investments in subsidiaries,
branches and associates and interests in joint ventures for which deferred tax assets or liabilities have not been recognised.
7. PROFIT FOR THE YEAR
Profit for the year has been arrived at after charging the following expenses:
2014
$’000
2013
$’000
EXPENSES
Cost of sales
Depreciation: Plant and equipment
Amortisation: Software
Total depreciation and amortisation
Impairment loss recognised on trade receivables
Loss on sale of property
Profit on sale of brand name
43,159
42,295
1,583
905
210
164
1,793
1,069
50
-
-
67
401
-
1,079
769
10,509
10,125
11,588
10,894
979
166
EMPLOYEE BENEFITS EXPENSE:
Post-employment benefits – defined contribution plans
Other employee benefits
Operating lease minimum payments
Pental Limited 2014 Financial Report | 67 |
NOTES TO THE
FINANCIAL STATEMENTS
For personal use only
for the year (52 weeks) ended 29 June 2014
(Continued)
8. EARNINGS PER SHARE
2014
cents
per share
2013
cents
per share
From continuing and discontinued operations:
Basic earnings per share
0.34
0.20
Diluted earnings per share
0.33
0.20
Basic earnings per share
0.34
0.24
Diluted earnings per share
0.33
0.24
From continuing operations
The earnings/ (loss) and weighted average number of ordinary shares used in the calculation of basic
and diluted earnings/ (loss) per share are as follows:
2014
$’000
2013
$’000
Net profit
5,336
1,893
Earnings used in the calculation of basic EPS
5,336
1,893
Earnings used in the calculation of diluted EPS
5,336
1,893
Weighted average number of ordinary shares for the purposes of basic EPS
2014
No.
1,561,600,148
2012
No.
924,197,848
Weighted average number of ordinary shares for the purposes of diluted EPS
1,625,019,635
924,197,848
Classification of securities as ordinary shares
The following securities have been classified as ordinary shares and included in basic earnings per share:
1. ordinary shares
Classification of securities as potential ordinary shares
The following securities have been classified as potential ordinary shares and included in diluted earnings per share only:
(a) options outstanding under the option incentive plan
(b) options outstanding under the loyalty options bonus issue ; and
(b) options outstanding issued to Directors.
During the financial year 290,030,470 options were exercised and as a result 290,030,470 ordinary shares were issued
under the Company’s loyalty options bonus issue where all shareholders are entitled to 1 option for every share held.
Refer to Note 20(b).
The following potential ordinary shares are anti-dilutive and are therefore excluded from the weighted average number
of ordinary shares for the purposes of diluted earnings per share.
Piggy Back Options (exercise price of $0.03)
| 68 | Pental Limited 2014 Financial Report
2014
No.
2013
No.
287,331,469
375,181,180
For personal use only
9. TRADE AND OTHER RECEIVABLES
2014
$’000
2013
$’000
Current
Trade receivables (i)
Allowance for doubtful debts
24,817
22,579
(180)
(178)
24,637
22,401
89
33
24,726
22,434
Other (ii)
(i)
(ii)
The average credit period on sales of goods is 60 days. No interest is charged on trade receivables. An allowance
has been made for estimated irrecoverable trade receivable amounts arising from the past sale of goods,
determined by reference to specific customers where receipt is in doubt. During the current financial year, any
doubtful debt movements were recognised in profit/ (loss) for the year.
Before accepting any new customers, the Group will perform a credit check to assess the potential customer’s
credit quality and defines credit limits by customer. Limits are reviewed as necessary. Of the trade receivables
balance at the end of the year $21.615 million is due from four customers (2013: $19.793 million) and these four
customers account for 87.0% of total sales revenue from continuing operations for the year (2013: 87.0%). There
are no other customers who represent more than 5% of the total balance of trade receivables or total sales
revenues from continuing operations for the year. Debtors who are past due at the end of the reporting period
have not been provided for on the whole, as there has not been a significant change in credit quality and the
amounts are still considered recoverable. The Group does not hold any collateral over these balances.
Other receivables generally arise from transactions outside the usual operating activities of the Group. Collateral
is generally not obtained.
2014
$’000
2013
$’000
Ageing of past due but not impaired
Overdue 31 to 60 days
441
623
Overdue 61 to 90 days
138
314
Overdue 91 days and beyond
281
696
Total
860
1,633
2014
$’000
2013
$’000
Movement in the allowance for doubtful debts
Balance at the beginning of the year
Amount provided during the year
Balance at the end of the year
178
5
2
173
180
178
In determining the recoverability of a trade receivable, the Group considers any change in the credit quality of the trade
receivable from the date credit was initially granted up to the reporting date. The concentration of credit risk is limited
due to the customer base being large and unrelated. Accordingly, the directors believe that there is no further credit
provision required in excess of the allowance for doubtful debts.
Pental Limited 2014 Financial Report | 69 |
NOTES TO THE
FINANCIAL STATEMENTS
For personal use only
for the year (52 weeks) ended 29 June 2014
(Continued)
10. INVENTORIES
2014
$’000
Raw materials
2,772
Work in progress
Finished goods
2013
$’000
2,151
157
205
6,016
7,908
8,945
10,264
11. SUBSIDIARIES
Country of
incorporation
Name of subsidiary
Ownership interest
2014
%
2013
%
Parent Entity
Australia
Pental Limited (i)
Controlled Entities
Pental Products Pty Ltd (ii) (iii)
Australia
100%
100%
Symex Subco 2 Pty Ltd
Australia
100%
100%
(ii) (iii)
(i)
Pental Limited is the head entity within the tax-consolidated group.
(i)
These companies are members of the tax-consolidated group.
(iii) These wholly-owned subsidiaries have entered into a deed of cross guarantee with Pental Limited pursuant to ASIC Class Order 98/1418
and are relieved from the requirement to prepare and lodge an audited financial report.
The parent entity and all the controlled entities are party to the deed of cross guarantee therefore the consolidated
statement of profit or loss and other comprehensive income and statement of financial position reflects the
statement of profit or loss and other comprehensive income and statement of financial position of the parties to the
deed of cross guarantee.
| 70 | Pental Limited 2014 Financial Report
For personal use only
12. PROPERTY, PLANT AND EQUIPMENT
Plant &
equipment
at cost
$’000
Construction
in progress
at cost
$’000
Total
$’000
Gross carrying amount
Balance at 1 July 2012
13,233
701
13,934
Additions
143
2,056
2,199
Disposals
(282)
-
(282)
Transfer from capital works
701
(701)
-
13,795
2,056
15,851
Additions
3,873
756
4,629
Disposals
(635)
-
(635)
Transfer from capital works
2,056
(2,056)
-
19,089
756
19,845
(4,392)
-
(4,392)
(905)
-
(905)
180
-
180
68
-
68
(103)
-
(103)
Balance at 30 June 2013
(5,152)
-
(5,152)
Depreciation expense
(1,583)
-
(1,583)
635
-
635
(6,100)
-
(6,100)
8,643
2,056
10,699
12,989
756
13,745
Balance at 30 June 2013
Balance at 29 June 2014
Accumulated depreciation
Balance at 30 June 2012
Depreciation expense
Eliminated on disposal of assets
Reversal of impairment losses recognised in profit or loss
Impairment losses recognised in profit or loss
Eliminated on disposal of assets
Balance at 29 June 2014
Net book value as at 30 June 2013
Net book value as at 29 June 2014
Pental Limited 2014 Financial Report | 71 |
NOTES TO THE
FINANCIAL STATEMENTS
For personal use only
for the year (52 weeks) ended 29 June 2014
(Continued)
13. GOODWILL
2014
$’000
Cost
Accumulated impairment losses
2013
$’000
70,416
70,416
(45,332)
(45,332)
25,084
25,084
Gross carrying amount
Balance at beginning of financial year
70,416
70,416
Balance at end of financial year
70,416
70,416
Accumulated impairment losses
Balance at beginning of financial year
45,332
45,332
Balance at end of financial year
45,332
45,332
Allocation of goodwill to cash-generating units
Goodwill has been allocated for impairment testing over the Consumer Products business Unit. The Pental brand
names (refer Note 14) are included in the Consumer Products cash generating unit. The recoverable amount of the
Consumer Products cash generating unit is determined based on a value in use calculation, which uses cash flow
projections based on a financial budget approved by the Board, covering a five year period and a discount rate of
15.0% (2013: 15.4%). The cash flow has been extrapolated using a 3% (2013: 3%) growth rate including an inflation
rate of 2.5% (2013: 2.5%). The directors believe that any reasonable possible change in the key assumptions on which
recoverable amount is based would not cause the carrying amount to exceed the recoverable amount of the cash
generating unit.
| 72 | Pental Limited 2014 Financial Report
For personal use only
14. OTHER INTANGIBLE ASSETS
Brand
names
$’000
Software
at cost
$’000
Total
$’000
Gross carrying amount
Balance at 30 June 2012
Additions
Balance at 30 June 2013
19,189
1,235
20,424
-
209
209
19,189
1,444
20,633
Additions
-
387
387
Disposals
(189)
(628)
(817)
19,000
1,203
20,203
(4,605)
(759)
(5,364)
-
(164)
(164)
500
-
500
Balance at 29 June 2014
Accumulated Impairment/Amortisation
Balance at 30 June 2012
Amortisation expense
Reversal of impairment losses recognised in profit and loss
Impairment losses recognised in profit and loss
(356)
-
(356)
(4,461)
(923)
(5,384)
Amortisation expense
-
(210)
(210)
Eliminated on Disposal of Assets
-
628
628
Balance at 29 June 2014
(4,461)
(505)
(4,966)
Net book value as at 30 June 2013
14,728
521
15,249
Net book value as at 29 June 2014
14,539
698
15,237
Balance at 30 June 2013
Pental Limited 2014 Financial Report | 73 |
NOTES TO THE
FINANCIAL STATEMENTS
For personal use only
for the year (52 weeks) ended 29 June 2014
(Continued)
15. OTHER ASSETS
2014
$’000
419
2013
$’000
380
2014
$’000
8,853
2013
$’000
7,247
Trade spend liabilities
4,424
3,881
Sundry payables
1,826
2,378
15,103
13,506
Prepayments
16. TRADE AND OTHER PAYABLES
Trade payables
The average credit period on the purchases of goods ranges from 7 to 35 days. No interest is charged on the trade
payables. The Group has financial risk management policies in place to ensure that, as often as possible, all payables
are paid within a reasonable timeframe.
17. OTHER FINANCIAL LIABILITIES
2014
$’000
2013
$’000
Current
Foreign currency forward contracts
154
-
-
810
154
810
Interest rate swap not designated in hedge accounting relationship
Sales of the White
King Bathroom Gel
750mL has increased
by 12.5% to bring it
into the Top 5 cleaning
products in the
Bathroom Cleaners
segment, nationally.
Source AZTEC Data, moving annual total to 24/08/2014.
| 74 | Pental Limited 2014 Financial Report
For personal use only
18. BORROWINGS
2014
$’000
2013
$’000
Current
Multi option bank overdraft, secured
523
-
Receivable finance loan, secured
-
1,132
Fully drawn advance bank loan, secured
-
500
523
1,632
Non current
Fully drawn advance bank loan, secured
-
12,056
-
12,056
523
13,688
– Bank overdraft
523
-
– Bank Guarantee
324
-
Total Borrowings
Summary of financing arrangements
Facilities utilised at reporting date:
Multi option loan facility
Receivable finance loan
-
1,132
Fully drawn advance bank loan
-
12,556
847
13,688
15,127
-
Facilities not utilised at reporting date:
Multi option loan facility
– Bank overdraft
– Bank Guarantee
Receivable finance loan
26
-
-
13,868
15,153
13,868
Multi option loan facility
The Group has a multi option loan facility with the ANZ bank that allows the Group to choose the appropriate type of
funding facility to suit its business needs under one interest rate. The multi option facility can be used as a bank overdraft,
variable rate fully drawn advance, cash advance, standby letter of credit/guarantee and/or trade finance facility.
Whilst the overall banking facility with ANZ was extended to 28 February 2017, and therefore, not due to be repaid
or renegotiated until the financial year ending 30 June 2017, due to the nature of the facility, amounts are continually
repaid and redrawn based on the Company’s working capital requirements. As a result amounts due at 29 June 2014
in respect of this facility have been disclosed as current in these financial statements.
The multi option facility has a facility limit of $16,000,000 (2013: ANZ fully drawn advance of $12,556,000 and
receivable finance loan facility of $15,000,000 have both been discontinued). The multi option facility bears an interest
rate of 3.82% plus a line fee of 0.9% (2013: ANZ fully drawn advance was 9.13% and 6.74% plus line fee of 0.92% for
receivable finance loan) as at 29 June 2014. The financing arrangement is secured by the Group’s assets through first
ranking fixed and floating charges over the Company and its subsidiaries (with corresponding cross guarantee).
Pental Limited 2014 Financial Report | 75 |
For personal use only
WASH AWAY THE CITY
WITH COUNTRY LIFE SOAPS
NOTES TO THE
FINANCIAL STATEMENTS
For personal use only
for the year (52 weeks) ended 29 June 2014
(Continued)
19. PROVISIONS
Current
Employee benefits
Non current
Employee benefits
Total Provisions
2014
$’000
2013
$’000
1,364
1,364
2,810
2,810
112
112
1,476
108
108
2,918
20. ISSUED CAPITAL
(a) Fully paid ordinary shares
Share Capital
Opening balance of ordinary shares, fully paid
Placement of shares
Rights issue
Options converted to shares
Balance at end of financial year
Fully paid ordinary shares
Balance at beginning of financial year
Placement of Shares (28,739,023 shares at $0.015)
Rights Issue (1,283,746,959 shares at $0.015)
Options converted to shares (289,523,193 shares at $0.02)
Options converted to shares (507,277 shares at $0.03)
Share issue costs
Income tax relating to share issue costs
Balance at end of financial year
2014
No.
2013
No.
1,504,398,685 191,593,493
28,739,023
- 1,283,746,959
290,030,470
319,210
1,794,429,155 1,504,398,685
2014
$’000
78,309
5,791
15
(145)
44
84,014
2013
$’000
59,783
431
19,256
6
(1,683)
516
78,309
Holders of ordinary shares are entitled to receive dividends as declared from time to time and are entitled to one vote
per share at shareholders’ meetings.
In the event of winding up of the Company, ordinary shareholders rank after all creditors and are fully entitled to any
proceeds of liquidation.
Changes to the then Corporations Law abolished the authorised capital and par value concept in relation to share
capital from 1 July 1998. Therefore, the company does not have a limited amount of authorised capital and issued
shares do not have a par value.
Pental Limited 2014 Financial Report | 77 |
NOTES TO THE
FINANCIAL STATEMENTS
For personal use only
for the year (52 weeks) ended 29 June 2014
(Continued)
(b) Options
On 15 November 2013 the Company issued a Piggy Back Options Prospectus to encourage Loyalty Option holders to
exercise their Loyalty Options early. Loyalty Options holders that exercised their right by 29 November 2013 to acquire
one fully paid ordinary share were issued one free Piggy Back option. As a result the Company issued 287,838,746
Piggy Back Options and 290,030,470 shares (including 507,277 shares issued as a result of piggy back options being
exercised) during the period ended 29 June 2014, raising $5.806 million less share issue costs of $0.101 million (net of
tax).
As at 29 June 2014, the Company had 85,657,987 Loyalty Options (ASX code: PTLO) on issue, exercisable on a 1:1 basis
for entitled ordinary shareholders at an exercise price of $0.02. The Loyalty Options expire on 11 September 2014 and
carry no rights to dividends and no voting rights.
The company also has 287,331,469 Piggy Back Options (ASX code: PTLOA) on issue exercisable on a 1:1 basis for
entitled ordinary shareholders at an exercise price of $0.03. The Piggy Back Options expire on 6 June 2015 and carry
no rights to dividends and no voting rights.
21. RESERVES
2014
$’000
Hedging
2013
$’000
(108)
-
(108)
-
Reconciliation of reserves:
2014
$’000
2013
$’000
Hedging reserve
Balance at beginning of financial year
Gain/(loss) recognised on forward exchange contracts
Deferred Tax arising on hedges
Balance at end of financial year
-
(3)
(154)
4
46
(1)
(108)
-
The hedging reserve represents hedging gains and losses recognised on the effective portion of cash flow hedges.
The cumulative deferred gain or loss on the hedge is recognised in profit or loss when the hedged transaction impacts
the profit or loss.
| 78 | Pental Limited 2014 Financial Report
For personal use only
22. ACCUMULATED LOSSES
2014
$’000
Balance at beginning of financial year
2013
$’000
(16,227)
(16,203)
-
(1,917)
5,336
1,893
Restatement
Net profit attributable to members of parent entity
Dividends provided for or paid
Balance at end of financial year
-
-
(10,891)
(16,227)
23. DIVIDENDS
2014
Cents
per share
2013
Total
$’000
Cents
per share
Total
$’000
Fully paid ordinary shares
Interim dividend: Fully franked at 30% tax rate
-
-
-
-
Final dividend: Fully franked at 30% tax rate
-
-
-
-
-
-
-
-
(i)
(i) In respect of the year (52 weeks) ended 29 June 2014 the Company will pay a full year fully franked dividend of 0.12 cents per ordinary share, payable on 30 September 2014,
with a record date of 12 September 2014 (2013: Nil). No interim dividend was paid (2013: Nil).
Adjusted franking account balance
Impact on franking account balance of dividend not recognised
2014
$’000
2013 (i)
$’000
17,465
17,465
-
-
(i) Restated due to re-calculation of franking account.
Pental Limited 2014 Financial Report | 79 |
NOTES TO THE
FINANCIAL STATEMENTS
For personal use only
for the year (52 weeks) ended 29 June 2014
(Continued)
24. FINANCIAL INSTRUMENTS
(a) Capital risk management
The Group manages its capital to ensure that entities in the Group will be able to continue as a going concern while
maximising the return to stakeholders through the optimisation of the debt and equity balance.
The capital structure of the Group consists of debt, which includes the borrowings disclosed in Note 18, cash, and
equity attributable to equity holders of the parent, comprising issued capital, reserves and retained earnings/
(accumulated losses), as disclosed in notes 20, 21 and 22.
Operating cash flows are used to maintain and expand the Group’s assets, as well as to make the routine outflows of
payables, tax, dividends and repayment of debt.
Gearing ratio
The Board of Directors reviews the capital structure on an ongoing basis. As a part of this review the Board considers
the cost of capital and the risks associated with each class of capital. Based on recommendations of the Board, the
Group will balance its overall capital structure through the payment of dividends, new share issues, and the issue or
repayment of debt.
The gearing ratio at year end was as follows:
2014
$’000
2013
$’000
Financial assets
Debt (i) (ii)
Cash and cash equivalents
523
13,688
(548)
(5,476)
Net debt
(25)
8,212
Equity (iii)
73,015
62,082
Net debt to equity ratio
(0.0%)
13.2%
(i) Debt is defined as long and short-term borrowings, as detailed in Note 18.
(ii) All outstanding debt is consolidated into the parent entity.
(iii) Equity includes all issued capital and reserves.
| 80 | Pental Limited 2014 Financial Report
For personal use only
(b) Categories of financial instruments
At the reporting date there are no significant concentrations of credit risk relating to loans and receivables at fair value
through profit or loss. The carrying amount reflected in the statement of financial position represents the Group’s
maximum exposure to credit risk for such loans and receivables.
2014
$’000
2013
$’000
Financial assets
Cash and cash equivalents
Trade and other receivables
548
5,476
24,726
22,434
Financial liabilities
Trade and other payables
15,103
13,506
Borrowings
523
13,688
Derivative instruments at fair value through profit and loss
154
810
(c) Financial risk management objectives
The Group’s finance function provides services to the business by monitoring and managing the financial risks
relating to the operations through internal risk reports which analyse exposures by degree and magnitude of risk.
The Group’s activities expose it primarily to the financial risks of changes in foreign currency exchange rates
and interest rates. The Group enters into forward foreign currency contracts to manage its exposure to foreign
currency exchange rate fluctuations where it has entered into fixed price contracts and interest rate swaps to
mitigate the risk of rising interest rates.
The Group does not enter into or trade financial instruments, including derivative financial instruments, for
speculative purposes. The use of financial instruments is governed by the Group’s policies approved by the
Board of Directors. The Chief Financial Officer is responsible for managing the Group’s treasury requirements
in accordance with this policy.
(d) Market risk
The Group’s activities expose it primarily to the financial risks of changes in foreign currency exchange rates and
interest rates. The Group enters into derivative financial instruments to manage its exposure to foreign currency
risk and interest rate risk, including:
š IRUZDUGIRUHLJQFXUUHQF\FRQWUDFWVWRPDQDJHLWVH[SRVXUHWRIRUHLJQFXUUHQF\H[FKDQJHUDWHIJXFWXDWLRQV
(refer notes 24(c) and 24(e)); and
š ,QWHUHVWUDWHVZDSVWRPLWLJDWHWKHULVNRIULVLQJLQWHUHVWUDWHV
Pental Limited 2014 Financial Report | 81 |
NOTES TO THE
FINANCIAL STATEMENTS
For personal use only
for the year (52 weeks) ended 29 June 2014
(Continued)
(e) Foreign currency risk management
The Group undertakes transactions denominated in foreign currencies; consequently, exposures to exchange rate
fluctuations arise. Where appropriate, exchange rate exposures are managed within approved policy parameters
utilising forward exchange contracts or by offsetting import and export currency exposures.
The carrying amounts of the Group’s foreign currency denominated monetary assets and monetary liabilities at the
end of the reporting period are as follows:
Assets
Currency of USA
Liabilities
2014
$’000
130
2013
$’000
165
2014
$’000
350
Currency of New Zealand
2013
$’000
41
4,317
2,452
545
400
Currency of England
-
-
-
39
Currency of Fiji
6
-
-
-
Currency of Europe
-
-
7
-
Forward foreign exchange contracts
The Group enters into forward foreign exchange contracts to hedge a proportion of anticipated sales and purchase
commitments denominated in foreign currencies (principally US Dollars and New Zealand Dollars) expected in
each month. The amount of anticipated future sales is forecast in light of current conditions in foreign markets,
commitments from customers and experience.
The following table sets out the gross contract value to be received/paid under forward foreign currency contracts, the
weighted average contracted exchange rates and settlement periods of outstanding contracts for the Group.
Weighted av.
exchange rate
2014
Foreign currency
FC’000
2013
2014
Contract value
$’000
2013
2014
Fair value gain/(loss)
$’000
2013
2014
2013
Buy USD – less than one year
0.9060
-
2,421
-
2,672
-
(83)
-
Buy Euro – less than one year
0.6431
-
103
-
160
-
(10)
-
Sell NZD – less than one year
1.0938
-
5,000
-
4,571
-
(61)
-
(154)
-
As at reporting date, the aggregate amount of unrealised gains/(losses) under forward foreign currency contracts relating
to anticipated future contracts is $0.154 million - tax effected $0.108 million (2013: Nil - tax effected Nil). In the current
year, these unrealised gains/ (losses) have been deferred in the hedging reserve to the extent the hedge is effective.
Foreign currency sensitivity analysis
The Group is mainly exposed to USD and NZD currencies. The following table details the Group’s sensitivity to a 5 cent
increase and decrease in the Australian dollar against the relevant foreign currencies. The analysis includes all trade
receivables and payables outstanding at year end.
USD impact
EUR impact
NZD impact
FJD impact
GBP impact
Profit
2014
$’000
14
2013
$’000
6
2014
$’000
9
2013
$’000
-
2014
$’000
182
2013
$’000
88
2014
$’000
-
2013
$’000
-
2014
$’000
-
2013
$’000
4
Equity
156
-
14
-
219
-
-
-
-
-
| 82 | Pental Limited 2014 Financial Report
For personal use only
(f) Interest rate risk management
The Group is exposed to interest rate risk as entities in the Group borrow funds at both fixed and floating interest rates.
The risk is managed by the Group by the use of interest rate swap contracts. Hedging activities are evaluated regularly to
align with interest rate views and defined risk appetite, ensuring the most cost-effective hedging strategies are applied.
The following table details the Group’s exposure to interest rate and liquidity risk. The table includes both interest and
principal cash flows.
Weighted
average
interest
rate
Less
than
1 month
$’000
1-3
months
$’000
3 months
to
1 year
$’000
Financial assets
Variable interest rate instruments
Non-interest bearing
0.09%
-
548
12,814
13,362
11,913
11,913
-
-
-
548
24,726
25,274
Financial liabilities
Non-interest bearing
Fixed interest rate instruments
3.82%
7,625
525
8,150
7,479
7,479
-
-
-
15,103
525
15,628
Weighted
average
interest
rate
Less
than
1 month
$’000
1-3
months
$’000
3 months
to
1 year
$’000
Financial assets
Variable interest rate instruments
Non-interest bearing
0.19%
-
5,476
12,224
17,700
10,388
10,388
-
-
-
5,476
22,612
28,088
Financial liabilities
Non-interest bearing
Variable interest rate instruments
Fixed interest rate instruments
6.74%
9.13%
6,896
1,138
108
8,142
6,610
216
6,826
1,002
1,002
10,577
10,577
4,124
4,124
13,506
1,138
16,027
30,671
2014
2013
1-5
years
$’000
5+
years
$’000
1-5
years
$’000
Total
$’000
5+
years
$’000
Total
$’000
Interest rate sensitivity
The sensitivity analyses below have been determined based on the exposure to interest rates for both derivative
and non-derivative instruments at the reporting date and the stipulated change taking place at the beginning of the
financial year and held constant throughout the reporting period. A 50 basis point increase or decrease is used when
reporting interest rate risk internally to key management personnel.
At reporting date, if interest rates had been 0.5% higher or lower and all other variables held constant, there would
be $36,000 (2013: Nil – fixed interest rate swap expired 7 February 2014) effect on the Group’s profit for the period,
attributable to the Group’s exposure to interest rates on its variable rate borrowings. The Group’s sensitivity to interest
rates has decreased during the current year due to the reduction in borrowings and expiry of the Group’s fixed rate
debt instruments.
Pental Limited 2014 Financial Report | 83 |
NOTES TO THE
FINANCIAL STATEMENTS
For personal use only
for the year (52 weeks) ended 29 June 2014
(Continued)
Interest rate swap contracts
Under interest rate swap contracts, the Group agrees to exchange the difference between fixed and floating rate
interest amounts calculated on agreed notional principal amounts. Such contracts enable the Group to mitigate the
cash flow exposures on the variable rate borrowings. The fair value of interest rate swaps at the reporting date is
determined by discounting the future cash flows using the curves at reporting date and the credit risk inherent in the
contract and are disclosed below.
Following the restructure of the banking facility during the year and the significant reduction in borrowings, hedging
of interest rates was considered not to be a high risk, however exposure to interest rate fluctuations is monitored
monthly should the Group’s debt profile change in the future. As at 29 June 2014, total borrowings was $0.523 million
(2013:$13.688 million).
The average interest rate is based on the outstanding balances at the end of the financial year.
The following table details the notional principal amounts and remaining terms of interest rate swap contracts
outstanding as at reporting date for the Group.
Average fixed
interest rate
%
2014
2013
Less than 1 year
-
5.78
Notional
principal amount
$’000
2014
2013
-
42,511
Fair value
gain/(loss)
$’000
2014
2013
-
(810)
-
(810)
The prior year interest rate swaps were settled on a monthly basis. The floating rate on the interest rate swaps is the
30 day Bank bill swap rate (BBSY). The Group settled the difference between the fixed and floating interest rate on a
net basis.
(g) Credit risk management
Credit risk management refers to the risk that a counterparty will default on its contractual obligations resulting in financial
loss to the Group. The Group has adopted a policy of only dealing with creditworthy counterparties and obtaining sufficient
collateral, where appropriate, as a means of mitigating the risk of financial loss from defaults. The Group’s exposure and
the credit ratings of its counterparties are continuously monitored and the aggregate values of transactions concluded are
spread amongst approved counterparties. The Group measures credit risk on a fair value basis.
Trade accounts receivable consist of a number of customers supplying the retail sector in Australia and New Zealand.
Ongoing credit evaluation is performed on the financial condition of accounts receivable and, where appropriate, credit
guarantees are obtained.
The Group has significant credit risk exposure with the Woolworths Limited, Wesfarmers Ltd, Metcash Ltd and Foodstuffs
(Auckland) Ltd Groups which represent 84% of the total trade receivables less related allowances and rebates of the
Consumer Products business.
The credit risk on liquid funds and derivative financial instruments is limited because the counterparties are banks with
high credit-ratings assigned by international credit-rating agencies.
The carrying amount of financial assets recorded in the financial statements, net of any allowances for losses, represents
the Group’s maximum exposure to credit risk without taking accounts of the value of any collateral obtained.
(h) Liquidity risk management
The Group manages liquidity risk by maintaining adequate reserves, banking facilities and reserve borrowing facilities by
continuously monitoring forecast and actual cash flows and matching the maturity profiles of financial assets and liabilities.
| 84 | Pental Limited 2014 Financial Report
For personal use only
(i) Fair value of financial instruments
The directors consider that the carrying amounts of financial assets and liabilities recorded in the financial statements
approximate their fair values.
š WKHIDLUYDOXHRIıQDQFLDODVVHWVDQGıQDQFLDOOLDELOLWLHVZLWKVWDQGDUGWHUPVDQGFRQGLWLRQVDQGWUDGHGRQDFWLYH
liquid markets are determined with reference to quoted market prices;
š WKHIDLUYDOXHRIRWKHUıQDQFLDODVVHWVDQGOLDELOLWLHVDUHGHWHUPLQHGLQDFFRUGDQFHZLWKJHQHUDOO\DFFHSWHGSULFLQJ
models based on discounted cash flow analysis; and
š WKHIDLUYDOXHRIGHULYDWLYHLQVWUXPHQWVLQFOXGHGLQKHGJLQJDVVHWVDQGOLDELOLWLHVDUHFDOFXODWHGXVLQJTXRWHGSULFHV
which is a Level 2 fair value measurement. Where such prices are not available use is made of discounted cash flow
analysis using the applicable yield curve for the duration of the instruments.
25. SHARE-BASED PAYMENTS
The Company is reviewing an executive performance rights plan to provide long term incentives aligned
to Company performance.
Under the previous executive option incentive plan (that will be replaced by a new executive performance rights plan),
there were no share options granted during the 2014 year (2013: nil).
During or since the end of the financial year, no fully paid ordinary shares were issued by the Group as a result of the
exercise of options under the executive option incentive plan.
26. KEY MANAGEMENT PERSONNEL COMPENSATION
The aggregate compensation of the key management personnel of the Group is set out below
Short-term employee benefits
Post-employment benefits
2014
$
2013
$
1,210,560
1,211,324
143,550
124,073
1,354,110
1,335,397
Pental Limited 2014 Financial Report | 85 |
NOTES TO THE
FINANCIAL STATEMENTS
For personal use only
for the year (52 weeks) ended 29 June 2014
(Continued)
27. RELATED PARTY TRANSACTIONS
The compensation of each member of the key management personnel of the Group is set out in the
Remuneration Report.
Transactions with key management personnel
There were no services performed by key management personnel outside of normal business operations.
On the 2 November 2012, the Group entered into a Banking facility with its primary banker - ANZ which included a
condition that if the sale of the Shepparton properties did not eventuate in an open market by 31 May 2013, a director
related entity of Mr Johnstone would exercise the option to purchase the Shepparton properties for a net amount
of not less than $6.000 million. As an open market sale did not eventuate, a director related entity of Mr Johnstone
purchased the Shepparton properties for $6.000 million on 28 June 2013 and entered into a lease agreement for the
Shepparton properties. The key terms of the lease are as follows:
(i) the base annual rent payable of $0.650 million per annum (plus GST and outgoings) and subject to annual CPI
reviews;
(ii) the term of the lease is 10 years with an option of two further terms of five years each;
(iii) the Group provided a bank guarantee as security for the performance of the lease in the amount of $0.163 million;
and
(iv) the Group has an option to buy the Shepparton properties from the director related entity which is exercisable from
1 July 2017 to 30 June 2019 at a price to be determined by reference to director related entity costs of acquisition
plus the cost of any capital expenses incurred by the director related entity in respect of the Shepparton Site.
Equity interests in subsidiaries
Details of interests in subsidiaries are set out in note 11.
The Company purchases goods and services from, and sells goods and services to, its controlled entity Pental Products
Pty Ltd in the normal course of business and on normal terms and conditions. No interest is charged on the loans made
to subsidiaries.
The aggregate amount receivable from and payable to, wholly owned group entities by the Company at balance date
are as follows:
Non-current loans to subsidiaries
| 86 | Pental Limited 2014 Financial Report
2014
$
62,824,404
2013
$
69,810,524
For personal use only
28. CASH AND CASH EQUIVALENTS
(a) Reconciliation of cash and cash equivalents
For the purposes of the cash flow statement, cash includes cash on hand and at bank and bank loans. Cash and cash
equivalents at the end of the financial year as shown in the cash flow statement is reconciled to the related items in the
statement of financial position as follows:
2014
$’000
548
(523)
25
2013
$’000
5,476
(1,132)
4,344
2014
$’000
5,336
1,793
(810)
(401)
-
2013
$’000
1,893
1,069
(1,078)
(3,466)
1,178
103
(10,000)
(143)
Changes in net assets and liabilities, net of effects from acquisition of businesses:
(Increase)/decrease in assets:
Trade and other receivables
Inventories
Current and deferred tax balances
Other assets
(2,292)
1,319
1,775
(38)
13,142
6,170
(982)
198
Increase/(decrease) in liabilities:
Trade and other payables
Provisions
Other liabilities
Net cash from operating activities
1,597
(1,442)
154
6,991
(11,035)
20
(2,931)
Cash and bank balances
Bank multi option loan/receivable finance loan
Net Cash and Cash Equivalents
(b) Reconciliation of Profit for the year to net cash flows from operating activities
Profit for the year
Depreciation expense
Fair value (gain)/loss on derivatives
Gain on disposal of property, plant & equipment
Amortisation of borrowing costs
Profit on disposal of brand
Impairment of property, plant and equipment
Debt forgiveness
Net impairments / (reversal) of brand names
Pental Limited 2014 Financial Report | 87 |
NOTES TO THE
FINANCIAL STATEMENTS
For personal use only
for the year (52 weeks) ended 29 June 2014
(Continued)
29. OPERATING LEASE ARRANGEMENTS
2014
$’000
Non-cancellable operating lease expenses
Not later than 1 year
Later than 1 year and not later than 5 years
Later than 5 years
2013
$’000
1,031
3,715
3,139
7,885
1,015
3,907
3,866
8,788
The non-cancellable operating leases relate to leases for the:
1. Shepparton properties for a remaining term of 9 years with an option of two further terms and rental to increase
annually by Consumer Price Index;
2. Melbourne support office lease is for a remaining term of 4 years, with rental increasing annually by 4%; and
3. Other leases are for forklifts, motor vehicles and photo copiers for terms between 1 and 5 years.
30. CAPITAL EXPENDITURE COMMITMENT
Plant and equipment
2014
$’000
224
2013
$’000
2,146
In the prior year the Group entered into a contract amounting to $3.653 million to relocate and upgrade its bleach
manufacturing operations from the Port Melbourne site to the Shepparton site. The total project cost was $4.424
million, which included the upgrade of fire services on the site, new case packer and information technology. As at 29
June 2014, the project was completed.
| 88 | Pental Limited 2014 Financial Report
For personal use only
31. CONTINGENT LIABILITIES
Bank guarantees to third parties in respect of property lease obligations
2014
$’000
324
2013
$’000
324
2014
$
2013
$
32. REMUNERATION OF AUDITORS
Auditor of the parent entity
Audit or review of the financial report
138,300
184,650
Non-audit services – Tax and other services
23,000
103,000
Financial due diligence for the equity raising
–
183,500
258,650
471,150
The auditor of Pental Limited is Deloitte Touche Tohmatsu.
33. PARENT ENTITY INFORMATION
The accounting policies of the parent entity, which have been applied in determining the financial information shown
below, are the same as those applied in the consolidated financial statements. Refer to Note 2 for a summary of the
significant accounting policies relating to the Group.
Financial Position
2014
$’000
2013
$’000
Assets
Current assets
23
1,574
Non current assets
65,762
73,648
Total assets
65,785
75,222
Liabilities
Current liabilities
72
3,158
-
12,056
72
15,214
84,014
78,309
(18,301)
(18,301)
65,713
60,008
Non current liabilities
Total liabilities
Equity
Issued capital
(Accumulated losses)/Retained earnings
Total equity
Financial Performance
2014
$’000
Loss for the year
2013
$’000
-
(917)
Other comprehensive income
-
3
Total comprehensive income
-
(914)
Pental Limited 2014 Financial Report | 89 |
NOTES TO THE
FINANCIAL STATEMENTS
For personal use only
for the year (52 weeks) ended 29 June 2014
(Continued)
34. DISCONTINUED OPERATIONS
The loss making Specialty Chemicals business was closed on 2 November 2012, as the business was no longer
commercially viable.
The profit/(loss) for the period from the discontinued operations is analysed as follows:
2014
$’000
2013
$’000
Revenue
-
33,169
Operating expenses
-
(34,975)
- Profit on disposal of business
-
-
- Employee restructure costs
-
(8,197)
- Other closure costs
-
(5,213)
- Debt forgiveness
-
10,000
- Profit on sale of property, plant & equipment
-
3,466
- Relocation of bleach manufacturing
-
(270)
- Strategic review costs
-
-
- Impairment of assets
-
-
- Impairment of goodwill
-
-
Loss before interest and income tax
-
(2,020)
Finance costs
-
-
Income Tax benefit
-
1,710
Loss after income tax
-
(310)
Significant expenses
2014
$’000
2013
$’000
Cash flows from discontinued operations
Net cash inflows / (outflows) from operating activities
-
(12,421)
Net cash inflows / (outflows) from investing activities
-
23,935
Net cash inflows / (outflows) from financing activities
-
11,805
Net cash inflows / (outflows)
-
23,319
35. SUBSEQUENT EVENTS
Subsequent to balance date, there have been no significant events which have affected the operations of the Group
except for:
Dividends
In respect of the year (52 weeks) ended 29 June 2014 the Company will pay a full year fully franked dividend of 0.12
cents per ordinary share, payable to shareholders on 30 September 2014, with a record date of 12 September 2014.
| 90 | Pental Limited 2014 Financial Report
ADDITIONAL STOCK
EXCHANGE INFORMATION
For personal use only
as at 20 August 2014
Additional information required by the Australian Stock Exchange Limited Listing Rules and not disclosed elsewhere in
this report is set out below.
ORDINARY SHARE CAPITAL
1,795,407,186 fully paid ordinary shares are held by 1,536 individual shareholders.
The voting rights attaching to the fully paid ordinary share, set out in clause 43 of the Company’s Constitution are:
“Subject to any rights or restrictions attaching to any class of shares:
(a) every member may vote;
(b) on a show of hands every member has one vote;
(c) on a poll every member has:
(i) for each fully paid share held by the member, one vote; and
(ii) for each partly paid share held by the member, a fraction of a vote equivalent to the proportion which the amount
paid (not credited) is of the total amounts paid and payable (excluding amounts credited to) on the share.”
OPTIONS
There are no voting rights attached to unissued ordinary shares. Voting rights will be attached to unissued ordinary
shares when the options have been exercised. Refer to Notes 20 and 25 of the financial statements for further details.
ON-MARKET BUY-BACK
There is no current on-market buy-back.
Distribution of holders of equity securities
1 – 1,000
1,001 – 5,000
5,001 – 10,000
10,001 – 100,000
100,001 and over
Holding less than a marketable parcel
Fully paid
ordinary
shares
102
80
62
679
613
1,536
Options
696
607
206
401
190
2,100
269
Substantial shareholders
Ordinary shareholders
Alan Johnstone
Allan Gray Australia Pty Ltd (ii)
Mr John Rostyn Homewood
Citicorp Nominees Pty Ltd (iii)
HSBC Custody Nominees (Australia) Ltd (iii)
(i)
Fully paid ordinary shares
Number
Percentage
374,037,177
296,809,347
209,000,000
151,116,571
107,191,672
990,113,830
20.83%
16.53%
11.64%
8.42%
5.97%
55.15%
(i) As disclosed in the last substantial shareholder notice lodged before the date of this Annual Report, Alan Johnstone has a relevant interest in Pental shares
held by Western Park Holdings Pty Ltd and PMSF Company Pty Ltd <Penfold Motors Burwood Super Fund>.
(ii) As disclosed in the last substantial shareholder notice lodged before the date of this Annual Report, Allan Gray Australia Pty Ltd has a relevant interest in shares
held by Citicorp Nominees Pty Limited (101,579,146 shares), HSBC Custody Nominees Australia Limited (23,461,045 shares), J P Morgan Nominees Australia Pty Limited
(69,341,757 shares) and National Nominees Limited (64,675,131 shares).
(iii) As disclosed in note (ii), these entities hold shares for Allan Gray Australia Pty Ltd.
Pental Limited 2014 Financial Report | 91 |
ADDITIONAL STOCK
EXCHANGE INFORMATION
For personal use only
as at 20 August 2014
Twenty largest holders of quoted equity securities
Ordinary shareholders
Fully paid ordinary shares
Number
Percentage
1
WESTERN PARK HOLDINGS PTY LTD
258,709,032
14.41%
2
MR JOHN ROSTYN HOMEWOOD
209,000,000
11.64%
3
CITICORP NOMINEES PTY LIMITED
151,116,571
8.42%
4
HSBC CUSTODY NOMINEES (AUSTRALIA) LIMITED
107,191,672
5.97%
5
J P MORGAN NOMINEES AUSTRALIA LIMITED
104,635,547
5.83%
6
MR GARRY GEORGE JOHNSON
83,384,234
4.64%
7
LABELMAKERS GROUP PTY LTD
83,333,333
4.64%
8
WESTERN PARK HOLDINGS PTY LTD
69,792,530
3.89%
9
PJR SUPERANNUATION PTY LTD <PJR SUPERANNUATION FUND A/C>
49,661,570
2.77%
10
NATIONAL NOMINEES LIMITED
41,122,863
2.29%
11
PMSF COMPANY PTY LTD <PENFOLD MOTORS BWD S/F A/C>
37,666,666
2.10%
12
VANWARD INVESTMENTS LIMITED
32,558,334
1.81%
13
RATHVALE PTY LIMITED
23,084,600
1.29%
14
M & A PARTNERS PTY LTD
16,687,500
0.93%
15
DIXSON TRUST PTY LIMITED
16,029,040
0.89%
16
CVC LIMITED
14,533,921
0.81%
17
MRS JOY DOROTHY JOHNSTONE
10,426,130
0.58%
18
RUBI HOLDINGS PTY LTD <JOHN RUBINO S/F A/C>
10,000,000
0.56%
19
TORONTO COVE PTY LTD <TORONTO COVE SUPER FUND A/C>
10,000,000
0.56%
20
MR JOHN LORIENTE & MRS PASQUALINA LORIENTE <LORIENTE SUPER FUND A/C>
| 92 | Pental Limited 2014 Financial Report
8,371,610
0.47%
1,337,305,153
74.48%
For personal use only
CORPORATE
DIRECTORY
Directors
Mr Peter Robinson, Chairman
Mr Alan Johnstone
Mr John Etherington
Mr John Rishworth
Mr Mel Sutton
Company Secretary
Mr Oliver Carton
Registered Office
Level 6, 390 St Kilda Road
Melbourne VIC 3004
Telephone: +61 3 9251 2311
Manufacturing and Distribution
18-22 Drummond Road
Shepparton VIC 3630
Telephone: +61 3 5820 5200
Shareholder enquiries:
Share Register
Boardroom Pty Limited
Level 7, 207 Kent Street
Sydney NSW 2000
www.boardroomlimited.com.au
Telephone within Australia: 1300 737 760
Telephone: +61 2 9290 9600
Auditors
Deloitte Touche Tohmatsu
550 Bourke Street
Melbourne VIC 3000
Telephone: +61 3 9671 7000
Securities Exchange Listing
Pental Limited (PTL) shares are listed on the Australian
Securities Exchange (ASX)
Website
www.pental.com.au
ABN
29 091 035 353
For personal use only

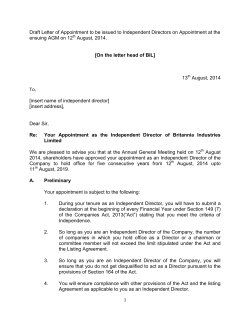
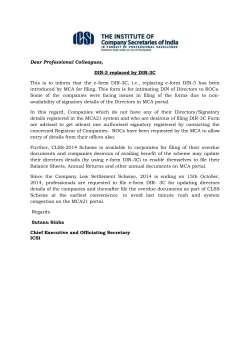
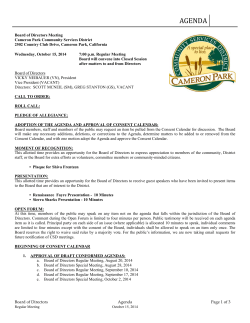

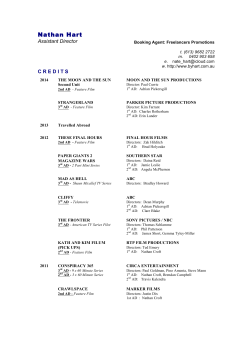


© Copyright 2026