
Document 347949
Goodman Fielder Limited ABN 51 116 399 430 T2, 39 Delhi Road North Ryde NSW 2113 Australia Locked Bag 2222 North Ryde NSW 2113 Australia Tel: 61 2 8899 7000 Fax: 61 2 8026 4200 www.goodmanfielder.com.au 16 October 2014 Announcements Officer ASX Market Announcements ASX Limited Exchange Centre 20 Bridge Street SYDNEY NSW 2000 Listed Company Relations NZX Limited Level 2, NZX Centre 11 Cable Street WELLINGTON NEW ZEALAND Notice of Annual General Meeting and Annual Report In accordance with the Listing Rules, I attach Goodman Fielder’s Notice of 2014 Annual General Meeting and Proxy Form, which will be despatched to shareholders today. The Company’s 2014 Annual Report (attached) will also be despatched by post today to those shareholders who have elected to receive a paper copy. The attached documents will be made available on www.goodmanfielder.com.au once released to the market. Goodman Fielder’s Yours sincerely, SARA GOLDSTEIN Company Secretary The registered office of Goodman Fielder Limited and its Australian subsidiaries is T2, 39 Delhi Road North Ryde NSW 2113 website Notice of Meeting GOODMAN FIELDER NOTICE OF 2014 ANNUAL GENERAL MEETING Dear Shareholder, On behalf of the Board of Directors, I am pleased to invite you to attend the 2014 Annual General Meeting of Goodman Fielder Limited, which will be held on Thursday, 20 November 2014 at 10.30am (AEDT) at the Company’s Sydney head office in North Ryde. Included with this Notice of Meeting are a personalised proxy form and a copy of the Company’s 2014 Annual Report, if you have elected to receive a printed copy. Goodman Fielder’s Annual Report can also be viewed online on the Company’s website (ww w.goodmanfielder.com.au). Registration for the Annual General Meeting will commence at 9.30am (AEDT). If you will be attending the meeting, please bring the enclosed proxy form with you to assist with your registration. If you are unable to attend the meeting, I encourage you to appoint a proxy to attend and vote on your behalf, either by returning your completed proxy form or providing your proxy instructions electronically using the online proxy facility at ww w.linkmarketservices.com.au (Australian register) or ww w.linkmarketservices.co.nz (New Zealand register). Please refer to the back of the proxy form for instructions on appointing a proxy. To be valid for the meeting, proxy forms and proxy instructions provided electronically must be received by 10.30am (AEDT) or 12.30pm (NZT) on Tuesday, 18 November 2014. The Notice of Meeting contains further information for shareholders who wish to submit written questions to the Company prior to the Annual General Meeting. Shareholders who are unable to attend the meeting in person are invited to view a live webcast which will be available on the Company’s website. The Directors and management of Goodman Fielder Limited look forward to seeing you at the Annual General Meeting. Yours sincerely, Steven Gregg Chairman GOODMAN FIELDER LIMITED ABN 51 116 399 430 The 2014 Annual General Meeting of shareholders of Goodman Fielder Limited (‘the Company’) will be held on Thursday, 20 November 2014 at 10.30am (AEDT) in the Patrick Goodman and George Fielder Rooms, Level 1, T2, 39 Delhi Road, North Ryde, New South Wales. Registration for the meeting will commence at 9.30am (AEDT). How to get to the Meeting Location Public Transport Goodman Fielder’s Head Office is located at T2, 39 Delhi Road, North Ryde NSW 2113. The closest intersection is Delhi Road and Julius Avenue. Our Head Office is located within a two minute walk from North Ryde Train Station and Delhi Road bus stops. Parking While there are no public car parks near to our Head Office, should you wish to drive to the meeting there are a limited number of car parking spaces available beneath the building. Please contact Kerry Nicolopoulos on 02 8899 7520 or by email at [email protected] by Friday, 14 November 2014 if you wish to arrange a car park space for the meeting. Limited street parking is also available on Plassey Road, adjacent to Lane Cove National Park. Train Take the Northern Line or the North Shore & Northern Line to North Ryde Station, which is located on Delhi Road. Bus Bus stops are located on Delhi Road and on Epping Road, North Ryde. The 545 bus departs regularly from Chatswood Station and stops on Delhi Road, near Plassey Road. Buses from the CBD stop on Epping Road, near to Delhi Road. Taxi Request that your driver takes you to the New Link Road, North Ryde taxi rank, which is located next to our Head Office. For public transport information please call 131 500 or visit ww w.sydneybuses.info or ww w.sydneytrains.info. Watch the Meeting Online A live webcast of the meeting will be available on Goodman Fielder’s website, ww w.goodmanfielder.com.au 2 GOODMAN FIELDER NOTICE OF 2014 ANNUAL GENERAL MEETING Business 1. Financial Statements and Reports Voting Exclusions: To receive and consider the Financial Report and the reports of the Directors and the Auditor for the financial year ended 30 June 2014. The Corporations Act 2001 (Cth) (Corporations Act) restricts Key Management Personnel (KMP) and their closely related parties from voting on resolutions that are directly or indirectly related to the remuneration of a member of the KMP of the Company in certain circumstances. Note: There is no requirement for shareholders to approve these reports. 2. Remuneration Report To consider and, if thought fit, to pass the following non-binding resolution as an ordinary resolution of the Company: “That the Remuneration Report for the financial year ended 30 June 2014 be adopted.” Note: The vote on this resolution is advisory only and does not bind the Directors or the Company. 3.Election Of Director – Mr Ian Cornell To consider and, if thought fit, to pass the following resolution as an ordinary resolution of the Company: “That Mr Ian Cornell, who will hold office only until the close of the meeting in accordance with Rule 8.1(c) of the Company’s Constitution, and being eligible and having offered himself for election, be elected as a Director of the Company.” ‘Closely related party’ is defined in the Corporations Act and includes family members and controlled companies. Item 2 – Remuneration Report The Company will disregard any votes cast on Item 2: (a) by or on behalf of a member of the KMP or a KMP’s closely related party at the date of the meeting or as disclosed in the Remuneration Report; and (b) as a proxy by a member of the KMP or a KMP’s closely related party, unless the vote is cast: (c) as a proxy for a person entitled to vote on Item 2 in accordance with a direction on the proxy form; or (d) by the Chairman of the meeting who has been appointed as proxy (other than by default) for a person entitled to vote, pursuant to an express authorisation to exercise the proxy on Item 2 even though Item 2 is connected with the remuneration of the Company’s KMP. By order of the Board 4. Re-Election Of Director – Mr Ian Johnston To consider and, if thought fit, to pass the following resolution as an ordinary resolution of the Company “That Mr Ian Johnston, who will retire at the close of the meeting in accordance with Rule 8.1(d) of the Company’s Constitution, and being eligible and having offered himself for re-election, be reelected as a Director of the Company.” Sara Goldstein Company Secretary 16 October 2014 Voting on all resolutions will be conducted by poll. The Chairman intends to vote available proxies in favour of all proposed resolutions. Please refer to the Explanatory Notes for further information on the proposed resolutions. GOODMAN FIELDER NOTICE OF 2014 ANNUAL GENERAL MEETING 3 Information for Shareholders Entitlement to Attend and Vote The Board has determined, for the purposes of the meeting (including voting at the meeting), that only those persons who are registered holders of ordinary shares of the Company at 7.00pm (AEDT) on Tuesday, 18 November 2014 will be treated as shareholders. You may vote by attending the meeting in person or by proxy. If you are attending in person, please bring your personalised proxy form to the meeting to assist with your registration. As in previous years, voting on all resolutions at the meeting will be conducted by poll rather than on a show of hands. Voting by Proxy If you are unable to attend the meeting, you are encouraged to appoint a proxy to attend and vote on your behalf. A proxy need not be a shareholder. You can appoint an individual or body corporate as a proxy. If you are appointing a proxy, you are encouraged to direct that proxy how to vote. You may direct the proxy to vote ‘for’ or ‘against’ each resolution or to abstain from voting by marking the appropriate box on the proxy form. The Chairman of the meeting is willing to act as a proxy for any shareholder who wishes to appoint him for that purpose. To appoint the Chairman of the meeting, please mark the box in Step 1 of the proxy form where indicated. You can direct the Chairman of the meeting how to vote by marking the boxes for Items 2 to 4 in Step 2 (for example to vote ‘for’, ‘against’ or to ‘abstain’ from voting). For Item 2 (Remuneration Report), if the Chairman of the meeting is appointed as your proxy (other than by default), but the appointment does not specify the way to vote on a resolution, then by submitting the proxy form you are expressly authorising the Chairman of the meeting to vote undirected proxies in favour of the resolution, even though Item 2 (Remuneration Report) is connected directly or indirectly with the remuneration of a member of the KMP. The Chairman of the meeting intends to vote available proxies in favour of all items of business (subject to the applicable law). Members of the KMP other than the Chairman of the meeting (which includes each of the other Directors) and their closely related parties will not be able to vote your proxy on Item 2 unless you tell them how to vote. If you intend to appoint a member of the KMP (such as one of the other Directors) or one of their closely related parties as your proxy, please ensure that you direct them how to vote on Item 2. A shareholder who is entitled to cast two or more votes may appoint up to two proxies and may specify the proportion or number of votes each proxy is appointed to exercise, failing which each may exercise half of the votes. An additional proxy form is available from the Company’s share registry on request. 4 GOODMAN FIELDER NOTICE OF 2014 ANNUAL GENERAL MEETING In accordance with the Corporations Act, where a poll is conducted in relation to a proposed resolution, if: • a shareholder has appointed a proxy (other than the Chairman of the meeting) and the appointment of the proxy specifies the way the proxy is to vote on the resolution; and • that shareholder’s proxy is either not recorded as attending the meeting or does not vote on the resolution, the Chairman of the meeting will, before voting on the resolution closes, be taken to have been appointed as the proxy for the shareholder for the purposes of voting on that resolution and must vote in accordance with the written direction of the shareholder. If you return your proxy form but do not nominate the identity of your proxy, or if your nominated proxy does not attend and/or vote at the meeting and you have not provided a direction to your proxy as to how to vote your shares, your votes will not be cast. The following addresses are specified for the purposes of receipt of proxy appointments and any authorities under which proxy appointments are signed (or certified copies of those authorities): Australia Goodman Fielder Share Registry Link Market Services Limited Level 12, 680 George Street Sydney NSW 2000 Australia Locked Bag A14 Sydney South NSW 1235 Australia Fax: +61 2 9287 0309 New Zealand Goodman Fielder Share Registry Link Market Services Limited Level 7, Zurich House, 21 Queen Street Auckland 1010 New Zealand PO Box 91976 Auckland 1142 New Zealand Fax: +64 9 375 5990 Please use the enclosed reply paid envelope to forward the completed proxy form by post. Shareholders may also submit their proxy instructions electronically with Goodman Fielder’s share registry by visiting the Company’s website ww w.goodmanfielder.com.au and clicking on ‘Links’ on the home page, and then selecting the link for the Company’s share registry, or by visiting the registry’s website (ww w.linkmarketservices.com.au for shareholders on the Australian register and ww w.linkmarketservices.co.nz for shareholders on the New Zealand register) and then selecting ‘Investor Login’. To be effective, a proxy appointment and any authority under which the appointment is signed (or a certified copy of the authority) must be received by the Company at its registered office or by its share registry not later than 10.30am (AEDT) or 12.30pm (NZT) on Tuesday, 18 November 2014, being 48 hours before the commencement of the Meeting. Please refer to the reverse side of the proxy form for more information concerning appointment of proxies. Voting by Attorney A shareholder may appoint an attorney to vote on his/her behalf. For an appointment to be effective for the meeting, the instrument effecting the appointment (or a certified copy of it) must be received by the Company at its registered office or by its share registry not later than 10.30am (AEDT) or 12.30pm (NZT) on Tuesday, 18 November 2014. Corporate Representatives A body corporate which is a shareholder, or which has been appointed as a proxy, may appoint an individual to act as its representative at the meeting in accordance with Section 250D of the Corporations Act. The representative should bring to the meeting evidence of his/her appointment, including any authority under which it is signed, unless it has previously been given to the Company. Annual Report Goodman Fielder’s 2014 Annual Report is available on the ‘Annual Reports’ webpage in the ‘Investor Centre’ section of the Company’s website at ww w.goodmanfielder.com.au. Annual Review Goodman Fielder prepares a non-statutory Annual Review which can be viewed online at ww w.goodmanfielder.com.au. The Annual Review provides detail and discussion of the Company’s overall performance for the year ended 30 June 2014, including financial, operational, strategic and sustainability measures. Shareholder Questions Shareholders are invited to submit questions to the Company in advance of the meeting either online at [email protected] or by post addressed to the Company Secretary, Goodman Fielder Limited, Locked Bag 2222, North Ryde NSW 2113 Australia. Questions must be received by no later than 5.00pm (AEDT) on 14 November 2014 and should relate to matters that are relevant to the business of the meeting, as outlined in the Notice of Meeting and Explanatory Notes. Questions will be collated and, during the meeting, either the Chairman or the Managing Director will seek to address as many of the more frequently raised topics as possible, having regard to the available time. The Chairman will request that a representative of KPMG, the Company’s auditor, respond to questions relating to the audit, accounting policies adopted in relation to the financial statements or the independence of the auditor. Please note that responses will not be provided on an individual basis to questions submitted in writing by shareholders prior to the meeting. The meeting will be webcast for those shareholders who are unable to attend. Please be aware that shareholders will not be able to vote on resolutions or ask questions via the webcast. GOODMAN FIELDER NOTICE OF 2014 ANNUAL GENERAL MEETING 5 Explanatory Notes These Explanatory Notes provide shareholders with further information on the items of business to be considered at the Annual General Meeting of Goodman Fielder Limited to be held on Thursday, 20 November 2014. They form part of and should be read in conjunction with the Notice of 2014 Annual General Meeting. Items 2 to 4 to be considered at the 2014 Annual General Meeting are ordinary resolutions. An ordinary resolution requires a simple majority of votes cast by shareholders entitled to vote on the resolution. Item 1 Financial Statements and Reports In accordance with the Corporations Act and the Constitution of the Company, the Annual Financial Report (which includes the financial statements of the consolidated entity, notes to the financial statements and Directors’ Declaration), the Directors’ Report and the Auditor’s Report will be presented for consideration at the Annual General Meeting. The Company’s 2014 Annual Report contains copies of these reports and is available in the ‘Investor Centre’ section of the Company’s website at ww w.goodmanfielder.com.au. While there is no requirement for shareholders to approve these reports, shareholders will be provided with a reasonable opportunity to ask questions about, and make comments on, the reports and on the management and performance of the Company. Shareholders will also have a reasonable opportunity to ask the Company’s auditor questions relevant to the conduct of the audit, the preparation and content of the auditor’s report, the accounting policies adopted by the Company in relation to the preparation of the Company’s financial statements and the independence of the auditor in relation to the conduct of the audit. Item 2 Remuneration Report The Company’s Remuneration Report is set out between pages 31 and 55 of the 2014 Annual Report. The Remuneration Report details the remuneration policy of the Company and the remuneration paid or payable to Directors and other Key Management Personnel (KMP) of the Goodman Fielder Group. It also sets out, among other things, the relationship between the remuneration of those individuals and the Company’s performance. The Remuneration Report has been audited by the Company’s auditor, KPMG. Shareholders will be provided with a reasonable opportunity to ask questions about, or comment on, the Remuneration Report, the remuneration of the Company’s Directors and executives and the objectives and structure of remuneration for those individuals. The vote on this resolution is advisory only and does not bind the Directors or the Company. However, the Board will consider the outcome of the vote when reviewing the remuneration policy and practices of the Company. 6 GOODMAN FIELDER NOTICE OF 2014 ANNUAL GENERAL MEETING Items 3 and 4 Election/Re-election of Directors Item 4 Re-election of Director – Ian Johnston Shareholder approval is sought for the election of Mr Ian Cornell and the re-election of Mr Ian Johnston as Directors of the Company. Information about the candidate for re-election: Under Rule 8 of the Company’s Constitution and ASX Listing Rule 14.4, Mr Cornell and Mr Johnston will hold office only until the conclusion of the 2014 Annual General Meeting unless elected or re-elected, respectively, by shareholders at the meeting. Mr Cornell was appointed a Director of the Company in February 2014. Having been appointed by the Board since the last Annual General Meeting, and being eligible for election as a Director of the Company, Mr Cornell has offered himself for election by shareholders. Mr Johnston was first elected by shareholders at the Company’s 2008 Annual General Meeting and was re-elected in 2011. He may not hold office without re-election beyond the third Annual General Meeting after he was most recently re-elected. Mr Johnston is eligible to stand for re-election and has offered himself for reelection as a Director of the Company. The Board considers both Mr Cornell and Mr Johnston to be independent Directors. Board recommendations The Board (excluding each of the candidate Directors in respect of his own election or re-election) has passed a resolution confirming its support for the election of Mr Cornell and the re-election of Mr Johnston and recommending that shareholders vote in favour of Items 3 and 4. Ian Johnston Age 67, BCom, CPA Ian Johnston has been a Director of the Company and a Member of the Audit and Human Resources and Remuneration Committees since 26 May 2008. He was also appointed as a Member of the Nomination Committee on 25 October 2012. Mr Johnston has over 30 years’ experience with a number of leading companies in the international food and beverage industry. He initially spent 13 years with Unilever in a range of domestic and overseas marketing roles and then joined Cadbury Schweppes as Marketing and Sales Director, Australia/New Zealand. Mr Johnston was subsequently appointed Managing Director of Cadbury’s UK business before becoming Managing Director, Global Confectionery of Cadbury Schweppes plc from 1996 until 2000. He then served from 2001 to 2004 as President and Chief Operating Officer of The Olayan Group, a privately-owned Saudi Arabian conglomerate. He was appointed a non-executive Director of Foster’s Group Limited in September 2007 and then held the position of Chief Executive Officer between September 2008 and the demerger of its wine business in May 2011. Item 3 Election of Director – Ian Cornell Information about the candidate for election: Ian Cornell Age 60 Ian Cornell has been a Director of Goodman Fielder Limited and a Member of the Company’s Human Resources and Remuneration Committee since 15 February 2014. Mr Cornell is a highly experienced executive in the Australian/ New Zealand retail and food and grocery industries, having held a number of senior executive positions with Woolworths, Franklins and Westfield. Mr Cornell’s most recent executive position was at Westfield Group where he was Director of Human Resources and previously, Director of Shopping Centre Management, for Australia and New Zealand. Prior to joining Westfield, Mr Cornell was the Chief Executive Officer of Franklins in Australia and also held numerous senior executive positions with Woolworths Limited, including the role of Chief General Manager for Woolworths’ supermarkets division. Mr Cornell was appointed as a non-executive director of Myer Holdings Limited in February 2014 and is also a director of William Inglis & Son Limited. GOODMAN FIELDER NOTICE OF 2014 ANNUAL GENERAL MEETING 7 LODGE YOUR VOTE ONLINE Goodman Fielder Limited ABN 51 116 399 430 www.linkmarketservices.com.au By mail: Goodman Fielder Limited C/- Link Market Services Limited Locked Bag A14 Sydney South NSW 1235 Australia All enquiries to: Telephone: 1800 178 254 SHAREHOLDER PROXY FORM L I/We being a member(s) of Goodman Fielder Limited and entitled to attend and vote hereby appoint: APPOINT A PROXY STEP 1 the Chairman of the meeting (mark box) By fax: +61 2 9287 0309 OR if you are NOT appointing the Chairman of the meeting as your proxy, please write the name of the person or body corporate (excluding the registered shareholder) you are appointing as your proxy P Overseas: +61 1800 178 254 E or failing the person/body corporate named or if no person/body corporate is named, AND where I/we have provided voting directions in Step 2, the Chairman of the meeting, as my/our proxy to act generally at the meeting on my/our behalf and to vote in accordance with the following directions (or, if no directions have been given and to the extent permitted by law, as the proxy sees fit) at the Annual General Meeting of the Company to be held at 10:30am (AEDT) on Thursday, 20 November 2014 in the Patrick Goodman and George Fielder Rooms, Level 1, T2, 39 Delhi Road, North Ryde and at any adjournment or postponement of the meeting. Chairman authorised to exercise undirected proxies on remuneration related resolutions: Where I/we have appointed the Chairman of the meeting as my/our proxy (other than by default), by signing and returning this form I/we expressly authorise the Chairman of the meeting to exercise my/our proxy on Item 2 in accordance with the voting intentions below (except where I/we have indicated a different voting intention by marking the box in Step 2 below) and acknowledge that the Chairman of the meeting may exercise my/our proxy even though Item 2 is connected directly or indirectly with the remuneration of a member of key management personnel of the Company. A M The Chairman of the meeting is willing to act as proxy for any shareholder who wishes to appoint him for that purpose. To appoint the Chairman, mark the box in Step 1 above. If you appoint the Chairman of the meeting as your proxy, you can direct him to vote for or against or to abstain from voting by marking the appropriate boxes in Step 2 below. If you leave Step 1 blank, or your named proxy does not attend the meeting, and you have not provided a voting direction in Step 2, your votes will not be cast. S Proxies will only be valid and accepted by the Company if they are validly submitted no later than 48 hours before the meeting. Please read the voting instructions overleaf before marking any boxes with an X STEP 2 For Item 2 Remuneration Report Item 3 VOTING DIRECTIONS Against Abstain* Election of Director, Mr Ian Cornell Item 4 Re-election of Director, Mr Ian Johnston *If you mark the Abstain box for a particular Item, you are directing your proxy not to vote on your behalf on a show of hands or on a poll and your votes will not be counted in computing the required majority on a poll. Voting Intention: The Chairman of the meeting intends to vote all available proxies in favour of each item of business. STEP 3 SIGNATURE OF SHAREHOLDERS – THIS MUST BE COMPLETED PLEASE ENSURE THAT YOU HAVE ALSO COMPLETED STEP 1 ABOVE OR YOUR VOTES MAY NOT BE CAST. Shareholder 1 (Individual) Joint Shareholder 2 (Individual) Joint Shareholder 3 (Individual) Sole Director and Sole Company Secretary Director/Company Secretary (Delete one) Director This form should be signed by the shareholder. If a joint holding, either shareholder may sign. If signed by the shareholder’s attorney, the power of attorney must have been previously noted by the registry or a certified copy attached to this form. If executed by a company, the form must be executed in accordance with the company’s constitution and the Corporations Act 2001 (Cth). GFF PRX401R *GFF PRX401* HOW TO COMPLETE THIS PROXY FORM Your Name and Address Appointment of a Second Proxy This is your name and address as it appears on the company’s share register. If this information is incorrect, please make the correction on the form. Shareholders sponsored by a broker should advise their broker of any changes. Please note: you cannot change ownership of your shares using this form. You are entitled to appoint up to two persons as proxies to attend the meeting and vote on a poll. If you wish to appoint a second proxy, an additional proxy form may be obtained by telephoning the company’s share registry or you may copy this form and return them both together. Appointment of a Proxy The Chairman of the meeting is willing to act as proxy for any shareholder who wishes to appoint him for that purpose. If you wish to appoint the Chairman of the meeting as your proxy, mark the box in Step 1. If the person you wish to appoint as your proxy is someone other than the Chairman of the meeting please write the name of that person in Step 1. If you leave Step 1 blank, or your named proxy does not attend and/or vote at the meeting and you have not provided a voting direction in Step 2, your votes will not be cast. A proxy need not be a shareholder of the company. A proxy may be an individual or body corporate. To appoint a second proxy you must: a) on each of the first proxy form and the second proxy form state the percentage of your voting rights or number of shares applicable to that form. If the appointments do not specify the percentage or number of votes that each proxy may exercise, each proxy may exercise half your votes. Fractions of votes will be disregarded. b) return both forms together. Signing Instructions You must sign this form as follows in the spaces provided: Votes on Items of Business – Proxy Appointment Individual: where the holding is in one name, the holder must sign. You may direct your proxy how to vote by placing a mark in one of the boxes opposite each item of business. All your shares will be voted in accordance with such a direction unless you indicate only a portion of voting rights are to be voted on any item by inserting the percentage or number of shares you wish to vote in the appropriate box or boxes. If you do not mark any of the boxes on the items of business, your proxy may vote as he or she chooses to the extent permitted by law. If you mark more than one box on an item your vote on that item will be invalid. Joint Holding: where the holding is in more than one name, either shareholder may sign. Proxy voting by key management personnel The key management personnel of the Company (which includes each of the Directors) and their closely related parties will not be able to vote as your proxy on Item 2 unless you tell them how to vote or, if you have appointed the Chairman of the meeting as your proxy (other than by default), by signing and returning this form you expressly authorise him to exercise the proxy on Item 2 even though Item 2 is connected with the remuneration of the Company’s key management personnel. If you intend to appoint a member of the key management personnel (other than the Chairman of the meeting) as your proxy, please ensure that you direct them how to vote on Item 2, otherwise they will not be able to cast a vote as your proxy on that item of business. S Lodgement of a Proxy Form A E Power of Attorney: to sign under Power of Attorney, you must lodge the Power of Attorney with the registry. If you have not previously lodged this document for notation, please attach a certified photocopy of the Power of Attorney to this form when you return it. L Companies: where the company has a Sole Director who is also the Sole Company Secretary, this form must be signed by that person. If the company (pursuant to section 204A of the Corporations Act 2001) does not have a Company Secretary, a Sole Director can also sign alone. Otherwise this form must be signed by a Director jointly with either another Director or a Company Secretary. Please indicate the office held by signing in the appropriate place. M P Corporate Representatives If a representative of the corporation is to attend the meeting the appropr iate “Cer tificate of A ppointment of Corporate Representative” should be produced prior to admission in accordance with the Notice of meeting. A form of the certificate may be obtained from the company’s share registry or online at www.linkmarketservices.com.au. This proxy form (and any Power of Attorney under which it is signed) must be received at an address given below by 10:30am (AEDT) or 12:30pm (NZT) on Tuesday, 18 November 2014, being not later than 48 hours before the commencement of the meeting. Any proxy form received after that time will not be valid for the scheduled meeting. Proxy forms may be lodged using the reply paid envelope or: ONLINE www.linkmarketservices.com.au Login to the Link website using the holding details as shown on the proxy form. Select ‘Voting’ and follow the prompts to lodge your vote. To use the online lodgement facility, shareholders will need their ‘Holder Identifier’ (Securityholder Reference Number (SRN) or Holder Identification Number (HIN) as shown on the front of the proxy form). by mail (Australia): by fax (Australia): by hand (Australia): Goodman Fielder Limited C/- Link Market Services Limited Locked Bag A14 Sydney South NSW 1235 Australia +61 2 9287 0309 delivering it to Link Market Services Limited Level 12, 680 George Street, Sydney NSW 2000. If you would like to attend and vote at the Annual General Meeting, please bring this form with you. This will assist in registering your attendance. GOODMAN FIELDER ANNUAL REPORT 2014 Goodman Fielder Limited ABN 51 116 399 430 Goodman Fielder’s Annual Report can be viewed online at ww w.goodmanfielder.c om.au. Goodman Fielder also prepares a non-statutory Annual Review which can be viewed online at ww w.goodmanfielder.c om.au. The Annual Review provides detail and discussion of the Company’s overall performance for the year ended 30 June 2014, including financial, operational, strategic and sustainability measures. GOODMAN FIELDER ANNUAL REPORT 2014 Contents 2 Corporate Governance Statement Notes to the Consolidated Financial Statements 16Directors’ Report 63 1 Summary of significant accounting policies 312014 Remuneration Report 72 2 Financial risk management 57Lead Auditor’s Independence Declaration 80 3 Critical accounting estimates and judgements 58Consolidated Income Statement 80 4 Segment information 59Consolidated Statement of Profit or Loss and other Comprehensive Income 83 5 Other income 84 6 Expenses 60Consolidated Statement of Financial Position 85 7 Income tax expense 61Consolidated Statement of Changes in Equity 86 8 Assets classified as held for sale, business divestments and discontinued operations 88 9 Current assets – Cash and cash equivalents 88 10 Current assets – Trade and other receivables 89 11 Current assets – Inventories 90 12 Derivative financial instruments 90 13 Current assets – Other current assets 90 14 Non-current assets – Receivables 90 15 Non-current assets – Investments in joint ventures 91 16 Non-current assets – Property, plant and equipment 92 17 Non-current assets – Deferred tax assets 93 18 Non-current assets – Intangible assets 96 19 Non-current assets – Other non-current assets 96 20 Superannuation Plans 96 21 Current liabilities – Trade and other payables 97 22 Current liabilities – Borrowings 97 23 Current liabilities – Other financial liabilities 98 24 Current liabilities – Provisions 98 25 Non-current liabilities – Borrowings 99 26 Non-current liabilities – Deferred tax liabilities 62Consolidated Statement of Cash Flows 63Notes to the Consolidated Financial Statements 118Directors’ Declaration 119Independent Auditor’s Report 121Shareholder Information 124Company Information 100 27 Non-current liabilities – Provisions 101 28 Contributed equity 102 29 Other reserves and accumulated losses 103 30 Dividends 104 31 Key management personnel disclosures 105 32 Share-based payments 106 33 Remuneration of auditors 107 34 Contingencies 107 35 Commitments 108 36 Related party transactions 109 37 Subsidiaries 110 38 Deed of cross guarantee 113 39 Interests in joint ventures 114 40 R econciliation of profit after income tax to net cash inflow from operating activities 114 41 Non-cash investing and financing activities 114 42 Events occurring after the reporting period 115 43 Earnings per share 116 44 Parent entity financial information GOODMAN FIELDER ANNUAL REPORT 2014 1 GOODMAN FIELDER ANNUAL REPORT 2014 Corporate Governance Statement The Directors and management of Goodman Fielder are committed to operating the Company’s business ethically and in a manner consistent with high standards of corporate governance. The Directors consider the establishment and implementation of sound corporate governance practices to be a fundamental part of promoting investor confidence and creating value for shareholders, through prudent risk management and a culture which encourages ethical conduct, accountability and good business practices. Letters of appointment have been provided to all non-executive Directors, covering responsibilities, time commitments, performance evaluation, indemnity and insurance arrangements and induction and development. The responsibilities and terms of employment of the CEO, Chief Financial Officer (“CFO”) and other senior executives of the Group are also set out in formal contracts of employment. The Company is listed on the Australian Securities Exchange (“ASX”) and is a dual listed issuer on the NZX and its corporate governance statement for the year ended 30 June 2014 has been prepared with reference to the 2nd edition of the Corporate Governance Principles and Recommendations with 2010 Amendments (“Recommendations”) issued by the ASX Corporate Governance Council and the NZX Corporate Governance Best Practice Code. Except where stated, Goodman Fielder has complied with both sets of governance principles. Annual performance objectives that include both financial and non-financial measures are set at the beginning of each financial year for all senior executives of the Group. The Board reviews the CEO’s performance on an ongoing basis. For other executives, a formal performance review is scheduled every half year with the executive’s manager and a year-end evaluation is conducted to assess performance against the executive’s key result areas (“KRAs”) and the responsibilities and demands of their role. The outcome of the performance review process is reflected in tailored training and development programs and succession planning for each executive, as well as an annual remuneration review. For the year ended 30 June 2014, half-year performance reviews were conducted in January and February 2014 and annual performance reviews were undertaken in July and August 2014. The Company’s corporate governance charters and policies referred to in this Statement are available in the corporate governance section on its website. Principle 1: Lay Solid Foundations for Management and Oversight 1.1 BOARD OF DIRECTORS The Board is responsible for the corporate governance and overall performance of the Company and the Group and for providing strategic guidance for the Group. The Board’s responsibilities encompass the setting of key objectives, monitoring performance and ensuring the Group’s internal control, risk management and reporting procedures are adequate and effective. 1.2THE ROLE AND RESPONSIBILITIES OF THE BOARD AND SENIOR EXECUTIVES The role and responsibilities of the Board are formally set out in its charter. The Board charter identifies the functions reserved for the Board and those delegated to senior executives. The Board’s key responsibilities include: •ensuring a high standard of corporate governance practice and regulatory compliance and promoting ethical and responsible decision-making throughout the Group; •appointing, evaluating and, when necessary, replacing the Chief Executive Officer (“CEO”); •approving the Group’s annual and half-year financial statements; •monitoring the effectiveness of the Group’s enterprise risk management and internal control systems; •approving the Company’s strategic direction, budgets and business plans and monitoring performance against those plans; and •oversight and approval of Director and executive performance management and evaluation systems, remuneration policies and succession planning. The Board has delegated to the CEO and certain senior executives the authority and powers necessary to implement the strategies approved by the Directors and to manage the day-to-day operations and administration of the Company, within the policies and limits to delegation specified by the Board from time to time. 2 GOODMAN FIELDER ANNUAL REPORT 2014 1.3 PERFORMANCE EVALUATION OF SENIOR EXECUTIVES The Remuneration Report on pages 31 to 55 contains further information regarding the process for evaluating the performance of senior executives for the purpose of determining their fixed and variable remuneration. 1.4 EXECUTIVE INDUCTION PROGRAMS Senior executives who join the Group participate in an induction program which provides an overview of the Group, its divisions and brands, and its key policies and processes. Meetings are arranged with the CEO, CFO and other senior executives in the Group to brief the new executive on the Group’s businesses, strategic objectives, risk management practices and other information necessary to meet the requirements of their role. Site visits are also arranged as necessary to familiarise the executive with divisional operations and to develop relationships with key manufacturing personnel. Principle 2: Structure the Board to Add Value 2.1 COMPOSITION OF THE BOARD The Board charter sets out the composition of the Board and its Committees, the responsibilities of Directors and relevant criteria for assessing the independence of Directors. At 30 June 2014, the Board comprised seven non-executive Directors and one executive Director, the CEO. Details of Board members, including their skills, experience, qualifications and term in office, are set out on pages 24 to 26. On 15 February 2014, Mr Ian Cornell was appointed a non-executive Director of the Company. Mr Cornell has extensive experience in the Australian/New Zealand retail and food and grocery industries, including former senior executive roles with Westfield as Director of Human Resources and Director of Shopping Centre Management for Australia and New Zealand, with Franklins in Australia as Chief Executive Officer and with Woolworths as Chief General Manager for Woolworths’ supermarkets division. GOODMAN FIELDER ANNUAL REPORT 2014 Corporate Governance Statement (continued) 2.2 BOARD ACCESS TO INFORMATION AND INDEPENDENT ADVICE 2.4 CHAIRMAN The Board charter expressly acknowledges the importance of Director access to independent professional advice to facilitate the exercise of independent judgement on matters arising in connection with their duties. Any Director may obtain external independent professional advice relating to his or her duties as a Board or Committee member, at the Company’s expense and subject to prior consultation with the Chairman or Chair of the Committee, as appropriate. To the extent required to enable them to carry out their duties, all Directors also have access to Company information and records and may consult management and employees as required. Mr Steven Gregg has been a Director of the Company since February 2010 and became Chairman of the Board on 1 October 2012. The Chairman is responsible for the leadership of the Board, setting its agenda and ensuring the Board is effective, and conducting Board and shareholders’ meetings. 2.3 INDEPENDENCE OF DIRECTORS The Board charter adopts the criteria set out in the Recommendations as a guide in assessing the independence of individual Directors. The materiality thresholds for determining independence are assessed by the Board on a case-by-case basis, taking into account the relevant Director’s specific circumstances, rather than referring to a general materiality threshold. Having regard to these criteria and also to the factors relevant to assessing independence set out in the new 3rd edition of the ASX Corporate Governance Principles and Recommendations, the Board has determined that all Directors of the Company other than Mr Delaney, the CEO, were independent during the financial year ended 30 June 2014. At the time of Ms Dawson’s appointment to the Board, the Board considered Ms Dawson’s independence and whether Ms Dawson’s role as a former Chair and Chief Executive of KPMG New Zealand may affect her independent status. While at KPMG, Ms Dawson was not involved in the provision of services to the Company or its subsidiaries or any other aspect of activities undertaken by KPMG in relation to the Company and its subsidiaries. The Board also received confirmation that, following Ms Dawson’s retirement from KPMG, she has no influence over any KPMG policies or financial operations and has maintained no ongoing financial, consulting or other arrangements with KPMG or relationships with any personnel engaged in the audit of Company and its subsidiaries. KPMG also undertook its own assessment as to whether Ms Dawson’s appointment as a Director and Committee member would affect its independence as an auditor and concluded that all relevant independence tests were satisfied. The Board was satisfied, on the basis of the enquiries and assessments undertaken, and remains satisfied on the basis of subsequent assessments conducted, that Ms Dawson can be considered an independent Director of the Company. It is the Company’s policy to maintain an appropriate division between the roles and responsibilities of the Board and management. The roles of CEO of the Company and Chairman of the Board are separate and the CEO cannot become the Chairman of the Board during his term as CEO or within 5 years of the expiration of that term. 2.5 BOARD PROCESSES The Charter provides for the Board to hold at least six physical meetings a year, and other meetings are called as necessary to address any specific matters that may arise. Physical meetings will generally include either a detailed review of strategic projects and initiatives, review of the Company’s annual or half year results, or strategy and budget presentations. Board meetings may be scheduled at one of the Company’s operating facilities, enabling the Directors to visit the facility and speak with site management and staff, or may include retail store visits and a discussion with key customers. Board teleconferences are held during the other months, with the Directors receiving monthly reports covering operating and market performance, safety, quality and environmental matters, innovation and other specific matters to be brought to the Directors’ attention, along with additional briefing papers on matters for the Board’s consideration. Details of Directors’ attendances at meetings during the 2014 financial year are reported on page 27. To assist Directors in enhancing their understanding of the Company’s business, Directors are briefed by members of the executive team on divisional performance and key operational and strategic issues, financial matters, risk management, compliance and governance. The Company Secretary is responsible for ensuring that Board procedures and policies are followed and the Company Secretary and the General Counsel provide advice to the Board on corporate governance and regulatory matters. All Directors have unrestricted access to the advice and services of the Company Secretary and the General Counsel. The independence of the Directors is regularly reviewed. In accordance with the Board’s charter, all Directors must declare immediately to the Board any actual or potential conflict of interest. Where a conflict of interest arises, the Director concerned will not participate in discussions or vote on any resolution relating to the matter without the approval of a majority of other Directors. GOODMAN FIELDER ANNUAL REPORT 2014 3 GOODMAN FIELDER ANNUAL REPORT 2014 Corporate Governance Statement (continued) 2.6 BOARD COMMITTEES The Board has established four Board Committees, each composed of non-executive Directors, to assist in the performance of the Board’s responsibilities. Each Committee has a written charter which is approved by the Board and is reviewed and updated as necessary. The Charters of each of the Board Committees are available on the Company website. Membership of the Board Committees at 30 June 2014 is set out below. All Members held office throughout the financial year except Mr Cornell, who was appointed a Director and a Member of the Human Resources and Remuneration Committee effective 15 February 2014. Audit Committee Corporate Risk Committee Nomination Committee Human Resources and Remuneration Committee Committee Chairman Clive Hooke Peter Hearl Steven Gregg Chris Froggatt Members Jan Dawson Peter Hearl Ian Johnston Jan Dawson Chris Froggatt Chris Froggatt Ian Johnston Clive Hooke The Board may appoint additional non-executive Directors to a Committee or remove and replace members of the Committee by resolution. Details of Directors’ attendance at each Committee meeting during the 2014 financial year are set out on page 27. All Directors receive copies of Committee papers and non-executive Directors who are not Committee members may attend Committee meetings by standing invitation. Each Committee reports to the Board and, following preparation of the minutes of each Committee meeting, provides the Board with copies of those minutes at the next occasion the Board meets. Ian Cornell Peter Hearl Ian Johnston In addition to its charter, there is a policy and procedure for the selection and appointment of new Directors to the Board. The Board utilises independent advisors to assist in identifying and assessing potential candidates for Board positions, based upon criteria specified by the Committee. The criteria are determined with a view to selecting new Directors whose skills, experience, expertise and other attributes will complement the qualities of existing Board members and enhance the effectiveness of the Board as a whole. The Board recognises the importance of diversity at all levels of the organisation and seeks to draw future Directors from a broad pool of candidates. MEETINGS OF THE NOMINATION COMMITTEE 2.7 NOMINATION COMMITTEE The Nomination Committee is responsible for periodically reviewing and considering the structure of the Board, assessing the skills and competencies required on the Board and making recommendations regarding appointments, retirements and terms of office of Directors. The current members of the Nomination Committee are Mr Steven Gregg (Chairman), Ms Chris Froggatt and Mr Ian Johnston, all of whom are independent non-executive Directors. The composition of the Board is regularly assessed by the Committee to ensure that the Board continues to comprise Directors with a mix of qualifications, experience and expertise which will assist the Board in fulfilling its responsibilities, as well as assisting the Company in achieving growth and delivering value to shareholders. The Committee is also responsible for assessing the competencies of potential Board candidates, reviewing Board succession plans and induction procedures for new appointees to the Board and establishing processes for the review of performance of individual Directors and the Board as a whole. Board size and diversity are considered as part of the Committee’s assessment of Board composition and its succession planning process. 4 GOODMAN FIELDER ANNUAL REPORT 2014 The Committee charter provides that the Committee will meet at least once each calendar year on a formal basis and additionally as circumstances may require. The Committee met once during the 2014 financial year and the Committee members and all Directors met informally on a number of other occasions in connection with Board succession planning and the selection and appointment of a new non-executive Director. 2.8 BOARD PERFORMANCE EVALUATION The Nomination Committee is responsible for arranging performance evaluations of the Board, its Committees and individual Directors. A formal performance evaluation and assessment of Board effectiveness was completed by an external corporate governance advisor during the 2011 financial year and the Board undertook an internal Board performance evaluation for the year ended 30 June 2012. The internal performance evaluation process involved completion of questionnaires by all Directors and the senior executives reporting directly to the CEO (the “Group Executive”) followed by one-on-one interviews conducted by the Chairman. The results of each of these performance evaluations were shared with the Board and each Director by the Chairman and the action items identified were either addressed or form part of a process of continuous improvement and ongoing communication between the Board and management to enhance Board effectiveness. GOODMAN FIELDER ANNUAL REPORT 2014 Corporate Governance Statement (continued) With the change in Chairman, appointment of a new Director and changes in Committee composition during the 2013 financial year, the Board decided to delay a formal performance evaluation until the following financial year. Board members completed a questionnairebased evaluation during the 2014 financial year, with questionnaires returned to the Chairman for review and further consideration. Implementation of action items identified through the performance evaluation process has been impacted by the proposed acquisition of the Company by Wilmar International Limited (“Wilmar”) and First Pacific Company Limited (“First Pacific”). It is currently intended that a performance evaluation and independent review of Board effectiveness will be conducted by an external advisor at the end of the 2015 financial year. 2.9 RETIREMENT AND RE-ELECTION OF DIRECTORS The Company’s Constitution requires that non-executive Directors appointed by the Board during the year must offer themselves for election by shareholders at the next Annual General Meeting of the Company. In addition, a non-executive Director may not serve without seeking re-election beyond the third Annual General Meeting following his or her election or last re-election. Retiring Directors may offer themselves for re-election by the shareholders. The Board does not impose a pre-determined restriction on the tenure of Directors as it considers that this restriction may result in the loss of vital experience and expertise. 2.10 DIRECTOR EDUCATION An induction program has been established for new Directors to gain background and insight into the Group’s structure, business operations, strategies and policies and guidelines. As part of the program, Directors receive a detailed induction pack, meet with key senior executives from each division and corporate function and are given the opportunity to conduct site visits at significant operational facilities in various locations, as well as visits to stores and depots. Monthly Board reports include information on recent regulatory developments, as well as commentaries on relevant issues which are provided for Director consideration. Presentations by external advisors on regulatory developments relating to OH&S, the environment and other matters are arranged by management as considered appropriate. Principle 3: Promote Ethical and Responsible Decision-Making 3.1 CORPORATE CODE OF CONDUCT OF EMPLOYEES The Corporate Code of Conduct of Employees (“Code of Conduct”) applies to all Directors, officers and employees of the Group. It underpins Goodman Fielder’s commitment to integrity, fair dealing and compliance with the law in its business affairs, and sets out expected standards of conduct with respect to all stakeholders, including fellow employees, customers, suppliers, shareholders and the community. The Code of Conduct is designed to encourage ethical and appropriate behaviour by all Group personnel, covering a wide range of responsibilities including conflicts of interest, security of information, use of company assets and resources, discrimination and harassment, occupational health and safety and corrupt conduct. The Code of Conduct encourages employees to raise any matters of concern with the head of their business unit or the General Counsel or Company Secretary without fear of retribution. Employees are also able to contact a whistleblower hotline operated by an external party to report misconduct or unethical behaviour within the Group. The Company maintains a Competition and Consumer Law Compliance Program which involves ongoing training and monitoring of relevant staff in relation to the requirements of trade practices and consumer protection legislation. The Company has also established a conflicts of interest policy and a register enabling employees to record any interests they have which might conflict with their obligations and duties to the Group. Salaried employees are required to provide an acknowledgement of and confirmation of compliance with the Company’s Code of Conduct and conflicts of interest policy (both on commencement of employment and on a periodic basis) and to ensure they disclose any relevant matters in accordance with specified requirements. 3.2 CODE OF ETHICS AND CONDUCT OF DIRECTORS, SENIOR EXECUTIVES AND OFFICERS The Company recognises the integral role of Directors and senior executives in fostering a culture of compliance and ethical conduct and has adopted a Code of Ethics and Conduct of Directors, Senior Executives and Officers (“Code of Ethics”). The Code of Ethics sets out the Company’s requirements for all Directors, senior financial officers and senior executives to promote and engage in ethical behaviour, maintain confidentiality and comply with all applicable laws and regulations, so as to maintain the Group’s integrity and its reputation for fair dealing. It includes an obligation to report unethical behaviour by Directors and senior executives to the Chairman of the Corporate Risk Committee and to report information regarding significant internal control deficiencies or frauds involving management or senior employees with financial reporting, disclosure or internal control responsibilities to the Chairman of the Audit Committee. 3.3 DIVERSITY POLICY AND OBJECTIVES The Company’s diversity policy was approved by the CEO and Board in July 2011. The policy, a copy of which is available on the Company’s website, includes requirements for the Board to establish measurable objectives for achieving gender diversity and for the Board to annually assess the objectives and progress in achieving them. As part of its expanded responsibility for human capital matters, the Human Resources and Remuneration Committee has responsibility for reviewing the relative proportion of women and men at all levels of the organisation and monitoring the Company’s performance in respect of its diversity initiatives. It is the Company’s intention to focus initially on gender diversity and associated workplace flexibility initiatives and then expand its programs to embrace other areas of diversity. GOODMAN FIELDER ANNUAL REPORT 2014 5 GOODMAN FIELDER ANNUAL REPORT 2014 Corporate Governance Statement (continued) The Company’s diversity objectives for the 2014 financial year, and its progress in relation to each objective are set out below: Diversity Initiative Measure Progress ROUND TABLE – GENDER DIVERSITY FORUM The Company will maintain a Round Table, constituted by a group of the most senior women in the organisation, to discuss and promote diversity initiatives, with the support of the CEO and Board Hold two meetings per annum, supplemented by two Executive Leadership Team meetings per annum Two Round Table meetings were conducted in addition to one Executive Leadership Team (“ELT”) meeting. The second ELT meeting was postponed in line with cost reduction strategies. SENIOR EXECUTIVE ROLE MODELLING AND COMMUNICATIONS Group Executive support and communication of diversity objectives, initiatives and outcomes is critical to fostering diversity throughout the organisation This remains an extremely important initiative for the Company. In FY14 the Company will implement and train its “Goodman Fielder Way for Leadership” model and new “Perform and Grow” system (performance system) across Goodman Fielder. This will further embed the Company’s values, including its position on diversity, and will be led by the CEO, Managing Directors and Executive Leadership Team members (the top 60 leaders) All salaried staff in Australia, New Zealand, Fiji, PNG and New Caledonia have been trained in the Company’s new approach to performance evaluation. Employee performance is now measured on goal achievement and behavioural standards reflecting the Company’s values and leadership competencies. Country Managers and their direct reports in Asia will be trained before the end of the 2014 calendar year before cascading to lower levels. The Company’s values statements explain Goodman Fielder’s expectations of employees regarding their contribution to a culture that fosters diversity. A pay equity review will be undertaken each financial year as part of the annual remuneration review cycle The pay equity review has been completed. Adjustments were made to the pay of women where appropriate and were in effect from 1 October 2013. Continue to ensure each of the Company’s senior women (and senior men) at executive level have a formal mentor All Senior Leaders (direct reports to Managing Directors and Chief Officers) in the organisation as at the beginning of FY14 have a formal mentor. New Senior Leaders will be assigned a mentor through the upcoming talent review cycle. The Company’s CEO will continue his strong support of the Pottinger Glass Elevator initiative, which has provided external mentoring to many of Goodman Fielder’s senior women at executive level Six of the Company’s female Senior Leaders are active participants in the highly valued Pottinger Glass Elevator initiative. Goodman Fielder is a proud supporter of the Glass Elevator initiative and it is the Company’s hope that two to three additional Australian female executives will be nominated in January 2015. The Company’s senior women will mentor more junior women at the next level, both within and outside of the Company. The talent review cycle drives assignment of mentors to key female talent below the Senior Leader level and Goodman Fielder will place more emphasis on this in FY15. PAY EQUITY REVIEW The Company will include a pay equity review as part of its annual remuneration review process MENTORING OF SENIOR WOMEN The Company considers mentoring to be an important part of its talent development plans and will take steps to promote mentoring of its current and future leaders 6 GOODMAN FIELDER ANNUAL REPORT 2014 GOODMAN FIELDER ANNUAL REPORT 2014 Corporate Governance Statement (continued) Diversity Initiative Measure Progress his program will continue to be trained T across the Company in FY14, with particular emphasis on site leadership 317 salaried employees have been trained in the first two modules of the 8 module program (22% of leaders trained were women). Extensive restructuring of the Company has slowed implementation in the last 6 months of FY14. It is anticipated the implementation of this program will continue at the beginning of FY15. Implemented and ongoing to ensure appropriate gender representation in candidate pools for senior roles, including at the Group Executive level Five external Senior Executive appointments (MD or Chief Officer or their direct reports) were made in FY14. Of those, two were women. FRONTLINE LEADERSHIP TRAINING The Company’s Frontline Leadership Training Program (an internal people-management training program) will be maintained across the Group RECRUITMENT The Company will seek to ensure gender representation in candidate pools for available positions Of the 12 senior level promotions or significant role expansions/changes that occurred in FY14, 50% of those roles were held by women. CONSISTENT APPLICATION OF FLEXIBLE WORK PRACTICES POLICIES The Company will take steps to achieve consistency in application of its Flexible Workplace Policies Ongoing Flexible work practices were put in place for employees based on the merit of the application and their performance, which has benefitted many mothers and other Goodman Fielder workforce members, resulting in positive business outcomes. The additional initiative in FY14 is the implementation of the Company’s Values as Competency statements, which will spell out the leader’s role in supporting diversity of all types. All people managers will be trained in this approach and will be measured against each of the Company’s Values as Competencies in the FY14 performance cycle All salaried leaders in Australia, New Zealand, Fiji, PNG and New Caledonia participated in training of the Company’s new performance evaluation approach. Each leader has the Company’s six values in their performance plans and their level of performance in each value will be evaluated at the close of FY14. VISION, VALUES AND CORE PURPOSE The Company will implement a revised Vision, Values and Core Purpose for the organisation, as a catalyst for cultural change GOODMAN FIELDER ANNUAL REPORT 2014 7 GOODMAN FIELDER ANNUAL REPORT 2014 Corporate Governance Statement (continued) The Company’s diversity objectives for 2015 are as follows: Diversity Initiative FY15 Measure ROUND TABLE – GENDER DIVERSITY FORUM The Company will maintain a Round Table, constituted by a group of the most senior women in the organisation (female direct reports to the Group Executive), to discuss and promote diversity initiatives, with the support of the CEO and Board •Hold two meetings of Senior Leaders in FY15 DIVERSITY SURVEY The Company will undertake to survey employees through its engagement survey to understand perceptions of diversity and diversity practices within the organisation, to inform further initiatives •Conduct diversity baseline survey in FY15 Q3 SENIOR EXECUTIVE ROLE MODELLING AND COMMUNICATIONS Group Executive support and communication of diversity objectives, initiatives and outcomes is critical to fostering diversity throughout the organisation •Key talent discussion circles formed in FY15 Q4 to define and present recommendations on diversity issues PAY EQUITY REVIEW The Company will include a pay equity review as part of its annual remuneration review process •The pay equity review will be undertaken each financial year as part of the annual remuneration review cycle MENTORING OF SENIOR WOMEN The Company considers mentoring to be an important part of its talent development plans and will take steps to promote mentoring of its current and future leaders •Align mentors with each of the Company’s senior women (and senior men) at the Senior Executive level by the end of FY15 Q2 •Continued participation in the Pottinger Glass Elevator initiative, with the aim to have two to three additional senior women nominated in the 2015 intake •Sponsorship of the Pottinger Glass Elevator Conference in August 2014 MENTORING OF WOMEN BELOW OUR SENIOR LEADERS The Company considers mentoring at lower levels of the organisation as important for building the pipeline of female talent •Senior executive mentors aligned to female key talent with leadership potential, identified through the talent review process, by end of FY15 Q1 LEADERSHIP DEVELOPMENT Design of additional modules of the Company’s “Leading Teams the GF Way” program will continue to be led by Goodman Fielder’s Organisation Development team and will be sponsored for implementation across the Company •Extend the implementation of modules 1 and 2 of “Leading Teams the GF Way” program across the organisation and commence the rollout of new modules to those leaders trained in FY14 RECRUITMENT The Company will seek to ensure gender representation in candidate pools for available positions •Ensure appropriate gender representation in candidate pools for executive, senior manager and critical business roles. CONSISTENT APPLICATION OF FLEXIBLE WORK PRACTICES POLICIES The Company will take steps to achieve consistency in application of its Flexible Workplace Policies 8 GOODMAN FIELDER ANNUAL REPORT 2014 •Objectively assess requests and implement flexible working arrangements based on the merit of the request and performance GOODMAN FIELDER ANNUAL REPORT 2014 Corporate Governance Statement (continued) 3.4 DIVERSITY REPORTING The Company continues to enhance its data collection and reporting procedures to provide more comprehensive diversity information across the Group, which will better enable management and the Directors to monitor the Company’s progress towards achieving agreed diversity objectives. Information on the proportion of women within the organisation is as follows: BOARD – 25% (NON-EXECUTIVE DIRECTORS – 29%) The Board currently includes two female directors – Ms Chris Froggatt and Ms Jan Dawson. With the appointment of Mr Cornell, a non-executive Director, to the Board in February 2014, 25% of the Directors (and 29% of the non-executive Directors) are women. SENIOR EXECUTIVES – 32% (SENIOR LEADERS – 45%) Female representation in the Company’s Senior Executive population (the Group Executive and their direct reports) increased from 22% to 32% in the reporting period. The percentage of women in the Senior Leadership population (i.e. direct reports to Managing Directors and Chief Officers) is now 45%. This has been achieved while also maintaining a strong focus on top talent – 53% of the top talent pool at this level of seniority are women (as last assessed during the October 2013 annual talent review). The Company continues with the practice of appointing people to roles based on merit. GROUP – 27% Across the Group, women comprise approximately 29% of employees in Australia, 34% in New Zealand and 15% in the Asia Pacific business. 3.5 WORKPLACE GENDER EQUALITY ACT (WGEA) Under the Workplace Gender Equality Act 2012 (Cth), Goodman Fielder Limited is required to lodge an annual public report with the Workplace Gender Equality Agency. The Company’s 2013-14 report has been lodged with the Agency and a copy of the report can be accessed under “Who We Are” on the Company’s website (ww w.goodmanfielder.c om.au). Principle 4: Safeguard Integrity in Financial Reporting 4.1 AUDIT COMMITTEE The Audit Committee assists the Board in fulfilling its responsibility to oversee the quality and integrity of accounting, auditing and reporting practices of the Company and it reports to the Board on all matters relevant to the Committee’s role and responsibilities. The specific responsibilities of the Audit Committee are set out in its charter and include: •reviewing and assessing the internal and external reporting of financial information; •assessing management processes supporting the integrity and reliability of the Company’s financial and management reporting systems and its external reporting, including assessing the effectiveness and adequacy of the Company’s internal control framework; The charter establishes a framework for the Committee’s relationship with the internal and external auditor and a policy has been adopted for the selection and appointment of the external auditor and for rotation of external audit partners. 4.2 COMPOSITION Consistent with the ASX Listing Rules, the charter provides for the Committee to have at least three members, all of whom must be non-executive Directors, with a majority being independent. All members must be financially literate and at least one member must have an accounting or financial background. Independent non-executive members must satisfy the independence requirements of the Recommendations. Under the charter a Director may not be both the Chairman of the Committee and the Chairman of the Board. The current members of the Audit Committee are Mr Clive Hooke (Chairman), Mr Ian Johnston, Mr Peter Hearl and Ms Jan Dawson, all of whom are independent non-executive Directors. Mr Hooke, the Chairman of the Audit Committee, is a qualified accountant who has held senior finance positions with a number of significant listed companies. Mr Johnston is a qualified accountant who has over 30 years’ experience in the international food and beverage industry, including his most recent position as Chief Executive Officer of Foster’s Group Limited. Mr Hearl is an experienced senior executive with expertise in the FMCG sector, who has worked extensively in Europe, the USA, Australia and the Asia Pacific region, most recently as Chief Operating and Development Officer for Yum Brands, the world’s largest (by number of outlets) restaurant company. Ms Dawson is a former audit partner of KPMG New Zealand with extensive experience encompassing audit and accounting advice, due diligence, capital transactions, risk management and governance. 4.3 MEETINGS OF THE AUDIT COMMITTEE The Audit Committee met four times during the year ended 30 June 2014. Details of attendance at meetings of the Audit Committee are set out on page 27 of the Annual Report. Meetings are attended by invitation by the other non-executive Directors, with the CEO, CFO, Audit & Risk Assurance Director and the external auditor, KPMG, attending as required. 4.4 EXTERNAL AUDITOR The external auditor is responsible for planning and carrying out the audit of the Group’s annual financial reports and reviewing the Group’s half-yearly financial reports. The auditor provides a written confirmation of independence to the Company in connection with the Company’s financial reports for each half-year and financial year. The external auditor, KPMG, was appointed in October 2005. Mr Kevin Leighton became the lead external audit engagement partner following completion of the audit for the 2011 financial year, replacing Mr David Rogers who had served as lead audit partner for the previous five-year period. The Committee may meet with the external auditor without management being present at any time during the financial year and met privately with KPMG on four occasions during the year ended 30 June 2014. The external auditor is also provided with the opportunity, on request, to meet with the Board of Directors without management being present. •overseeing the relationship with and performance of the external auditor and assessing the independence of the external auditor; and •overseeing the performance of the internal audit and risk assurance function. GOODMAN FIELDER ANNUAL REPORT 2014 9 GOODMAN FIELDER ANNUAL REPORT 2014 Corporate Governance Statement (continued) Principle 5: Make Timely and Balanced Disclosure 5.1 CONTINUOUS DISCLOSURE The Company is committed to ensuring that the market and shareholders are provided with complete and timely information. The Company has in place a continuous disclosure policy to ensure that all “market sensitive” information is disclosed to the ASX and NZX in accordance with the disclosure requirements of the Corporations Act 2001 and the Companies Act 1993, respectively, and the listing rules of the relevant exchange. The Company Secretary is responsible for co-ordinating disclosure of information to the ASX and NZX and, as appropriate, to shareholders. All announcements provided to the ASX or NZX are posted on the Company’s website as soon as practicable after release to the market. 5.2 COMMENTARY ON FINANCIAL RESULTS AND PERIODIC DISCLOSURE It is Goodman Fielder’s objective to provide investors with sufficient information to make an informed assessment of the Company’s activities and results. Results announcements and media/analyst presentations are released to the ASX and NZX and made available on the Company’s website. Webcasts of results presentations are also available on Goodman Fielder’s website. The Annual Report contains an operating and financial review, to assist shareholders in understanding the Company’s operating results, business strategies, prospects and financial position. In recent years the Company has also scheduled an annual information day for institutional shareholders and analysts to provide an update on its strategies and progress against its strategic plan, with a webcast and presentations included on its website for viewing by retail shareholders. The Company Secretary is responsible for co-ordinating disclosure of results announcements and presentations to the ASX and NZX, for the issue of the Annual Report to shareholders and, in conjunction with the General Counsel, for ensuring compliance with the Company’s periodic reporting and disclosure obligations (and those of its subsidiary, Goodman Fielder New Zealand Limited, whose debt securities are listed on the NZX Debt Market) under applicable corporations legislation and the listing rules of the relevant exchange. Principle 6: Respect the Rights of Shareholders 6.1 COMMUNICATIONS WITH SHAREHOLDERS The Company is committed to promoting effective communication with shareholders and seeks to encourage informed shareholder participation at the Annual General Meeting and any shareholder information meetings. Where practical, the Company uses technology to facilitate communication with shareholders. Webcasts of the Annual General Meeting and results briefings allow access by all interested parties and electronic lodgement of proxies has also been implemented. The Company’s website includes links to announcements given to the ASX and NZX and copies of the annual and half-yearly reports, notices of meetings, presentations and speeches by the CEO and Chairman and other information released to the market. The Company utilises email where possible to provide shareholders with timely access to information. Goodman Fielder’s Annual Report currently remains one of the principal means of communicating with shareholders, but the Company continues to consider alternative reporting and disclosure processes which will provide clear and effective communication to 10 GOODMAN FIELDER ANNUAL REPORT 2014 shareholders about the Company’s operations and performance. The Company’s Annual Review, which is issued in or around October and is available online on the Company’s website, incorporates information about the Company’s vision and values, its strategy, brands and people, its operating and financial performance and its sustainability objectives and performance. 6.2 SHAREHOLDER MEETINGS Shareholders are able to contact the Company with queries at any time but also have the opportunity to submit questions prior to the Annual General Meeting or to raise matters at the Annual General Meeting with the members of the Board. Kevin Leighton, the KPMG partner in charge of the Goodman Fielder audit, also attends the Annual General Meeting and is available to answer questions from shareholders on audit-related matters. 6.3 BRIEFINGS WITH INVESTORS AND ANALYSTS Information regarding upcoming results announcements is available on the Company’s website and webcast links are provided in advance of analyst briefings. The Company maintains internal records of briefings held, including a record of the time and place of the meeting, those attending, and issues discussed. Principle 7: Recognise and manage risk 7.1 CORPORATE RISK COMMITTEE The Board recognises that the effective management of risk is essential to achieve the Group’s objectives of optimising Group performance and creating long-term shareholder value while meeting its commitments to other stakeholders, including its employees, customers and the wider community. The nature of the Group’s business requires the management of a diverse set of risks relating to the Group’s operations and its products, including the sustainability of its operations over the short and longer-term. With manufacturing and distribution operations throughout Australasia and parts of the Asia Pacific region and a portfolio of consumer brands in some of Australia and New Zealand’s largest grocery categories, the risk priorities of the Group involve management of key enterprise risks, including workplace safety and security, food safety and quality, supply chain and manufacturing, strategy and project/program execution, relationships with key customers, and commodity and product innovation risks. The Board is responsible for overseeing and approving a sound system of risk oversight and management and internal control, but recognises that no cost effective risk management system will preclude all errors and irregularities. The Corporate Risk Committee assists the Board in fulfilling its responsibility to oversee the quality and effectiveness of the Company’s risk management system and framework and it reports to the Board on all matters relevant to the Committee’s role and responsibilities. The composition and specific responsibilities of the Committee are set out in its charter. The current members of the Committee are Mr Peter Hearl (Chairman), Mr Clive Hooke, Ms Chris Froggatt and Ms Jan Dawson, all of whom are independent non-executive Directors. The Committee met three times during the year ended 30 June 2014. Details of attendance at meetings of the Committee are set out on page 27 of the Annual Report. Meetings are attended by invitation by the other non-executive Directors, with the CEO, CFO, Chief Supply Chain & Operations Officer and Audit & Risk Assurance Director attending each meeting, along with Category Risk Officers or Leaders for risks rated as “extreme”, and other executives attending as required. GOODMAN FIELDER ANNUAL REPORT 2014 Corporate Governance Statement (continued) 7.2 RISK MANAGEMENT FRAMEWORK The following risk management framework was in place during the 2014 financial year: ENTERPRISE RISK MANAGEMENT Goodman Fielder’s risk management system is based upon the principles of the Australian/New Zealand Standard for risk management ISO 31000:2009. The Board has delegated responsibility to the Corporate Risk Committee to oversee the implementation and ongoing review of the Group’s risk management framework, including its Enterprise Risk Management Policy and related Risk Management Procedure. Responsibility for risk management is shared across the organisation, through a governance structure which allows the integration of risk management into the Company’s key business operations and processes. The objective is to ensure that accountability for risk is embedded across the organisation, with lines of risk reporting to ensure that key business risks and actions are appropriately disclosed and managed at the right levels within the organisation. All businesses and functions within the Group have adopted a standardised methodology to identify, analyse and evaluate risks. Goodman Fielder’s risk management framework sets out the policy and process followed to enable the identification, assessment, treatment, reporting and monitoring of risks on a business and Group basis. Each Category Risk Officer, with the support of Category Risk Leaders, has responsibility for managing risks relevant to that Risk Category by developing controls which are designed to avoid, mitigate or share risk, consistent with the Group’s risk appetite. Detailed risk registers are maintained and analysed on a periodic basis. Extreme and high rated risks, action plans to address those risks and new or emerging risks are subject to an Executive Risk Review (conducted by the CEO, CFO, Chief Supply Chain & Operations Officer and members of the Audit & Risk Assurance Group) and, following that review, are reported to the Corporate Risk Committee. The Corporate Risk Committee, which holds scheduled meetings at least three times yearly, reviews the risk management reports and receives presentations from Category Risk Officers and Category Risk Leaders in relation to extreme and high rated risks (covering, amongst other things, existing and planned actions for the management of risk, the effectiveness of risk management activities and, where applicable, incident reports and scorecards with lead and lag indicators), new or emerging risks and other matters within the Committee’s responsibility and the Committee then reports to the Board on those risk-related matters to be brought forward for the Board’s consideration. The Board also receives a monthly report from management on a number of key risk areas, including divisional and Group safety, food safety and quality, human capital and environmental matters. In addition, the Audit Committee and Human Resources and Remuneration Committee monitor risk management activities that fall within the scope of their responsibilities, such as fraud investigations and employee turnover and engagement. The Group’s risk governance structure is as follows: BOARD OF DIRECTORS AUDIT COMMITTEE CORPORATE RISK COMMITTEE HUMAN RESOURCES AND REMUNERATION COMMITTEE EXECUTIVE RISK REVIEW (CEO, CFO, CHIEF SUPPLY CHAIN & OPERATIONS OFFICER, AUDIT & RISK ASSURANCE GROUP) CATEGORY RISK OFFICERS CATEGORY RISK LEADERS GOODMAN FIELDER ANNUAL REPORT 2014 11 GOODMAN FIELDER ANNUAL REPORT 2014 Corporate Governance Statement (continued) Strategic business risk is considered in establishing and reviewing the strategy and business plans of the brands and businesses, divisions and Group. Risk analysis is conducted in relation to major projects and change initiatives and the Corporate Risk Committee or Board is provided with risk profile reports and status updates in relation to significant projects. The Group also evaluates the economic balance between self-retention of risks and risk transfer and has implemented insurance arrangements for risk transfer with international insurers of high prudential standards. The Group monitors its compliance with its risk management policy and, amongst other risk control measures, develops contingency plans to manage potential business interruptions. The Corporate Risk Committee monitors the Group’s sustainability initiatives as part of its overall review of the Group’s risk management activities. The Group Sustainability Manager works with the divisions and corporate functions to progress sustainability initiatives throughout the Group and to implement tools and procedures to better enable the Group to measure, monitor and report on its sustainability performance, based upon the Global Reporting Initiative Sustainability Reporting Guidelines. Goodman Fielder issued its first publicly available Sustainability Report in October 2009 and obtained external assurance for the first time for its 2011 Sustainability Report. The Company now includes sustainability information in its Annual Review rather than a separate Sustainability Report and its 2014 Annual Review, which will be issued in or around October 2014, will identify progress made against its 2014 sustainability action plans and outline its sustainability objectives for the 2015 financial year. FINANCIAL RISKS The Company has a comprehensive strategic planning, capital management and budgeting system, the results of which are presented to and approved by the Board. Management and the Board monitor performance against budget and key financial benchmarks through monthly reporting routines, detailed reviews of strategic projects and initiatives and variance analysis. A comprehensive Financial Exposure and Risk Management System has been adopted to manage and monitor the Group’s treasury and commodity related risks, including its exposures to foreign currencies, interest rates and commodity prices and the management of its cash flows and liquidity. The Board has approved a Commodities Policy to manage the financial risks associated with changes in the market prices of wheat, oils, flour, tallow and sugar used in products produced by the Group. The policies and procedures implemented to manage these risks include the establishment of authorisation levels for entry into/ approval of transactions, restricting hedging to pre-established limits, timely reporting of compliance with requirements and specific procedures for identifying and rectifying non-compliance. The Group’s commodities procurement function is centralised to enhance operating efficiency and better manage operational risks relating to the procurement, hedging and delivery of commodities. A number of different strategies have been adopted to more closely manage risks related to the Group’s working capital and debt funding. The Group maintains a conservative approach to its working capital management and implemented measures across its divisions to further improve its cash realisation capabilities. In addition, proceeds from business divestments completed during the 2013 and 2014 financial years have primarily been used to reduce debt and further strengthen the financial position of the Group. 12 GOODMAN FIELDER ANNUAL REPORT 2014 FINANCIAL REPORTING, INTERNAL CONTROLS AND REGULATORY COMPLIANCE The Board has responsibility for reviewing and ratifying internal compliance and control systems. The Audit Committee, in conjunction with the Corporate Risk Committee, reviews the effectiveness and adequacy of internal control processes relating to financial reporting on a regular basis and reports its findings to the Board. Management assumes primary responsibility for implementing internal controls and for maintaining a sound internal control environment. In accordance with the Company’s internal procedures, the Managing Director and Finance Director of each division and the head of each corporate function report every 6 months to the CEO and the CFO and, on an exceptions basis, to the Audit Committee, on the operation and effectiveness of key internal controls relating to their division or corporate function. Any identified deficiencies in internal controls are followed up and addressed by corporate or divisional management. The Company also maintains an internal audit and risk assurance function to conduct internal audits and reviews of the Group’s operations. The Audit Committee reviews reports from the Audit & Risk Assurance Director at each Committee meeting, monitors the scope and resources of the function and approves the annual internal audit and risk assurance plan. In addition to the audit and assurance activities conducted by the internal audit and risk assurance function, audits and compliance reviews are conducted with the assistance of independent experts where necessary, to review compliance with legal and regulatory obligations and the Group’s policies and procedures and to identify areas for improvement. 7.3 ASSURANCE – RISK MANAGEMENT AND INTERNAL CONTROL SYSTEMS As part of the process of Board approval of the Company’s half-year and annual financial reports, the CEO and the CFO are required to state to the Board, in writing, that the Company’s financial reports present a true and fair view, in all material respects, of the Company’s financial condition and operational results and are in accordance with relevant accounting standards. The Board also receives a written statement of assurance from the CEO and the CFO that, to the best of their knowledge and belief: 1.the declaration provided in accordance with section 295A of the Corporations Act is founded on a sound system of risk management and internal compliance and control which, in all material respects, implements the policies adopted by the Board; and 2.the Group’s risk management and internal compliance and control system for the relevant period is operating effectively in all material respects in relation to financial reporting risks. These statements regarding the quality and effectiveness of the risk management and internal compliance and control system are supported by confirmations from the most senior executives in each of the divisions and the heads of the corporate functions. The CEO and CFO also provide a separate representation letter to the Board covering specific areas of Board reliance in relation to the half-year and annual financial reports. GOODMAN FIELDER ANNUAL REPORT 2014 Corporate Governance Statement (continued) Principle 8: Remunerate Fairly and Responsibly 8.1 HUMAN RESOURCES AND REMUNERATION COMMITTEE The Human Resources and Remuneration Committee has responsibility for reviewing and making recommendations to the Board on the remuneration of non-executive Directors and the remuneration packages and policies applicable to executive Directors and other members of the Group Executive. The Committee is also responsible for monitoring the organisational capability of the Group, including having regard to talent and succession management for key roles and functions and monitoring the effectiveness of the Group’s recruitment, retention and termination policies and procedures and succession planning processes for senior executives. Additionally, it reviews and approves any equity-based plans and other incentive schemes. The Committee reviews the performance of all executives who report directly to the CEO as part of their annual remuneration review. The Committee’s role also extends to monitoring the culture of the Group and significant governance, regulatory and industry issues which impact the Group’s approach to human capital and people management, as well as reviewing the effectiveness of policies and procedures relating to employee retention, productivity and engagement and diversity. The maximum aggregate remuneration of non-executive Directors is determined by a resolution of shareholders and is then divided between the Directors as agreed by the Board. The current aggregate fee pool, which was approved by the Company’s shareholders at the General Meeting held in 2005, is $1.5 million. The total remuneration paid to non-executive Directors for the 2014 financial year was $1.248 million, approximately 83% of the maximum amount approved by shareholders. The total fee pool and the manner in which it is apportioned amongst non-executive Directors is reviewed annually by the Human Resources and Remuneration Committee and recommendations made to the Board. The Committee and Board consider remuneration benchmarking data and recommendations from their independent remuneration advisor when undertaking the annual review process. Directors of Goodman Fielder are required to hold a minimum of 100 shares in the Company. Directors are encouraged to be long-term holders of the Company’s shares but are not obligated to invest any portion of their cash remuneration in purchasing additional shares. Directors’ interests in shares in the Company are set out on page 29. 8.5 REMUNERATION REPORT 8.2 COMPOSITION The Committee is currently composed of four independent non-executive Directors – Ms Chris Froggatt (Chairman), Mr Ian Cornell, Mr Peter Hearl and Mr Ian Johnston. As required by the Committee’s charter, the Chair is an independent non-executive Director. 8.3 MEETINGS OF THE HUMAN RESOURCES AND REMUNERATION COMMITTEE Its charter provides for the Committee to meet three times each year on a formal basis and additionally as circumstances may require. Details of attendance at Committee meetings during the year are set out on page 27. The Company’s remuneration policy and procedures in respect of senior executives who are key management personnel of the Group are discussed in its Remuneration Report for the financial year ended 30 June 2014 which is set out on pages 31 to 55 of this Annual Report. No current or proposed equity-based executive remuneration involves the issue of additional shares by Goodman Fielder. All shares which may be allocated to executives under equity plans are intended to be acquired on-market, with the relevant cost expensed in accordance with accounting standards. Further information regarding offers made to executives under share-based incentive arrangements is set out on pages 39 to 46 of the Remuneration Report. 8.4 DIRECTORS’ REMUNERATION The Remuneration Report sets out the total remuneration of non-executive and executive Directors of the Company. Mr Gregg receives a fee for serving as Chairman of the Board but does not receive any additional fees for serving on Board Committees. Each of the other non-executive Directors is entitled to a fee for serving as a Director of the Company and an additional fee for serving on the Audit, Corporate Risk or Human Resources and Remuneration Committees. These fees are inclusive of any compulsory superannuation contributions. Non-executive Directors are not entitled to any pensions or other termination benefits upon ceasing to be a Director of the Company. In general, no additional fees are payable to non-executive Directors for other services performed outside the scope of their ordinary duties as a Director or Committee member. GOODMAN FIELDER ANNUAL REPORT 2014 13 GOODMAN FIELDER ANNUAL REPORT 2014 Corporate Governance Statement (continued) 2nd edition of ASX Corporate Governance Council’s Corporate Governance Principles and Recommendations with 2010 amendments Reference Comply 1.1, 1.2 PRINCIPLE 1: LAY SOLID FOUNDATIONS FOR MANAGEMENT AND OVERSIGHT 1.1 Establish and disclose the functions reserved to the Board and those delegated to senior executives 1.2 Disclose the process for evaluating the performance of senior executives 1.3, Remuneration Report 1.3 Provide the information indicated in the Guide to reporting on Principle 1 website, 1.1 – 1.4 PRINCIPLE 2: STRUCTURE THE BOARD TO ADD VALUE 2.1 A majority of the Board should be independent Directors 2.3 2.2 The Chair should be an independent Director 2.3, 2.4 2.3 The roles of Chair and CEO should not be exercised by the same individual 2.4 2.4 The Board should establish a Nomination Committee 2.6, 2.7 2.5 Disclose the process for evaluating the performance of the Board, its Committees and individual Directors 2.8 – 2.10 2.6 Provide the information indicated in Guide to reporting on Principle 2 website, Directors’ Report, 2.1 – 2.10 PRINCIPLE 3: PROMOTE ETHICAL AND RESPONSIBLE DECISION-MAKING 3.1 Establish a code of conduct and disclose the code or a summary of the code as to the practices necessary to maintain confidence in the Company’s integrity and to take into account legal obligations and the reasonable expectations of stakeholders, and the responsibility and accountability of individuals for reporting and investigating reports of unethical practices 3.1, 3.2 3.2 Establish and disclose a policy concerning diversity, including requirements for the Board to establish measurable objectives for achieving gender diversity and to assess annually both the objectives and progress in achieving them website, 3.3 3.3 Disclose the measurable objectives for achieving gender diversity 3.3 3.4 Disclose the proportion of women employees in the whole organisation, women in senior executive positions and women on the Board 3.4 3.5 Provide the information indicated in Guide to reporting on Principle 3 website, 3.1 – 3.4 PRINCIPLE 4: SAFEGUARD INTEGRITY IN FINANCIAL REPORTING 4.1 The Board should establish an Audit Committee 4.1 4.2 The Audit Committee should have at least 3 members and be structured to consist only of non-executive Directors, a majority of independent Directors and an independent chair, who is not Chair of the Board 4.2 4.3 The Audit Committee should have a formal charter 4.1 4.4 Provide the information indicated in the Guide to reporting on Principle 4 website, Directors’ Report, 4.1 – 4.4 14 GOODMAN FIELDER ANNUAL REPORT 2014 GOODMAN FIELDER ANNUAL REPORT 2014 Corporate Governance Statement (continued) 2nd edition of ASX Corporate Governance Council’s Corporate Governance Principles and Recommendations with 2010 amendments Reference Comply PRINCIPLE 5: MAKE TIMELY AND BALANCED DISCLOSURE 5.1 Establish and disclose written policies designed to ensure compliance with ASX Listing Rule disclosure requirements and to ensure accountability at a senior executive level for that compliance 5.1, 5.2 5.2 Provide the information indicated in Guide to reporting on Principle 5 website, 5.1, 5.2 PRINCIPLE 6: RESPECT THE RIGHTS OF SHAREHOLDERS 6.1 Design and disclose a communications policy for promoting effective communication with shareholders and encouraging their participation at general meetings 6.1 – 6.3 6.2 Provide the information indicated in the Guide to reporting on Principle 6 website, 6.1 – 6.3 PRINCIPLE 7: RECOGNISE AND MANAGE RISK 7.1 Establish policies for the oversight and management of material business risks and disclose a summary of those policies 7.1, 7.2 7.2 The Board should require management to design and implement the risk management and internal control system to manage the Company’s material business risks and to report on whether those risks are being managed effectively and should disclose that management has reported to it as to the effectiveness of the Company’s management of its material business risks 7.1 – 7.3 7.3 The Board should disclose whether it has received assurance from the CEO and CFO that the declaration provided in accordance with section 295A of the Corporations Act is founded on a sound system of risk management and internal control which is operating effectively in all material respects in relation to financial reporting risks 7.3 7.4 Provide the information indicated in Guide to reporting on Principle 7 website, 7.1 – 7.3 PRINCIPLE 8: REMUNERATE FAIRLY AND RESPONSIBLY 8.1 The Board should establish a Remuneration Committee 8.1 8.2 The Remuneration Committee should be structured to consist of a majority of independent Directors and an independent chair and to have at least 3 members 8.2 8.3 Clearly distinguish the structure of non-executive Director remuneration from that of executive Directors and senior executives 8.4, Remuneration Report 8.4 Provide the information indicated in the Guide to reporting on Principle 8 website, Directors’ Report, 8.1 – 8.5 GOODMAN FIELDER ANNUAL REPORT 2014 15 GOODMAN FIELDER ANNUAL REPORT 2014 Directors’ Report FOR THE YEAR ENDED 30 JUNE 2014 The Directors of Goodman Fielder Limited (the Company) present the 2014 Directors’ Report (including the Remuneration Report), together with the 2014 Financial Report of the consolidated entity (the Group), for the financial year ended 30 June 2014. An Independent Auditor’s Report from the external auditor, KPMG, is also provided. PRINCIPAL ACTIVITIES The principal activities of the Group during the financial year were the manufacture, marketing and distribution of food ingredients and consumer branded food, beverage and related products, including packaged bread and other related goods, biscuits, dairy products, smallgoods, flour, edible oils and meal components. The Group divested its Biscuits, Meats and Pizza businesses during the year. OPERATING AND FINANCIAL REVIEW FOR THE YEAR ENDED 30 JUNE 2014 (FY14)* FY14FY13 Continuing Operations A$m unless specified ContinuingDiscontinued OperationsOperations Total NORMALISED(1) 2,199.9 REVENUE 2,127.6 99.62,272.2 EBITDA 223.8 252.1 14.9267.0 EBIT 150.7 185.6 14.6200.2 63.1 75.710.886.5 3.2 3.90.64.5 EBITDA (269.2) 257.2 22.9280.1 EBIT (342.3) 190.7 22.6213.3 NPAT (405.1) 83.5 19.0102.5 (20.7) 4.31.05.3 NPAT Basic EPS (cents) REPORTED(2) Basic EPS (cents) KEY FINANCIAL METRICS (FROM CONTINUING AND DISCONTINUED OPERATIONS) FY14 A$m unless specified FY13 % Change 199.9262.4 (25%) Net free cash flow(3) Full year Dividend Per Share (cents) 2c 3c(33%) 481.2434.5 (11%) Net debt (4) (5) Leverage ratio (times) (Net debt/EBITDA) 2.121.65 – Interest cover (times)(5) (EBITDA/Net Interest) 4.174.06 – (1)Normalised result excludes significant items. (2)Reported result includes significant items. Pre-tax significant items for FY14 were ($493.0 million). Significant items in FY14 included impairment of goodwill and brands ($358.2 million); restructuring costs ($38.2 million); net loss on sale of businesses and assets ($96.5 million); realised exchange loss ($0.1 million) and tax benefit of $24.8 million. Significant items in FY13 comprised net gain on business divestments/asset sales of $13.7 million; net insurance proceeds of $16.8 million; restructuring costs of ($17.4 million) and tax benefit of $2.9 million. (3)Net free cash flow represents receipts from customers less payments to suppliers and employees. (4)Net debt excludes an unrealised foreign exchange gain of $32.9 million (FY13: gain of $23.9 million) relating to the revaluation of the Company’s US dollar private placement debt hedge. (5)Calculated in accordance with the Group’s debt facility covenants. *Normalised EBIT, EBITDA, EPS and NPAT are non-IFRS measures that reflect, in the opinion of the Directors, the ongoing operating activities of the the Group in a way that appropriately presents its underlying performance. The non-IFRS underlying profit measures exclude restructuring expenses, profits or losses from sale of businesses and assets, insurance proceeds, asset write-downs, asset impairments and realised foreign exchange losses. The non-IFRS financial information has not been audited or reviewed. 16 GOODMAN FIELDER ANNUAL REPORT 2014 GOODMAN FIELDER ANNUAL REPORT 2014 Directors’ Report (continued) FINANCIAL RESULTS OVERVIEW •Revenue growth in Baking, Dairy and Asia Pacific offset by significant commodity cost pressure and difficult trading environment –Improved pricing/mix and increased market share in power brands drives top line improvement in Baking offset by high A$ wheat price and manufacturing reliability issues –Significant turnaround in performance from Fiji Poultry business drives revenue and earnings increase in Asia Pacific business –Despite volume uplift, increase in farmgate milk price impacts Dairy earnings –Improvement in Dressings & Mayonnaise offset by increased competitive environment in Spreads/Flour •Normalised result from Continuing Operations reflects challenging commodity costs and trading conditions –Normalised EBITDA* down 11%, reflects impact of commodity costs pressures (New Zealand Dairy, A$ wheat) and increased investment in marketing/branded innovation –Normalised EBIT* down 19%; Normalised NPAT* down 17%; reflects lower EBIT partially offset by lower interest and tax expense •Reported results from Continuing Operations reflect impact of loss on sale of non-core businesses, non-cash impairments and restructuring costs –Loss on sale of $97.3 million related to divestment of non-core businesses (Biscuits, Meats, Pizza) –Non-cash impairments pre-tax of $358.2 million in line with previous market communication –Restructuring costs related to simplified organisational structure –Reported NPAT loss of $405.1 million •Improvement in Capital Management in second half vs first half –Net debt 12% lower than first half to $481 million at year end –Operating cash flow up over 100% from first half –Credit metrics continue in line with investment grade • Final Dividend of 1c per share payable on 1 October 2014 – Fully franked for Australian shareholders – 100% imputed for New Zealand shareholders • Update on Scheme of Arrangement with Wilmar/First Pacific – Regulatory approvals process underway – Expect dispatch of Scheme Booklet to shareholders in October and shareholder meeting in late November COMMENTARY ON RESULTS While the Company made progress in some areas of the business during the financial year, sharply increased commodity costs and higher logistics costs had impacted the full year result, a disappointing outcome in the context of where the Company had expected to be at this point in the strategic plan. It was initially expected that in FY14 the Company would return to profitable growth, building on the restructuring work completed in the initial phases of the strategy to re-focus the business, align the cost base and restore the balance sheet. While the Company experienced growth in some areas of the portfolio, the record increase in the farmgate milk price in New Zealand, together with the increase in the A$ wheat price, resulted in significant input cost pressures which were unable to be fully recovered through pricing. Additionally, the Australian Baking business was impacted by increased freight and transport costs to ensure continued delivery of fresh product to its customers while reliability issues at some of the major manufacturing facilities were addressed. The Grocery business continued to face a very challenging retail trading environment, which was compounded by the Company’s new product development in Spreads not being successfully ranged across all retailers. In response to this earnings decline, the Company has accelerated cost savings initiatives across the business by implementing a more simplified corporate structure, from which an additional $25 million in annualised cost savings is expected to be generated by FY15. While the Company continues to address these short-term challenges, it remains focused on its strategic objectives which are aligned to generating value over the medium term. That includes an increase in branded core category innovation, which has resulted in an improved share in the Company’s power brands in Baking, particularly through the launch of new product development into new categories such as gluten free and lower carbohydrate products in both Australia and New Zealand. It also includes the $25 million investment being made in the Company’s Christchurch UHT plant to leverage the Company’s existing export capacity of UHT milk to the rapidly growing premium UHT market in China. While FY14 was a significant step back from where the Company had expected to be, it remains committed to building a business which can deliver sustainable growth over the medium term. *From Continuing Operations – Continuing Operations exclude the Integro and New Zealand Milling businesses which were sold during FY13. GOODMAN FIELDER ANNUAL REPORT 2014 17 GOODMAN FIELDER ANNUAL REPORT 2014 Directors’ Report (continued) GROUP FINANCIAL RESULTS – CONTINUING OPERATIONS The Company reported a statutory loss from continuing operations of $405.1 million compared to a net profit from continuing operations of $83.5 million for the prior year. The Company’s reported results include the impact of significant items primarily related to the loss on sale of divested businesses, restructuring costs and non-cash impairments. Total after tax significant items for FY14 were ($468.2 million). The loss on sale relating to divested businesses was $97.3 million, while restructuring costs associated with business divestments and cost savings initiatives were $38.2 million. On 2 July, the Company advised that it expected to record non-cash impairments in the range of $300-$400 million, reflecting the ongoing challenging trading conditions and outlook in its core Baking and Grocery businesses. Having conducted a detailed analysis of the carrying value of its businesses, the Company has recorded a non-cash impairment charge pre-tax of $358.2 million, comprising $337.4 million in the Australian and New Zealand Baking division and $20.8 million in the New Zealand Grocery division. Revenue increased by 3 per cent, driven by an improvement in net average selling price and mix towards more premium products, including Artisan in Baking, the ongoing recovery in the Company’s Fiji Poultry business and higher pricing in Dairy. Normalised EBITDA (which excludes significant items) was $223.8 million, 11 per cent lower than the prior year, impacted by the significant increase in commodity costs (A$ wheat and raw milk) and also increased freight and transport costs in the Australian Baking division as a result of factory breakdowns during the year. Normalised EBIT declined by 19 per cent to $150.7 million, reflecting increased costs, ongoing challenging conditions in Grocery, particularly for Spreads and edible oils, and also a $7 million higher depreciation charge related to the Company’s increased capital investments over the past two years. Normalised net profit after tax was $63.1 million, a decrease of 17 per cent on the prior year (FY13: $75.7 million). Net interest expense was 15 per cent lower than the prior year while the underlying effective tax rate was 25.2 per cent in FY14 compared to 29.4 per cent in the prior year. Net debt at 30 June 2014 was $481.2 million, 12 per cent lower than 31 December 2013 but 11 per cent above the prior year (FY13: $434.5 million). Net debt was impacted by the revaluation of NZ$ denominated debt as a result of the lower A$/NZ$ exchange rate. The Company continues to operate comfortably within its banking covenants, post non-cash impairments, with a leverage ratio (Net debt/ EBITDA) of 2.12 times and interest cover (EBITDA/Net Interest) of 4.17 times. CONTINUING OPERATIONS – DIVISIONAL PERFORMANCE Baking (ex New Zealand Milling) A$m unless specified Revenue EBIT (Normalised)* EBIT Margin* Capital Expenditure FY14 FY13Variance 924.6897.8 +3% 35.0 49.5(29%) 3.8% 5.5%(31%) 39.4 35.8+10% Note: (*)Represents EBIT before restructuring costs as per note 4 ‘segment information’ on pages 80 to 83 of this Annual Report. The prior year excludes normalised EBIT from the New Zealand Milling business of $8.4 million In the Baking division, the Company achieved revenue growth from successful demand creation initiatives and improved pricing; however, this was more than offset by the higher A$ wheat price and increased logistics costs. Revenue increased by 3 per cent to $924.6 million, reflecting higher net average selling prices and improved mix, despite a decrease in volume of 5 per cent. Market share in fresh loaf increased, with Helga’s up three share points (quarterly), while new product formulation and marketing campaigns assisted in Wonder White increasing its market share by one share point (quarterly). Volumes were 5 per cent lower than the prior year, reflecting the removal of a limited number of SKUs, lower volume in bakery snacks and the deletion of Mighty Soft loaf by one retailer. Mighty Soft was re-listed towards the end of the year. Normalised EBIT decreased by 29 per cent to $35.0 million compared to the prior year, impacted by the higher A$ wheat price and by increased freight and logistics costs. During the year, the Company experienced a small number of breakdowns at its major bakeries, which affected production. To maintain customer service metrics under its daily fresh delivery model, the Company invested in significant additional transport and logistics costs. The Company is implementing a reliability improvement plan across its major bakeries, which includes continuous improvement programs to improve production efficiency and run rates. 18 GOODMAN FIELDER ANNUAL REPORT 2014 GOODMAN FIELDER ANNUAL REPORT 2014 Directors’ Report (continued) Direct marketing expenditure (DME) increased by 41 per cent on the prior year to support marketing campaigns and re-launches of Helga’s and Wonder White in Australia and Freya’s in New Zealand. Grocery A$m unless specified Revenue FY14 FY13Variance 448.9502.8 (11%) EBIT (Normalised)* 50.9 63.4(20%) EBIT Margin* 11.3% 12.6%(10%) Capital Expenditure 6.7 7.7(13%) Note: (*)Represents EBIT before restructuring costs as per note 4 ‘segment information’ on pages 80 to 83 of this Annual Report Trading conditions in the Grocery division continued to be very challenging, particularly in the Australian market, which impacted earnings compared to the prior year. Revenue declined by 11 per cent, to $448.9 million, impacted by lower volumes (Australia), which required further investment in promotional strategy to mitigate volume declines. The main contributors to lower volume and revenue in Grocery were in spreads, edible oils and also in cake mix from increased price competition from both private label and competitors. Volumes in New Zealand were steady on the prior year. The decline in volumes and revenue was also affected by the divestment of the Biscuits business in Australia to the Green’s Foods Group, which completed on 24 February 2014. The decline in volume and earnings in the spreads business had a significant effect on the Grocery division. This was due to the lack of ranging of new product development, deletion of core products and increased ranging and competition from new private label entrants. Dressings and mayonnaise continued to perform well in the second half, with Praise reinforcing its category leadership position. New product launches in Praise Aioli and Praise Secret Sauces delivered overall market share improvement. Despite lower revenue, gross margin as a percentage of sales improved on the previous year from continued focus on cost discipline across Australia and New Zealand. Normalised EBIT declined by 20 per cent on the prior year, impacted by the poor performance of the spreads business, only partially offset by the improved performance in dressings and mayonnaise. In New Zealand, EBIT was slightly ahead of the prior year. The EBIT result included a 24 per cent increase in DME to fund brand equity campaigns across the core categories in the portfolio. Dairy (including Meats) A$m unless specified Revenue EBIT (Normalised)* FY14 FY13Variance 472.7395.3+20% 19.9 37.7(47%) EBIT Margin* 4.2% 9.5%(56%) Capital Expenditure 9.4 5.8+62% Note: (*) Represents EBIT before restructuring costs as per note 4 ‘segment information’ on pages 80 to 83 of this Annual Report The Company’s Dairy division in New Zealand was severely impacted by the record increase in the farmgate milk price during the year. The published farmgate milk price, which is a key determinant of the Company’s product cost, increased by 57 per cent during the year. The Company was not able to fully recover this higher input cost through wholesale pricing to its customers, which had a significant effect on margins in the Dairy business. Revenue increased on higher pricing and from an increase in milk volumes in key accounts, partially offset by lower volumes in Route Food Service accounts. Volumes were also lower due to the sale of the Meats business to Hellers Limited which completed on 31 March 2014. Earnings were impacted by the record increase in the farmgate milk price, with normalised EBIT declining by 47 per cent on the prior year. In June 2014, the Company announced an expansion and upgrade of its UHT milk plant in Christchurch, New Zealand, increasing capacity to meet growth opportunities across the Asia Pacific region. GOODMAN FIELDER ANNUAL REPORT 2014 19 GOODMAN FIELDER ANNUAL REPORT 2014 Directors’ Report (continued) Asia Pacific A$m unless specified Revenue FY14 FY13Variance 353.7331.8 +7% EBIT (Normalised)* 65.1 56.4+15% EBIT Margin* 18.4%17.0%+8% Capital Expenditure 10.410.0+4% Note: (*)Represents EBIT before restructuring costs as per note 4 ‘segment information’ on pages 80 to 83 of this Annual Report Earnings from the Asia Pacific division increased significantly on the prior year as the Company successfully resolved the one-off operational capacity issue in the Fiji Poultry business. Despite a volume decline of 2 per cent, revenue increased by 7 per cent to $353.7 million from improved pricing and product mix in Fiji and Papua New Guinea (PNG), off-setting higher wheat costs during the year. Flour volumes in PNG were higher, partially offset by lower stockfeed volumes. In Fiji, the Company successfully addressed the capacity issue which impacted prior year performance. In FY13 a higher than expected livestock mortality rate reduced the Company’s ability to supply poultry to the Fiji market. Resulting lower volumes, together with higher costs associated with remediating the issue, impacted performance. In FY14, the Company made significant progress in resolving this issue, with key operational metrics (mortality rates and processing yield) all returning to pre-issue levels. As a result, volume in the Fiji Poultry business was 16 per cent higher than the prior year. Normalised EBIT was 15 per cent above the prior year, reflecting improved revenue and gross margin in Fiji from lower operational costs, partially offset by the lower PNG Kina vs the Australian dollar. EBIT margin also improved compared to the prior year. FY15 OUTLOOK The outlook for retail trading conditions, particularly in Australia and New Zealand, remains difficult with continuing competitive pressure on product volumes and pricing. The Company continues to carefully monitor the recent introduction of “dollar bread” in New Zealand to assess any potential impact on proprietary bread volumes and pricing. In New Zealand, the reduction in the farmgate milk price from 1 July 2014 is expected to assist in earnings improvement in the Dairy business in FY15. In this environment, the Company will maintain its focus on strong operational cost control and expects to achieve further cost efficiencies from the simplified corporate structure implemented towards the end of FY13. The Company’s immediate priorities are to arrest the earnings decline in Grocery, particularly in spreads and edible oils, implement its plans to improve manufacturing reliability across the Baking network and work through solutions to capture greater cost efficiencies in the daily fresh delivery model in Australian Baking. While the Company expects FY15 to be another difficult year, it continues to refine its strategy and re-align the cost base to deal with these challenges to build its competitive position. UPDATE ON SCHEME OF ARRANGEMENT On 2 July 2014, the Company announced that it had entered into a Scheme Implementation Deed (“Implementation Deed”) with Wilmar International Limited (“Wilmar”) and First Pacific Company Limited (“First Pacific”) under which Wilmar and First Pacific will acquire all of the remaining issued equity in the Company that they do not already own by way of a scheme of arrangement (“Scheme”). Under the terms of the Scheme, Goodman Fielder shareholders will be entitled to receive A$0.675 cash per share subject to all necessary conditions being satisfied or waived and the Scheme becoming effective. In the absence of a superior proposal and subject to an independent expert concluding that the Scheme is fair and reasonable and in the best interests of the Company’s shareholders, the Board of Directors of the Company unanimously recommends that shareholders vote in favour of the Scheme. Wilmar and First Pacific are progressing the regulatory approvals process in accordance with the Implementation Deed and it is currently anticipated that a Scheme Booklet (including the Independent Expert’s Report) will be sent to shareholders in October 2014. The Company anticipates that a shareholder meeting to approve the Scheme will be held in late November with a Scheme implementation date in December 2014. However, it should be noted that these are indicative dates and subject to change, depending on the progress of regulatory approvals. 20 GOODMAN FIELDER ANNUAL REPORT 2014 GOODMAN FIELDER ANNUAL REPORT 2014 Directors’ Report (continued) BUSINESS STRATEGIES AND PROSPECTS In September 2012, the Company outlined its Strategic Plan, providing detailed information on the various strategies the Company intends to pursue to enhance shareholder value over the medium term and achieve its vision to be the leading and most innovative local food company. During the year ended 30 June 2014, the Strategic Plan was further refined and certain aspects accelerated. Set out below are the six specific areas of focus which represent the key components of the Company’s Strategic Plan, together with a summary of progress made during the 2014 financial year in meeting these strategic objectives. Business Strategy Strategic Objectives Progress Made Bakery Turnaround Restore acceptable earnings in Baking division by: •Demand creation strategies drive increased share in power brands in Australia (Helga’s and Wonder White) and increased revenue up 3% Sustainable Cost Structure Core Category Innovation • transforming the manufacturing footprint • optimising the product portfolio • improving distribution efficiencies •Ensure a low cost, efficient operating model •Optimise cost of goods sold (COGS), Supply Chain and overhead expenditure •Invest for growth in five core categories •Create R&D function to drive branded innovation across portfolio •Earnings were impacted by the high A$ wheat price and costs relating to reliability issues in manufacturing •Manufacturing reliability issues caused delay in $15 million expected cost savings – expected to be received in FY15 •In response management accelerated cost savings initiatives, primarily through headcount reduction, to achieve $25 million in annualised savings by FY15 •NPD – Successful launch of Helga’s/Freya’s Gluten Free and Lower Carb, Wonder White new formulation, Praise Aioli and Secret Sauces, White Wings Café Creations •Lack of ranging Spreads NPD (Australia), deletion of SKUs impacts Grocery earnings Strategic Partnerships with Key Customers •Restructure the operating model to provide one face to the customer •Work collaboratively with customers on new product development (NPD) and consumer insights •Continued investment in alignment and collaboration with key customers – Company named as Woolworths Fresh Supplier of the Year •Improve dialogue with customers to restore category profitability ew Channels N & Geographies •Diversify earnings beyond supermarket channel and leverage Asia Pacific presence •Develop strategy to build presence in Artisan/ In-Store bakery •Increase UHT capacity at Christchurch by 32 million litres per annum to leverage existing platform of exports to China •Continued growth in revenue from Artisan •Implement scoping study targeting UHT and Bakery opportunities in Asia Portfolio Optimisation •Become a more focused food company with best in class innovation •Successfully divested non-core businesses during the year: Biscuits, Meats and Pizza •Divest non-core businesses •Prioritise marketing and capital expenditure on core categories GOODMAN FIELDER ANNUAL REPORT 2014 21 GOODMAN FIELDER ANNUAL REPORT 2014 Directors’ Report (continued) In addition to the progress made in relation to the Company’s strategic objectives, the Company also made significant progress in key areas of operational effectiveness – safety, quality, talent development, innovation and leadership – as detailed below: •Group Safety (as measured by the Significant Injury Frequency Rate (SIFR)) improved substantially in 2014, with a 42 per cent decline in SIFR compared with the prior year. •The Company maintained its focus on food safety and quality, with a 20% reduction in the number of customer and consumer complaints compared with the prior year. •The Company’s executive management structure further evolved during the financial year, through consolidation of roles and changes in reporting lines to increase focus, accountability and efficiency, improve execution and drive increased customer alignment. A number of internal candidates were promoted through the Company’s succession program to fill more senior roles during the year and gender diversity in the Executive Leadership Team continued to increase, through a significant proportion of new appointments being high-potential women. •The Company significantly strengthened its innovation pipeline in key categories, including achieving category growth and market leadership of the dressings and mayonnaise category through its packaging/new product development initiatives. During the 2014 financial year engagement reporting period, a further 15% improvement in employee engagement was recorded, continuing the year-on-year improvement from the prior reporting period. MATERIAL BUSINESS RISKS Goodman Fielder remains confident that its strategy has the capacity to achieve the Company’s vision and goals and deliver enhanced shareholder value over the medium term. However, the Company is also aware that a range of risks may materially affect business performance and impact its ability to deliver its strategic objectives. Material business risks are set out below, along with the Company’s approach to managing these risks. While every effort is made to identify and manage material risks, additional risks not detailed below may also adversely affect the Company’s future performance. 1. Increased competitive environment Goodman Fielder operates in highly competitive markets where its products compete against a number of proprietary branded goods and also private label products sold through supermarket channels. Increased competition through more aggressive pricing and promotional activity of competitor (including private label) products poses a potential risk to Goodman Fielder’s market share, revenues and earnings. The Company’s strategy to mitigate these risks includes: •Further investing in innovation/equity in its brands (including development of intellectual property) to differentiate products from competitors; •Implementing specific strategies to maximise efficiencies from promotional spending in core categories; •Pursuing opportunities for product sales in channels outside of supermarkets (e.g. route food service market, hotels, restaurants and cafes, etc); and •Expanding export markets and pursuing growth opportunities in China/Asia. 2. Rising input costs and inability to recover through price increases Goodman Fielder requires a range of raw materials, energy, labour and third-party services to manufacture and deliver its finished goods across its network. There is a potential risk to Goodman Fielder’s earnings if these input costs rise significantly beyond the Company’s ability to recover through price increases. The Company’s strategy to mitigate these risks includes: •Securing long-term supply agreements for its core raw materials, including wheat, flour, oils and raw milk, and for other key inputs such as packaging materials; •Proactive management of the risk of commodity cost movements within Board approved limits to manage the Company’s commodity cost exposure; and •Specific cost management programs targeting manufacturing, procurement, supply chain, distribution and overhead efficiencies to address rising input costs. 3. Branded innovation A key component of Goodman Fielder’s strategy to increase earnings growth is the Company’s focus on branded innovation and research and development. There is a potential risk to future earnings that product innovation (new products, packaging and brands) relating to this strategy may not be successful in the market. Goodman Fielder mitigates this risk through a formal and disciplined ‘stage gate’ process in its research and development approach, to quantify risks and business pay-back related to new product development across its businesses, as well as implementation of a number of ideation and idea generation techniques designed to maintain a permanent flow of ideas, concepts and projects. 22 GOODMAN FIELDER ANNUAL REPORT 2014 GOODMAN FIELDER ANNUAL REPORT 2014 Directors’ Report (continued) 4. Key customer relationships Goodman Fielder has supply relationships with a number of significant customers and loss of a key customer or ineffective management of a key contract poses a potential risk to Goodman Fielder’s market share, revenues and earnings. The Company’s risk mitigation strategies include diversification of its customer base (including through new channels and geographies), improving alignment and strategic dialogue with key customers and multi-functional/collaborative innovation involving customers. 5. Food safety and quality The consumer is central to the Company’s focus on food safety and quality and ensuring the safety and quality of Goodman Fielder’s products is of critical importance to the Company’s brand equity and corporate reputation. Inadequate or inconsistent quality standards and practices across the Group or its key suppliers, co-manufacturers and co-packers could potentially result in harm to consumers and also represent a potential risk to Goodman Fielder’s market share, revenues and earnings. The Company’s strategy to mitigate these risks includes: •Strengthening leadership and capability of the Company’s Quality function and ensuring appropriate training and quality awareness programs at all levels of the business; •Consolidating the Company’s Supplier Management program to drive Goodman Fielder Quality and Food Safety expectations across the supply chain; •Enhancing the Company’s procurement program to ensure that only high quality ingredients are sourced from preferred suppliers; •Implementation and on-going development of a framework of standardised quality procedures, processes and disciplines across all sites; and •Capital expenditure and preventative maintenance programs designed to enhance product quality. 6. Strategy and project/program execution Achieving Goodman Fielder’s strategic plan requires both effective change management and prioritisation and execution of key strategic projects and initiatives. Failure to effectively progress and deliver the Company’s turnaround strategy may adversely impact the Company’s earnings. Similarly, if the Company has not developed an effective strategy to achieve sustainable earnings growth, innovate in core categories, and deliver on its safety, quality, efficiency and engagement goals, it risks a decline in financial performance and loss of investor and market confidence. To mitigate these risks, the Company has implemented a detailed strategic planning process, as well as a project management framework and related governance processes and communications plans to manage and monitor key strategic projects throughout the Group. It has also strengthened the capability of key functions involved in strategic planning and project management through additional investment in systems, training and talent. 7. Supply chain/manufacturing The Company’s ongoing financial and operational success relies upon its ability to deliver a safe, high quality, low cost, flexible supply chain, manufacturing and distribution network which aligns with the Company’s strategic objectives. If the Company cannot efficiently and reliably manufacture quality products to achieve its objectives or establish and maintain appropriate supply and distribution arrangements to enhance its operations, the Company risks a decline in financial performance, as well as a loss of employee, customer, consumer and market confidence. The Company’s strategy to mitigate these risks includes: •Strengthening Site operational and functional leadership and capability and ensuring development and implementation of appropriate training programs and initiatives to foster a “continuous improvement” culture; •Further development of an integrated resources and capability plan and continually refining its integrated supply chain and operations strategy, with prioritised initiatives to ensure delivery; •A continued focus on “end to end” predictability to ensure ongoing improvements in asset protection, plant reliability (including preventative maintenance) and security of products and personnel; and •Development and maintenance of business continuity, crisis management and disaster recovery plans to ensure the Company is able to respond and recover on a timely basis in the event of a critical incident or crisis. FORWARD-LOOKING STATEMENTS Certain statements contained in this report may constitute forward-looking statements or statements about future matters that are based upon information known and assumptions made as of the date of this report. These statements are subject to risks and uncertainties and are susceptible to change. Actual results and outcomes may differ materially from any future results or performance expressed, predicted or implied by the statements contained in this report. GOODMAN FIELDER ANNUAL REPORT 2014 23 GOODMAN FIELDER ANNUAL REPORT 2014 Directors’ Report (continued) DIRECTORS The Board of Directors of the Company currently consists of eight Directors – seven independent non-executive Directors and the Managing Director. The names and details of the Directors of the Company holding office during the financial year and until the date of this report are as follows: Name, Qualifications and Position Age Experience and Special Responsibilities Steven Gregg BCom 53 Director since 26 February 2010 and Chairman of the Board and of the Nomination Committee since 1 October 2012. Chairman of the Corporate Risk Committee from 26 February 2010 to 25 October 2012 and Member of the Audit Committee from 26 February 2010 to 25 October 2012. Chairman of the Board and Independent Non-executive Director Mr Gregg is an experienced investment and commercial banker with extensive Australian and international executive experience with ABN Amro (as Senior Executive Vice President and Global Head of Investment Banking), Chase Manhattan, Lehman Brothers and AMP Morgan Grenfell. His most recent executive role was as Expert Partner at McKinsey & Company in Australia and the US. Mr Gregg is a member of the Grant Samuel non-executive Advisory Board and is a non-executive Director of Tabcorp Holdings Limited (appointed July 2012), Challenger Limited and Challenger Life Limited (appointed October 2012) and William Inglis & Son Limited. He is the Chairman of Sunshine (the Lorna Hodgkinson Sunshine Home) and also served as the Chairman of Austock Group Limited between November 2009 and May 2012. He was appointed a Trustee of the Australian Museum Trust in January 2014. Former directorships of other listed companies during the past three years: Austock Group Limited, November 2009 to May 2012 Chris Delaney BA 52 Managing Director and Chief Executive Officer Managing Director and Chief Executive Officer, appointed 4 July 2011. Mr Delaney is an experienced FMCG executive whose international career includes senior executive positions in the US, Australia, Asia, Europe and the Middle East. He spent 20 years with Procter & Gamble in a variety of management roles before joining the Campbell Soup Company in 2004 as Vice President of Sales. He was subsequently appointed President of Emerging Markets and then President (Asia Pacific) in 2009. In his most recent role, he was responsible for leading and growing Campbell’s fastest growing region, with revenue of more than $1 billion and operations in Australia, New Zealand and Asia. Mr Delaney is currently Deputy Chairman of the Australian Food and Grocery Council. Former directorships of other listed companies during the past three years: None Ian Cornell Independent Non-executive Director 60 Director since 15 February 2014. Member of the Human Resources and Remuneration Committee (appointed 15 February 2014). Mr Cornell is a highly experienced executive in the Australian/New Zealand retail and food and grocery industries, having held a number of senior executive positions with Woolworths, Franklins and Westfield. Mr Cornell’s most recent executive position was at Westfield Group where he was Director of Human Resources and previously, Director of Shopping Centre Management for Australia and New Zealand. Prior to joining Westfield, Mr Cornell was the Chief Executive Officer of Franklins in Australia and also held numerous senior executive positions with Woolworths Limited, including the role of Chief General Manager for Woolworths’ supermarkets division. Mr Cornell is a non-executive director of Myer Holdings Limited (appointed February 2014) and William Inglis & Son Limited. Former directorships of other listed companies during the past three years: None 24 GOODMAN FIELDER ANNUAL REPORT 2014 GOODMAN FIELDER ANNUAL REPORT 2014 Directors’ Report (continued) Name, Qualifications and Position Age Experience and Special Responsibilities Jan Dawson BCom, FCA, FInstD 60 Director since 1 October 2012. Member of the Corporate Risk Committee (appointed 1 October 2012) and the Audit Committee (appointed 1 January 2013). Independent Non-executive Director Ms Dawson, who is based in New Zealand, was formerly the Chair and Chief Executive of KPMG New Zealand where she had extensive experience encompassing audit and accounting advice, due diligence, capital transactions, risk management, governance and litigation support for a wide range of companies across manufacturing, property and infrastructure. Ms Dawson was appointed a non-executive Director of Air New Zealand Limited in April 2011 and Deputy Chairman in September 2013. She is also a non-executive Director of Westpac New Zealand Limited, Meridian Energy Limited, AIG Insurance New Zealand Limited and Beca Group Limited, as well as a member of the Capital Investment Committee of the National Health Board, a Councillor of the University of Auckland, a member of the Council and Chair of the Audit Committee of the International Sailing Federation and a Trustee of the Voyager New Zealand Maritime Museum. Ms Dawson was formerly the Deputy Chair of Counties Manukau District Health Board, a member of the Disciplinary Tribunal of the New Zealand Institute of Chartered Accountants and the President of Yachting New Zealand. Former directorships of other listed companies during the past three years: None Chris Froggatt BA Hons, FCIPD, MAICD Independent Non-executive Director 55 Director since 27 August 2009. Member of the Corporate Risk Committee (appointed 27 August 2009) and the Nomination Committee (appointed 24 March 2010) and Chairman of the Human Resources and Remuneration Committee (appointed a Member on 27 August 2009 and Chairman on 1 January 2011). Ms Froggatt has over 20 years’ senior executive experience as a human resources specialist in leading international companies including Brambles Industries plc and Brambles Industries Limited, Whitbread Group plc, Diageo plc, Mars Inc and Unilever NV. More recently she has served on the Boards of Britvic plc and Sports Direct International plc and as an independent trustee director of Berkeley Square Pension Trustee Company Limited. She is currently a non-executive director on the Boards of Myer Holdings Limited (appointed December 2010), the Australian Chamber Orchestra and Australian Chamber Orchestra Instrument Fund Pty Ltd. Ms Froggatt has a broad industry background, particularly in consumer branded products, covering industries such as beverages, food and confectionery through her appointments at Britvic, Whitbread, Diageo and Mars. She also has a breadth of experience in other industries such as retailing, hotels, leisure and logistics. Former directorships of other listed companies during the past three years: None GOODMAN FIELDER ANNUAL REPORT 2014 25 GOODMAN FIELDER ANNUAL REPORT 2014 Directors’ Report (continued) Name, Qualifications and Position Age Experience and Special Responsibilities Peter Hearl BCom, MAIM, GAICD, Member – AMA 63 Director since 26 February 2010. Member of the Human Resources and Remuneration Committee (appointed 26 February 2010) and the Audit Committee (appointed 26 February 2010) and Chairman of the Corporate Risk Committee (appointed 25 October 2012). Member of the Nomination Committee from 25 March 2011 to 25 October 2012. Independent Non-executive Director Mr Hearl is an experienced senior executive with international experience and expertise in the FMCG sector. His previous roles included executive appointments with Yum Brands, the world’s largest (by number of outlets) restaurant company (where he was Chief Operating and Development Officer), Pepsico and Exxon (Esso). He has also been a non-executive Director of Amrest Inc, Westport Resources Inc and KFC Japan Inc. He has a wealth of knowledge and experience in the Asia Pacific region and has also worked extensively in Europe, the USA and Australia. He is currently a Director of Treasury Wine Estates Limited (appointed February 2012). He also advises and is a Director of a small number of private companies. Former directorships of other listed companies during the past three years: None Clive Hooke FCPA, FAICD 68 Independent Non-executive Director Director since 19 April 2007. Chairman of the Audit Committee (appointed 21 June 2007) and Member of the Corporate Risk Committee (appointed 21 June 2007). Mr Hooke is an experienced senior executive and business and financial consultant. He was the Chief Financial Officer of National Foods Limited from 1997 until his retirement in 2004, prior to which he served as Chief Executive of Totalizator Agency Board of Victoria from 1993 until its acquisition by TABCORP in 1994, and as Director of Strategy and Finance of Elders Agribusiness Group (part of Foster’s Brewing Group Limited) between 1982 and 1991. Mr Hooke is a former Chairman of Astra Capital Limited(1) and Big Brothers – Big Sisters Australia Limited and also served as a Director of Tassal Group Limited between November 2010 and March 2012. Former directorships of other listed companies during the past three years: Tassal Group Limited, November 2010 to March 2012 Ian Johnston BCom, CPA Independent Non-executive Director 67 Director since 26 May 2008. Member of the Audit Committee (appointed 26 May 2008), the Human Resources and Remuneration Committee (appointed 26 May 2008) and the Nomination Committee (appointed 25 October 2012). Mr Johnston has over 30 years’ experience with a number of leading companies in the international food and beverage industry. He initially spent 13 years with Unilever in a range of domestic and overseas marketing roles and then joined Cadbury Schweppes as Marketing and Sales Director, Australia/New Zealand. Mr Johnston was subsequently appointed Managing Director of Cadbury’s UK business before becoming Managing Director, Global Confectionery of Cadbury Schweppes plc from 1996 until 2000. He then served from 2001 to 2004 as President and Chief Operating Officer of The Olayan Group, a privately-owned Saudi Arabian conglomerate. He was appointed a non-executive Director of Foster’s Group Limited(2) in September 2007 and then held the position of Chief Executive Officer between September 2008 and the demerger of its wine business in May 2011. Former directorships of other listed companies during the past three years: None (1)Formerly FCPB Investments Limited. Astra Capital Limited was removed from the official list of ASX Limited on 21 February 2011 following completion of compulsory acquisition by Taverners No. 12 Pty Ltd (in its capacity as trustee for the Taverners No. 12 Unit Trust) and Taverners AKR Pty Ltd (in its capacity as trustee for the Taverners (Australia) Trust No.2). (2)Foster’s Group Limited was removed from the official list of ASX Limited on 20 December 2011 following completion of its acquisition by SABMiller Beverage Investments, a subsidiary of SABMiller plc. 26 GOODMAN FIELDER ANNUAL REPORT 2014 GOODMAN FIELDER ANNUAL REPORT 2014 Directors’ Report (continued) COMPANY SECRETARY Sara Goldstein was appointed Company Secretary of the Company on 1 April 2014 after holding the position of Assistant Company Secretary since May 2006. Her previous experience includes company secretarial roles with a number of large ASX-listed entities. She has degrees in business and law from universities in Canada and a LLM from the University of Sydney. She is an Associate of the Governance Institute of Australia (formerly Chartered Secretaries Australia), a Canadian-qualified Chartered Accountant and a member of the Law Societies of British Columbia and New South Wales. DIRECTORS’ MEETINGS The number of Directors’ meetings (including meetings of Committees of the Board) attended by each of the Directors of the Company during the financial year were: Human Resources and Board of Audit Corporate Risk Remuneration Nomination DirectorsCommittee(b)Committee(c)Committee(d)Committee(e) Scheduled 16 4 3 41 Unscheduled 7 – – –– NameHeld(a)Attended Held(a)Attended Held(a)Attended Held(a)Attended Held(a)Attended S Gregg 23 23––––––11 C R Delaney 23 22–––––––– I G Cornell 13 12––––21–– J A Dawson 23 234433–––– C J Froggatt 23 23––334411 P R Hearl 23 21433343–– C A Hooke 23 224433–––– I D Johnston 23 2144––4311 (a)Reflects the number of meetings held while the Director was a member of the Board or Committee. Mr Cornell was appointed a Director of the Company and a member of the Human Resources and Remuneration Committee effective 15 February 2014. (b)Mr Gregg and Ms Froggatt each attended four meetings at the invitation of the Audit Committee. Mr Delaney attended all meetings at the request of the Committee. (c)Mr Johnston attended one meeting and Mr Gregg attended three meetings at the invitation of the Corporate Risk Committee. Mr Delaney attended all meetings at the request of the Committee. (d)Messrs Gregg and Hooke and Ms Dawson each attended four meetings at the invitation of the Human Resources and Remuneration Committee. Mr Delaney attended four meetings at the request of the Committee but was not present when matters relating to his employment and remuneration were discussed by the Committee. (e)Messrs Hooke and Hearl each attended one meeting at the invitation of the Committee. The full Board met formally and informally on a number of occasions in connection with the selection and appointment of a new Director. GOODMAN FIELDER ANNUAL REPORT 2014 27 GOODMAN FIELDER ANNUAL REPORT 2014 Directors’ Report (continued) STATE OF AFFAIRS EVENTS SUBSEQUENT TO BALANCE DATE On 15 February 2014, Mr Ian Cornell was appointed a Director of the Company and a member of the Board’s Human Resources and Remuneration Committee. On 2 July 2014 the Company announced that it had entered into an Implementation Deed with Wilmar and First Pacific under which Wilmar and First Pacific will acquire all the remaining issued shares in the Company that they (and their related entities) do not already own by way of a Scheme. Mr Shane Gannon, the Company’s Chief Financial Officer, left the Company on 29 November 2013 and the Company’s new Chief Financial Officer, Mr Patrick Gibson, joined the Group on 1 April 2014. Mr Neil Kearney, the Company’s Chief Strategy and Corporate Development Officer, served as interim Chief Financial Officer during the four-month period following Mr Gannon’s departure. Mr Andrew Hipperson, Managing Director Australia, passed away in a motorcycle accident on 18 January 2014 and management of the Australian and New Zealand businesses was consolidated under Mr Peter Reidie (formerly Managing Director, New Zealand) effective 13 February 2014. Mr Pankaj Talwar (formerly Category Managing Director, Bakery) was appointed Chief Marketing Officer and Category Managing Director, Bakery and Grocery, in March 2014 after Mr Aaron Canning, Category Managing Director, Grocery, left the Company on 28 February 2014. Mr Jonathon West, the Company’s General Counsel and Company Secretary, was appointed Chief Strategy and Corporate Development Officer effective 1 April 2014, replacing Mr Kearney, who left the Company on 17 April 2014. Mr Sean Tully was appointed General Counsel and Ms Sara Goldstein was appointed Company Secretary effective 1 April 2014. As part of its ongoing strategy to optimise its portfolio, the Company divested a number of non-core businesses during the 2014 financial year. On 24 February 2014 the Company completed the sale of its Biscuits business to the Green’s Foods Group. On 31 March 2014 it completed the sale of its Meats business in New Zealand to Hellers Limited and the sale of its Pizza business in New Zealand to Mommas Foods Limited (formerly Mommas Frozen Products Limited) was completed on 28 May 2014. Gross consideration of $7 million from the sale of the Biscuits business and NZ$12.3 million from the sale of the Meats and Pizza businesses was used primarily to reduce debt and further strengthen the Company’s financial position. On 6 August 2013, $150 million and NZ$40 million was repaid on the Group’s syndicated loan facility maturing November 2014 and NZ$10 million was repaid on the bilateral loan facility maturing 27 February 2014. On 7 February 2014, a further NZ$50 million was repaid on the bilateral loan facility maturing 27 February 2014 and the facility was then cancelled. On 16 May 2014, the Company advised that it had received a non-binding, conditional proposal from Wilmar and First Pacific to acquire all of the issued equity in the Company by way of a scheme of arrangement at a proposed price of A$0.70 per share and, in addition, allowing the Company to pay a final dividend of A$0.01 per share for the year ending 30 June 2014. After consideration of the proposal, the Board advised that, in the absence of a superior proposal, it would unanimously recommend that shareholders vote in favour of the proposal, subject to a number of conditions. The Company also agreed to provide Wilmar and First Pacific with non-exclusive access to due diligence over a period of approximately four weeks, with precise details of the process to be agreed. Due diligence investigations were conducted by Wilmar and First Pacific during May and June 2014. Other than as set out above there were no significant changes in the state of affairs of the Group during the financial year under review. 28 GOODMAN FIELDER ANNUAL REPORT 2014 Under the terms of the Scheme, shareholders will be entitled to receive A$0.675 cash per share, subject to all necessary conditions being satisfied or waived and the Scheme becoming effective. The Scheme also allows for the Company to pay a final dividend of A$0.01 per share for the year ended 30 June 2014. In the absence of a superior proposal and subject to an independent expert concluding that the Scheme is fair and reasonable and in the best interests of shareholders, the Board of Directors of the Company unanimously recommends that shareholders vote in favour of the Scheme. The Company has appointed an independent expert to determine whether the Scheme is fair and reasonable and in the best interests of shareholders. The independent expert’s report will be included in a Scheme booklet which is expected to be distributed to shareholders later in the calendar year, although this timing is subject to change, depending on the regulatory process. The implementation of the Scheme is subject to a number of conditions which include the following: •shareholders (other than Wilmar, First Pacific and their respective related bodies corporate) approving the Scheme at a Scheme Meeting (requiring approval from a majority in number of shareholders who vote and at least 75% of the total number of shares voted); •all necessary regulatory approvals being obtained, including approval from the Foreign Investment Review Board in Australia, the Overseas Investment Office in New Zealand and the Ministry of Commerce (MOFCOM) in China; •no material adverse change, ‘prescribed occurrence’ or regulatory restraint; and •Court approval of the Scheme. Full details of the terms and conditions of the Scheme are set out in the Implementation Deed, a copy of which was attached to the Company’s announcement of 2 July 2014. Other than as disclosed above, no matter or circumstance has arisen since the end of the financial year that has significantly affected, or may significantly affect, the Group’s operations, the results of those operations, or its state of affairs in future financial years. LIKELY DEVELOPMENTS Likely developments in the Group’s operations in future financial years, the expected results of those operations and the Group’s business strategy and prospects for future financial years are reported in the Operating and Financial Review on pages 16 to 23 in this Annual Report. GOODMAN FIELDER ANNUAL REPORT 2014 Directors’ Report (continued) DIVIDENDS The Company paid an interim dividend for the year ended 30 June 2014 of one cent per ordinary share. On 13 August 2014, the Directors of the Company resolved to pay a final dividend of one cent per ordinary share, payable on 1 October 2014 to holders of record on 15 September 2014. The dividend will be 100% franked in Australia and imputed to 100% for New Zealand taxation purposes. The Directors have determined that the Company’s dividend reinvestment plan (DRP) will not operate in respect of the October 2014 final dividend. OPTIONS OVER UNISSUED SHARES OR INTERESTS There were no options over unissued shares or interests on issue during the financial year, and none had been granted or were on issue as at the date of this report. No employee options were on issue as at the date of this report. DIRECTORS’ INTERESTS The number of ordinary shares in which each Director has a relevant interest as at the date of this report is as follows: Name Ordinary Shares S Gregg 20,100 C R Delaney 700,100(1) I G Cornell 10,000 J A Dawson 10,000 C J Froggatt 24,554 P R Hearl 220,000 C A Hooke 284,751 I D Johnston 193,044 (1)Mr Delaney has entitlements to 4,458,775 shares (6,688,163 shares on achievement of “stretch” targets) under long-term incentive arrangements approved by shareholders at the Company’s 2012 and 2013 Annual General Meetings. Transactions between companies within the Group and Director-related entities are set out on page 55 of this Annual Report. OFFICERS Ms Dawson, a non-executive Director of the Company since 1 October 2012, was formerly a partner of KPMG New Zealand, the auditor of Goodman Fielder New Zealand Limited (a wholly-owned subsidiary of the Company). Ms Dawson was not involved in the audit of Goodman Fielder New Zealand Limited or of the Company at any time while she was a partner of KPMG New Zealand. REMUNERATION OF DIRECTORS AND SENIOR EXECUTIVES A Remuneration Report is set out in this Directors’ Report on pages 31 to 55. The Remuneration Report: •explains the Board’s policies in relation to the nature and level of remuneration paid to key management personnel of the Group (comprising the Directors of the Company and specified senior executives within the Group); •discusses the relationship between the Board’s policies and the Group’s performance; and •sets out remuneration details for key management personnel of the Group. GOODMAN FIELDER ANNUAL REPORT 2014 29 GOODMAN FIELDER ANNUAL REPORT 2014 Directors’ Report (continued) ENVIRONMENTAL REGULATION INDEMNIFICATION AND INSURANCE OF OFFICERS INTRODUCTION COMPANY’S CONSTITUTION AND DEEDS OF INDEMNITY AND INSURANCE The management of environmental risks and compliance with environmental laws is a core consideration for the Group. The Corporate Risk Committee has responsibility for overseeing the Group’s environmental risk management processes and regularly reviews safety, health and environment (SHE) reports from management. Priority issues and monthly performance updates are reported to the Board. Under the Company’s Constitution and deeds of indemnity and insurance between the Company and its Directors and Company Secretary (Deeds), each Director and Secretary is indemnified, on a full indemnity basis and to the full extent permitted by law, against all losses or liabilities incurred as an officer of the Company or of a related body corporate. The indemnity is an irrevocable, unconditional, continuing and principal obligation of the Company, which applies despite the officer having ceased to be an officer of the Company or its related bodies corporate. All of the Group’s manufacturing operations are subject to the environmental laws of the particular countries and states in which they operate. The Group has corporate and locally based procedures to monitor and manage compliance with existing and new environmental regulations as they come into force. The Group plans and performs activities so that adverse effects on the environment are avoided or minimised to the extent reasonably practicable. As a signatory to the Australian Packaging Covenant (APC), the Group undertakes a number of initiatives to reduce packaging waste and minimise the environmental impacts associated with its packaging material. Copies of its APC Action Plan and Annual Reports are available on its website. Until the end of the 2014 financial year the Group’s Australian operations were subject to the Energy Efficiency Opportunities Act 2006 (Cth) (EEO), which required the Group to identify energy efficiency opportunities and report annually on progress made in implementing those opportunities. A public report was issued by the Group in December each year that outlined the energy use assessed, the energy saving opportunities identified and the status of those opportunities. Copies of the public reports issued by the Group are available on its website. The Group reports the greenhouse gas emissions and energy consumption of its Australian operations on an annual basis in compliance with the National Greenhouse and Energy Reporting Act 2007 (Cth). The Group implemented new procedures and protocols to calculate the impact of, and ensure compliance with, the Clean Energy Act 2011 (Cth) and associated legislation. ENVIRONMENTAL PERFORMANCE The Group takes steps to continually improve its risk management program and environmental risks and impacts are assessed on an ongoing basis to ensure that the appropriate environmental controls have been implemented and are effective. The Group previously issued an annual Sustainability Report and, with a view to enhancing its stakeholder reporting, in October 2013 it issued its first Annual Review for the year ended 30 June 2013. Within the Annual Review, the Group identifies progress made against sustainability action plans and outlines its sustainability objectives for the next financial year. The Group’s Annual Review for the 2014 financial year will be available on the Group’s website (ww w.goodmanfielder.c om.au) once issued. The Group was not subject to any environmental fines or prosecutions for environmental offences during the year. 30 GOODMAN FIELDER ANNUAL REPORT 2014 Each Director and Secretary is also indemnified, to the extent permitted by law, for legal costs incurred in connection with pursuing a claim under any relevant directors’ and officers’ liability insurance contract or in connection with involvement as a party or potential party in legal or administrative proceedings as a result of their position as a director or officer of the Company or its related bodies corporate. By Deed Poll, the Company has also provided similar indemnities to each director and company secretary from time to time of a subsidiary of the Company. No indemnities were paid to current or former Directors, Secretaries, or officers during or since the end of the year. The Company has not been advised of any claims under any of the above indemnities. INSURANCE The Company’s Constitution permits the Directors to authorise the Company to purchase and maintain insurance for each officer, to the maximum extent permitted by law, against any liability incurred as an officer of the Company or of a related body corporate. The Deeds and Deed Poll referred to above provide for the Company to maintain directors’ and officers’ liability insurance, if available from a reputable insurance company at reasonable commercial rates, for a period of 7 years after a person ceases to be a Director or Secretary or a director or secretary of a subsidiary. During the financial year the Company paid insurance premiums in respect of directors’ and officers’ liability insurance contracts, covering the current and former Directors, Secretaries and executive officers of both the Company and its subsidiaries. The insurance contracts insure against certain liabilities (subject to specified exclusions) for persons who are or have been Directors and officers of the Company and its subsidiaries. The insurance contracts prohibit disclosure of the amount of the premium and the nature and extent of the liabilities covered. GOODMAN FIELDER ANNUAL REPORT 2014 Directors’ Report (continued) Message from the Chairman of the Human Resources and Remuneration Committee Dear Shareholder 2014 FINANCIAL YEAR There was no change to the Company’s remuneration policy and executive remuneration structure for the 2014 financial year and performance targets for the Company’s short-term and long-term incentive plans were set by the Board with a view to maintaining management focus on the creation of shareholder value under the Company’s Strategic Plan. Fixed remuneration adjustments for the Group Executive for the year ended 30 June 2014 ranged between 0% and 3.5% (excluding increases resulting from changes in roles) and there was no increase in annual Board and Committee fees for the Chairman and non-executive Directors. The 2014 financial year was a difficult one for Goodman Fielder, with a number of factors adversely affecting the Company’s financial performance, and the Company delivered a disappointing full year earnings result. As Group NPAT and Market EBIT targets were not achieved, total short-term incentive awards to senior executives for the 2014 financial year were limited to payments for the achievement of safety targets for both the Group and the Markets, with the Group achieving a 42% decline in the year-end significant injury frequency rate (SIFR) compared with the prior corresponding period. No financial performance threshold applied to these safety-related awards (which represent up to 10% of an executive’s total short-term incentive opportunity), given the importance placed on driving significant improvements in safety across the Group. There was no allocation of shares under the Group’s long-term incentive plan as ROCE and relative TSR performance targets were not achieved at the end of the three-year performance period. WILMAR/FIRST PACIFIC PROPOSAL On 2 July 2014 the Company entered into a Scheme Implementation Deed (“Implementation Deed”) with Wilmar International Limited (“Wilmar”) and First Pacific Company Limited (“First Pacific”) following the receipt of a proposal from Wilmar and First Pacific to acquire all of the issued shares in the Company. The Implementation Deed includes a number of provisions that impact the Company’s remuneration structure and incentive plans for the year ending 30 June 2015. Incentive arrangements that are to apply for the 2015 financial year require the consent of Wilmar and First Pacific and, at the time of finalising the Company’s Remuneration Report, these arrangements had not yet been agreed. The Implementation Deed also governs the treatment (if the scheme of arrangement becomes effective) of unvested entitlements under existing incentive plans at the effective date of the scheme. These entitlements will either be replaced with new entitlements under incentive arrangements developed by Wilmar and First Pacific that are satisfactory to the Board or, if no such plans are agreed, the entitlements will vest on a pro-rata basis (as defined in the Implementation Deed). It will be a number of months before shareholders vote on whether to approve the scheme of arrangement and, regardless of the proposal by Wilmar and First Pacific and the potential change in control of the Company, the Committee and Board will continue to focus on ensuring the Group’s remuneration strategy and human capital initiatives appropriately support the delivery of the Company’s strategic initiatives and the creation of value for the Company’s shareholders. Chris Froggatt Chairman Human Resources and Remuneration Committee GOODMAN FIELDER ANNUAL REPORT 2014 31 GOODMAN FIELDER ANNUAL REPORT 2014 Directors’ Report (continued) 2014 Remuneration Report – audited 1.INTRODUCTION This report, which forms part of the Directors’ Report, outlines the Board’s policy for determining the nature and amount of remuneration of the key management personnel of the Group and the relationship between this policy and the Group’s performance. The Remuneration Report has been audited in accordance with the Corporations Act and its adoption will be subject to a non-binding vote of shareholders at the Company’s 2014 Annual General Meeting. The report provides remuneration information for the non-executive Directors of the Company and those senior executives who are responsible for planning, directing and controlling the activities of the Group. Details of the key management personnel (KMP) of the Group during the 2014 financial year are set out below: Non-executive Directors Executive Director S Gregg (Chairman) C R Delaney (Managing Director and Chief Executive Officer (CEO)) J A Dawson Executives C J Froggatt P D Foyston (Managing Director, Asia Pacific division) P R Hearl P A Gibson(2) (Chief Financial Officer (CFO)) C A Hooke P R Reidie(3) (Managing Director, Goodman Fielder Australia and New Zealand) I D Johnston Former KMP – Executives I G Cornell S M Gannon(2) (Chief Financial Officer) N A Kearney(2) (Interim Chief Financial Officer) A R Hipperson(3) (Managing Director, Goodman Fielder Australia) (1) (1) Mr Cornell was appointed a non-executive Director of the Company, effective 15 February 2014. (2) Mr Gibson was appointed Chief Financial Officer of the Group, effective 1 April 2014. Mr Gannon, the former Chief Financial Officer, ceased employment with the Group on 29 November 2013 and Mr Kearney, the Group’s Chief Strategy and Corporate Development Officer, served as interim Chief Financial Officer from 30 November 2013 to 31 March 2014. (3) Mr Hipperson, the Managing Director of the Group’s Australian operations, passed away in a motorcycle accident on 18 January 2014. Mr Reidie was appointed Managing Director of the Group’s Australian and New Zealand businesses effective 13 February 2014. 2. REMUNERATION GOVERNANCE The performance of the Group depends upon the quality of its Directors, senior executives and employees. The Group’s remuneration policy is set by the Board, with the objective of determining a framework of rewards which aligns with the Group’s strategic objectives and shareholder expectations while also recognising the challenges which are particular to the Group and the industry in which it operates. 32 GOODMAN FIELDER ANNUAL REPORT 2014 GOODMAN FIELDER ANNUAL REPORT 2014 Directors’ Report (continued) HUMAN RESOURCES AND REMUNERATION COMMITTEE 3. The Human Resources and Remuneration Committee (the Committee) is responsible for recommending to the Board the compensation arrangements for non-executive Directors, the CEO and all executives who report directly to the CEO. Compensation arrangements for all other executives are determined by the CEO or relevant managers, having regard to guidelines determined by the CEO in consultation with the Committee and Board. The Group treats the remuneration structure of non-executive Directors as separate and distinct from that of executive Directors and senior executives. The Committee also plays an important role in monitoring organisational capability, succession planning and talent development. The primary purpose of the Committee is to support and advise the Board in fulfilling its responsibilities to shareholders by reviewing and making recommendations to the Board on: • the Group’s executive remuneration policy; •the remuneration of executive and non-executive Directors, as well as senior executives reporting directly to the CEO; •the organisational capability of the Group, including having regard to talent and succession management for key roles and functions and the effectiveness of the Group’s recruitment, appointment, retention and termination policies and procedures and succession planning processes for senior executives; •equity-based remuneration plans and other incentive schemes; and • general remuneration and human resources policy. NON-EXECUTIVE DIRECTOR REMUNERATION OBJECTIVE/POLICY It is the Company’s objective to set aggregate remuneration for non-executive Directors at a level which will allow it to attract and retain Directors of the highest calibre, at a cost which is fair and reasonable in light of prevailing market conditions and is acceptable to shareholders. Director remuneration is reviewed annually by the Board, having regard to the recommendations of the Committee and externally obtained market information for companies of comparable size and complexity, the commercial expertise and experience of the Directors, and the responsibilities and work requirements of the Chairman and members of the Board and Board committees. Consistent with prior years, total remuneration for non-executive Directors remained targeted between the market median and 75th percentile. Fees for the 2014 financial year for the Company’s Chairman, Mr Gregg, represent a multiple of approximately 2.4 times the base Board fee. There was no increase in Board or committee fees in the 2014 financial year and there will be no increase in fees for the year ending 30 June 2015. The Committee comprises four independent non-executive directors: NON-EXECUTIVE DIRECTORS’ FEE POOL • Ms Chris Froggatt (Chairman); • Mr Ian Cornell (appointed 15 February 2014); • Mr Peter Hearl; and The current aggregate limit remains at $1,500,000 per annum, which was approved 9 years ago by shareholders at the General Meeting in 2005. • Mr Ian Johnston. Other non-executive Directors attend meetings of the Committee by standing invitation. The CEO attends meetings as required, but is not present during consideration of matters in which he has a personal interest unless such attendance is approved by the members of the Committee. The Committee is supported by Goodman Fielder’s Chief Human Resources Officer, the Company Secretary and, as necessary, external advisors. During the year, the Committee met 4 times. The broad areas of consideration by the Committee during the year included: remuneration strategy, conditions and payments; incentive plan structures; engagement, retention and talent management and diversity. USE OF REMUNERATION CONSULTANTS Total Board and Committee fees paid to non-executive Directors for the year ended 30 June 2014 were $1,248,013, representing approximately 83% of the maximum amount recommended by the Company and approved by shareholders. REMUNERATION STRUCTURE Non-executive Directors receive Board fees and Committee fees only. Fees are inclusive of superannuation contributions. Non-executive Directors receive no other remuneration but may be reimbursed for expenses directly incurred in the course of their duties. There are no unvested options or other share-based entitlements held by any non-executive Director and no pensions or other termination benefits are payable to any non-executive Director on ceasing to be a member of the Board. No options over unissued shares in the Company were granted to any non-executive Director or other share-based payments made as part of their remuneration during or in connection with the 2014 financial year. EY (formerly Ernst & Young) was appointed as independent remuneration advisor to the Committee and Board in November 2012. EY provided remuneration benchmarking data for the CEO, members of the Group Executive and non-executive Directors in connection with the Committee and Board’s consideration of remuneration for the 2014 financial year, as well as information on other matters regarding the Group’s remuneration framework and incentive programs and general data regarding market practice. No remuneration recommendations were provided by EY during or in connection with the 2014 financial year. GOODMAN FIELDER ANNUAL REPORT 2014 33 GOODMAN FIELDER ANNUAL REPORT 2014 Directors’ Report (continued) Annual fees payable to non-executive Directors for Board and Committee membership were as follows: ChairmanMember $$ 2014 Fees 2013 Fees 330,000330,000/376,700 Board (1) (2) 2014 Fees 2013 Fees 137,000137,000 Audit Committee 30,80030,800 14,40014,400 Corporate Risk Committee 21,60021,600 12,90012,900 Human Resources and Remuneration Committee 20,50020,500 11,30011,300 (1) Board fees were not paid to Mr Delaney, an executive Director, as his remuneration was paid in respect of responsibilities relating to his executive role as well as his duties as a Director of the Company. (2) As Chairman of the Board, Mr Ould was entitled to a fee of $376,700 per annum. Following Mr Ould’s retirement on 1 October 2012, Mr Gregg accepted the position of Chairman of the Board at a fee of $330,000 per annum. The Chairman of the Board is not entitled to any additional fees for serving on Board Committees. The remuneration of the Company’s non-executive Directors for the year ended 30 June 2014 is set out below: 20142013 $$ Non-executive Directors: S Gregg (Chairman)(2)(3) I G Cornell(4) Short-term Short-term benefits – Post- benefits – salary employment – Total salary (1) and fees superannuation remuneration and fees Postemployment – superannuation Total remuneration(1) 312,225 17,775330,000274,826 15,924290,750 50,904 4,70955,613N/AN/AN/A J A Dawson(5) 150,389 13,911164,300109,748 9,877119,625 C J Froggatt 118,895 51,505170,400119,252 51,148170,400 P R Hearl 168,696 15,604184,300162,836 14,655 177,491 C A Hooke 165,400 15,300180,700165,780 14,920180,700 I D Johnston 125,928 36,772162,700139,654 23,046162,700 (3) Total 1,092,437 155,5761,248,013 972,096 129,5701,101,666 (1)Amounts disclosed as Director remuneration exclude insurance premiums paid by the Group in respect of Directors’ and officers’ liability insurance contracts which cover current and former Directors, Secretaries and senior managers of Goodman Fielder Limited and its subsidiaries. This amount has not been allocated to the individuals covered by the insurance policy as, based upon all available information, the Directors believe that no reasonable basis for such allocation exists. (2)Comparative fees for Mr Gregg reflect Mr Gregg’s election by the other Directors as Chairman of the Board effective 1 October 2012. (3)Mr Gregg resigned as Chairman of the Corporate Risk Committee and as a Member of the Audit Committee on 25 October 2012. Mr Hearl was appointed Chairman of the Corporate Risk Committee on 25 October 2012. (4)Mr Cornell was appointed a Director of the Company and a Member of the Human Resources and Remuneration Committee effective 15 February 2014. (5)Comparative fees for Ms Dawson reflect her appointment as a Director of the Company and a Member of the Corporate Risk Committee effective 1 October 2012 and her appointment as a Member of the Audit Committee on 1 January 2013. 34 GOODMAN FIELDER ANNUAL REPORT 2014 GOODMAN FIELDER ANNUAL REPORT 2014 Directors’ Report (continued) 4. EXECUTIVE DIRECTOR AND EXECUTIVE REMUNERATION REMUNERATION STRATEGY The Committee and Board recognise that the Group’s ability to achieve the objectives of its strategic plan and restore earnings performance is dependent upon the quality and commitment of its people. To prosper, the Group must: • provide competitive rewards to attract, motivate and retain high calibre executives and employees; • ensure alignment of executive remuneration with Group objectives, as established in the Group strategic plan; • link executive rewards to the creation of value for shareholders; and • ensure that there is an appropriate balance between fixed and ‘at risk’ remuneration for executives. VISION & GOALS The diagram below illustrates how the remuneration principles that underpin the Group’s remuneration policy (and the remuneration components utilised by the Group to satisfy those principles) support the execution of the Group’s strategy. TO BE THE LEADING AND MOST INNOVATIVE LOCAL FOOD COMPANY SHAREHOLDER ORGANISATION IMPERATIVES Restore acceptable shareholder returns Actively engaged employees Safety, Quality, Innovation, Customer Service REMUNERATION STRATEGY REMUNERATION PRINCIPLES MARKET COMPETITIVE PERFORMANCE ORIENTED SHAREHOLDER ALIGNED BALANCED Competitive rewards to attract, motivate and retain high-calibre Directors, executives and employees Remuneration arrangements commensurate with business performance Executive rewards aligned with the creation of value for shareholders Appropriate balance between fixed and “at risk” remuneration FOCUS AREAS REMUNERATION COMPONENTS FIXED ANNUAL REMUNERATION (FAR) SHORT-TERM INCENTIVE (STI) •Base level of reward benchmarked to comparable roles in companies of similar size/complexity •Cash payment awarded on achievement of Group and division earnings and safety targets •Flexibility to recognise individual performance, qualifications and experience •At Board’s discretion, up to one quarter of opportunity deferred for one year and received as Company shares LONG-TERM INCENTIVE (LTI) •Shares awarded under Equity Incentive Plan to align executive rewards with shareholder interests (or, in respect of Mr Foyston, a cash incentive award) •Tested at end of three-year performance period •Internal (ROCE) and external (relative TSR) measures GOODMAN FIELDER ANNUAL REPORT 2014 35 GOODMAN FIELDER ANNUAL REPORT 2014 Directors’ Report (continued) Objective and Structure The Group aims to reward executive Directors and executives with a level and mix of remuneration having regard to their position and responsibilities within the Group. Executive remuneration consists of two elements – fixed remuneration and performance-linked (variable) remuneration (which in turn comprises “at risk” short-term and long-term incentive components). An executive’s total remuneration opportunity is intended to provide a base level of reward, with additional incentive rewards under the Group’s short-term and long-term incentive programs when performance targets agreed by the Board have been achieved or exceeded. Element Components Key attributes Fixed Remuneration Fixed Annual Remuneration (FAR) •base level of remuneration which is both appropriate to the position and is competitive in the market + •targeted at market median using benchmarking data •flexibility to recognise individual performance, qualifications and experience, capability and value to the organisation •remunerates executives for completion of requirements and objectives of their roles Performance-linked Remuneration Short-Term Incentive (STI) •designed to reward achievement of annual financial and non-financial objectives (measured at a Group or Category/Market level) and drive desired behaviours which are consistent with and provide a foundation for the Group’s long-term strategy •targeted at or above market median with potential to achieve top quartile for stretch performance against financial targets linked to annual budgets for Group and Categories/Markets •delivered in cash or, at the Board’s discretion, cash and Company shares to further align executive rewards to longer-term shareholder interests Long-Term Incentive (LTI) •designed to align longer-term executive and shareholder interests, provide a retention incentive and reward executives for achieving improvements in the main performance drivers of the business, which underpin sustainable growth in shareholder value over time •generally an annual grant of rights to be allocated shares in the Company, subject to achievement of relevant performance and service conditions •F2014 offer targeted between market median and 75th percentile Total Remuneration Opportunity • targeted between market median and 75th percentile for senior executive roles •structured to attract and retain executives, with incentive rewards intended to reflect Group performance and share price over an extended period The mix of fixed and performance-based remuneration as a percentage of each senior executive’s total remuneration opportunity at target performance (excluding one-time incentives and allowances detailed on pages 45 and 46) is set out in the table below: REMUNERATION MIX AT TARGET PERFORMANCE (AS A PERCENTAGE OF TOTAL REMUNERATION) CEO(1) 36% 48% CFO(2) Managing Directors(3) 50% 0% 36% 28% 28% 24% 30% 20% 100% FAR STI LTI (1)Mr Delaney’s total remuneration opportunity includes certain one-time incentives and allowances which are not reflected in the above table (refer to pages 45 and 46). (2)Mr Gibson commenced employment with the Group as Chief Financial Officer on 1 April 2014. The above table represents Mr Gibson’s total remuneration opportunity as if he had been employed by the Group as Chief Financial Officer for the full 2014 financial year, but excludes any sign-on/retention incentives paid or payable in respect of his employment (refer to pages 45 and 46). (3)The above table represents the total remuneration opportunity of Managing Directors, but excludes any sign-on incentives or special/compensatory allowances paid or payable to these senior executives (refer to page 46). The above proportions are based upon each executive’s total remuneration opportunity as approved by the Board for the year ended 30 June 2014 and do not necessarily reflect the actual remuneration received by that executive for the 2014 financial year. Payments to senior executives under the STI plan and vestings under the LTI plan may be adjusted at the discretion of the Board, provided there is no reduction in the accrued benefits or accrued entitlements of plan participants. 36 GOODMAN FIELDER ANNUAL REPORT 2014 GOODMAN FIELDER ANNUAL REPORT 2014 Directors’ Report (continued) FIXED ANNUAL REMUNERATION (FAR) Fixed remuneration is determined by assessing an individual’s competency level and experience against the position requirements relative to business unit/functional alignment and external market conditions, with flexibility to recognise individual performance and value to the organisation. FAR What is included in FAR? FAR includes cash salary, compulsory superannuation contributions, salary sacrifice items and certain other short-term or non-cash benefits (such as novated vehicle lease payments). Executives have the opportunity to receive a portion of their fixed remuneration in a variety of forms, including fringe benefits such as motor vehicles, or to make additional contributions to superannuation or retirement plans (as permitted by relevant legislation), to enable them to structure their remuneration in a manner which best suits their own circumstances without creating additional costs for the Group. How is FAR reviewed? FAR is reviewed annually by the Committee at the end of the financial year, having regard to Group, business unit and individual performance and relevant comparative remuneration in the market, with recommendations made to the Board. Annual adjustments approved by the Board are effective 1 July. The Board may also approve adjustments to Group Executive remuneration as recommended by the CEO, such as on promotion or as a result of additional duties performed by the executive. Where new senior executives join the Group or existing executives are appointed to new roles, a review and benchmarking of fixed and total remuneration is conducted for each individual prior to the issue of an offer and execution of a new employment contract. Annual adjustments to the remuneration of executives and employees who are not members of the Group Executive are determined based upon guidelines approved by the CEO at the commencement of the financial year and advised to the Committee. Which benchmarks are used? Remuneration for key management personnel was benchmarked against both survey data and data from a remuneration peer group of ASX-listed companies. EY provided advice and benchmarking data to the Committee in connection with the Committee’s review of FAR for members of the Group Executive in June 2013. At the beginning of the 2014 financial year, adjustments to FAR of between 0% and 3.5% were approved for members of the Group Executive, including a 2% increase to the CEO’s FAR for the year ended 30 June 2014. There will be no adjustment to the CEO’s FAR for the 2015 financial year, while an average increase of less than 2% has been approved for other members of the Group Executive. SHORT-TERM INCENTIVE (STI) In addition to FAR, senior executives have an opportunity to receive a short-term incentive award based on Market/Category and/or Group performance for the financial year. STI levels are generally set at or above market median for target performance, with rewards within the top quartile for stretch performance. STI Plan What is the STI Plan? Under the STI Plan, an “at risk” incentive is awarded annually, based upon the achievement of financial and non-financial performance measures. In general, of the total incentive opportunity, the first 50% is paid in cash, with the remainder split equally between cash and, at the Board’s discretion, Company shares. Up to one quarter of an executive’s total STI opportunity may be deferred for a year and received as shares in the Company. How and when are targets set? Performance measures and the weightings applied to them are evaluated each year to ensure that appropriate performance criteria are being used to motivate and reward executives. The Board approves the plan structure and the targets to be met by the CEO and other senior executives under the STI plan. Financial and risk management targets are set at the commencement of each financial year. Individual business objectives are set following completion of each executive’s performance plan for the financial year, and constitute individual performance goals for that year, including participation in major projects and initiatives aligned with the Market, Category and Group’s business and strategic objectives. GOODMAN FIELDER ANNUAL REPORT 2014 37 GOODMAN FIELDER ANNUAL REPORT 2014 Directors’ Report (continued) STI Plan (continued) What is the potential value of the STI opportunity? What are the FY14 performance measures? Each executive’s potential STI opportunity is determined as a percentage of FAR. A ‘stretch’ opportunity is available where financial performance exceeds the target approved by the Board. Target and maximum stretch opportunities under the FY14 STI Plan for senior executive roles are set out below: Target Opportunity (as a % of FAR) Stretch Opportunity (as a % of FAR) CEO 75% 108.75% CFO, Managing Directors 60% 87% The financial performance measures approved by the Board for the FY14 STI Plan were: • Group net profit after tax (‘NPAT’) and • Market/Category earnings before interest and tax (‘EBIT’). For incentive plan purposes, targets for both performance measures exclude significant items (eg. restructure costs, asset sales or write-downs or impairment charges) as determined by the Board. The risk performance measure selected for all executives was an agreed reduction in the Significant Injury Frequency Rate (‘SIFR’) of employees, with Market executives assessed on a Market safety target and Group and Category executives against a Group target. The weighting between different measures for KMP is set out below: Group Financial Performance Group Risk Performance Market Financial Performance Market Risk Performance Measure Group NPAT Group SIFR Market EBIT Market SIFR CEO, CFO 90% 10% N/A N/A Managing Directors 40% N/A 50% 10% The targets set at the beginning of the 2014 financial year for each financial measure required performance at or above 2013 Market/Category and Group results. Thresholds: A 95% achievement threshold applied to the Group NPAT and Market/Category EBIT measures, although the Board retains discretion to make an incentive award under the plan where financial thresholds are not met. At threshold performance, a 25% incentive award may be paid. Between threshold and target NPAT and EBIT performance, incentive payments may be made to a maximum of 50% of each of the performance measures. No financial performance threshold applied to the award of incentives for safety performance, as the Board determined that the achievement of ongoing improvements in safety should be rewarded irrespective of the financial performance of the Market or Group. Other performance measures: Performance against other financial and non-financial measures (including achievement of individual performance objectives) is managed separately through the Group’s performance assessment and management program. Executives must achieve at least a “satisfactory” performance rating in their year-end performance review in order for incentives under the STI Plan to be paid. 38 GOODMAN FIELDER ANNUAL REPORT 2014 GOODMAN FIELDER ANNUAL REPORT 2014 Directors’ Report (continued) STI Plan (continued) Why were the performance measures selected? The performance measures for FY14 are consistent with those approved by the Board in the prior year, to maintain management focus on the Company’s immediate financial and risk management priorities under its strategic plan. Market/Category EBIT remains a key measure to motivate and reward Market and Category executives where the financial performance of the business they lead meets or exceeds challenging earnings targets. The performance measures are adjusted so that significant items (abnormal or unanticipated factors such as restructure costs, sales of businesses or impairment charges) that were not included in the annual budgets for the Market/Category and Group and that have impacted the Group’s performance during the year, as determined by the Board, are excluded. NPAT/EBIT: Both measures were identified as key financial objectives for the success of Goodman Fielder in 2014 and the achievement of satisfactory returns for the Company’s shareholders. As the businesses must deliver bottom-line growth in order to achieve sustainable increases in Group earnings that are consistent with shareholder expectations, Market/Category EBIT and Group NPAT continue to be considered appropriate financial performance criteria for the STI plan. SIFR: The safety of its people is one of the Group’s core values and achievement of ongoing improvements in safety remains a key focus of the Board and management. Consistent with this priority, a reduction in injuries (measured through Group and Market SIFR targets) was the only non-financial performance measure selected for the FY14 STI plan. How is performance measured? Achievement of financial targets is confirmed following completion of the financial year, once the Group’s annual accounts have been approved by the Directors and audited. Risk management performance is confirmed through an internal assessment of achievement against performance targets at the end of the financial year. Once it has been determined whether, and the extent to which, the performance targets set at the beginning of the financial year have been met, the Human Resources and Remuneration Committee will make a recommendation to the Board for approval of the STI awards to be paid to the CEO and members of the Group Executive. When are incentives paid? Cash: Cash incentive entitlements approved by the Board are paid in the month following the release of the Group’s full-year results to the ASX/NZX. Shares: The Board has discretion to pay up to one quarter of an executive’s STI opportunity by way of Company shares. Allocation of any deferred share component of a STI award would occur during the trading window following the release of the Company’s full year results, provided executives remain employed by the Group at the time of allocation. All shares to satisfy entitlements would be purchased on-market. Does a ‘clawback’ apply? Where a portion of the STI award is deferred and paid in shares in the Company, the rights or interests in those shares allocated may be forfeited, at the Board’s discretion, if the Group’s financial statements in respect of a financial year are found to be materially misleading. The provision applies only to those executives who were members of the Group Executive at the time the financial statements were approved by the Board and issued by the Company. LONG-TERM INCENTIVE (LTI) – SHARE-BASED PAYMENTS The CEO and nominated executives may be invited to receive shares in the Company over rolling three-year periods pursuant to the Equity Incentive Plan (formerly the Performance Share Plan) approved by shareholders at the Company’s 2007 Annual General Meeting. Entitlement to shares under the plan is subject to the Group meeting key performance criteria determined by the Board for the relevant three-year performance period. LTI Plan What is the LTI Plan? Under the Group’s Equity Incentive Plan (EIP), rights to acquire shares in the Company may be offered annually to the CEO and nominated executives. The participants in the plan include executives who are considered to play a leading role in achieving the Group’s long-term strategic and operational objectives. The EIP is a retention incentive that is intended to promote alignment between executive and shareholder interests over the longer term. Each right offered is an entitlement to one fully paid ordinary share in the Company on terms and conditions determined by the Board, including vesting conditions linked to both service (through a three-year performance period for each offer) and performance. The rights have no dividend or voting entitlement. Shares allocated on vesting have the same rights as other ordinary shares. Participants are not required to pay for rights at grant or vesting, or for shares allocated to them on vesting of the rights. If the relevant service and performance criteria are met, the incentive is awarded in Goodman Fielder shares which have been purchased on-market. GOODMAN FIELDER ANNUAL REPORT 2014 39 GOODMAN FIELDER ANNUAL REPORT 2014 Directors’ Report (continued) LTI Plan (continued) How and when are targets set? Each year, performance targets are set for the subsequent three-year period, with the objective of ensuring that the payment of incentives reflects a corresponding increase in shareholder value. Achievement against the performance targets is reviewed at least twice yearly over the performance period, in conjunction with the preparation of the Group’s half-year and annual financial reports. Once set, performance targets are not re-set by the Board. The performance conditions applicable to offers under the EIP are evaluated each year prior to a grant to ensure that appropriate performance criteria are being used to motivate executives in light of changing long-term Group and stakeholder objectives. The Board approves the structure of each offer under the EIP and the targets to be met by participants. What is the potential value of the opportunity under the EIP? Each executive’s potential opportunity under the EIP is determined as a percentage of FAR. A ‘stretch’ opportunity is available where performance exceeds the targets approved by the Board. Target and stretch opportunities under the F2014 EIP for senior executive roles are set out below: Target Opportunity (as a % of FAR) Stretch Opportunity (as a % of FAR) CEO 100% 150% CFO 50% 62.5% Managing Directors 40% 50% The number of shares to which senior executives are entitled under the EIP if performance targets are achieved is determined as follows: Relevant % x $FAR ÷ VWAP of the Company’s shares(1) during the last ten trading days of the financial year prior to commencement of the performance period(2) = Number of Shares (1)The average of the daily volume weighted average sale price of shares in the Company traded on the ASX. (2)For the F2012 and F2013 offers, the number of shares was determined using the closing share price on the last trading day in June prior to commencement of the performance period. What are the relevant performance measures? The financial performance measures approved by the Board for current offers under the EIP are: • Return on capital employed (‘ROCE’) and • Relative total shareholder return (‘TSR’). ROCE is determined at the end of the performance period by dividing the Group’s normalised earnings before interest and tax (EBIT) by the difference between total assets and total liabilities (excluding cash, borrowings and tax-related assets and liabilities). Normalised EBIT excludes significant items such as asset sales, restructure costs and impairment charges, as determined by the Board. TSR is the combined return from changes in the market value of a share and dividends paid to shareholders (expressed as a percentage of the opening value) and relative TSR is the ranking of the compound growth in the Company’s TSR over the performance period against the TSR of comparison companies. For all executives, including the CEO, the ROCE and TSR measures are equally weighted. The following performance targets apply to the ROCE and TSR components of the EIP offers: F2012 Offer – Performance Period: 1 July 2011 to 30 June 2014(1) ROCE 12% 13% 14% Incentive entitlement(2) 50% 75% 100% 15% 125%(2) F2013 Offer – Performance Period: 1 July 2012 to 30 June 2015 40 ROCE 12% 13% 14% Incentive entitlement(2) 50% 75% 100% GOODMAN FIELDER ANNUAL REPORT 2014 15% (CEO) 150%(2) (other) 125%(2) GOODMAN FIELDER ANNUAL REPORT 2014 Directors’ Report (continued) LTI Plan (continued) What are the relevant performance measures? (continued) F2014 Offer – Performance Period: 1 July 2013 to 30 June 2016 ROCE Incentive entitlement (1) 11.4% 12.4% 13.4% 50% 75% 100% 14.4% (CEO) 150%(2) (other) 125%(2) A ROCE performance target did not apply to Mr Delaney’s F2012 Offer. (2)Represents percentage of ROCE component earned. Executives are entitled to a ‘stretch’ incentive for achievement of the relevant performance criterion. F2012 – F2014 Offers: Goodman Fielder TSR performance measured against comparator group Percentage of TSR Component Earned CEO Percentage of TSR Component Earned Other Senior Executives Nil Nil 50% 50% Between 50th and 65th percentile Straight-line vesting between 50% and 100%(1) Straight-line vesting between 50% and 100%(1) Between 65th and 75th percentile Straight-line vesting between 100% and 150% Straight-line vesting between 100% and 125% 150% 125% Less than 50th percentile Equal to 50th percentile Greater than 75th percentile (1)For the F2012 offer, straight line vesting did not apply to relative TSR performance between the 50th and 65th percentile and only 50% of the TSR component would be earned for performance below the 65th percentile. Approval by the Board of the EIP performance targets set out above does not represent an earnings forecast or disclosure of targets under the Company’s strategic plan. Why were the performance measures selected? ROCE was selected as it is considered to be an effective measure for determining the underlying profitability of the business and the effective deployment of assets. Relative TSR (a market-based performance measure) was selected to ensure an alignment between comparative shareholder return and reward for executives, and to provide a direct comparison of the Company’s performance over the three-year performance period against a comparator group of companies that would, broadly, be expected to be similarly impacted by changes in market conditions. How is performance measured? ROCE: Performance is confirmed through an internal assessment of achievement against performance targets at the end of the three year performance period, once the Group’s annual financial statements have been approved by the Directors and audited. Relative TSR: At the end of the performance period, Goodman Fielder’s TSR performance is measured against the performance of a comparator group of companies. The Board has discretion to adjust the comparator group to take into account events such as company restructures or takeovers which may affect the comparability of those companies. The comparator group for the F2012 and F2013 offers comprised the following companies within the consumer staples, consumer discretionary, healthcare, IT and telecommunications sectors which had assets, revenues and net income broadly comparable to the Company: Billabong International Limited, Coca-Cola Amatil Limited, Computershare Limited, CSL Limited, Crown Limited, David Jones Limited, Fairfax Media Limited, Flight Centre Limited, GrainCorp Limited, Harvey Norman Holdings Limited, JB Hi-Fi Limited, Myer Holdings Limited, Pacific Brands Limited, Ramsay Health Care Limited, Sigma Pharmaceuticals Limited, Sonic Healthcare Limited, Tabcorp Holdings Limited and Tatts Group Limited(1). (1)Foster’s Group Limited and Telecom Corporation of New Zealand Limited were included in the comparator group for the F2012 offer but excluded from the comparator group for the F2013 offer following either acquisition by another entity or a restructure/demerger of the company into two separate entities. GOODMAN FIELDER ANNUAL REPORT 2014 41 GOODMAN FIELDER ANNUAL REPORT 2014 Directors’ Report (continued) LTI Plan (continued) How is performance measured? (continued) Following discussions with investors, proxy advisors and EY, in February 2013 the Board approved a change in comparator group for the F2014 offer. The comparator group for the F2014 offer comprised S&P/ASX 200 market constituents, excluding companies within the Global Industry Classification Standard (GICS) Financials sector and Metals and Mining industry. In assessing the Company’s relative TSR performance, independent data is obtained which details the TSR growth of the Company and each company in the comparator group over the performance period. Once it has been determined whether, and the extent to which, the performance targets set at the beginning of the performance period have been met, the Committee will make a recommendation to the Board for approval of the LTI awards to be paid to EIP participants. In general, in order for shares to be allocated under the EIP, at least one of the performance targets must be met to a minimum level. The Board retains discretion to award incentives under the EIP, having consideration to performance and other relevant factors, even though one or all criteria are not achieved. The Board has not previously exercised this discretion. When are incentives paid? Entitlement to shares under the EIP is also subject to senior executives remaining employed by the Group at the date the shares are allocated, which will occur following release of the Group’s full year results after completion of the relevant three-year performance period. Does a ‘clawback’ apply? The F2013 and F2014 offers include provisions for unvested rights to lapse and rights or interests in shares allocated or to be allocated under the EIP to be forfeited, at the Board’s discretion, if the Group’s financial statements in respect of a financial year are found to be materially misleading. The provision applies only to those executives who were members of the Group Executive at the time the financial statements were approved by the Board and issued by the Company. What happens on a change of control? The EIP Rules provide that if a “Change of Control Event” occurs, the Board may, in its absolute discretion, having regard to all matters which the Board considers relevant, determine the treatment to apply in respect of any of the conditions or restrictions applicable to the rights to shares in the Company under the EIP. A “Change of Control Event” is defined in the EIP Rules to include the acquisition of more than 50% of the Company’s issued ordinary shares and also any other transaction, event or state of affairs that the Board reasonably expects will result in a change of control of the Company. On 2 July 2014 the Company announced that it had entered into a Scheme Implementation Deed with Wilmar and First Pacific under which Wilmar and First Pacific will acquire all the remaining issued shares in the Company that they and their related entities do not already own by way of a scheme of arrangement (“Scheme”). The implementation of the Scheme is subject to a number of conditions. The Scheme Implementation Deed provides for the Company, Wilmar and First Pacific to work together to develop a replacement incentive plan satisfactory to all parties (which would take effect from the implementation date of the Scheme (“Implementation Date”)). If a replacement plan is developed, subject to any action otherwise agreed in writing between the parties, the Board will take all reasonable steps to cause any unvested entitlements under the EIP that remain on foot on the effective date of the Scheme (“Effective Date”) to be forfeited and replaced with equivalent new awards under the replacement incentive plan. If the Scheme is implemented and a replacement plan satisfactory to all the parties has not been developed before the record date of the Scheme (“Record Date”), the Board must take all steps, in accordance with the EIP Rules (and subject to any action otherwise agreed in writing between the parties), to cause a pro-rata amount(1) of any unvested entitlements granted under the EIP to vest and be delivered in the form of shares in the Company between the Effective Date and the Record Date and to ensure that the remaining unvested incentives under the EIP lapse or are otherwise forfeited or extinguished on or before the Implementation Date. (1)Calculated on a time basis, from the commencement of the relevant three-year performance period to the Scheme Record Date. 42 GOODMAN FIELDER ANNUAL REPORT 2014 GOODMAN FIELDER ANNUAL REPORT 2014 Directors’ Report (continued) Summary of Executive Entitlements under EIP Offers Details of entitlements to acquire shares in the Company under the EIP that were granted to Group Executives who are key management personnel are as follows: Executive Share Entitlements under ROCE and TSR Components of EIP % of total opportunity Entitlement to ordinary Expense/(credit) Financial year shares under recognised at in which EIP – number Performance % Earned % Forfeited 30 June 2014 shares will be of shares(1) Effective grant date(2) period ends in year in year $(3)(4)allocated ROCE Component – Current KMP – Executive Directors and Executives C R Delaney 976,660 1,252,727 P A Gibson(5) (5) 10 December 2013 30 June 2016 – – – 2016/17 7 December 2012 30 June 2015 – – – 2015/16 30 June 2016 – – – 2016/17 (5) P R Reidie 224,030 10 December 2013 30 June 2016 – – – 2016/17 263,971 7 December 2012 30 June 2015 – – – 2015/16 67,751 13 December 2011 30 June 2014 – 100% – 2014/15 TSR Component – Current KMP – Executive Directors and Executives C R Delaney 976,660 10 December 2013 30 June 2016 – – 117,199 2016/17 1,252,728 7 December 2012 30 June 2015 – – 217,139 2015/16 1,250,000 13 December 2011 30 June 2014 – 100% 62,500 2014/15 30 June 2016 – – 7,398 2016/17 P A Gibson(5) (5) (5) P R Reidie 224,030 10 December 2013 30 June 2016 – – 26,884 2016/17 263,971 7 December 2012 30 June 2015 – – 45,755 2015/16 67,751 13 December 2011 30 June 2014 – 100% 3,388 2014/15 Former KMP – Executives S M Gannon(6) (ROCE) 363,636 7 December 2012 30 June 2015 – 100% – 2015/16 (ROCE) 188,679 22 August 2012 30 June 2014 – 100% – 2014/15 (TSR) 363,637 7 December 2012 30 June 2015 – 100% (63,030) 2015/16 (TSR) 188,679 22 August 2012 30 June 2014 – 100% (13,365) 2014/15 A R Hipperson (ROCE) 209,725 10 December 2013 30 June 2016 – 100% – 2016/17 (ROCE) 269,091 7 December 2012 30 June 2015 – 100% – 2015/16 (ROCE) 62,854 13 December 2011 30 June 2014 – 100% – 2014/15 (TSR) 209,725 10 December 2013 30 June 2016 – 100% – 2016/17 (TSR) 269,091 7 December 2012 30 June 2015 – 100% (46,642) 2015/16 (TSR) 62,854 13 December 2011 30 June 2014 – 100% (4,889) 2014/15 (6) (1)Represents the maximum number of shares to which executives will be entitled if the performance and service conditions are satisfied, but does not include additional shares on achievement of ‘stretch’ targets. (2)The closing price of the Company’s ordinary shares on the ASX was $0.52 at 13 December 2011, $0.665 at 7 December 2012 and $0.63 at 10 December 2013. GOODMAN FIELDER ANNUAL REPORT 2014 43 GOODMAN FIELDER ANNUAL REPORT 2014 Directors’ Report (continued) (3)In general, the performance criteria must be achieved before any shares are allocated under the EIP, as outlined above. Therefore the minimum potential value of the entitlements under the EIP is nil. The maximum value of the entitlements under the EIP is the individual’s entitlement at stretch performance (being the entitlement multiplied by 125% for executives other than the CEO and by 150% for the CEO) multiplied by the estimated fair value of the award at the effective grant date. The estimated fair value of the 2012, 2013 and 2014 share entitlements for executives which related to the achievement of the ROCE performance criteria was $0.52 per share, $0.665 per share and $0.63 per share, respectively. The closing share price for the Company’s ordinary shares on the ASX at 29 June 2012, 28 June 2013 and 30 June 2014 was $0.55 per share, $0.735 per share and $0.68 per share, respectively. The price proposed to be paid by Wilmar and First Pacific to acquire all of the shares in the Company under the Scheme is $0.675 per share. (4)The estimated fair values of the F2012, F2013 and F2014 share entitlements which related to the achievement of the relative TSR performance criterion under the EIP were $0.15 per share, $0.52 per share and $0.36 per share, respectively. The estimated fair values were determined using a Monte Carlo simulation pricing model which takes into account performance hurdles and the probability of achieving the performance target. The assumptions included in the valuation of the F2012, F2013 and F2014 offers include risk free rates of 3.06%, 2.60% and 3.08%, dividend yields of 9.62%, 3.01% and 5.29%, and volatility in the share price of 45%, 50% and 35%, respectively. Accounting standards require that the estimated fair value be recognised over the three-year performance period relating to the award and one-third of the total value for each of the F2012, F2013 and F2014 offers has been recognised in the current financial year, even though executives will not be entitled to be allocated these shares unless the TSR performance criterion has been met at the end of the three year performance period. (5)Mr Gibson commenced employment with the Group on 1 April 2014. His employment contract provides for him to be granted rights to acquire shares in the Company under the F2014 EIP offer on a pro-rata basis. As grants under the EIP are generally made during a trading window and Mr Gibson commenced employment with the Group after the last trading window of the 2014 financial year, a letter of offer under the EIP in respect of entitlements to 369,894 ordinary shares will be issued to Mr Gibson during the Company’s next trading window, which will commence on 14 August 2014. For the purposes of determining the amounts to be expensed during the 2014 financial year in respect of Mr Gibson’s entitlement to shares, the estimated fair values used are consistent with those used in respect of the entitlements of other executives under the F2014 EIP offer. (6)As Mr Gannon and Mr Hipperson ceased employment with the Group on 29 November 2013 and 18 January 2014, respectively, all of their entitlements to shares under the EIP were forfeited at that time. Accordingly, amounts expensed in prior years in relation to their entitlements under the EIP have been reversed in accordance with accounting standards. Executive Entitlements under other Long-term Incentive arrangements Mr Foyston, who is based in China, is entitled to a long-term incentive which is payable in cash, rather than Company shares, due to regulatory requirements associated with operating a share-based incentive plan for a small number of employees in China. Mr Foyston’s incentive arrangements are intended to be largely consistent with the offers made to other executives under the EIP, with the exception that the amount of any award is paid in cash following release of the Group’s full year results after completion of the relevant three-year performance period. A notional number of shares is determined for his long-term incentive offer, on the same basis as other Managing Directors, with the same performance measures and targets to apply. If an award is made at the end of the performance period, the cash payment made to Mr Foyston will be equivalent to the then-current market value of the notional number of shares under the offer. Mr Foyston’s entitlements under his long-term incentive arrangements are set out below: % of total opportunity Entitlements under long-term incentive Notional number Performance % Earned % Forfeited arrangements of shares(1) Effective grant date(2) period ends in year in year Expense Financial year recognised at in which 30 June 2014 incentive $(3)(4) will be paid Notional ROCE component 156,640 10 December 2013 30 June 2016 – – – 2016/17 Notional TSR component 156,640 10 December 2013 30 June 2016 – – 35,244 2016/17 Notional ROCE component 200,000 7 December 2012 30 June 2015 – – – 2015/16 Notional TSR component 200,000 7 December 2012 30 June 2015 – – 43,000 2015/16 (1)Represents the maximum notional number of shares on which Mr Foyston’s incentive will be calculated if the performance and service conditions are satisfied, but does not include additional entitlements on achievement of ‘stretch’ targets. (2)The closing price of the Company’s ordinary shares on the ASX was $0.665 at 7 December 2012 and $0.63 at 10 December 2013. (3)In general, the performance criteria must be achieved before any cash incentive is paid to Mr Foyston. Therefore the minimum potential value of his entitlements is nil and the maximum value is his entitlement at stretch performance (being the entitlement multiplied by 125%) multiplied by the estimated fair value of the award at the end of the performance period. The estimated fair value at grant date of Mr Foyston’s F2013 and F2014 entitlements which relate to the achievement of the ROCE performance criterion was $0.665 and $0.63 per his notional number of shares, respectively. The closing share price for the Company’s ordinary shares on the ASX at 30 June 2014 was $0.68 per share, and the price proposed to be paid by Wilmar and First Pacific to acquire all of the shares in the Company under the Scheme is $0.675 per share, which has been utilised to determine the fair value at balance date. (4)The estimated fair value at grant date of Mr Foyston’s F2013 and F2014 entitlements which related to the achievement of the relative TSR performance criterion was $0.52 and $0.36, respectively, per his notional number of shares. The estimated fair value is being recognised over the three-year performance period relating to the award and one-third of the total value for the F2013 and F2014 offers (utilising the price of $0.675 per share proposed to be paid by Wilmar and First Pacific to acquire all of the shares in the Company under the Scheme) has been recognised in the current financial year. Mr Foyston will not be entitled to a cash payment unless the TSR performance criterion has been met at the end of the three year performance period. 44 GOODMAN FIELDER ANNUAL REPORT 2014 GOODMAN FIELDER ANNUAL REPORT 2014 Directors’ Report (continued) OTHER PAYMENTS OR BENEFITS Executive Share-Based Entitlements under Sign-on/Retention Incentives As disclosed in the Company’s 2013 Remuneration Report, Mr Delaney and Mr Gannon were both granted sign-on incentives in the form of rights to shares in the Company in connection with their employment with the Group. Each performance right represents an entitlement to one fully paid ordinary share in the Company, subject to specified service and performance conditions. Mr Delaney As approved by shareholders at the Company’s 2011 Annual General Meeting, Mr Delaney was granted: a)500,000 performance rights to vest three years after the commencement of Mr Delaney’s employment, subject to his continued employment with the Group at the end of the three-year period; and b)500,000 performance rights to vest three years after the commencement of his employment, subject to the Company achieving a compound annual earnings per share (EPS) growth rate of at least 10% over the three-year period. If Mr Delaney’s employment had ceased prior to the end of the three year period, the performance rights subject to the continued employment condition would have been forfeited but the rights subject to the EPS performance condition would have vested on a pro-rata basis for the period that had been completed, provided the EPS target had been met over that reduced period. Subsequent to year end, on 4 July 2014, 500,000 performance rights that were subject to the continued employment condition vested and Mr Delaney was allocated 500,000 shares in the Company. The remaining 500,000 performance rights lapsed on 4 July 2014 as the Company did not achieve the required EPS growth rate over the three-year period. Mr Gannon Mr Gannon was granted rights to 300,000 shares in the Company, which would have vested on 1 December 2014, subject to his continued employment with the Group at the end of that period. Mr Gannon ceased employment with the Group on 29 November 2013 and all of the rights relating to his sign-on incentive were forfeited at that time. Mr Gibson Mr Gibson commenced employment with the Group on 1 April 2014. Mr Gibson’s employment contract provides for him to be offered a one-time grant of rights to 300,000 shares in the Company, which will vest on 31 March 2017, subject to his continued employment with the Group at the end of that period. The share-based incentive and cash sign on-incentive set out below were considered reasonable to secure the services of Mr Gibson, an experienced senior finance executive with extensive listed company and international FMCG experience. A summary of the entitlements to acquire shares in the Company under sign-on/retention incentives granted to Messrs Delaney, Gannon and Gibson is set out below: % of total opportunity Entitlement to Executive Share ordinary shares Expense/(credit) Financial year Entitlements under under sign-on/ recognised at in which Sign-on/Retention retention incentive Performance % Earned % Forfeited 30 June 2014 shares will Incentives – number of shares(1) Effective grant date(2) period ends in year in year $(3) be allocated C R Delaney Service condition 500,000 13 December 2011 3 July 2014 – – 86,667 2014/15 EPS growth condition 500,000 13 December 2011 3 July 2014 – – (173,334) 2014/15 300,000 22 August 2012 30 November 2014 – 100% (81,917) 2014/15 31 March 2017 – – 16,829 2017/18 S M Gannon Service condition P A Gibson Service condition(4) (4) (4) (1)Represents the maximum number of shares to which the executive will be entitled if the relevant conditions are fully satisfied. (2)The closing price of the Company’s ordinary shares on the ASX was $0.52 at 13 December 2011 and $0.545 at 22 August 2012. (3)In general, the relevant performance or service criterion must be achieved before any shares are allocated under each executive’s sign-on incentive, as outlined above. Therefore the minimum potential value of the entitlements under the sign-on incentive is nil. The maximum value of the entitlements under each executive’s sign-on incentive has been based on the estimated fair value of the award at the effective grant date. The estimated fair value of the performance rights of Mr Delaney is $0.52 per share. The closing share price for the Company’s ordinary shares on the ASX at 30 June 2014 was $0.68 per share and the price proposed to be paid by Wilmar and First Pacific to acquire all of the shares in the Company under the Scheme is $0.675 per share. (4)As incentive grants are generally made during a trading window and Mr Gibson commenced employment with the Group after the last trading window of the 2014 financial year, a letter of offer in respect of entitlements to 300,000 shares will be issued to Mr Gibson during the Company’s next trading window, which will commence on 14 August 2014. For the purposes of determining the amount to be expensed during the 2014 financial year in respect of Mr Gibson’s entitlement to shares, the estimated fair value used is $0.675 per share. GOODMAN FIELDER ANNUAL REPORT 2014 45 GOODMAN FIELDER ANNUAL REPORT 2014 Directors’ Report (continued) Other Sign-on Incentives Mr Gibson’s contract also provided for him to be paid a sign-on incentive of $300,000, payable in cash in three equal amounts of $100,000 following his commencement as Chief Financial Officer of the Group. The first payment was made in April 2014 and subsequent payments will be made on the first and second anniversary of the commencement of his employment. Expatriate Allowances On commencement of his employment with the Group in 2011, Mr Delaney was eligible for concessional tax treatment in relation to a portion of his FAR that was considered a “Living Away From Home” (LAFH) allowance. As a result of a change in taxation laws, effective 1 October 2012 concessional tax treatment no longer applied to Mr Delaney’s remuneration. Following advice from Mercer in 2012 regarding alternative approaches to address the impact of the lost tax benefit on expatriate employees, the Board approved the payment of a fixed expatriate allowance of $295,263 per annum to Mr Delaney for the duration of his current employment contract. The Board considered the expatriate allowance reasonable to avoid a reduction in Mr Delaney’s after-tax remuneration as a result of changes in taxation of LAFH allowances. For the 2014 financial year, Mr Delaney received a total expatriate allowance of $295,263. The expatriate allowance is excluded from FAR in determining Mr Delaney’s STI and LTI opportunities. Under the terms of Mr Foyston’s employment contract, for the first 12 months of his employment with the Group (which commenced 3 September 2012), he was entitled to a reimbursement of reasonable housing and schooling costs in China. As Mr Foyston’s employment arrangements with his previous employer covered the payment of his living costs in China, the Board considered the payment of housing and schooling costs for a 12-month period to be reasonable to secure an executive of Mr Foyston’s calibre. For the year ended 30 June 2014, the Group paid RMB 169,519 (approximately $30,851) (2013: RMB 955,528 (approximately $150,330)) in respect of housing and schooling costs for Mr Foyston and his family. Other Benefits As disclosed in the 2013 Remuneration Report, Mr Delaney is entitled to health care insurance coverage for himself and his family and taxation advisory services for the preparation of tax returns while employed by the Group. Mr Delaney’s visa requires the Group to cover the costs of relocating him and his family to the United States on cessation of his employment, unless he is sponsored by another employer or is issued a different class of visa. Mr Foyston is entitled to health care insurance coverage for himself and his family for the two-year term of his contract. Other than above or in circumstances where an executive has elected to receive his or her remuneration by way of benefits instead of cash, no discretionary payments or benefits were given to senior executives during the financial year ended 30 June 2014. TERMINATION BENEFITS Mr Hipperson’s annual leave and long-service leave entitlements were paid to his estate following his accident and an amount equal to his monthly FAR continued to be paid for two months subsequent to the accident. These payments have been recorded as termination benefits for the year ended 30 June 2014. 46 GOODMAN FIELDER ANNUAL REPORT 2014 GOODMAN FIELDER ANNUAL REPORT 2014 Directors’ Report (continued) 5. GROUP PERFORMANCE A significant proportion of the total remuneration opportunity of the CEO and other senior executives is ‘at risk’ remuneration and is aligned to Group performance. In considering the Group’s performance and benefits for shareholder value in implementing and maintaining incentive reward programs, the Committee has regard to a number of indicators of Group performance, including the Group’s earnings (NPAT), return on capital employed (ROCE) and relative TSR performance, as well as improvements in the Group’s significant injury frequency rate. The Committee considers that a performance-linked remuneration structure will ensure the rewards paid to senior executives are aligned with the interests of the Group and shareholders, and will assist the Group to achieve its financial and operational targets. RELATIONSHIP BETWEEN REMUNERATION POLICY AND GROUP PERFORMANCE The following graph illustrates the link between earnings performance and remuneration policy: RELATIONSHIP BETWEEN REMUNERATION POLICY AND GROUP PERFORMANCE 100% Notes: •The normalised EBIT result for the financial year ended 30 June 2010 excludes the impact of a net $5.8 million loss on transactions for the sale of assets/businesses and $8.6 million in restructuring costs. •The normalised EBIT result for the financial year ended 30 June 2011 excludes the impact of a $300 million non-cash impairment charge and $2.8 million in restructuring costs. •The normalised EBIT result for the financial year ended 30 June 2012 excludes the impact of $187.8 million in non-cash impairment charges, $16.8 million in non-cash asset write-downs, $58.6 million in restructuring and redundancy costs and $4.0 million in non-operational realised foreign exchange losses. •The normalised EBIT result for the financial year ended 30 June 2013 excludes the impact of asset sales of $13.7 million, net insurance proceeds of $16.8 million and restructuring costs of $17.4 million. Total STI payments for the Group for the 2013 financial year reflect the payment of partial incentives (up to 20% of their target incentive opportunity) to employees below the Group Executive level for achievement of individual performance goals for the year. 0% 2010 2011 2012 2013 2014 Normalised EBIT result as % of EBIT target Actual STI Payment as % of target opportunity •The normalised EBIT result for the financial year ended 30 June 2014 excludes the impact of $358.2 million in non-cash impairment charges, $96.5 million in net losses relating to the sale of businesses and assets, a $0.1 million realised exchange loss and $38.2 million in restructuring costs. Total STI payments for the Group for the 2014 financial year reflect the payment of incentives for safety performance where performance targets were achieved (up to 10% of the target incentive opportunity), the payment of partial incentives to employees below the Group Executive level for achievement of individual performance goals for the year (up to 5% of their target incentive opportunity) and the payment of awards to in-country executives of certain of the Asia Pacific businesses for financial performance which met or exceeded the EBIT targets set. PAYMENT OF 2014 SHORT-TERM INCENTIVES AND VESTING OF 2014 LONG-TERM INCENTIVES The Group’s Australian and New Zealand businesses continued to face challenging trading conditions during the 2014 financial year, with financial performance further impacted by high commodity costs for both milk and A$ wheat, manufacturing reliability issues affecting some of the major Australian bakery sites, and ranging issues and increased competition affecting the Australian spreads business. Normalised NPAT of $63.1 million was below the target set by the Board at the beginning of the 2014 financial year and none of the Markets achieved the EBIT performance targets set. The financial performance of the Group’s Asia Pacific business improved significantly over the prior year but was adversely affected by foreign exchange rate movements in the Papua New Guinea kina relative to the Australian dollar. Although the Group’s financial performance did not meet the performance targets set, the Group and each of the Markets achieved a significant improvement in safety performance compared with the prior year. The Group’s significant injury frequency rate per million hours worked (SIFR) declined from 17.5 to 10.2, substantially below the SIFR target set for the 2014 financial year, and similar SIFR reductions were achieved by each of the Markets. As Group NPAT and Market EBIT targets were not achieved, payments to key management personnel for the 2014 financial year under the STI plan reflect only the achievement of safety targets (which are not linked to Group financial performance) for the Group and each of the Markets. Awards for safety performance constitute up to 10% of each executive’s total short-term incentive opportunity. GOODMAN FIELDER ANNUAL REPORT 2014 47 GOODMAN FIELDER ANNUAL REPORT 2014 Directors’ Report (continued) 2014 Short-Term Incentives Short-term incentives paid or payable to executives who are key management personnel in respect of the 2014 financial year are set out below and in the table on page 52. As the award amounts do not exceed 50% of each executive’s total short-term incentive opportunity, payments will be made in cash, with no deferred share component. Details of the vesting profile of short-term cash incentives awarded to the senior executives of the Group are as follows: 2014 Short-Term Incentive % of total target opportunity(2) Included in remuneration(1) Executive Directors ($) % earned in year % forfeited in year 52,725 5% 95% P D Foyston 16,913 5% 95% P A Gibson 10,650 10% 90% P R Reidie 52,454 10% 90% A R Hipperson – –% –% S M Gannon – –% –% N A Kearney – –% –% C R Delaney Current KMP – Executives Former KMP – Executives(3) (1)A minimum level of performance must have been achieved before any STI is paid. Therefore, the minimum potential value of the STI which was granted in respect of the year was nil. The maximum value of the grants under the STI is the actual amount of STI paid, as set out above. (2)‘Stretch’ incentive opportunities, where applicable, are not included in the total target opportunity for the purposes of determination of percentages earned/forfeited in the year. (3)Messrs Hipperson, Gannon and Kearney ceased employment with the Group during the financial year and therefore were not entitled to incentives under the 2014 short-term incentive plan. No amounts vest in future financial years in respect of the short-term incentive scheme for the 2014 financial year. 2014 Long-Term Incentives No shares were awarded to executives under the F2012 Equity Incentive Plan offer as the Group did not achieve its ROCE and relative TSR performance targets at 30 June 2014, the end of the three-year performance period. FIVE YEAR PERFORMANCE SUMMARY The Group’s financial performance is affected by a number of significant external economic factors, including commodity and fuel prices and exchange rates, as well as factors which influence consumer spending, including interest and inflation rates. Over the past five-year period the Group has experienced challenging market conditions, characterised by commodity cost volatility, increased competition from private label products, and a general decline in consumer confidence and demand. The Group commenced a medium to longer-term transformation strategy in the 2012 financial year and has taken steps over the past two financial years to divest non-core businesses and brands, focus direct marketing and capital expenditure on key categories, improve the efficiency and reliability of its sites and build its innovation and product development pipeline. While considerable progress has been made towards achievement of a number of the Group’s strategic objectives, the Group’s 2014 financial results were significantly below the targets set and initiatives have been undertaken to address the financial and operational challenges which continue to face the Group. In determining the remuneration structure and at-risk remuneration of senior executives, the Board has remained mindful of the impact of external economic factors on business performance and of ensuring appropriate measures are in place to retain and incentivise the Group’s senior leadership team to deliver the Group’s transformation strategy. The Board is also focused on ensuring that a meaningful link is maintained between executive rewards and shareholder interests, through setting challenging performance targets for both financial performance and the achievement of key Group objectives, such as ongoing improvements in employee safety. STI payments during the past five-year period reflect the importance placed on alignment of incentive rewards with the creation of value for shareholders, with payments largely limited to the achievement of safety measures or individual performance objectives and payments to divisional executives who have achieved divisional financial performance targets. No shares have been awarded to executives under the Equity Incentive Plan to-date as EPS, ROCE and TSR targets have not been met. 48 GOODMAN FIELDER ANNUAL REPORT 2014 GOODMAN FIELDER ANNUAL REPORT 2014 Directors’ Report (continued) The table below summarises details of the Company’s earnings, dividends paid and changes in share price of the Company’s shares over the past five year period, as well as its performance in relation to other key measures relevant to the Company’s incentive plans. Reported NPAT and Reported EBIT for the financial year ended 30 June 2014 reflect the impact (on a pre-tax basis) of $358.2 million in non-cash impairment charges, $96.5 million in net losses relating to the sale of businesses and assets, a realised exchange loss of $0.1 million and $38.2 million in restructuring and redundancy costs. Financial Year Ended 30 June 2010 2011 2012 2013 2014 Reported NPAT ($m) 161.1 (166.7) (146.9) 102.5 (405.1) Reported EBIT ($m) 324.0 (13.4) (34.1) 213.3 (342.3) 26.2 19.8 21.1 17.5 10.2 10.75 7.75 Nil 3.0 2.0 Safety (SIFR) (per million hours worked) Dividends per share (incl. final dividend) (cents) Earnings per share (cents)(1) 10.9 (11.2) (8.3) 5.3(20.7) ROCE (%) (normalised)(2) 13.3%13.5%11.6%10.3% 9.7% Closing share price on ASX (A$ at 30 June) 1.345 STI Payment as % of Target Opportunity (%) 19% LTI Payment as % of Target Opportunity (%) 0 1.06 0.55 7% 9% 0 0 0.735 0.68 40% 16% 0 0 (1)In accordance with accounting standards, earnings per share calculations for 2010 and 2011 were adjusted retrospectively as a result of the Company’s $259 million capital raising completed in November 2011. (2)Normalised ROCE in respect of a financial year is calculated on the basis of normalised EBIT before significant items for that year, as disclosed in the notes to the graph on page 47. 6. SERVICE AGREEMENTS The Company or one of its subsidiaries has entered into employment arrangements with each of the Directors and senior executives. Each non-executive Director has been provided with a letter of appointment, while arrangements with senior executives are documented in the form of an engagement letter or contract of service. Whilst the employment arrangements set out the structure of remuneration for senior executives, they do not prescribe the manner in which remuneration may be modified, which is left to the discretion of the Board, the Committee and CEO, as appropriate. Except as specified below in relation to the contracts of Mr Delaney, Mr Foyston and Mr Kearney, employment arrangements with senior executives are rolling annual agreements that may be terminated on notice, for serious misconduct or upon their role becoming redundant. The Group must provide the CEO and his direct executive reports 12 months’ notice of termination or a maximum payment of 12 months’ FAR upon redundancy. The Group retains the right to make a payment in lieu of the relevant notice period. Upon the termination of their employment, executives are entitled to receive their statutory entitlements of accrued annual and long service leave, as well as any superannuation benefits. Senior executives have no entitlement to termination payments beyond leave entitlements and superannuation in the event of termination for misconduct. All senior executive contracts contain a clause which limits the maximum termination payment that may be made on cessation of employment if shareholder approval is required for the payment of a termination or retirement benefit and is not obtained. MANAGING DIRECTOR, ASIA PACIFIC Mr Foyston commenced employment as Managing Director of the Asia Pacific division on 3 September 2012 under a 2 year fixed-term contract which can be terminated on notice with payment of up to 12 months’ FAR in lieu of notice. As required by employment laws of the People’s Republic of China, Mr Foyston’s employment contract contains certain employee and employer termination rights on 30 days’ prior written notice in specified circumstances, such as inability to perform duties due to illness or non-work related injuries on completion of a designated treatment period, or the employer’s failure to pay remuneration or social insurance contributions on a timely basis. Otherwise, the key terms of Mr Foyston’s contract are the same as other executives. GOODMAN FIELDER ANNUAL REPORT 2014 49 GOODMAN FIELDER ANNUAL REPORT 2014 Directors’ Report (continued) INTERIM CHIEF FINANCIAL OFFICER In additional to his role as Chief Strategy and Corporate Development Officer, Mr Kearney also served as Interim Chief Financial Officer from 30 November 2013 to 31 March 2014, prior to the appointment of Mr Gibson as the Group’s new Chief Financial Officer. Mr Kearney was appointed under a five-month contract which concluded following Mr Gibson’s commencement with the Company. EXECUTIVE DIRECTOR AND EXECUTIVE EMPLOYMENT CONTRACTS The principal terms of the employment contracts of executives of the Group other than Mr Kearney who are or were key management personnel during the 2014 financial year are as follows: Key Contractual Terms CEO CFO and Managing Directors Term of Contract 4 years commencing 4 July 2011 Rolling annual agreement subject to termination on notice (other than Mr Foyston, who is employed on a 2 year fixed term contract commencing 3 September 2012) By Goodman Fielder, with notice(1) At any time, with 12 months’ notice in writing or payment of 12 months’ FAR in lieu of notice At any time, with 12 months’ notice in writing or payment of 12 months’ FAR in lieu of notice; if role is made redundant, period of notice (or payment in lieu) equivalent to 12 months’ FAR (with no other notice periods/provisions to apply) By Goodman Fielder, without notice For cause, including serious misconduct or material or persistent breach of terms of employment contract For serious misconduct or serious breach of employment contract On completion of term where contract is not renewed by Goodman Fielder Payment of 12 months’ FAR N/A By executive, on a change in control or other “Fundamental Change in Circumstances” Within 6 months after a Fundamental Change in Circumstances (circumstances under which Mr Delaney remains employed by the Group but ceases to hold the most senior management role or the scope of his responsibilities or authorities is materially diminished), Mr Delaney has the right to terminate his appointment on giving three months’ notice in writing. On the valid exercise of this right, Mr Delaney will be paid 12 months’ FAR in lieu of notice If the executive is offered employment on comparable terms by an acquiring company and does not accept the offer, period of notice (or payment in lieu) equivalent to 6 months’ FAR (with no other notice periods or notice provisions to apply) (for Messrs Reidie and Gibson) or 3 months’ FAR (for Messrs Foyston, Hipperson and Gannon) By executive(1) At any time with 6 months’ notice in writing At any time with 6 months’ notice (for Messrs Reidie and Gibson) or 3 months’ notice (for Messrs Foyston, Hipperson and Gannon) Termination 50 GOODMAN FIELDER ANNUAL REPORT 2014 GOODMAN FIELDER ANNUAL REPORT 2014 Directors’ Report (continued) Key Contractual Terms (continued) CEO CFO and Managing Directors Obligations and Entitlements on Completion of Employment Unvested Incentive Awards(2) Subject to shareholder approval and/or the Board’s discretion, as applicable: Subject to shareholder approval and/or the Board’s discretion, as applicable •a pro rata STI award may be paid subject to pro rata successful performance (as determined by the Board) against criteria set by the Board and specified in the STI plan •unvested rights which are subject to performance conditions will vest pro rata, subject to achievement of the Company’s performance targets •unvested performance rights which are subject solely to service conditions will not vest pro rata if Mr Delaney is no longer employed by the Group on the third anniversary after 4 July 2011, the date on which he commenced employment with the Group Restraint For a period of 12 months following termination of Mr Delaney’s appointment, he is restrained from: •involvement in any business similar to or in competition with the business of the Goodman Fielder Group; and •soliciting or enticing any director, employee or client of the Group to leave, discontinue their relationship with or reduce the amount of business with the Group or attempting to do so For all executives, for a period of up to 12 months following termination of employment, the executive is restrained from: •involvement in any business activities similar to or in competition with a business of the Goodman Fielder Group in which the executive has been involved in the last 12 months of employment; •interfering with the relationship between the Group and any of its clients, identified prospective clients and suppliers with which the executive has been involved in the last 12 months of employment; and •soliciting or encouraging any employees, contractors or agents of the Group with whom the executive has been involved in the last 12 months of employment to leave, or cease providing services (1)As set out on page 49, certain additional termination provisions in Mr Foyston’s contract are required by employment laws of the People’s Republic of China. (2)The grant of share-based incentives under Mr Delaney’s short-term and long-term incentive arrangements and his initial grant of 1,000,000 share performance rights was subject to shareholder approval at the Company’s 2011, 2012 and 2013 Annual General Meetings. Shareholder approval was also obtained for the payment of pro rata incentive awards and/or other benefits acquired under, or arising from, Mr Delaney’s contractual arrangements with the Group in connection with any future termination of his employment or office. GOODMAN FIELDER ANNUAL REPORT 2014 51 GOODMAN FIELDER ANNUAL REPORT 2014 Directors’ Report (continued) 7. REMUNERATION OF EXECUTIVES FOR THE FINANCIAL YEAR ENDED 30 JUNE 2014 TOTAL REMUNERATION FOR EXECUTIVE DIRECTOR AND SENIOR EXECUTIVES FOR THE FINANCIAL YEAR ENDED 30 JUNE 2014 SHORT-TERM BENEFITS Short-term Increase in cash annual leave A$ Year Salary and fees incentives(a)accrual(b) C R Delaney 2014 1,347,712 52,275– Managing Director and Chief Executive Officer 2013 1,309,497 635,888– P D Foyston(1) 2014563,750 16,913 17,999 Managing Director, Asia Pacific division 2013458,334 27,500 14,103 P A Gibson 2014 Chief Financial Officer 2013 P R Reidie 2014 (2) (3) 172,390135,650(2)13,275 N/AN/AN/A 826,077 52,454 45,476 Managing Director, Goodman Fielder Australia and New Zealand 2013702,223 329,667– Former KMP S M Gannon(4) 2014324,903–– Chief Financial Officer 2013 781,128 156,000– A R Hipperson(4) 2014428,472–– Managing Director, Goodman Fielder Australia 2013721,055 88,800– N A Kearney 2014270,728–– Interim Chief Financial Officer 2013 Total Remuneration for Executives 2014 2013 (4) N/AN/AN/A 3,934,032 257,292 3,972,2371,237,855 76,750 14,103 (1)Comparative information for Mr Foyston reflects his appointment as a member of the key management personnel of the Group during the 2013 financial year. Mr Foyston was appointed Managing Director, Asia Pacific division on 3 September 2012. (2)Comparative information has not been provided for Mr Gibson as he was not a member of the key management personnel of the Group for the year ended 30 June 2013. Mr Gibson was appointed Chief Financial Officer of the Group effective 1 April 2014. The equity-based sign-on incentive for Mr Gibson is disclosed in share-based payments. The amount reported as short-term cash incentives for Mr Gibson includes the cash sign-on incentive paid to him on commencement of his employment with the Group, as well as a portion of the sign-on incentive amount payable to him on the first anniversary of his employment, which has been expensed in the 2014 financial year in accordance with accounting standards. Details of Mr Gibson’s sign-on incentives are set out on pages 45 and 46. The amounts included as remuneration may not be indicative of the benefit (if any) Mr Gibson may ultimately receive on cessation of his employment with the Group. (3)Remuneration for Mr Reidie is payable in New Zealand dollars and, for the purposes of disclosure, all remuneration other than Mr Reidie’s short-term incentive has been converted to Australian dollars at the rate of A$1.00/NZ$1.1033 (2013: A$1.00/NZ$1.2413) (an average rate for the 2014 financial year). Mr Reidie’s short-term incentive has been converted to Australian dollars at an agreed rate of A$1.00/NZ$1.14. Current year remuneration information for Mr Reidie reflects his appointment as Managing Director, Goodman Fielder Australia and New Zealand effective 13 February 2014. (4)Messrs Gannon and Hipperson ceased employment with the Goodman Fielder Group on 29 November 2013 and 18 January 2014, respectively, and their entitlements to share-based incentives were forfeited on the date of cessation of employment. Accordingly, all amounts recognised in prior years in respect of entitlements which were forfeited in 2014 have been reversed in accordance with accounting standards. Mr Kearney, formerly the Group’s Chief Strategy and Corporate Development Officer, also held the role of Interim Chief Financial Officer between 30 November 2013 and 31 March 2014 (from the date immediately following Mr Gannon’s resignation to the date Mr Gibson joined the Goodman Fielder Group). The above table discloses Mr Kearney’s remuneration only for the period during which he served as Interim Chief Financial Officer of the Group. 52 GOODMAN FIELDER ANNUAL REPORT 2014 GOODMAN FIELDER ANNUAL REPORT 2014 Directors’ Report (continued) POST EMPLOYMENT Non-monetary – Proportion of allowances, Other post- Increase in remuneration Expatriate relocation costs employment long service Termination Share-based performance allowances(c) and other(c) Superannuation benefits leave accrual(b)benefits payment(d)Total(e) related (%)(f) 295,263 71,527 – – 2,661– 310,172 2,079,610 19.9% 221,447 130,257 – – 2,318– 452,973 2,752,380 36.4% 30,851– – – 378– 78,244 708,135 13.4% 150,330– – – 71– 49,000 699,338 10.9% – 666 4,444 – 7 – 24,227350,659 5.1% N/AN/A N/A N/AN/AN/AN/AN/AN/A – 7,023 48,497 – 2,922 – 76,0271,058,476 12.1% – 7,566 21,399 – 691– 42,619 1,104,165 34.1% – 1,024 16,503 ––– (158,312) 184,118 –% – 2,402 16,470 – 1,121– 114,647 1,071,768 21.1% – 1,460 14,569 –– 269,140 (51,531) 662,110 –% – 10,060 16,470 – 29,265– 43,732 909,382 15.1% – 10,590 6,060 –––– 287,378 –% N/AN/A N/A N/AN/AN/AN/AN/AN/A 326,114 92,290 371,777 150,285 90,073 – 54,339 – 5,968 33,466 269,140 278,827 5,330,486 – 702,9716,537,033 12.1% 27.8% (a)Represents cash incentives paid or payable in respect of performance or in recognition of an executive’s contribution towards the achievement of strategic objectives in a financial year. (b)Represents the increase in annual leave and long service leave entitlements accrued during the financial year. (c)Expatriate allowances represent payments made by the Group in respect of living expenses for Mr Delaney and Mr Foyston (refer to page 46). Other benefits represent remuneration received in non-monetary form, including car park allowances, taxation advice, car leases and other fringe benefits. (d)No options over unissued shares in the Company were granted to any executive of the Goodman Fielder Group as part of their remuneration during the financial year and there are no unvested options held by any executive. In accordance with the requirements of the Accounting Standards, executive remuneration includes a proportion of the notional value of equity compensation granted during the year. The notional value of equity instruments which do not vest during the reporting period is determined as at the grant date and is progressively allocated over the vesting period. The amount included as remuneration is not related to or indicative of the benefit (if any) that individual executives may ultimately realise should the equity-based payments vest. The notional value of executives’ entitlements to shares under the Equity Incentive Plan (formerly the Performance Share Plan) was determined in accordance with AASB 2 Share-Based Payment. Details of the amounts recognised in 2014 for executives under the F2012, F2013 and F2014 offers are set out on pages 43 and 44. (e)Amounts disclosed as remuneration of executives exclude insurance premiums paid by the Group in respect of Directors’ and officers’ liability insurance contracts which cover current and former Directors, Secretaries and senior managers of Goodman Fielder Limited and its subsidiaries and also exclude medical insurance premiums paid by the Group in respect of expatriate employees and their families and employees and their families who have temporarily relocated to Australia from New Zealand or other jurisdictions for work purposes. These premium amounts have not been allocated to the individuals covered by the insurance policies as, based upon all available information, the Directors believe that no reasonable basis for such allocation exists. (f)In respect of the percentages determined for the 2014 financial year, all share-based payment amounts that represent a net reversal of expense or relate to incentives subject to service conditions only have been excluded from the calculation of the proportion of remuneration that is performance related. GOODMAN FIELDER ANNUAL REPORT 2014 53 GOODMAN FIELDER ANNUAL REPORT 2014 Directors’ Report (continued) 8. KEY MANAGEMENT PERSONNEL DISCLOSURES (A) EQUITY INSTRUMENT DISCLOSURES RELATING TO KEY MANAGEMENT PERSONNEL (i) Entitlements under Equity Incentive Plan and sign-on incentives Details of entitlements to shares in Goodman Fielder Limited granted under offers made under the Equity Incentive Plan or as sign-on incentives are set out below. 2014 Executive Entitlements to ordinary shares(1) Year Balance at the start of the year Entitlements granted during the year Vested during the year Other changes during the year Balance at the end of the year 1,953,320 – – 1,953,320 Vested at the end of the year(2)Unvested Current KMP – Executive Directors C R Delaney 2014 – – 1,953,320 2013 2,505,455––– 2,505,455– 2,505,455 2012 2,250,000(3) – – (1,250,000) 1,000,000(3) –1,000,000(3) Current KMP – Executives P A Gibson(4)2014 – P R Reidie – 2014 –(4)– – –(4)– – 448,060 – – 448,060 – 448,060 2013 527,942––– 527,942– 527,942 2012 135,502–– (135,502)––– Former KMP – Executives S M Gannon(5) 2013 727,273–– (727,273)––– 2012 677,358–– (677,358)––– A R Hipperson(6) 2014 – 419,450– (419,450)––– 2013 538,182–– (538,182)––– 2012 125,708–– (125,708)––– (1)Represents the number of ordinary shares to which executives will be entitled at target performance. (2)At the end of the 2014 financial year, there were no rights vested and exercisable or vested and unexercisable. (3)Included in the entitlements of Mr Delaney are 1,000,000 rights relating to his sign-on incentive (refer to page 45). On 4 July 2014, 500,000 of these rights vested and Mr Delaney was allocated ordinary shares in the Company and 500,000 rights lapsed. (4) Mr Gibson was appointed Chief Financial Officer effective 1 April 2014. The offer of entitlements to Mr Gibson under the EIP and under his sign-on arrangement in accordance with his employment contract had not been formally made before the end of the last trading window of the 2014 financial year. The Company intends to offer Mr Gibson rights to 369,894 shares under the EIP and a sign-on incentive of rights to 300,000 shares during the Company’s next trading window, which will commence on 14 August 2014. (5) Mr Gannon ceased employment with the Group effective 29 November 2013 and his entitlements to ordinary shares were forfeited at that time. (6) Mr Hipperson passed away in a motorcycle accident on 18 January 2014. His entitlements to ordinary shares were forfeited in accordance with the EIP Rules at that time. 54 GOODMAN FIELDER ANNUAL REPORT 2014 GOODMAN FIELDER ANNUAL REPORT 2014 Directors’ Report (continued) (ii) Shareholdings Details of shares in Goodman Fielder Limited held by key management personnel are set out below. Other Balance at the Net changes 2014 Shareholdings start of the year acquisitions(5) during the year Balance at Shares held the end nominally at the of the year end of the year Current KMP – Non-executive Directors S Gregg 20,100–– 20,100 20,100 I G Cornell –10,000 (1) –10,00010,000 J A Dawson 10,000 – – 10,000 10,000 C J Froggatt 24,554 – – 24,554 24,554 P R Hearl 199,396 20,604 – 220,000 – C A Hooke 284,751 – – 284,751 – I D Johnston 193,044 – – 193,044 193,044 Current KMP – Executive Director C R Delaney(2) 200,100–– 200,100– Current KMP – Executives P D Foyston ––––– P A Gibson(3) ––––– P R Reidie 4,321 – – 4,321 – Former KMP S M Gannon(4) A R Hipperson (4) ––––– 28,889 N A Kearney(4) –(28,889) – – ––––– (1)Mr Cornell was appointed a Director of the Company effective 15 February 2014. (2)On 4 July 2014, in accordance with the terms of his contract of employment, 500,000 rights granted to Mr Delaney on commencement of his employment vested and he was allocated 500,000 shares in the Company. The shares to satisfy Mr Delaney’s entitlement were purchased on-market. A further 500,000 rights lapsed on 4 July 2014 as the applicable performance condition was not achieved. (3) Mr Gibson was appointed Chief Financial Officer effective 1 April 2014. (4) Messrs Hipperson and Gannon ceased employment with the Group effective 18 January 2014 and 29 November 2013, respectively. Mr Kearney served as Interim Chief Financial Officer between 30 November 2013 and 31 March 2014 and ceased to be a member of the Group’s Key Management Personnel effective 1 April 2014. (5) All acquisitions of shares by key management personnel during the year were made by on-market purchases. No shares were granted as compensation or received during the year on the exercise of an option or right. (B) LOANS TO KEY MANAGEMENT PERSONNEL AND THEIR RELATED PARTIES There were no loans made, guaranteed or secured by the Company or any of its subsidiaries during the financial year in relation to to key management personnel or close members of their families or entities over which they have control, joint control or significant influence (“related parties”) and there were no such loans outstanding at the beginning or the end of the financial year. (C) OTHER TRANSACTIONS WITH KEY MANAGEMENT PERSONNEL AND THEIR RELATED PARTIES All other transactions with key management personnel (including their related parties) were conducted in the ordinary course of business on normal terms and conditions for customers, employees or suppliers. Transactions for the supply of goods and services to the Group by Director-related entities (primarily banking and related financial services, insurance, engineering consulting services and travel services) occurred on normal commercial terms under supply arrangements negotiated at arm’s-length. From time to time, key management personnel may purchase goods from the Group. These transactions occur on the same terms and conditions as those entered into by other Group employees or customers and are trivial or domestic in nature. GOODMAN FIELDER ANNUAL REPORT 2014 55 GOODMAN FIELDER ANNUAL REPORT 2014 Directors’ Report (continued) NON-AUDIT SERVICES During the period ended 30 June 2014, KPMG, the Company’s auditor, performed certain other services in addition to their statutory duties. Details of the amounts paid to KPMG and its related practices for audit and non-audit services provided during the year are set out in note 33 to the consolidated financial statements. The Board has considered the non-audit services provided during the year by the auditor and, in accordance with written advice provided by resolution of the Audit Committee, is satisfied that the provision of those non-audit services during the year by the auditor: (a)is compatible with the general standard of independence for auditors imposed by the Corporations Act 2001; and (b)did not compromise the auditor independence requirements of the Corporations Act 2001 for the following reasons: •all non-audit services were subject to the corporate governance procedures adopted by the Company and have been reviewed by the Audit Committee to ensure they did not impact the integrity and objectivity of the auditor; and •the non-audit services provided by KPMG do not undermine the general principles relating to auditor independence as set out in APES 110 Code of Ethics for Professional Accountants as they did not involve self-review, assuming a management responsibility, acting in an advocacy role for the Company or creating a self-interest or intimidation threat; and •the non-audit services provided by KPMG were for taxation, review or advisory work and none of this work created any conflicts with the auditor’s statutory responsibilities. A copy of the auditor’s independence declaration as required under Section 307C of the Corporations Act 2001 is set out on page 57 and forms part of this Report. ROUNDING OF AMOUNTS Goodman Fielder Limited is a company of the kind referred to in ASIC Class Order CO 98/100 (as amended) and in accordance with that Class Order amounts in the financial report and in this Directors’ Report have been rounded to the nearest tenth of a million dollars, unless otherwise shown. This report has been made in accordance with a resolution of the Directors of the Company. Chris Delaney Managing Director and Chief Executive Officer Steven Gregg Chairman 13 August 2014 56 GOODMAN FIELDER ANNUAL REPORT 2014 GOODMAN FIELDER ANNUAL REPORT 2014 Lead Auditor’s Independence Declaration Lead Auditor’s Independence Declaration under Section 307C of the Corporations Act 2001 To: the directors of Goodman Fielder Limited I declare that, to the best of my knowledge and belief, in relation to the audit for the financial year ended 30 June 2014 there have been: (i) no contraventions of the auditor independence requirements as set out in the Corporations Act 2001 in relation to the audit; and (ii) no contraventions of any applicable code of professional conduct in relation to the audit. KPMG Kevin Leighton Partner Sydney 13 August 2014 KPMG, an Australian partnership and a member firm of the KPMG network of independent member firms affiliated with KPMG International Cooperative (“KPMG International”), a Swiss entity. Liability limited by a scheme approved under Professional Standards Legislation. GOODMAN FIELDER ANNUAL REPORT 2014 57 GOODMAN FIELDER ANNUAL REPORT 2014 Consolidated Income Statement FOR THE YEAR ENDED 30 JUNE 2014 20142013 Notes $m$m Continuing operations Revenue 2,199.92,127.6 5 11.434.0 Cost of sales of goods (1,427.5)(1,342.3) Warehousing and distribution expenses (328.6)(314.1) Selling and marketing expenses (193.8)(174.2) Other income General and administration expenses (148.2)(140.3) (i) Other(ii) (455.5)– Expenses, excluding finance costs (2,553.6)(1,970.9) Net finance costs 6 (56.8)(67.2) (Loss)/profit before income tax from continuing operations (399.1) 123.5 Income tax benefit/(expense) 7 1.1(32.7) (Loss)/profit for the year from continuing operations (398.0)90.8 Profit from discontinued operations, net of income tax 8(b) –19.0 (Loss)/profit for the year (398.0) 109.8 (Loss)/profit is attributable to: Owners of Goodman Fielder Limited (405.1)102.5 Non-controlling interests 7.17.3 (Loss)/profit for the year (398.0)109.8 CentsCents Earnings per share for (loss)/profit attributable to the owners of Goodman Fielder Limited from continuing operations: Basic earnings per share 43 (20.7)4.3 Diluted earnings per share 43 (20.7)4.2 Basic earnings per share 43 (20.7)5.3 Diluted earnings per share 43 (20.7)5.2 Earnings per share for (loss)/profit attributable to the owners of Goodman Fielder Limited from continuing and discontinued operations: (i)Included in General and administration expenses is $38.2m relating to restructuring expenses (2013: $17.4m). (ii)Included in the current year is $97.3m relating to the loss on sale of businesses and $358.2m relating to the goodwill and brand impairments to the Baking Australia and New Zealand and Grocery New Zealand CGUs. The above consolidated income statement should be read in conjunction with the accompanying notes. 58 GOODMAN FIELDER ANNUAL REPORT 2014 GOODMAN FIELDER ANNUAL REPORT 2014 Consolidated Statement of Profit or Loss and other Comprehensive Income FOR THE YEAR ENDED 30 JUNE 2014 20142013 Notes $m$m (Loss)/profit for the year (398.0)109.8 Other comprehensive income, net of tax Items that are or may be reclassified to profit or loss Foreign exchange translation differences 29(a) 70.0 68.8 Effective portion of changes in the fair value of cash flow hedges 29(a) (2.1)5.0 Exchange differences on non-controlling interest (0.8)0.3 Other comprehensive income for the year, net of tax 67.1 74.1 Total comprehensive income for the year (330.9) 183.9 Attributable to: Owners of Goodman Fielder Limited (337.2)176.3 Non-controlling interests 6.37.6 Total comprehensive income for the year (330.9)183.9 The above consolidated statement of profit or loss and other comprehensive income should be read in conjunction with the accompanying notes. GOODMAN FIELDER ANNUAL REPORT 2014 59 GOODMAN FIELDER ANNUAL REPORT 2014 Consolidated Statement of Financial Position AS AT 30 JUNE 2014 20142013 Notes $m$m Assets Current assets Cash and cash equivalents 9 194.4403.1 Trade and other receivables 10 156.3162.9 Inventories11 122.9128.9 12 –0.1 Current tax receivables 4.09.1 Derivative financial instruments Other current assets Assets classified as held for sale 13 13.314.6 8(b) 1.71.7 Total current assets 492.6720.4 Non-current assets Receivables14 –0.8 Investments in joint ventures 15 11.25.5 Property, plant and equipment 16 471.2511.5 Deferred tax assets 17 65.647.1 Intangible assets 18 1,171.31,490.5 Other non-current assets 19 1.31.0 1,720.62,056.4 Total non-current assets Total assets 2,213.22,776.8 Liabilities Current liabilities Trade and other payables 21 265.1235.7 Borrowings22 1.052.8 12 13.917.0 Current tax liabilities 3.716.4 Derivative financial instruments Provisions24 52.660.9 Total current liabilities 336.3382.8 Non-current liabilities Borrowings25 641.7760.8 Deferred tax liabilities 26 28.728.2 Provisions27 20.620.5 Derivative financial instruments 12 44.932.2 Total non-current liabilities 735.9841.7 Total liabilities 1,072.21,224.5 Net assets 1,141.01,552.3 Equity Contributed equity 28 2,065.02,065.0 Reserves29(a) (108.4)(177.6) 29(c) (823.8)(339.2) Capital and reserves attributable to owners of Goodman Fielder Limited 1,132.81,548.2 Non-controlling interests 8.24.1 Total equity 1,141.01,552.3 Accumulated losses The above consolidated statement of financial position should be read in conjunction with the accompanying notes. 60 GOODMAN FIELDER ANNUAL REPORT 2014 GOODMAN FIELDER ANNUAL REPORT 2014 Consolidated Statement of Changes in Equity FOR THE YEAR ENDED 30 JUNE 2014 Attributable to owners of Goodman Fielder Limited Share- Foreign Accum- NonContributed Hedging based currency ulated controlling Total equity reserve paymentstranslation losses Total interests equity Notes$m$m$m$m$m$m$m$m Balance at 1 July 20122,063.7 (22.7) 0.6 (230.8) (441.7)1,369.1 6.0 1,375.1 Profit for the year–––– 102.5 102.5 7.3 109.8 Other comprehensive income for the year – 5.0 – 68.8 – 73.8 Total comprehensive income for the year – 5.0 – 68.8102.5176.3 0.3 74.1 7.6183.9 Transactions with owners in their capacity as owners: Revision of estimated tax effect of transaction costs from capital raising 28 1.3–––– 1.3– 1.3 Share based payment transactions 29–– 1.5–– 1.5– 1.5 Dividends provided for or paid 30–––––– (9.5) (9.5) 1.3– 1.5–– 2.8 (9.5) (6.7) Balance at 30 June 2013 2,065.0 (17.7) 2.1 (162.0) (339.2)1,548.2 4.1 1,552.3 Balance at 1 July 2013 2,065.0 (17.7) 2.1 (162.0) (339.2)1,548.2 4.1 1,552.3 Profit/(loss) for the year–––– (405.1) (405.1) 7.1 (398.0) Other comprehensive income for the year – (2.1) – 70.0 Total comprehensive income for the year – (2.1) – 70.0 (405.1)(337.2) – 67.9 (0.8) 67.1 6.3 (330.9) Transactions with owners in their capacity as owners: Share based payment transactions 29–– 1.3–– 1.3– 1.3 Dividends paid 30–––– (79.5) (79.5) (2.2) (81.7) –– 1.3– (79.5) (78.2) (2.2) (80.4) Balance at 30 June 2014 2,065.0 (19.8) 3.4 (92.0) (823.8)1,132.8 8.2 1,141.0 The above consolidated statement of changes in equity should be read in conjunction with the accompanying notes. GOODMAN FIELDER ANNUAL REPORT 2014 61 GOODMAN FIELDER ANNUAL REPORT 2014 Consolidated Statement of Cash Flows FOR THE YEAR ENDED 30 JUNE 2014 20142013 Notes $m$m Cash flows from operating activities Receipts from customers 2,381.12,413.6 Payments to suppliers and employees (2,181.2)(2,151.2) Interest received 5.49.8 Interest paid (62.2)(79.0) Income taxes paid (24.8)(14.5) Net cash inflow from operating activities40 118.3178.7 Cash flows from investing activities Payments for property, plant, equipment and intangibles (75.6)(78.6) Proceeds from sale of property, plant and equipment 0.89.1 Proceeds from sale of business 18.4192.1 Insurance proceeds 5 –26.3 Net cash (outflow)/inflow from investing activities (56.4)148.9 Cash flows from financing activities 25 –138.0 Repayment of borrowings (193.5)(219.4) Finance lease payments (0.8)(1.2) Proceeds from borrowings 30 (79.5)– Dividends paid to outside equity interests (2.2)(9.5) Dividends paid to Company’s shareholders Net cash (outflow) from financing activities (276.0)(92.1) Net (decrease)/increase in cash and cash equivalents (214.1)235.5 Cash and cash equivalents at the beginning of the financial year 403.1161.7 Effects of exchange rate changes on cash and cash equivalents 5.45.9 Cash and cash equivalents at end of year9 194.4403.1 The above consolidated statement of cash flows should be read in conjunction with the accompanying notes. 62 GOODMAN FIELDER ANNUAL REPORT 2014 GOODMAN FIELDER ANNUAL REPORT 2014 Notes to the Consolidated Financial Statements FOR THE YEAR ENDED 30 JUNE 2014 1Summary of significant accounting policies Goodman Fielder Limited is a company domiciled in Australia. The principal accounting policies adopted in the preparation of the financial report are set out below. These policies have been consistently applied to all the years presented, unless otherwise stated. This financial report includes consolidated financial statements for the Group consisting of Goodman Fielder Consumer Foods Pty Limited, as the accounting parent, and its deemed subsidiaries (together referred to as the Group). The Group is a for profit entity. The consolidated financial statements were authorised for issue by the Directors on 13 August 2014. (A) BASIS OF PREPARATION (I) STATEMENT OF COMPLIANCE WITH IFRS The consolidated financial statements are general purpose financial statements that have been prepared in accordance with Australian Accounting Standards (including Australian Interpretations) adopted by the Australian Accounting Standards Board (AASB) and the Corporations Act 2001. The consolidated financial statements of the Group also comply with the International Financial Reporting Standards (IFRS) adopted by the International Accounting Standards Board. (II) BASIS OF MEASUREMENT The financial statements have been prepared on the historical cost basis except for the following material items in the statement of financial position: •derivative financial instruments are measured at fair value. The methods used to measure fair value are discussed further in note 1(f). (III) NEW AND AMENDED STANDARDS ADOPTED BY THE GROUP The following new standards and amendments to standards, including any consequential amendments to other standards, with a date of initial application of 1 July 2013, have been adopted by the Group. AASB 10 Consolidated Financial Statements (2011) As a result of AASB 10 (2011), the Group has changed its accounting policy for determining whether it has control over and consequently whether it consolidates its investees. AASB 10 (2011) introduces a new control model that is applicable to all investees, by focusing on whether the Group has power over an investee, exposure or rights to variable returns from its involvement with the investee and ability to use its power to affect those returns. In particular, AASB 10 (2011) requires the Group consolidate investees that it controls on the basis of de facto circumstances. In accordance with the transitional provisions of AASB 10 (2011), the Group reassessed the control conclusion for its investees at 1 July 2013 and there has been no impact on the control conclusion. AASB 11 Joint Arrangements As a result of AASB 11, the Group has changed its accounting policy for its interests in joint arrangements. Under AASB 11, the Group classifies its interests in joint arrangements as either joint operations or joint ventures depending on the Group’s rights to the assets and obligations for the liabilities of the arrangements. When making this assessment, the Group considers the structure of the arrangements, the legal form of any separate vehicles, the contractual terms of the arrangements and other facts and circumstances. Previously, the structure of the arrangement was the sole focus of classification. The Group has re-evaluated its involvement in its only joint arrangement and has reclassified the investment from jointly controlled entity to joint venture. Notwithstanding the reclassification, the investment continues to be accounted for using the equity method; accordingly, there has been no impact on the recognised assets, liabilities and comprehensive income of the Group. AASB 13 Fair Value Measurement AASB 13 establishes a single framework for measuring fair value and making disclosures about fair value measurements, when such measurements are required or permitted by other AASBs. In particular, it unifies the definition of fair value as the price at which an orderly transaction to sell an asset or to transfer a liability would take place between market participants at the measurement date. It also replaces and expands the disclosure requirements about fair value measurements in other AASBs, including AASB 7 Financial Instruments. In accordance with the transitional provisions of AASB 13, the Group has applied the new fair value measurement guidance prospectively, and has not provided any comparative information for new disclosures. Notwithstanding the above, the incorporation of credit into derivative valuations at 30 June 2014 had an impact of decreasing the derivative liability by $3.6m ($1.8m to current year income statement, with the balance to reserves). (IV) OFFSETTING OF FINANCIAL ASSETS AND FINANCIAL LIABILITIES As a result of the amendments of AASB 7, the Group has expanded its disclosures about the offsetting of financial assets and financial liabilities (see note 2(f)). (V) ACCOUNTING JUDGEMENTS, ESTIMATES AND ASSUMPTIONS The preparation of financial statements in conformity with Australian Accounting Standards (AASBs) requires the use of certain accounting estimates. It also requires management to exercise its judgement in the process of applying the Group’s accounting policies. The areas involving a higher degree of judgement or complexity, or areas where assumptions and estimates are significant to the financial statements are disclosed in note 3. GOODMAN FIELDER ANNUAL REPORT 2014 63 GOODMAN FIELDER ANNUAL REPORT 2014 Notes to the Consolidated Financial Statements (continued) 1Summary of significant accounting policies (continued) (B) PRINCIPLES OF CONSOLIDATION (I) REVERSE ACQUISITION ACCOUNTING Under AASBs the formation of the Goodman Fielder Group has been accounted for as a business combination. Intercompany transactions, balances and unrealised gains on transactions between Group companies are eliminated. Unrealised losses are also eliminated unless the transaction provides evidence of the impairment of the asset transferred. Accounting policies of subsidiaries have been changed where necessary to ensure consistency with the policies adopted by the Group. In applying the requirements of AASB 3 Business Combinations to the Group, the following relationships were established: Non-controlling interests in the results and equity of subsidiaries are shown separately in the consolidated income statement, statement of comprehensive income, statement of changes in equity and balance sheet respectively. •Goodman Fielder Limited (GFL) is the legal parent entity of the Group; and (C) SEGMENT REPORTING •Goodman Fielder Consumer Foods Pty Limited (GFCF), which is neither the legal parent nor legal acquirer, is deemed to be the accounting parent of the Group. These relationships reflect the requirements of AASB 3 that in situations where a number of existing entities are combined with a new entity, an existing entity shall be deemed to be the acquirer, subject to consideration of factors such as relative fair values of the entities involved in the transaction. This is commonly referred to as a reverse acquisition. The impact on equity of treating the formation of the Group as a reverse acquisition is discussed in note 28. The financial information incorporates the assets and liabilities of all entities deemed to be acquired by GFCF, including GFL, and the consolidated results of those entities for the period from which those entities are accounted for as being acquired by GFCF. The assets and liabilities of the entities acquired by GFCF were recorded at fair value while the assets and liabilities of GFCF were maintained at their book value. The impact of all transactions between entities in the Group is eliminated in full. (II) JOINT VENTURE The Group’s only investment in a jointly controlled entity has been classified as a joint venture. The joint venture is accounted for using equity accounting principles and is carried at the lower of the equity accounted amount and recoverable amount. Details of the joint venture are set out in note 39. The Group’s share of the joint venture’s net profit or loss is recognised in the consolidated income statement from the date joint control commenced until the date joint control ceases. (III)SUBSIDIARIES Subsidiaries are entities controlled by the Group. The Group controls an entity when it is exposed to, or has rights to variable returns from its involvement with the entity and has the ability to affect those returns through its power over the entity. Subsidiaries are fully consolidated from the date on which control is transferred to the Group. They are de-consolidated from the date that control ceases. The acquisition method of accounting is used to account for business combinations by the Group (refer to note 1(h)). 64 GOODMAN FIELDER ANNUAL REPORT 2014 Segment assets include all assets used by a segment and consist primarily of cash, receivables, inventories, property, plant and equipment and goodwill and other intangible assets, net of related provisions. While most of these assets can be directly attributable to individual segments, the carrying amounts of certain assets used jointly by segments are allocated, where possible, based on reasonable estimates of usage. IT and development software and corporate cash are not allocated to segments. Segment liabilities consist primarily of trade and other creditors and employee provisions. External borrowings are not allocated to segments. Segment assets and liabilities do not include derivative instruments and income taxes. Segment result is earnings before interest and tax (EBIT) reported as: segment revenue less cost of goods sold, selling and marketing expenses, distribution expenses and general and administrative expenses (excluding corporate revenues and administrative expenses relating to the Group as a whole). Segment capital expenditure is the total cost incurred during the period to acquire property, plant and equipment, and intangible assets other than goodwill. Inter segment transfers Segment revenues, expenses and results include transfers between segments. Such transfers are priced on an ‘’arms length’’ basis or a “fully absorbed” cost basis and are eliminated on consolidation. (D) FOREIGN CURRENCY TRANSLATION (I) FUNCTIONAL AND PRESENTATION CURRENCY Items included in the financial statements of each of the Group’s entities are measured using the currency of the primary economic environment in which the entity operates (‘the functional currency’). The consolidated financial statements are presented in Australian dollars, which is Goodman Fielder Limited’s functional and presentation currency. (II) TRANSACTIONS AND BALANCES Transactions in foreign currencies are translated at the foreign exchange rate ruling at the date of the transaction. Monetary assets and liabilities denominated in foreign currencies at the balance sheet date are translated to the functional currency at the foreign exchange rate at that date. Non-monetary assets and liabilities that are measured in terms of historical cost in a foreign currency are translated using the exchange rate at the date of the transaction. Non-monetary assets and liabilities denominated in foreign currencies that are stated at fair value are translated to Australian dollars at foreign exchange rates at the dates the fair value was determined. GOODMAN FIELDER ANNUAL REPORT 2014 Notes to the Consolidated Financial Statements (continued) (III) FOREIGN OPERATIONS (II) CASH FLOW HEDGE The assets and liabilities of foreign operations, including goodwill and fair value adjustments arising on consolidation, are translated to Australian dollars at foreign exchange rates at the reporting date. The revenues and expenses of foreign operations are translated to Australian dollars at rates approximating the foreign exchange rates at the dates of the transactions. Foreign exchange differences arising on translation are recognised in other comprehensive income and presented in the foreign currency translation reserve in equity. On initial designation of the derivative as the hedging instrument, the Group formally documents the relationship between the hedging instrument and hedged item, including the risk management objectives and strategy in undertaking the hedge transaction and the hedged risk, together with the methods that will be used to assess the effectiveness of the hedging relationship. The Group makes an assessment, both at the inception of the hedge relationship as well as on an ongoing basis, whether the hedging instruments are expected to be “highly effective” in offsetting the changes in the fair value or cash flows of the respective hedged items attributable to hedged risk, and whether the actual results of each hedge are within a range of 80 to 125 per cent. For a cash flow hedge of a forecast transaction, the transaction should be highly probable to occur and should present an exposure to variations in cash flows that could ultimately affect reported profit or loss. When a foreign operation is disposed of such that control, significant influence or joint control is lost, the cumulative amount in the foreign currency translation reserve related to that foreign operation is reclassified to the income statement as part of the gain or loss on disposal. When the settlement of a monetary item receivable from or payable to a foreign operation is neither planned nor likely in the foreseeable future, foreign exchange gains and losses arising from such a monetary item are considered to form part of a net investment in a foreign operation and are recognised in other comprehensive income and are presented in the foreign currency translation reserve in equity. A repayment or partial repayment of a receivable classified as part of a net investment is not considered a disposal of the foreign operation. (E) DERIVATIVES AND HEDGING ACTIVITIES The Group uses derivative financial instruments to hedge its exposure to interest rate risks, foreign currency risks and commodity price risks arising from operational and financing activities. In accordance with its treasury policies, the Group does not hold or issue derivative financial instruments for trading purposes. However, derivatives that do not qualify for hedge accounting are accounted for as trading instruments and the associated gain or loss is recognised immediately in the income statement. Derivative financial instruments are recognised initially at fair value. Subsequent to initial recognition, all derivative financial instruments are stated at fair value on the balance sheet. The gain or loss on remeasurement to fair value is recognised immediately in the income statement. However, where derivatives qualify for hedge accounting, recognition of any resultant gain or loss depends on the nature of the item being hedged (refer to (i) and (ii) below). The fair values of various derivative financial instruments used for hedging purposes are disclosed in note 12. Movements in the hedging reserve in shareholders’ equity are shown in note 28. The full fair value of a hedging derivative is classified as a current asset or liability when the remaining maturity of the hedged item is less than 12 months; it is classified as a non-current asset or liability when the remaining maturity of the hedged item is more than 12 months. (I) HEDGE OF MONETARY ASSETS AND LIABILITIES When a derivative financial instrument is used to hedge the foreign exchange exposure of a recognised monetary asset or liability, hedge accounting is not applied and any gain or loss on the hedging instrument is recognised in the income statement. Where a derivative financial instrument is designated as a hedge of the variability in cash flows of a recognised asset or liability, or a highly probable forecast transaction, the effective part of any gain or loss on the derivative financial instrument is recognised directly in other comprehensive income and presented in the hedging reserve in equity. The associated cumulative gain or loss recognised in other comprehensive income is transferred to the carrying amount of the asset recognised when the hedged item is a non-financial asset. In other cases the amount recognised in equity is transferred to the income statement in the same period or periods during which the hedged forecast transaction affects profit or loss. To the extent that the hedge is ineffective, changes in fair value are recognised in the income statement. If the hedged transaction is no longer expected to take place, then the cumulative unrealised gain or loss recognised in the hedge reserve is recognised immediately in the income statement. (F) FAIR VALUE ESTIMATION The fair value of financial assets and financial liabilities must be estimated for recognition and measurement or for disclosure purposes. The fair values of financial instruments that are not traded in an active market are determined using valuation techniques. The Group uses a variety of methods and makes assumptions that are based on market conditions existing at each balance date. Other techniques, such as estimated discounted cash flows, are used to determine fair value for the remaining financial instruments. The fair value of interest rate swaps is calculated as the present value of the estimated future cash flows. The fair value of forward exchange contracts is determined using forward exchange market rates at the balance sheet date. Fair values reflect the credit risk of the financial instrument and include adjustments to take account of the credit risk of the Group and counterparty when appropriate. The carrying value less impairment provision of trade receivables is assumed to approximate its fair value due to its short term nature. The fair value of non-current financial liabilities for disclosure purposes is estimated by discounting the future contractual cash flows at the current market interest rate that is available to the Group for similar financial instruments. GOODMAN FIELDER ANNUAL REPORT 2014 65 GOODMAN FIELDER ANNUAL REPORT 2014 Notes to the Consolidated Financial Statements (continued) 1Summary of significant accounting policies (continued) (G) PROPERTY, PLANT AND EQUIPMENT Property, plant and equipment is stated at cost less accumulated depreciation and any accumulated impairment losses. Leasehold improvements are measured at cost plus any remediation costs. Cost includes expenditure that is directly attributable to the acquisition of the asset. The cost of self constructed assets includes the cost of materials and direct labour, any other costs directly attributable to bringing the assets to a working condition for their intended use, the costs of dismantling and removing the items and restoring the site on which they are located and capitalised borrowings costs. Cost may also include transfers from equity of any gain or loss on qualifying cash flow hedges of foreign currency purchases of property, plant and equipment. Purchased software that is integral to the functionality of the related equipment is capitalised as part of that equipment. Land is not depreciated. Depreciation on other assets is charged to the income statement on a straight line basis, over the estimated useful lives of each part of an item of property, plant and equipment. The estimated useful lives in the current and comparative periods are as follows: Straight-line Diminishing value – Freehold Buildings 2% – 5% 4% – 6% – Leasehold propertiesThe shorter of the lease term or the life of the asset – Plant and equipment 4% – 60% 4% – 50% – Leased plant and equipmentThe shorter of the lease term or the life of the asset The assets’ residual values and useful lives are reviewed, and adjusted if appropriate, at each reporting date. An asset’s carrying amount is written down immediately to its recoverable amount if the asset’s carrying amount is greater than its estimated recoverable amount (note 1(j)). Gains and losses on disposals are determined by comparing proceeds with the carrying amount. These are included in the income statement. (H) BUSINESS COMBINATIONS Business combinations are accounted for using the acquisition method as at the acquisition date, which is the date on which control is transferred to the Group. Control is the power to govern the financial and operating policies of an entity so as to obtain benefits from its activities. In assessing control, the Group takes into consideration potential voting rights that currently are exercisable. ACQUISITIONS ON OR AFTER 1 JULY 2009 For acquisitions on or after 1 July 2009, the Group measures goodwill at the acquisition date as: •the fair value of the consideration transferred; plus •the recognised amount of any non-controlling interests in the acquiree; plus if the business combination is achieved in stages, the fair value of the existing equity interest in the acquiree; less •the net recognised amount (generally fair value) of the identifiable assets acquired and liabilities assumed. When the excess is negative, a bargain purchase gain is recognised immediately in profit or loss. The consideration transferred does not include amounts related to the settlement of pre-existing relationships. Such amounts are generally recognised in profit or loss. Costs related to the acquisition, other than those associated with the issue of debt or equity securities, that the Group incurs in connection with a business combination are expensed as incurred. Any contingent consideration payable is recognised at fair value at the acquisition date. If the contingent consideration is classified as equity, it is not remeasured and settlement is accounted for within equity. Otherwise, subsequent changes to the fair value of the contingent consideration are recognised in profit or loss. When share based payment awards (replacement awards) are required to be exchanged for awards held by the acquiree’s employee (acquiree’s awards) and relate to past services, then all or a portion of the amount of the acquirer’s replacement awards is included in measuring the consideration transferred in the business combination. This determination is based on the market based value of the replacement awards compared with the market based value of the acquiree’s awards and the extent to which the replacement awards relate to past and/or future service. ACQUISITIONS BETWEEN 1 JULY 2004 AND 1 JULY 2009 For acquisitions between 1 July 2004 and 1 July 2009, goodwill represents the excess of the cost of the acquisition over the Group’s interest in the recognised amount (generally fair value) of the identifiable assets, liabilities and contingent liabilities of the acquiree. When the excess was negative, a bargain purchase gain was recognised immediately in profit or loss. Transaction costs, other than those associated with the issue of debt or equity securities, that the Group incurred in connection with business combinations were capitalised as part of the cost of the acquisition. (I) INTANGIBLE ASSETS (I)GOODWILL Goodwill represents the difference between the cost of the acquisition and the fair value of the net identifiable assets acquired. In respect of acquisitions that took place in the period, goodwill is provisionally determined based on the preliminary fair value of net identifiable assets acquired. Goodwill recognised on acquisition is subject to change until the allocation of the purchase price to the fair value of net identifiable assets is finalised, not more than 12 months from the date of acquisition. Where the excess is negative, the gain is recognised immediately in the income statement. Goodwill is stated at cost less any accumulated impairment losses. Goodwill is allocated to cash generating units and is not amortised but is tested annually for impairment (see note 1(j)). 66 GOODMAN FIELDER ANNUAL REPORT 2014 GOODMAN FIELDER ANNUAL REPORT 2014 Notes to the Consolidated Financial Statements (continued) (II) BRAND NAMES AND LICENCES (I) CALCULATION OF RECOVERABLE AMOUNT Intangible assets are carried at cost less any accumulated amortisation and any impairment losses. Internally generated intangible assets are not capitalised and are expensed in the year in which the expenditure is incurred. The recoverable amount of the Group’s non-current receivables carried at amortised cost is calculated as the present value of estimated future cash flows, discounted at the original effective interest rate (i.e. the effective interest rate computed at initial recognition of these financial assets). Receivables with a short duration are not discounted. Brand names and licences with indefinite useful lives are tested for impairment annually either individually or at the cash generating unit level. Such intangibles are not amortised. The Group assesses the useful life of all intangible assets at each reporting date. Any changes in the useful lives are accounted for as a change in an accounting estimate and are thus accounted for on a prospective basis. Licences with finite lives are amortised over their lives on a straight line basis in accordance with the estimated timing of the benefits expected to be received from those assets. Amortisation of finite life brand names and licences is recognised within ‘general and administration expenses’ in the income statement. (III) IT DEVELOPMENT AND SOFTWARE Software is stated at cost less accumulated amortisation and impairment losses. Costs incurred in developing products or systems and costs incurred in acquiring software and licenses that will contribute to future period financial benefits through revenue generation and/or cost reduction are capitalised to software. Costs capitalised include external direct costs of materials and service, direct payroll and payroll related costs of employees’ time spent on the project. Amortisation is charged to the income statement on a straight line basis over the estimated useful life ranging from 4 to 6 years. IT development costs include only those costs directly attributable to the development phase and are only recognised following completion of technical feasibility and where the Group has an intention and ability to use the asset. (J) IMPAIRMENT OF ASSETS The carrying amounts of the Group’s assets, other than inventories and deferred tax assets, are reviewed at each reporting date to determine whether there is any indication of impairment. If any such indication exists, the asset’s recoverable amount is estimated (refer to (i) below). For goodwill and intangible assets with indefinite useful lives, the recoverable amount is estimated at each reporting date, or more frequently if events or changes in circumstances indicate that the carrying value may be impaired. An impairment loss is recognised whenever the carrying amount of an asset or its cash generating unit exceeds its recoverable amount. Impairment losses are recognised in the income statement. Impairment of receivables is not recognised until objective evidence is available that a loss event has occurred. Significant receivables are individually assessed for impairment. Impairment testing of significant receivables that are not assessed as impaired individually is performed by placing them into portfolios of significant receivables with similar risk profiles and undertaking a collective assessment of impairment. Non-significant receivables are not individually assessed. Instead, impairment testing is performed by placing non-significant receivables in portfolios of similar risk profiles, based on objective evidence from historical experience adjusted for any effects of conditions existing at each reporting date. The recoverable amount of other assets is the greater of their fair value less costs to sell and value in use. In assessing value in use, the estimated future cash flows are discounted to their present value using a pre tax discount rate that reflects current market assessments of the time value of money and the risks specific to the asset. For an asset that does not generate largely independent cash inflows, the recoverable amount is determined for the cash generating unit to which the asset belongs. A cash generating unit represents the smallest group of assets that generates cash inflows from continuing use that are largely independent of the cash inflows of other assets or group of assets. Subject to an operating segment ceiling test, for the purposes of goodwill impairment testing, CGUs to which goodwill has been allocated are aggregated so that the level at which impairment testing is performed reflects the lowest level at which goodwill is monitored for internal reporting purposes. Goodwill acquired in a business combination is allocated to groups of CGUs that are expected to benefit from the synergies of the combination. (II) REVERSALS OF IMPAIRMENT Impairment losses, other than in respect of goodwill, are reversed when there is an indication that the impairment loss may no longer exist and there has been a change in the estimate used to determine the recoverable amount. An impairment loss is reversed only to the extent that the asset’s carrying amount does not exceed the carrying amount that would have been determined, net of depreciation or amortisation, if no impairment loss had been recognised. An impairment loss in respect of goodwill is not reversed. Impairment losses recognised in respect of cash generating units are allocated first to reduce the carrying amount of any goodwill allocated to cash generating units (group of units) and then, to reduce the carrying amount of the other assets in the unit (group of units) on a pro rata basis. GOODMAN FIELDER ANNUAL REPORT 2014 67 GOODMAN FIELDER ANNUAL REPORT 2014 Notes to the Consolidated Financial Statements (continued) 1Summary of significant accounting policies (continued) (K) REVENUE RECOGNITION Revenue is recognised when it is probable that the economic benefits will flow to the Group and the revenue can be reliably measured and there is no continuing management involvement with the goods. The following specific recognition criteria must also be met before revenue is recognised: (I) SALE OF GOODS Revenue from sale of goods is measured at the fair value of the consideration received or receivable net of returns, discounts and allowances. Revenue is recognised when the significant risks and rewards of ownership of the goods have passed to the customer and can be measured reliably. Risks and rewards are considered to have passed to the buyer at the time of delivery of the goods to the customer. If it is probable that discounts will be granted and the amount can be measured reliably, then the discount is recognised as a reduction of revenue as the sales are recognised. (II) INTEREST INCOME Interest income is recognised as it accrues, using the effective interest method. This is a method of calculating the amortised cost of a financial asset and allocating the interest income over the relevant period using the effective interest rate, which is the rate that exactly discounts estimated future cash receipts through the expected life of the financial asset to the net carrying amount of the financial asset. (III) INSURANCE INCOME Insurance income is recognised as revenue when the right to receive payment is established. (L) INCOME TAX Income tax comprises current and deferred tax. Income tax is recognised in the income statement except to the extent that it relates to items recognised directly in equity, in which case it is recognised in equity. Current tax assets or liabilities are the expected tax receivable or payable on the taxable income for the period, using tax rates enacted or substantially enacted at the reporting date, and any adjustment to tax payable in respect of previous years. Deferred tax assets and liabilities are calculated using the balance sheet liability method, providing for temporary differences between the carrying amounts of assets and liabilities for financial reporting purposes and the amounts used for taxation purposes. The following temporary differences are not provided for: initial recognition of goodwill, the initial recognition of assets or liabilities that is not a business combination and that affects neither accounting nor taxable profit, nor differences relating to investments in subsidiaries and jointly controlled entities to the extent that they will probably not reverse in the foreseeable future. The amount of deferred tax assets and liabilities are based on the expected manner of realisation or settlement of the carrying amount of assets and liabilities, using tax rates enacted or substantively enacted at reporting date. A deferred tax asset is recognised only to the extent that it is probable that future taxable profits will be available against which the asset can be utilised. Deferred tax assets are reduced to the extent that it is no longer probable that the related tax benefit will be realised. Additional income taxes that arise from the distribution of dividends are recognised at the same time as the liability to pay the related dividend. 68 GOODMAN FIELDER ANNUAL REPORT 2014 Deferred tax liabilities and assets are not recognised for temporary differences between the carrying amount and tax bases of investments in foreign operations where the Company is able to control the timing of the reversal of the temporary differences and it is probable that the differences will not reverse in the foreseeable future. Deferred tax assets and liabilities are offset to the extent there is a legally enforceable right to offset current tax assets and liabilities and when the deferred tax balances relate to the same taxation authority. Current tax assets and tax liabilities are offset where the entity has a legally enforceable right to offset and intends either to settle on a net basis, or to realise the asset and settle the liability simultaneously. In determining the amount of current and deferred tax the Group takes into account the impact of uncertain tax positions and whether additional taxes and interest may be due. The Group believes that its accruals for tax liabilities are adequate for all open tax years based on its assessment of many factors, including interpretations of tax law and prior experience. This assessment relies on estimates and assumptions and may involve a series of judgements about future events. New information may become available that causes the Group to change its future judgement regarding the adequacy of existing liabilities; such changes to tax liabilities will impact tax expense in the period that such determinations are made. Goodman Fielder Limited and its wholly owned Australian resident subsidiaries formed a tax consolidated group with effect from 1 November 2005. As a consequence, all members of the tax consolidated group are taxed as a single entity. (M)NON-CURRENT ASSETS (OR DISPOSAL GROUPS) HELD FOR SALE AND DISCONTINUED OPERATIONS Non-current assets (or disposal groups) are classified as held for sale if their carrying amount will be recovered principally through a sale transaction rather than through continuing use. They are measured at the lower of their carrying amount and fair value less costs to sell, except for assets such as deferred tax assets, assets arising from employee benefits, financial assets and investment property that are carried at fair value and contractual rights under insurance contracts, which are specifically exempt from this requirement. An impairment loss is recognised for any initial or subsequent writedown of the asset (or disposal group) to fair value less costs to sell. A gain is recognised for any subsequent increases in fair value less costs to sell of an asset (or disposal group), but not in excess of any cumulative impairment loss previously recognised. A gain or loss not previously recognised by the date of the sale of the non-current asset (or disposal group) is recognised at the date of derecognition. Non-current assets (including those that are part of a disposal group) are not depreciated or amortised while they are classified as held for sale. Interest and other expenses attributable to the liabilities of a disposal Group classified as held for sale continue to be recognised. Non-current assets classified as held for sale and the assets of a disposal group classified as held for sale are presented separately from the other assets in the consolidated statement of financial position. The liabilities of a disposal group classified as held for sale are presented separately from other liabilities in the consolidated statement of financial position. A discontinued operation is a component of the entity that has been disposed of or is classified as held for sale and that represents a separate major line of business or geographical area of operations, is part of a single co-ordinated plan to dispose of such a line of business or area of operations, or is a subsidiary acquired exclusively with a view to resale. GOODMAN FIELDER ANNUAL REPORT 2014 Notes to the Consolidated Financial Statements (continued) (N)LEASES (Q)INVENTORIES Leases in terms of which the Group assumes substantially all the risks and rewards of ownership are classified as finance leases. Minimum lease payments made under finance leases are apportioned between the finance expense and the reduction of the outstanding liability. The finance expense is allocated to each period during the lease term so as to produce a constant period rate of interest on the remaining balance of the liability. Inventories are stated at the lower of cost and net realisable value. Cost is determined on the basis of first in first out, or average cost, whichever is the most appropriate for each individual business. The cost of manufactured inventory and work in progress includes applicable variable and fixed factory overhead costs, the latter being allocated on the basis of normal operating capacity. Net realisable value is selling price less costs to sell. Adequate provision is made for slow moving and obsolete inventory. Other leases are operating leases and are not recognised on the Group’s statement of financial position. (R)BORROWINGS Payments made under operating leases are recognised in the Group’s income statement on a straight line basis over the term of the lease. (O) CASH AND CASH EQUIVALENTS For statement of cash flows presentation purposes, cash and cash equivalents includes cash on hand, short term deposits with original maturities of three months or less that are readily convertible to known amounts of cash and which are subject to an insignificant risk of changes in value, and bank overdrafts. Bank overdrafts are shown within borrowings in current liabilities on the statement of financial position. (P) TRADE RECEIVABLES Trade receivables are recognised initially at fair value and subsequently measured at amortised cost less an allowance for uncollectible amounts. Other receivables from related or other parties are carried at amortised cost. Interest income, when charged, is recorded on an accrual basis. The carrying amount of the asset is adjusted for any impairment and the amount of the loss is recognised in the income statement within ‘general and administration expenses’. When a trade receivable is uncollectible, it is written off against the allowance account for doubtful debts. Subsequent recoveries of amounts previously written off are credited against ‘general and administration expenses’ in the income statement. Refer to note 1(j). The Group regularly enters into a receivables purchase agreement which enables it to securitise selected amounts of its receivables portfolio. The securitised receivable balance is derecognised in the statement of financial position, when it meets the following criteria: DERECOGNITION OF SECURITISED RECEIVABLES Securitised receivables are derecognised when: •the rights to receive cash flows from the receivable have expired; •the Group retains the right to receive cash flows from the receivable, but has assumed an obligation to pay them in full without material delay to a third party; or •the Group has transferred its rights to receive cash flows from the receivable and either (a) has transferred substantially all the risks and rewards of the receivable, or (b) has neither transferred nor retained substantially all the risks and rewards of the receivable, but has transferred control of the receivable. Interest bearing borrowings are recognised initially at fair value less attributable transaction costs. Subsequent to initial recognition, interest bearing borrowings are stated at amortised cost with any difference between cost and redemption value being recognised in the income statement over the period of the borrowings on an effective interest basis. Interest bearing borrowings are derecognised when the obligation under the liability is discharged or cancelled or expires. (S) FINANCE COST Net financing costs comprise interest payable on borrowings calculated using the effective interest method. Borrowing costs directly attributable to the acquisition, construction or production of qualifying assets, which are assets that necessarily take a substantial period of time to get ready for their intended use or sale, are added to the cost of those assets, until such a time as the assets are substantially ready for their intended use or sale. (T)PROVISIONS Provisions are recognised when the Group has a present obligation (legal or constructive) as a result of a past event and it is probable that an outflow of economic benefits will be required to settle the obligation. If the effect of the time value of money is material, provisions are determined by discounting the expected future cash flows at a pre tax rate that reflects current market assessments of the time value of money and, where appropriate, the risks specific to that liability. When discounting is used, the increase in the provision due to the passage of time is recognised as an interest expense. (I) WORKERS’ COMPENSATION Provisions have been made in respect of all employees in Victoria for all assessed workers’ compensation liabilities incurred and both reported and not reported, for the relevant periods of self insurance based on an independent actuarial assessment plus a prudential margin. The actuarial assessment is based on a number of assumptions including those related to the long term nature of certain claims, the frequency and value of claims and a discount rate that is based on Australian Commonwealth Government Bond yields. Workers’ compensation for all remaining employees is insured commercially in compliance with the relevant schemes. Receivables for insurance recoveries are recognised only when the recoveries are virtually certain of receipt. The receivables are presented gross in the statement of financial position and are not netted off against related payables or otherwise grouped to offset impairment losses of other current assets. The recoveries are recognised in the profit or loss under ‘other income’. GOODMAN FIELDER ANNUAL REPORT 2014 69 GOODMAN FIELDER ANNUAL REPORT 2014 Notes to the Consolidated Financial Statements (continued) 1Summary of significant accounting policies (continued) (T) PROVISIONS (CONTINUED) (II) BUSINESS CLOSURE AND RATIONALISATION A business closure and rationalisation provision is recognised when the Group has developed a detailed formal plan for the business closure and rationalisation and has raised a valid expectation in those affected that it will carry out the business closure and rationalisation by starting to implement the plan or announcing its main features to those affected by it. The measurement of a business closure and rationalisation provision includes only the direct expenditures arising from the business closure and rationalisation, which are those amounts that are both necessarily entailed by the business closure and rationalisation and not associated with the ongoing activities of the Group. (U) EMPLOYEE BENEFITS (I) WAGES AND SALARIES, ANNUAL LEAVE AND SICK LEAVE Liabilities for wages and salaries, including non-monetary benefits, annual leave and sick leave expected to be settled within 12 months of the reporting date represent present obligations in respect of employees’ services up to the reporting date. They are calculated at undiscounted amounts based on remuneration rates that the Group expects to pay as at the reporting date including related on costs. (II) LONG SERVICE LEAVE (V) SHARE-BASED PAYMENTS EQUITY SETTLED TRANSACTIONS The Group provides benefits to its employees (including key management personnel) in the form of share based payments, whereby employees render services in exchange for shares or rights over shares (equity settled transactions). The cost of these equity settled transactions with employees is measured by reference to the fair value of the equity instruments at the date at which they are granted. The cost of equity settled transactions is recognised, together with a corresponding increase in equity, over the period in which the performance and/or service conditions are fulfilled (the vesting period), ending on the date on which the relevant employees become fully entitled to the award (the vesting date). At each subsequent reporting date until vesting, the cumulative charge to the income statement is the product of: (i)the grant date fair value of the award; (ii)the current best estimate of the number of awards that will vest, taking into account such factors as the likelihood of employee turnover during the vesting period and the likelihood of non-market performance conditions being met; and (iii)the expired portion of the vesting period. The charge to the income statement for the period is the cumulative amount as calculated above less the amounts already charged in previous periods. There is a corresponding entry to equity. The liability for long service leave is recognised in the provision for employee benefits and measured as the present value of expected future payments to be made in respect of services provided by employees up to the reporting date. Consideration is given to expected future wage and salary levels including related on costs, experience of employee departures, and periods of service. Expected future payments are discounted using the yield at the reporting date on Government bonds, with currencies matching the obligation. Until an award has vested, any amounts recorded are contingent and will be adjusted if more or fewer awards vest than were originally anticipated to do so. (III) TERMINATION BENEFITS (X) EARNINGS PER SHARE Termination benefits are recognised as an expense when the Group is committed demonstrably, without realistic possibility of withdrawal, to a formal detailed plan to either terminate employment before the normal retirement date, or to provide termination benefits as a result of an offer made to encourage voluntary redundancy. Termination benefits for voluntary redundancies are recognised as an expense if the Group has made an offer of voluntary redundancy, it is probable that the offer will be accepted, and the number of acceptances can be estimated reliably. If benefits are payable more than 12 months after the reporting date, then they are discounted to their present value. (I) BASIC EARNINGS PER SHARE (IV) DEFINED CONTRIBUTION PLANS A defined contribution plan is a post employment benefit plan under which an entity pays fixed contributions into a separate entity and will have no legal or constructive obligation to pay further amounts. Obligations for contributions to defined contribution plans are recognised as employee benefits expense in profit or loss in the periods during which services are rendered by employees. Prepaid contributions are recognised as an asset to the extent that a cash refund or a reduction in future payments is available. 70 GOODMAN FIELDER ANNUAL REPORT 2014 (W) CONTRIBUTED EQUITY Ordinary shares are classified as equity. Transaction costs of an equity transaction are accounted for as a deduction from equity, net of any related income tax benefit. Basic earnings per share is calculated by dividing the profit attributable to equity holders of the Group by the weighted average number of ordinary shares outstanding during the financial year, adjusted for bonus elements in ordinary shares issued during the year. (II) DILUTED EARNINGS PER SHARE Diluted earnings per share adjusts the figures used in the determination of basic earnings per share to take into account the after income tax effect of interest and other financing costs associated with dilutive potential ordinary shares and the weighted average number of shares assumed to have been issued for no consideration in relation to dilutive potential ordinary shares. (Y)DIVIDENDS A liability for dividends payable is recognised in the period in which the dividends are determined for the entire undistributed amount. GOODMAN FIELDER ANNUAL REPORT 2014 Notes to the Consolidated Financial Statements (continued) (Z) FINANCIAL GUARANTEE CONTRACTS (AD)PARENT ENTITY FINANCIAL INFORMATION Financial guarantee contracts are recognised as a financial liability at the time the guarantee is issued. The liability is initially measured at fair value and subsequently at the higher of the amount determined in accordance with AASB 137 Provisions, Contingent Liabilities and Contingent Assets and the amount initially recognised less cumulative amortisation, where appropriate. The financial information for the parent entity, Goodman Fielder Limited, disclosed in note 44 has been prepared on the same basis as the consolidated financial statements, except as set out below. The fair value of financial guarantees is determined as the present value of the difference in net cash flows between the contractual payments under the debt instrument and the payments that would be required without the guarantee, or the estimated amount that would be payable to a third party for assuming the obligations. Investments in subsidiaries, associates and joint venture entities are accounted for at cost in the financial statements of Goodman Fielder Limited. Dividends received from associates are recognised in the parent entity’s profit or loss, rather than being deducted from the carrying amount of these investments. Where guarantees in relation to loans or other payables of associates are provided for no compensation, the fair values are accounted for as contributions and recognised as part of the cost of the investment. (II) TAX CONSOLIDATION LEGISLATION (AA)GOODS AND SERVICES TAX (GST) Revenues, expenses and assets are recognised net of the amount of associated GST, unless the GST incurred is not recoverable from the taxation authority. In this case it is recognised as part of the cost of acquisition of the asset or as part of the expense. Receivables and payables are stated inclusive of the amount of GST receivable or payable. The net amount of GST recoverable from, or payable to, the taxation authority is included with other receivables or payables in the statement of financial position. Cash flows are presented on a gross basis. The GST components of cash flows arising from investing or financing activities which are recoverable from, or payable to the taxation authority, are presented as operating cash flows. Commitments and contingencies are disclosed net of the amount of GST recoverable from, or payable to, the taxation authority. (AB)ROUNDING OF AMOUNTS Goodman Fielder Limited is a company of a kind referred to in Class Order 98/100 dated 10 July 1998, issued by the Australian Securities and Investments Commission, relating to the ‘’rounding off’’ of amounts in the financial report. In accordance with that Class Order, amounts in the financial report have been rounded off to the nearest tenth of a million dollars, unless otherwise stated. (AC)NEW ACCOUNTING STANDARDS AND INTERPRETATIONS A number of new standards, amendments to standards and interpretations are effective for annual periods beginning after 1 July 2013, and have not been applied in preparing these consolidated financial statements. None of these are expected to have a significant effect on the consolidated financial statements of the Group, except for AASB 9 Financial Instruments, which becomes mandatory for the Group’s 2018 consolidated financial statements and could change the classification and measurement of financial assets. The Group does not plan to adopt this standard early and the extent of the impact has not been determined. (I)INVESTMENTS IN SUBSIDIARIES, ASSOCIATES AND JOINT VENTURE ENTITIES Goodman Fielder Limited and its wholly-owned Australian controlled entities have implemented the tax consolidation legislation. The head entity, Goodman Fielder Limited, and the controlled entities in the tax consolidated group account for their own current and deferred tax amounts. These tax amounts are measured as if each entity in the tax consolidated group continues to be a stand-alone taxpayer in its own right. In addition to its own current and deferred tax amounts, Goodman Fielder Limited also recognises the current tax liabilities (or assets) and the deferred tax assets arising from unused tax losses and unused tax credits assumed from controlled entities in the tax consolidated group. The entities have also entered into a tax funding agreement under which the wholly-owned entities fully compensate Goodman Fielder Limited for any current tax payable assumed and are compensated by Goodman Fielder Limited for any current tax receivable and deferred tax assets relating to unused tax losses or unused tax credits that are transferred to Goodman Fielder Limited under the tax consolidation legislation. The funding amounts are determined by reference to the amounts recognised in the wholly-owned entities’ financial statements. The amounts receivable/payable under the tax funding agreement are due upon receipt of the funding advice from the head entity, which is issued as soon as practicable after the end of each financial year. The head entity may also require payment of interim funding amounts to assist with its obligations to pay tax instalments. Assets or liabilities arising under tax funding agreements with the tax consolidated entities are recognised as current amounts receivable from or payable to other entities in the Group. Any difference between the amounts assumed and amounts receivable or payable under the tax funding agreement are recognised as a contribution to (or distribution from) wholly-owned tax consolidated entities. (III) FINANCIAL GUARANTEES Where the parent entity has provided financial guarantees in relation to loans and payables of subsidiaries for no compensation, the fair values of these guarantees are accounted for as contributions and recognised as part of the cost of the investment. GOODMAN FIELDER ANNUAL REPORT 2014 71 GOODMAN FIELDER ANNUAL REPORT 2014 Notes to the Consolidated Financial Statements (continued) 2 Financial risk management The Group’s principal financial instruments include trade receivables and payables, bank loans and overdrafts, derivative contracts, and cash and short term deposits. As a result of the Group’s operations and sources of finance, it is exposed to credit risk, liquidity risk and market risks which include foreign currency risk, commodity price risk and interest rate risk. These risks are described below. The Board of Directors has overall responsibility for the establishment and oversight of the Group’s risk management framework. The Group’s risk management policies are established to identify and analyse the financial risks faced by the Group, to set appropriate risk limits and controls, and to monitor risks and adherence to limits. Risk management policies and systems are reviewed regularly to reflect changes in market conditions and the Group’s activities. It is, and has been throughout the period under review, the Group’s policy that no speculative trading in financial instruments shall be undertaken. The Group Audit Committee oversees how management monitors compliance with the Group’s risk management policies and procedures, and reviews the adequacy of the risk management framework in relation to the risks faced by the Group. The Group Audit Committee is assisted in its oversight role by Internal Audit. Internal Audit undertakes both regular and ad hoc reviews of risk management controls and procedures, the results of which are reported to the Audit Committee. Details of the significant accounting policies and methods adopted, including the criteria for recognition, the basis of measurement and the basis upon which income and expenses are recognised, in respect of each class of financial asset and financial liability are disclosed in note 1 to the financial statements. The Group holds the following financial instruments: Fair Value Carrying value 2014201320142013 $m$m$m$m Financial assets Cash and cash equivalents(i) 194.4403.1 Trade and other receivables(i) 156.3163.7 Derivative financial instruments(ii) –0.1 –0.1 Financial liabilities Trade and other payables(i) 265.1235.7 Borrowings(i)(iii) Derivative financial instruments(ii) (i) Not measured at fair value. (ii) Measured at fair value. 647.7830.0642.7813.6 58.849.258.849.2 (iii)The New Zealand retail notes are recognised at amortised cost, however as they are listed on the New Zealand debt exchange, fair value can differ from the carrying value recognised. (A) CREDIT RISK Credit risk is the risk of financial loss to the Group if a customer or counterparty to a financial instrument fails to meet its contractual obligations, and it arises principally from the Group’s trade receivables from customers in the normal course of business. The Group’s exposure to credit risk is influenced mainly by the individual characteristics of each customer. The creditworthiness of a customer or counterparty is determined by a number of qualitative and quantitative factors. Qualitative factors include external credit ratings (where available), payment history and strategic importance of customer or counterparty. Quantitative factors include transaction size, net assets of customer or counterparty, and ratio analysis on liquidity, cash flow and profitability. In relation to trade receivables, it is the Group’s policy that all customers who wish to trade on terms are subject to credit verification on an ongoing basis with the intention of minimising bad debts. The nature of the Group’s trade receivables is represented by regular turnover of product and billing of customers based on the Group’s contractual payment terms. When utilising bank accounts, cash deposits, derivatives, and committed or uncommitted funding facilities, the Group transacts with counterparties who have sound credit profiles. Such counterparties are primarily large financial institutions. In relation to financial institutions, the Group allocates a credit limit based on external credit ratings. The counterparty’s total outstanding transactions with the Group including cash deposits, derivatives and undrawn funding commitments must not exceed this credit limit without Board approval. Transactions involving derivatives are with counterparties with whom the Group has a signed netting arrangement. The Group’s maximum exposure to credit risk for trade receivables at the reporting date by geographic region is detailed in note 10(a). 72 GOODMAN FIELDER ANNUAL REPORT 2014 GOODMAN FIELDER ANNUAL REPORT 2014 Notes to the Consolidated Financial Statements (continued) (B) LIQUIDITY RISK Liquidity risk is the risk that the Group will not be able to meet its financial obligations as and when they become due and payable. The Group’s approach to managing liquidity is to ensure, as far as possible, that it will always have sufficient liquidity to meet its liabilities when they become due and payable, under both normal and stressed conditions, without incurring unacceptable losses or risking damage to the Group’s reputation. The Group uses a combination of bank overdrafts, bank loans, debt facilities and derivatives to ensure continuity of funding whilst also maintaining sufficient flexibility to enable it to minimise its financing costs. The Group manages its cash balances on a daily basis based on quarterly forecast cash projections provided by each operating division. The Group uses overdraft facilities, uncommitted overnight borrowings and committed debt facilities to facilitate this process. It is Group policy that there must be sufficient unused committed debt facilities to cover the next 12 months forecast funding requirements. To the extent possible, the Group attempts to spread its committed debt maturity profile so that significant portions of debt facilities do not mature in any 12 month period to avoid debt concentration and refinancing risk. (I) MATURITIES OF FINANCIAL LIABILITIES The following table details the Group’s contractual maturities of financial liabilities, including estimated interest payments, as at the reporting date: Carrying Totalamount 1 year Between contractual (assets)/ or less 1 to 5 years Over 5 years cash flows liabilities At 30 June 2014 $m $m $m $m $m Trade and other payables Borrowings Commodity derivatives 265.1–– 265.1 265.1 20.2393.9322.2736.3642.7 9.3–– 9.3 0.2 Foreign exchange derivatives –(inflow) (4.9) – –outflow 4.9–– 4.9 1.3 Cross currency interest rate derivative Interest rate derivatives –(4.9) – 12.449.835.5 97.756.1 1.30.3 –1.61.2 308.3 444.0 357.71,110.0 966.6 At 30 June 2013 Trade and other payables Borrowings Commodity derivatives 235.6 – – 235.6 235.6 80.3504.5 347.2932.0813.6 8.7–– 8.7– Foreign exchange derivatives –(inflow) (10.3) – outflow 10.7–– 10.7 0.6 Cross currency interest rate derivative 12.0 48.2 38.4 98.6 41.9 3.9 2.0 – 5.9 6.6 340.9 554.7 385.6 1,281.2 1,098.3 Interest rate derivatives – – (10.3) – All foreign exchange and interest rate derivatives are designated as cash flow hedges. The cross currency interest rate derivatives are dual designated as fair value and cash flow hedges. The impact on the income statement associated with these cash flows is identical to the maturities presented above. In September 2010, Goodman Fielder raised US$300m in the United States traditional private placement debt market. Through the use of cross currency interest rate derivatives US$300m has been swapped into fixed rate Australian dollar debt of $352m. Goodman Fielder recognises the private placement debt carrying amount at amortised cost in USD translated at the period closing exchange rate. The cross currency interest rate derivative instruments have been designated in an effective hedge relationship. A $9m gain has been recognised in the income statement on the translation of the US Dollar denominated debt at 30 June 2014 (2013: loss of $28.6m) offset by a $9m loss (2013: gain of $28.6m) on the fair value portion of the cross currency interest rate swap recognised in the income statement. GOODMAN FIELDER ANNUAL REPORT 2014 73 GOODMAN FIELDER ANNUAL REPORT 2014 Notes to the Consolidated Financial Statements (continued) 2 Financial risk management (continued) (C) MARKET RISK Market risk is the risk that changes in market prices, such as commodity prices, foreign exchange rates and interest rates, will affect the Group’s profit or loss or the value of its holdings of financial instruments. The objective of market risk management is to manage and control market risk exposures within acceptable parameters, while optimising the return on risk. To manage the volatility relating to these risks, the Group takes advantage of natural offsets to the extent possible. In appropriate circumstances and where the Group is unable to naturally offset its exposure to these risks, the Group enters into derivative contracts including interest rate swaps, commodity futures/options and swap contracts and forward currency contracts to manage these exposures. (I) FOREIGN EXCHANGE RISK The Group predominantly operates in Australia, New Zealand, Asia and the Pacific Islands. A significant portion of the Group’s revenues, expenditures and cash flows are generated, and assets and liabilities are located in New Zealand. The Group also has USD denominated debt, however this has been fully hedged with cross currency interest rate derivatives. Furthermore a significant portion of the Group’s commodity purchases are denominated in US dollars. As a result, the Group is exposed to foreign currency risks arising from movements in foreign currency exchange rates. The Group reports in Australian dollars. Movements in foreign currency exchange rates affect reported financial results, financial position and cash flows. Where practical, the Group attempts to reduce this risk by matching revenues and expenditures, as well as assets and liabilities, by country and by currency. Additionally, where practical and within Board approved policies, the Group enters into foreign currency forward contracts to manage its foreign currency exposures. It is Group policy that hedging, as a percentage of net foreign exchange rate exposure, be maintained within an upper and lower limit. There are further controls around the cumulative amount of hedging that can be undertaken within any 30 day period to avoid pricing concentration risk. The Group hedge accounts for derivatives that hedge foreign currency risk. This results in the effective portion of changes in fair value arising from cash flow hedges being reported in equity, through the hedge reserve. Any portion of the change in the fair value of cash flow hedges which is deemed ineffective under hedge accounting is reported in the income statement. Foreign exchange rates, against the Australian Dollar, used for balance sheet translation purposes at 30 June are as follows: 20142013 $$ Central Pacific Franc (XPF) 82.109884.3898 Fiji Dollar (FJD) 1.72411.7313 New Zealand Dollar (NZD) 1.07491.1181 Papua New Guinea Kina (PGK) 2.29882.0416 United States Dollar (USD) 0.93950.9138 74 GOODMAN FIELDER ANNUAL REPORT 2014 GOODMAN FIELDER ANNUAL REPORT 2014 Notes to the Consolidated Financial Statements (continued) The Group’s exposure to foreign currency risk at the reporting date was as follows (all amounts are denominated in Australian dollars at year end spot rates): 2014 NZD USD PGK FJD XPFOther(i) $m$m$m$m$m$m Cash and cash equivalents 67.4– 7.1 3.7– 15.3 Trade receivables 39.9 –20.512.8 3.2 7.8 Trade payables (104.6) –(10.3) (4.4) (2.0) (8.3) Borrowings (323.6)(412.1) Cross currency interest rate derivative – – (0.6) – – 412.1–––– – buy foreign currency 0.3–––– 0.2 – sell foreign currency (0.5) (0.6)––– (0.3) Net exposure (321.1)(0.6)17.3 12.1 0.6 14.7 2013 NZDUSDPGK FJD XPFOther(i) $m$m$m$m$m$m Cash and cash equivalents 95.0 0.1 13.7 1.6 – 12.3 Trade receivables 34.4 – 11.6 10.3 3.0 6.7 Trade payables (67.9) – (5.7) (5.8) (1.9) (9.6) (0.5) (0.7) Borrowings Cross currency interest rate derivative (338.7)(442.0) – 442.0 – – – – – – – buy foreign currency 0.5–––– 0.3 – (6.2) (3.3) – – (1.3) (0.7) (282.9) (3.2) 19.6 6.1 (0.7) 8.3 sell foreign currency Net exposure (i)The Other column includes CNY, HKD, IDR, SGD, MYR and PHP balances, with the exception of forward exchange contracts, which relate entirely to the purchase of EUR. (II) COMMODITY PRICE RISK The Group’s activities expose it to the risk of changes in commodity prices. The Group is a purchaser of certain commodities including wheat, sugar, edible oils, fats and fuel. The Group purchases these commodities based on market prices that are established with the supplier as part of the purchase process. It is Group policy that transactions to procure commodities are executed within daily transaction limits as well as within minimum and maximum cover ratios for forecast requirements over the following 12 month period. In line with Board approved policies, the Group enters into derivative contracts for the purchase of these commodities to reduce the volatility of pricing of key commodity inputs. Because the Group requires physical supply of commodities for its operations, derivative contracts form a minor part of the commodity purchasing process. The Group does not net cash settle contracts for physical supplies of commodities. The Group hedge accounts for derivatives that hedge commodity price risk. This results in the effective portion of changes in fair value arising from cash flow hedges being reported in equity, through the hedge reserve. Any portion of the change in the fair value of cash flow hedges which is deemed ineffective under hedge accounting is reported in the income statement. GOODMAN FIELDER ANNUAL REPORT 2014 75 GOODMAN FIELDER ANNUAL REPORT 2014 Notes to the Consolidated Financial Statements (continued) 2 Financial risk management (continued) (C) MARKET RISK (CONTINUED) (III) INTEREST RATE RISK The Group’s exposure to the risk of changes in market interest rates relates primarily to the Group’s long term debt obligations with a floating interest rate. The Group’s policy is to limit its exposure to the variability in cash flows associated with floating interest rate movements. The Group enters into interest rate swaps, in which the Group agrees to exchange, at specified intervals, the difference between fixed and variable rate interest amounts calculated by reference to an agreed upon notional principal amount. To the extent possible, the Group hedge accounts its interest rate swaps as cash flow hedges. This results in changes in the effective portion of fair value of interest rate swaps being recognised in equity, through the hedge reserve. Any ineffective portion of the change in fair value of the interest rate swap is reported in the income statement. No interest rate swaps relating to the Group’s long term debt obligation were deemed ineffective during 2014 (2013: nil). As at the reporting date, the Group had the following cash, variable rate borrowings and interest rate swap contracts outstanding: 30 June 2014 30 June 2013 Weighted average Weighted average interest rate Balance interest rate Balance %$m %$m Cash and cash equivalents 2.5%194.4 3.4%403.1 Bank loans 5.0%(0.6)5.0% (1.2) Unsecured bank facility 5.8%(641.0)4.6%(817.0) Lease liabilities 4.9%(0.6)2.8% (1.3) Cross currency interest rate derivative – Receive USD fixed rate 4.8%317.4 4.8%328.3 – Pay AUD fixed rate 7.9%(352.2)7.9%(352.2) Interest rate swaps (notional principal amounts) – Receive floating rate 3.4%93.02.8%277.0 – Pay fixed rate 5.4%(93.0)6.1%(277.0) 76 GOODMAN FIELDER ANNUAL REPORT 2014 (482.6)(440.3) GOODMAN FIELDER ANNUAL REPORT 2014 Notes to the Consolidated Financial Statements (continued) (IV) SUMMARISED SENSITIVITY ANALYSIS The following table summarises the sensitivity of the Group’s financial assets and financial liabilities to foreign currency risk, interest rate risk and commodity price risk. Foreign exchange risk(i) –10% 2014 +10% Interest rate risk(ii) –100 bps Other price risk(iii) +100 bps –10% +10% Profit EquityProfitEquityProfitEquityProfitEquityProfitEquityProfitEquity $m$m$m$m$m$m$m$m$m$m$m$m – 10.4– (8.5) (1.9)– 1.9––––– Cash and cash equivalents – 9.4– (7.7)–––––––– Trade receivable Derivative financial instruments – (0.2)– 0.3 – (0.7)– 0.7 – (0.7)– 1.1 Trade payables – (14.4)– 11.8–––––––– Borrowings – (36.4)– 29.8 0.9– (0.9)––––– Total increase/(decrease) – (31.2)– 25.7 (1.0) (0.7) 1.0 0.7 – (0.7)– 1.1 (v) (iv),(v) Foreign exchange risk(i) –10% 2013 +10% Interest rate risk(ii) –100 bps Commodity price risk(iii) +100 bps –10% +10% Profit EquityProfitEquityProfitEquityProfitEquityProfitEquityProfitEquity $m$m$m$m$m$m$m$m$m$m$m$m Cash and cash equivalents Trade receivable – 13.7– (11.1) (3.2)– 3.2––––– 0.1 7.2 (0.1) (5.9)–––––––– Derivative financial instruments – (1.0)– 1.0 – (2.3)– 2.3 – (0.8)– 1.0 Trade payables – (10.1)– 8.2–––––––– Borrowings(iv),(v) – (37.8)– 30.9 2.4– (2.4)––––– (v) Total increase/(decrease) 0.1 (28.0)(0.1)23.1(0.8)(2.3)0.8 2.3 –(0.8) – 1.0 (i)The foreign currency sensitivity above represents a 10% decrease and increase in spot foreign exchange rates. (ii)The interest rate sensitivity above represents a 100 basis point decrease and increase in variable interest rates after reflecting year end hedge positions. (iii)The commodity price sensitivity above represents a 10% decrease or increase in spot commodity prices. (iv)The interest rate sensitivity for borrowings includes the impact of interest rate swaps. (v)The foreign exchange sensitivity on borrowings includes the impact of cross currency interest rate derivatives. (D) CAPITAL MANAGEMENT The Board’s target is to maintain a strong capital base so as to maintain investor, creditor and market confidence and to sustain future development of the business. The primary capital management measures assessed by the Board are the return on capital employed, the dividend payout ratio, the interest cover ratio and the gearing ratio. The Board monitors the return on capital employed, which the Group defines as reported EBIT (Earnings Before Interest and Tax) divided by capital employed. The Group’s target is to achieve a return on capital in excess of 13% over a rolling 12 month period. The Board also monitors the level of dividends to ordinary shareholders. The Group’s target is to achieve a payout ratio of between 50% and 80%. The payout ratio is defined as total dividends paid divided by profit for the year. The Board seeks to maintain an interest cover ratio of at least four times EBITDA (Earnings Before Interest, Tax, Depreciation and Amortisation). Interest cover is defined as EBITDA divided by total financing costs. During the year, Goodman Fielder Limited did not issue any new ordinary shares pursuant to its dividend reinvestment plan (2013: nil). Further details are set out in note 28. GOODMAN FIELDER ANNUAL REPORT 2014 77 GOODMAN FIELDER ANNUAL REPORT 2014 Notes to the Consolidated Financial Statements (continued) 2 Financial risk management (continued) (E) FAIR VALUE MEASUREMENTS The carrying amounts of cash and cash equivalents, trade and other receivables, trade and other payables and borrowings approximate their fair value. AASB 7 Financial Instruments: Disclosures requires disclosure of fair value measurements by level of the following fair value measurement hierarchy: (a)quoted prices (unadjusted) in active markets for identical assets or liabilities (level 1) (b)inputs other than quoted prices included within level 1 that are observable for the asset or liability, either directly (as prices) or indirectly (derived from prices) (level 2), and (c) inputs for the asset or liability that are not based on observable market data (unobservable inputs) (level 3). The following table presents the Group’s financial assets and liabilities recognised and/or disclosed at fair value at reporting date. At 30 June 2014 Level 1 $m Level 2 $m Level 3 $m Total $m Assets Derivative financial instruments –––– Total assets –––– Liabilities Borrowings Derivative financial instruments 235.5–– 235.5 –58.8 –58.8 Total liabilities 235.5 58.8 –294.3 At 30 June 2013 Level 1 $m Level 2 $m Level 3 $m Total $m Derivative financial instruments – 0.1 – 0.1 Total assets –0.1 –0.1 Assets Liabilities Borrowings Derivative financial instruments Total liabilities 225.3–– 225.3 – 49.2 225.3 49.2 – –274.5 VALUATION TECHNIQUES Derivative financial instruments are valued using the market comparison technique. The fair values are based on broker quotes. Similar contracts are traded in an active market and the quotes reflect the actual transactions in similar instruments. 78 GOODMAN FIELDER ANNUAL REPORT 2014 49.2 GOODMAN FIELDER ANNUAL REPORT 2014 Notes to the Consolidated Financial Statements (continued) (F) MASTER NETTING OR SIMILAR AGREEMENTS The Group enters into derivative transactions under International Swaps and Derivatives Association (ISDA) master netting agreements. In general, under such agreements the amounts owed by each counterparty on a single day in respect of all transactions outstanding in the same currency are aggregated into a single net amount that is payable by one party to the other. In certain circumstances – e.g. when a credit event such as a default occurs, all outstanding transactions under the agreement are terminated, the termination value is assessed and only a single net amount is payable in settlement of all transactions. The ISDA agreements do not meet the criteria for offsetting in the statement of financial position. This is because the Group does not have any currently legally enforceable right to offset recognised amounts, because the right to offset is enforceable only on the occurrence of future events such as a default on the bank loans or other credit events. The following table sets out the carrying amounts of recognised financial instruments that are subject to the above agreements. Gross and net amounts of financial instruments in the statement of financial position Related financial instruments that are not offset Net amount 30 June 2014 Financial liabilities Derivative financial instruments Foreign exchange derivatives 1.3 –1.3 Interest rate derivatives 1.2 –1.2 Cross currency interest rate derivatives Commodity price derivatives 56.1 –56.1 0.2 –0.2 58.8 –58.8 30 June 2013 Financial assets Derivative financial instruments Commodity price derivatives 0.1 – 0.1 0.1 – 0.1 Financial liabilities Derivative financial instruments Foreign exchange derivatives 0.6 – 0.6 Interest rate derivatives 6.6 – 6.6 Cross currency interest rate derivatives 41.9 – 41.9 Commodity price derivatives 0.1 – 0.1 49.2 – 49.2 GOODMAN FIELDER ANNUAL REPORT 2014 79 GOODMAN FIELDER ANNUAL REPORT 2014 Notes to the Consolidated Financial Statements (continued) 3Critical accounting estimates and judgements Estimates and associated assumptions are based on historical experience and various other factors that are believed to be reasonable under the circumstances, the results of which form the basis of making the judgements about carrying values of assets and liabilities that are not readily apparent from other sources. Actual results may differ from these estimates. The estimates and underlying assumptions are reviewed at each reporting period. Revisions to accounting estimates are recognised in the period in which the estimate is revised if the revision affects only that period; or in the period of the revision and future periods if the revision affects both current and future periods. The exception to this is revisions in respect of fair value accounting for acquisitions discussed below. The estimates, assumptions and judgements that may have a significant risk of causing a material adjustment to the carrying amounts of assets and liabilities within the next financial year are discussed below. (I)IMPAIRMENT OF GOODWILL AND INTANGIBLES WITH INDEFINITE USEFUL LIVES The Group determines whether goodwill and intangibles with indefinite useful lives are impaired at each reporting period. This requires an estimation of the recoverable amount of the cash generating units to which the goodwill and intangibles with indefinite useful lives are allocated. The assumptions used in this estimation of recoverable amount and the carrying amount of goodwill and intangibles with indefinite useful lives are discussed in note 18. (II) UTILISATION OF TAX LOSSES/CREDITS The Group is subject to income taxes in Australia and jurisdictions where it has foreign operations. Significant judgement is required in determining the worldwide income tax provision and receivable. The Group has recognised an income tax receivable relating to carried forward tax losses, research and development credits, foreign investor tax credits and tax prepayment in prior years to the extent there are sufficient taxable temporary differences relating to the same taxation authority and the same subsidiary against which the unused tax losses can be utilised. Utilisation of tax losses also depends on the ability of the entity to satisfy certain tests at the time the losses are recouped. Both the total carry forward tax credits that is subject to the shareholder continuity test and the revenue tax losses recognised as deferred tax assets are expected to be utilised in 5 years. 4 Segment information (A) DESCRIPTION OF SEGMENTS OPERATING SEGMENTS The Baking division has a portfolio of leading food brands with three of the top five proprietary bread brands in Australia and six of the top 10 proprietary brands in New Zealand. It is one of the largest bakers in the Australasian region, with leading market shares in most of the market segments in which it competes. The Dairy division is a major participant in the New Zealand dairy and smallgoods industries with some of the country’s most recognised brands in fresh and flavoured milk, yogurt, dairy desserts, specialty cheese and cultured products. The business distributes fresh dairy products to almost 13,000 customer points every day. The Grocery division is a leading supplier of consumer food products to supermarkets in Australia and New Zealand. It has a diverse portfolio of iconic market leading brands focused on the retail channel and manufactures at four sites in Australia. Its product range covers spreads and dips, cooking oil, sauces, dressings, vinegar, mayonnaise, flour, pastry, baking ingredients and baked snacks. The Asia Pacific division is one of the largest food suppliers in the Pacific Islands with some of the best known brands in the region, primarily focused on flour, chicken and snacks. The business has an emerging presence in the East Asian region with a core focus on China, the Philippines and Indonesia, and also exports to over 20 countries. Its Asian product range covers bakery ingredients, dairy and spreads. The Integro Foods division was a leading Trans Tasman processor of edible oils. The business supplied edible oils to the Australian and New Zealand food industries and specialised in the development and production of complex, higher value oil blends. The business had four manufacturing plants and, as well as supplying in bulk, the business also supplied packed products under a number of leading brands. The Integro Foods business was sold on 2 October 2012 and the 2013 comparative segment results include results of operations to that date. 80 GOODMAN FIELDER ANNUAL REPORT 2014 GOODMAN FIELDER ANNUAL REPORT 2014 Notes to the Consolidated Financial Statements (continued) (B) OPERATING SEGMENTS 2014 Baking Dairy Grocery Asia Pacific Total $m$m$m$m$m Segment revenue Sales to external customers Inter-segment sales Total segment revenue 924.6 472.7 448.9 353.7 2,199.9 2.7 17.8 23.9 10.6 55.0 927.3 490.5 472.8 364.32,254.9 Inter-segment elimination (55.0) Total revenue 2,199.9 Segment result EBITDA before restructuring costs 74.9 34.3 64.7 69.9 243.8 Depreciation and amortisation expense (39.9) (14.4) (13.8) (4.8) (72.9) EBIT before restructuring costs 35.0 19.9 50.9 65.1 170.9 (6.8) (10.0) (4.6) (2.8) (24.2) Restructuring costs Impairment charge (i) (337.4)– (20.8)– (358.2) Loss on sale of businesses(ii) (3.0)(31.9)(62.4) – (97.3) Asset sales – net gains 0.8 – – – 0.8 Realised exchange loss – – – (0.1) (0.1) Segment EBIT (311.4) (22.0) (36.9) 62.2(308.1) Unallocated restructure costs (14.0) Unallocated expenses (20.2) Net interest expense (56.8) Loss before income tax from continuing operations (399.1) Income tax benefit 1.1 Loss for the year (398.0) Segment assets and liabilities Segment assets 742.8 658.0 292.4 330.2 2,023.4 Inter-segment elimination (21.1) Unallocated assets 210.9 Total assets 2,213.2 Segment liabilities 82.4 120.9 52.4 51.8 307.5 Inter-segment elimination (30.3) Unallocated liabilities 795.0 Total liabilities 1,072.2 Capital expenditure 39.4 9.4 6.7 10.4 65.9 Unallocated capital expenditure 9.7 Total 75.6 (i)The impairment charge of $358.2m relates to the goodwill and brand impairments of the Baking and Grocery CGUs. (ii)The loss on sale of businesses of $97.3m relates to goodwill, brand intangibles and other tangible assets of the businesses divested during the year. GOODMAN FIELDER ANNUAL REPORT 2014 81 GOODMAN FIELDER ANNUAL REPORT 2014 Notes to the Consolidated Financial Statements (continued) 4 Segment information (continued) (B) OPERATING SEGMENTS (CONTINUED) Integro Foods Baking(i) Dairy Grocery Asia Pacific (discontinued) Total 2013 $m$m$m$m$m$m Segment revenue Sales to external customers Inter-segment sales Total segment revenue 935.9 395.3 502.8 331.8 61.4 2,227.2 24.1 15.8 29.9 7.2 47.0 124.0 960.0 411.1 532.7 339.0 108.4 2,351.2 Inter-segment elimination (124.0) Discontinued operations (99.6) Total revenue 2,127.6 Segment result EBITDA before restructuring costs 91.3 53.3 76.8 60.6 6.4 288.4 Depreciation and amortisation expense (33.4) (15.6) (13.4) (4.2) (0.2) (66.8) EBIT before restructuring costs(ii) 57.9 37.7 63.4 56.4 Restructuring costs (6.7) (2.5) (0.7) (1.1) 6.2221.6 (0.4) (11.4) Insurance proceeds 20.5 0.2––– 20.7 Impairment charge(iii) (3.0)–––– (3.0) Asset sales – net gains Realised exchange loss Segment EBIT – – 2.7 2.6 – 5.3 (0.9)–––– (0.9) 67.8 35.4 65.4 57.9 5.8 232.3 Unallocated deal costs (0.5) Unallocated restructure costs (6.0) Unallocated expenses (21.4) Discontinued operations (13.7) Net interest expense (67.2) Profit before income tax from continuing operations 123.5 Profit from discontinued operations, net of income tax 19.0 Income tax benefit (32.7) Profit for the year 109.8 Segment assets and liabilities Segment assets 999.5 611.9 414.9 315.5 65.82,407.6 Inter-segment elimination (87.2) Unallocated assets 456.4 Total assets 2,776.8 Segment liabilities 110.6 64.4 84.9 46.7 66.9373.5 Inter-segment elimination (87.3) Unallocated liabilities 938.3 Total liabilities 1,224.5 Capital expenditure 35.8 5.8 7.710.0 2.762.0 Unallocated capital expenditure 21.0 Total 83.0 (i)The Baking segment EBIT of $67.8m includes the financial information for New Zealand Milling EBIT of $7.9m (including $0.5m loss from insurance settlements) which has been classified as discontinued operations. Further information has been set out in note 8 Discontinued operations. Baking inter-segment sales have been restated to reflect the divestment of the New Zealand Milling business. (ii)The Baking segment EBITDA before restructuring costs includes $2.6m of income relating to the Christchurch earthquakes insurance claim recognised in the ordinary course of business prior to final settlement, which is consistent with prior year treatment. The insurance income recognised, is primarily offset by equivalent costs incurred as a result of the Christchurch earthquakes. (iii) Asset impairment resulting from the Christchurch earthquakes. 82 GOODMAN FIELDER ANNUAL REPORT 2014 GOODMAN FIELDER ANNUAL REPORT 2014 Notes to the Consolidated Financial Statements (continued) (C) GEOGRAPHICAL SEGMENTS Segment revenues from sales to external customers Non-current assets Capital expenditure 201420132014201320142013 $m$m$m$m$m$m 1,011.01,124.1 510.8758.4 47.256.6 Australia New Zealand 835.2771.3 1,015.81,103.2 18.016.0 Asia Pacific 353.7331.8194.7194.8 10.410.1 Less: Discontinued operations –(99.6) –––0.3 2,199.92,127.61,721.32,056.4 Total 75.683.0 Segment revenues are allocated based on the country in which the customer is located. Non-current segment assets and capital expenditure are allocated based on where the assets are located. (D) OTHER SEGMENT INFORMATION During 2014, 60.2% of the Group’s revenues depended on two customers in the Baking, Dairy and Grocery segments (2013: 57.4%). 5 Other income 20142013 $m$m Insurance recoveries relating to the Christchurch earthquakes –23.8 Net gain on disposal of property, plant and equipment 0.85.3 Other income 10.64.9 (i) (i) 11.434.0 Includes impairment reversal of the investment in joint venture. Refer to note 39. In the prior year a final cash settlement for $26.3 million was received in relation to the 2011 earthquakes in Christchurch, which caused some disruption to the Group’s dairy, baking and milling operations in the region and as a result, the Group lodged an insurance claim for damages to buildings, other assets and loss of business. The final settlement in addition to previous settlements brought the total settlement to $44.9 million. The income recognised for continuing operations as a result of the final settlement of $23.8 million was shown as a significant item. The difference was predominantly due to settlement of prior period receivables and New Zealand Milling capital expenditure commitments. GOODMAN FIELDER ANNUAL REPORT 2014 83 GOODMAN FIELDER ANNUAL REPORT 2014 Notes to the Consolidated Financial Statements (continued) 6Expenses 20142013 $m$m Profit before income tax includes the following specific expenses: Depreciation Freehold properties 2.62.2 Leasehold properties 5.95.6 Plant and equipment 52.850.9 Leased plant and equipment 0.81.0 Total depreciation 62.159.7 Amortisation and impairment Amortisation of brand names and intangibles 0.10.2 Amortisation of IT development and software 10.96.9 Impairment of property, plant and equipment –3.0 Impairment charge – Baking 337.4– Impairment charge – Grocery 20.8– Impairment charge – Dairy –– Total amortisation and impairment 369.210.1 Total depreciation, amortisation and impairment 431.369.8 Finance costs Interest and finance charges 62.277.0 Interest income (5.4)(9.8) Net finance costs 56.867.2 Net loss on disposal of property, plant and equipment 4.70.7 Net realised foreign exchange (gains)/losses (0.4)(1.0) Rental expense relating to operating leases 28.337.3 Research and development 12.29.4 Restructuring costs (note 24) 38.217.4 Net loss on business disposal (note 8) 97.3– Employee benefits expenses Wages and salaries 368.3336.7 Annual leave 11.811.5 Defined contribution superannuation expense 20.417.4 Long service leave 1.82.6 Medical insurance 2.62.0 Share based payments expense 1.31.5 Termination benefits (within restructuring costs) 14.03.4 Workers’ compensation costs 6.87.9 Total employee benefits expenses 427.0383.0 84 GOODMAN FIELDER ANNUAL REPORT 2014 GOODMAN FIELDER ANNUAL REPORT 2014 Notes to the Consolidated Financial Statements (continued) 7 Income tax expense (A) INCOME TAX EXPENSE 20142013 $m$m Current tax 1.039.7 Deferred tax (2.2)(2.1) Adjustments for current tax of prior periods 0.1(1.3) (1.1)36.3 Income tax expense is attributable to: (Loss)/profit from continuing operations (1.1)32.7 Profit from discontinued operations –3.6 Aggregate income tax (benefit)/expense (1.1)36.3 (B) NUMERICAL RECONCILIATION OF INCOME TAX EXPENSE TO PRIMA FACIE TAX PAYABLE 20142013 $m$m (Loss)/profit from continuing operations before income tax expense (399.1)123.5 Profit from discontinuing operations before income tax expense –22.6 (399.1)146.1 Tax at the Australian tax rate of 30.0% (2013 – 30.0%) (119.7)43.8 Tax effect of amounts which are not deductible (taxable) in calculating taxable income: Non-assessable income (4.8)(7.3) Non-deductible expenses 14.111.6 Non-deductible impairment charge 108.3– Research and development (1.5)(2.1) Capital loss recouped on sale of business –(7.3) Other (0.5)– (4.1)38.7 Difference in overseas tax rates 2.9(1.1) Adjustments for under/(over) provision of current tax relating to prior periods 0.1(1.3) Income tax (benefit)/expense (1.1)36.3 (C) AMOUNTS RECOGNISED DIRECTLY IN EQUITY 20142013 $m$m Aggregate current and deferred tax arising in the reporting period and not recognised in net profit or loss or other comprehensive income but directly debited or credited to equity: Cash flow hedge derivatives (0.4)2.1 (D) TAX EXPENSE (INCOME) RELATING TO ITEMS OF OTHER COMPREHENSIVE INCOME 20142013 $m$m Income tax recognised in the hedging reserve is attributable to: Changes in the fair value of cash flow hedges (0.4)2.1 GOODMAN FIELDER ANNUAL REPORT 2014 85 GOODMAN FIELDER ANNUAL REPORT 2014 Notes to the Consolidated Financial Statements (continued) 8 Assets classified as held for sale, business divestments and discontinued operations (A) BUSINESS DIVESTMENTS On 23 December 2013, Goodman Fielder entered into an agreement with Green’s Foods Holdings Pty Limited (“Greens”) to sell its Biscuits business (part of the Grocery segment) in Australia. The Biscuits business produces a range of sweet and savoury biscuits, with major brands including Paradise, Cottage, Vive and Veri Deli. The transaction was completed in February 2014. The gross consideration of the transaction was $7.0 million and a loss on sale of $62.1 million was realised. On 8 January 2014 Goodman Fielder announced its agreed intention to sell its Meats and Pizza businesses in New Zealand. Goodman Fielder’s Meats business (part of the Dairy segment) processes and markets smallgoods meats products to the New Zealand market, including Kiwi bacon and ham, Brooks Deli continental meats and bacon, Hutton’s luncheon, bacon and ham, Sizzlers pre-cooked smallgoods and Milano cooked continental meats. The sale was to Hellers Limited in New Zealand. The transaction was completed in March 2014. The gross consideration of the transaction was NZ$12.0 million and a loss on sale of $31.6 million was realised. Goodman Fielder also agreed a proposal to sell its Pizza business (part of the Baking segment) to Mommas Frozen Products Limited. The Pizza business primary brand is Leaning Tower which produces fresh chilled pizza, including pizza bases and snack sized frozen pizzas. The transaction was completed in May 2014. The gross consideration of the transaction was NZ$0.3 million and a loss on sale of $3.0 million was realised. All three sales are in line with the Company’s strategy of optimising its product and brand portfolio. The carrying amounts of assets and liabilities in respect of these divestments as at reporting date were $0.4m, being the receivables in respect of the adjustment schedule on completion of the Biscuits sale. (B) ASSETS AND LIABILITIES CLASSIFIED AS HELD FOR SALE 20142013 $m$m Property, plant and equipment(i) 1.71.7 Total assets 1.71.7 (i)Relates to land and buildings which were not purchased by GrainCorp/Gardner Smith, as part of the Integro Foods business. The assets continue to be actively marketed. (C) OPERATIONS DISCONTINUED IN THE PRIOR YEAR On 16 February 2012 Goodman Fielder Limited announced its intention to sell the Integro Foods business and the New Zealand Milling business, and initiated an active program to locate a buyer for each business and complete the sale. The Integro oils business and the New Zealand Milling business are reported in the comparative figures of this financial report as discontinued operations. The decision to divest the Integro Foods and New Zealand Milling businesses was part of the ongoing portfolio prioritisation project to focus more on core businesses. On 2 October 2012, Goodman Fielder completed the sale of the Integro Foods business to a consortium comprising GrainCorp and Gardner Smith. The gross proceeds of the transaction (including settlement of trade and other receivables and payables by Goodman Fielder) was $170 million. Net proceeds of the transaction of approximately $165 million was used primarily to reduce debt. On 7 December 2012, Goodman Fielder entered into an agreement with Nisshin Flour Milling Inc and its parent, Nisshin Seifun Group Inc to sell its Champion Flour milling business in New Zealand. On 22 February 2013, Goodman Fielder completed the sale of its Champion Flour milling business to Nisshin Seifun Group Inc for NZ$55 million. Financial information relating to the discontinued operations for the prior year is set out below. Further information is set out in note 4 (b) – segment information. 86 GOODMAN FIELDER ANNUAL REPORT 2014 GOODMAN FIELDER ANNUAL REPORT 2014 Notes to the Consolidated Financial Statements (continued) (D) FINANCIAL PERFORMANCE AND CASH FLOW INFORMATION FROM DISCONTINUED OPERATIONS The financial performance and cash flow information presented is for the prior year. 20142013 $m$m Revenue – 99.6 Expenses –(85.9) Profit before income tax – 13.7 Income tax expense –(3.8) Profit after income tax of discontinued operation –9.9 Gain on sale of the division before income tax – 8.9 Income tax expense –0.2 Gain on sale of the division after income tax –9.1 Profit from discontinued operation –19.0 Profit attributable to owners of the parent entity relates to: Profit from discontinued operation –19.0 Net cash inflow from operating activities – 20.5 Net cash inflow from investing activities – 189.1 Net cash outflow from financing activities –(0.2) Net increase in cash generated by the division –209.4 (E) DETAILS OF THE SALE OF THE DISCONTINUED OPERATIONS 20142013 $m$m Consideration received: Cash –192.1 Total disposal consideration(i) –192.1 Carrying amount of net assets sold –(183.2) Gain on sale before income tax –8.9 Income tax expense –0.2 Gain on sale after income tax –9.1 (i)Consideration excludes the net trade and other receivables and payables balance, collected and settled respectively, by Goodman Fielder Limited. GOODMAN FIELDER ANNUAL REPORT 2014 87 GOODMAN FIELDER ANNUAL REPORT 2014 Notes to the Consolidated Financial Statements (continued) 9 Current assets – Cash and cash equivalents 20142013 $m$m Cash at bank and in hand 194.4403.1 (A) CASH AT BANK Cash at bank earns interest at floating rates based on daily bank deposit rates. (B) RIGHT OF SET-OFF The following entities are party to a netting arrangement with the Westpac Banking Corporation in Australia: • Goodman Fielder Consumer Foods Pty Limited; • Quality Bakers Australia Pty Limited; • Goodman Fielder Treasury Pty Limited; and • GF Services Company Pty Limited. The following entities are party to a set off deed with the Westpac Banking Corporation in New Zealand: • Goodman Fielder Treasury New Zealand Limited; • Goodman Fielder New Zealand Limited; and • Goodman Fielder Treasury Pty Limited. (C) BANK OVERDRAFTS The Group has access to four committed overdraft facilities to a value of $21.4m (2013: $20.5m), covering its banking operations in Australia, New Zealand, Fiji and New Caledonia. At 30 June 2014 $0.4m was utilised (2013: $0.5m). 10 Current assets – Trade and other receivables 20142013 $m$m Trade receivables 153.4 157.4 Allowance for doubtful debts (1.6)(1.6) Other receivables 4.57.1 156.3162.9 (A) CREDIT RISK The ageing of these receivables is as follows: 20142013 $m$m Not past due 122.7 148.4 Past due 1 – 30 days 19.1 1.2 Past due 31 – 60 days 2.4 2.3 Past due 61 – 90 days 1.8 1.2 Past due over 90 days 7.44.3 153.4157.4 88 GOODMAN FIELDER ANNUAL REPORT 2014 GOODMAN FIELDER ANNUAL REPORT 2014 Notes to the Consolidated Financial Statements (continued) Movements in the provision for impairment of receivables are as follows: 20142013 $m$m At 1 July 1.6 1.7 Provision for impairment recognised during the year 0.30.4 Receivables written off during the year as uncollectable (0.3)(0.5) At 30 June 1.6 1.6 Based on historic trend and expected performance of the customers, the Group believes that the above allowance for doubtful debts sufficiently covers the risk of defaults. The Group’s maximum exposure to credit risk for trade receivables at the reporting date by geographic region was: 20142013 $m$m Australia 71.189.2 New Zealand 38.533.1 Asia Pacific 43.835.1 153.4157.4 At the reporting dates presented, other receivables did not expose the Group to any significant credit risk. (B) SECURITISATION PROGRAM Certain controlled entities in Australia and New Zealand have entered into a receivables purchase agreement which enables them to securitise selected amounts of their receivables portfolio up to a limit of $62.0m (2013: $62.0m) and NZ$44.0m (2013: NZ$44.0m). At 30 June 2014, $55.5m (2013: $57.3m) and NZ$39.3m (2013: NZ$43.8m) of receivables have been securitised and are not included in the statement of financial position in accordance with accounting policy note 1(p). (C) FAIR VALUE Due to the short term nature of these receivables, their carrying value, net of impairment loss, is assumed to approximate their fair value. 11 Current assets – Inventories 20142013 $m$m Raw materials and stores Work in progress 43.6 39.9 4.9 7.6 Finished goods 74.481.4 122.9128.9 (A) INVENTORY EXPENSE Write downs of inventories to net realisable value recognised as an expense during the year ended 30 June 2014 amounted to $24.0m (2013: $4.3m), including $12.4m (2013: nil) related to divestments. The balance of the expense has been included in ‘cost of sales’ in the income statement. GOODMAN FIELDER ANNUAL REPORT 2014 89 GOODMAN FIELDER ANNUAL REPORT 2014 Notes to the Consolidated Financial Statements (continued) 12 Derivative financial instruments 20142013 $m$m Current assets Commodity price derivatives –0.1 Total current derivative financial instrument assets –0.1 Current liabilities Foreign exchange derivatives 1.30.6 Interest rate derivatives 1.04.8 Cross currency interest rate derivatives 11.411.5 Commodity price derivatives 0.20.1 Total current derivative financial instrument liabilities 13.917.0 Non-current liabilities Cross currency interest rate derivatives 44.730.4 Interest rate derivatives 0.21.8 Total non-current derivative financial instrument liabilities 44.932.2 Total derivative financial instrument liabilities 58.849.2 13 Current assets – Other current assets 20142013 $m$m Prepayments 6.3 6.3 Other current assets 7.08.3 13.314.6 14 Non-current assets – Receivables 20142013 $m$m Receivables from joint venture –0.8 15 Non-current assets – Investments in joint ventures 20142013 $m$m Interest in joint venture (refer note 39) 11.25.5 (A) INVESTMENT IN JOINT VENTURE The investment in the joint venture is accounted for in the financial statements using the equity method of accounting and is carried at cost by the Company. 90 GOODMAN FIELDER ANNUAL REPORT 2014 GOODMAN FIELDER ANNUAL REPORT 2014 Notes to the Consolidated Financial Statements (continued) 16 Non-current assets – Property, plant and equipment Freehold Leasehold Plant and Leased plant land land equipment and equipment Total $m$m$m$m$m At 1 July 2012 Cost 150.6 61.5 677.2 5.5894.8 Accumulated depreciation (39.2) (21.9) (332.1) (3.5) (396.7) Net book amount 111.4 39.6 345.1 2.0 498.1 111.4 39.6 345.1 2.0 498.1 Year ended 30 June 2013 Opening net book amount Additions 11.010.650.7 0.372.6 Disposals (0.8)(0.2)(6.0) Reclassifications – (7.0) 1.7 –(1.7) – – Impairment loss – –(3.0) –(3.0) Disposal through sale of business – – (4.4) – (4.4) Transfers from held for sale 1.5 – – – 1.5 Depreciation charge (2.2) (5.6) (50.9) (1.0) (59.7) Effects of movements in foreign exchange rates 4.3 1.0 8.1 – 13.4 126.9 45.4 337.9 1.3 511.5 (i) Closing net book amount At 30 June 2013 Cost 159.8 71.8595.0 5.8832.4 Accumulated depreciation (32.9) (26.4) (257.1) (4.5) (320.9) Net book amount 126.9 45.4 337.9 1.3 511.5 126.9 45.4 337.9 1.3 511.5 Year ended 30 June 2014 Opening net book amount Additions Disposals 1.9 3.567.2 0.172.7 – (0.2)(4.5) – (4.7) Reclassifications (1.7)(0.4) 2.1 – – Disposal through sale of business (0.4) (12.5) (45.7) – (58.6) Depreciation charge (2.6) (5.9) (52.8) (0.8) (62.1) Effects of movements in foreign exchange rates 5.3 0.3 6.8 – 12.4 129.4 30.2311.0 0.6471.2 Cost 161.9 59.2563.6 5.6790.3 Accumulated depreciation (32.5) (29.0) (252.6) (5.0) (319.1) 129.4 30.2 311.0 0.6 471.2 Closing net book amount At 30 June 2014 Net book amount (i) Asset impairment resulting from the Christchurch earthquakes. GOODMAN FIELDER ANNUAL REPORT 2014 91 GOODMAN FIELDER ANNUAL REPORT 2014 Notes to the Consolidated Financial Statements (continued) 17 Non-current assets – Deferred tax assets 20142013 $m$m Employee benefits 14.2 16.6 Provisions 8.6 9.2 Cash flow hedges recognised in equity 7.9 7.4 Tax value of carry forward tax losses and credits recognised 32.0 8.2 Other 2.95.7 65.647.1 20142013 $m$m Deductible temporary differences 55.745.3 The deductible temporary differences relate to intangibles and land and buildings and do not expire under current tax legislation. Deferred tax assets have not been recognised in respect of these items because it is not probable that future taxable profit will be available against which the Group can utilise the benefits. 92 GOODMAN FIELDER ANNUAL REPORT 2014 GOODMAN FIELDER ANNUAL REPORT 2014 Notes to the Consolidated Financial Statements (continued) 18 Non-current assets – Intangible assets Brand names IT development Goodwill and licences and software Total $m$m$m$m At 1 July 2012 Cost Accumulated amortisation and impairment Net book amount 1,667.2 374.1 50.22,091.5 (654.2) (20.3) (5.4) (679.9) 1,013.0 353.8 44.8 1,411.6 1,013.0 353.8 44.8 1,411.6 Year ended 30 June 2013 Opening net book amount Additions – Amortisation charge – (0.2) (6.9) (7.1) 60.0 13.9 1.7 75.6 1,073.0 367.5 50.0 1,490.5 Effect of movements in foreign exchange rates Closing net book amount –10.410.4 At 30 June 2013 Cost Accumulated amortisation and impairment Net book amount 1,727.2 388.0 62.32,177.5 (654.2) (20.5) (12.3) (687.0) 1,073.0 367.5 50.0 1,490.5 1,073.0 367.5 50.0 1,490.5 Year ended 30 June 2014 Opening net book amount Additions – –2.92.9 Amortisation charge – (0.1) (10.9) (11.0) (7.1) (32.3) (1.0) (40.4) (342.5) (15.7) – (358.2) 69.3 15.8 2.4 87.5 Disposal through sale of business Impairment charge Effect of movements in foreign exchange rates Closing net book amount 792.7 335.2 43.41,171.3 1,594.3 382.0 67.12,043.4 At 30 June 2014 Cost Accumulated amortisation and impairment (801.6) (46.8) Net book amount 792.7 335.2 (23.7) (872.1) 43.41,171.3 GOODMAN FIELDER ANNUAL REPORT 2014 93 GOODMAN FIELDER ANNUAL REPORT 2014 Notes to the Consolidated Financial Statements (continued) 18 Non-current assets – Intangible assets (continued) (A) CARRYING AMOUNT OF GOODWILL, BRAND NAMES AND LICENCES ALLOCATED TO EACH OF THE CASH GENERATING UNITS Goodwill, acquired through business combinations, brand names and licences and IT development and software has been allocated to six (2013: six) individual cash generating units (CGUs) for impairment testing as follows: IT Brands and development Goodwill licences and software Total 2014 $m$m$m$m –107.2 –107.2 Baking New Zealand 143.9 73.5 –217.4 Dairy New Zealand 389.9 93.5 –483.4 Baking Australia Grocery Australia –20.3 –20.3 Grocery New Zealand 142.5 14.2 –156.7 Asia Pacific 106.2 26.5 –132.7 Corporate/other 10.2 –43.453.6 792.7 335.2 43.41,171.3 IT Brands and development Goodwill licences and software Total 2013 $m$m$m$m Baking Australia 185.2 123.0 – 308.2 Baking New Zealand 256.0 69.0 0.6 325.6 Dairy New Zealand 361.0 104.0 – 465.0 – 29.6 – 29.6 Grocery New Zealand 148.5 13.1 – 161.6 Asia Pacific 112.7 28.8 – 141.5 Grocery Australia Corporate/other 9.6 1,073.0 –49.459.0 367.5 50.0 1,490.5 Goodwill on acquisition is initially measured at cost being the excess of the cost of the business acquired over the net fair value of the identifiable assets, liabilities and contingent liabilities. Following initial recognition, goodwill is measured at cost less any accumulated impairment losses. Goodwill is not amortised. Goodwill and intangibles with indefinite useful lives are reviewed for impairment annually or more frequently if events or changes in circumstances indicate that the carrying value may be impaired. Brand names are considered to be maintained into perpetuity and have therefore been assessed to have an indefinite useful life. The indefinite useful life reflects management’s view that the brands are assets that provide ongoing market advantages for both new and existing sales in the markets that the brands operate in. The current understanding of the markets that the brands operate in indicates that demand will continue in a sustainable manner, that the brands could be managed by another management team, that changes in technology are not seen as a major factor impacting the brands’ future value and the brands have a proven long life in the markets in which they operate. Licences with finite lives are amortised over their lives in accordance with the estimated timing of the benefits expected to be received from those assets. The carrying value of the Anchor brand within the Dairy New Zealand CGU is $0.1m (2013: $0.2m). The licence of the Anchor brand name has been assessed to have a finite life of 10 years from the agreement date. The remaining amortisation period is 1.5 years. 94 GOODMAN FIELDER ANNUAL REPORT 2014 GOODMAN FIELDER ANNUAL REPORT 2014 Notes to the Consolidated Financial Statements (continued) (B) KEY ASSUMPTIONS USED FOR VALUE-IN-USE CALCULATIONS The recoverable amount of each of the Group’s CGUs was based on value in use calculations covering a 5 year period with a terminal value growth rate applied at the end of that period. The following key assumptions have been used for the value in use calculation of each CGU. CASHFLOWS The cash flows for the value in use calculations are based on the FY15 board approved budgeted EBITDA and three year strategic plan extended to five years at an underlying growth rate which does not exceed historic rates. Due to the commercial sensitivity of information, the values attributed to these forecasts have not been disclosed. Management determined forecast EBITDA based on recent performance and its risk adjusted expectations for the future. TERMINAL GROWTH RATES The terminal growth rate used to extrapolate cash flows beyond the five year forecast period for Australian, Asia Pacific and New Zealand CGUs is 2.5% (2013: 2.5%). The growth rate does not exceed the long term growth rate for any of the CGUs, and is consistent with forecasts included in industry reports. DISCOUNT RATE In performing the value in use calculations for each CGU, the Group has applied post tax discount rates of 8.3% for Australian CGUs, 8.5% for New Zealand CGUs and 15.4% for Asia Pacific (2013: 7.7%, 7.7% and 14.6%, respectively) to discount the forecast future attributable post tax cash flows. The imputed pre tax discount rate for each Australia and New Zealand CGU is in the range of 10.8% – 11.0% (2013: 9.2% – 9.9%) and 21.5% for Asia Pacific (2013: 20.2%). The discount rates used reflect specific risks relating to the relevant segments and the countries in which they operate. (C) IMPAIRMENT TEST FOR CGUS CONTAINING GOODWILL AND INTANGIBLES WITH INDEFINITE LIVES Where the recoverable amount of the CGU is less than the carrying amount, an impairment loss is recognised. For goodwill and indefinite life intangibles, an impairment test is performed at each reporting period while other assets are only tested if there is an indicator of impairment. Due to continued retail competitive price pressure and higher operating costs impacting earnings negatively in both the Australia and New Zealand markets, the outcome of impairment testing identified that the recoverable amount for certain CGUs were below carrying value. As a result a non-cash impairment was recognised of $358.2m. Of this impairment $342.5m was to goodwill (Baking Australia $185.3m, Baking NZ $136.4m and Grocery New Zealand $20.8m), and $15.7m to brands (Baking Australia). The value in use tests are sensitive to discount rates, assumed long term growth rates and cash flow forecasts. The Group has performed detailed sensitivity analysis as part of its impairment testing to ensure that the results of its testing are reasonable. Sensitivity analysis on these inputs are noted below: • Terminal growth rates: A 0.5% decrease in the terminal growth rate will result in no further CGUs being impaired at reporting date. • Discount rates: A 0.5% increase in the discount rate will result in no further CGUs being impaired at reporting date. • Forecast cash flows: A 5% decrease in the forecast cash flows will result in no further CGUs being impaired at reporting date. Management do not believe a reasonable possible change in assumptions for any CGU would cause the units carrying amount to exceed recoverable amount, apart from those CGUs impaired at 30 June 2014 (Baking Australia, Baking and Grocery NZ) for which any adverse change in assumption would lead to impairment. GOODMAN FIELDER ANNUAL REPORT 2014 95 GOODMAN FIELDER ANNUAL REPORT 2014 Notes to the Consolidated Financial Statements (continued) 19 Non-current assets – Other non-current assets 20142013 $m$m Other non-current assets 1.31.0 20Superannuation Plans The Group makes contributions to two superannuation funds that provide benefits to employees upon retirement. Details of two plans sponsored by the Group as at 30 June 2014 are set out below: AUSTRALIA Fund: Goodman Fielder Superannuation Fund Benefit Type: Defined Contribution and Defined Benefit Date of last actuarial valuation: 8th July 2014 The Goodman Fielder Superannuation Fund is a ‘hybrid’ superannuation plan as it comprises both defined contribution and defined benefit member entitlements. The defined benefit component ceased accepting new members in 1997. Since this date, all new members participate only in the defined contribution plan. Employees who entered the defined benefit plan prior to 1997 are eligible to receive benefits of the greater of their defined benefit and defined contribution components. Employees who are eligible to receive defined benefit payments comprise an immaterial component of the plan; therefore, this plan has been accounted for as a defined contribution superannuation plan. The defined benefit obligation of the plan at 30 June 2014 was $11.2 million (2013: $12.9 million). The net surplus of the defined benefit portion of the plan at 30 June 2014 was $1.0 million and considered not material to either the financial performance or the financial position of the Group. NEW ZEALAND Fund: Goodman Fielder (NZ) Retirement Plan Benefit Type: Defined Contribution and Defined Benefit Date of last actuarial valuation: 8th July 2014 The Goodman Fielder (NZ) Retirement Plan is a ‘hybrid’ superannuation plan as it comprises both defined contribution and defined benefit member entitlements. The defined benefit component is closed to new members. All new members participate only in the defined contribution plan. It also pays pension benefits to retired members under a previous arrangement. Members are not required to contribute to the Plan, although they may contribute a minimum of 2% basic pay after one year’s service. Employer accounts are credited with amounts that depend on the member’s years of contributory membership and level of member contributions. The defined benefit obligation of the plan at 30 June 2014 was NZ$12.5 million (2013: NZ$14.6 million). The net deficit of the defined benefit portion of the plan at 30 June 2014 was NZ$0.3 million and considered not material to either the financial performance or the financial position of the Group. 21Current liabilities – Trade and other payables 20142013 $m$m Trade payables 232.2 202.5 Accrued expenses 5.1 4.5 Other payables 27.828.7 The carrying amount of trade and other payables approximates their fair value. 96 GOODMAN FIELDER ANNUAL REPORT 2014 265.1235.7 GOODMAN FIELDER ANNUAL REPORT 2014 Notes to the Consolidated Financial Statements (continued) 22Current liabilities – Borrowings 20142013 $m$m Secured Lease liabilities (note 35) 0.40.8 Bank facility 0.60.5 Total secured current borrowings 1.01.3 Unsecured Bank facility –51.5 Total unsecured current borrowings –51.5 Total current borrowings 1.052.8 (A) RISK EXPOSURES Details of the Group’s exposure to interest rate changes on borrowings are set out in note 2 (c)(iv). (B) FAIR VALUE Due to the short term nature of these borrowings, their carrying value is assumed to approximate their fair value. 23Current liabilities – Other financial liabilities (A) DEBT FACILITY GUARANTEE Goodman Fielder Limited and a number of its trading subsidiaries are party to a debt facility guarantee for the Group treasury entities. The treasury entities are the primary vehicles through which the Group sources its external debt funding in Australia and New Zealand. Under the provisions of AASB 139 Financial Instruments: Recognition and Measurement as amended by AASB 2005 9, this debt facility guarantee should be accounted for as a Financial Guarantee Contract as detailed in note 1(z). In determining the fair value of the guarantee in respect of these entities, Goodman Fielder Limited has given consideration to the following: • the probability of default or the entities being wound up while the guarantee is still in place; • the existence of sufficient assets in the entities to meet their debt repayment obligations; and • the likely timing of the potential winding up of these entities. The fair value of the debt facility guarantee was considered to be immaterial to Goodman Fielder Limited at its inception and at the time of any subsequent amendments, considered to represent the creation of a new deed, and at the balance date, no liability has been recognised in the financial statements (2013: $nil). (B) DEED OF CROSS GUARANTEE Goodman Fielder Limited and a certain number of its Australian subsidiaries are party to a Deed of Cross Guarantee. Under the provisions of AASB 139 Financial Instruments: Recognition and Measurement as amended by AASB 2005 9, this debt facility guarantee should be accounted for as a Financial Guarantee Contract as detailed in note 1(z). The fair value of the Deed of Cross Guarantee was considered to be immaterial to Goodman Fielder Limited at its inception and at the time of any subsequent amendments, considered to represent the creation of a new deed, and at the balance date, no liability has been recognised in the financial statements (2013: $nil). Refer to note 38. GOODMAN FIELDER ANNUAL REPORT 2014 97 GOODMAN FIELDER ANNUAL REPORT 2014 Notes to the Consolidated Financial Statements (continued) 24Current liabilities – Provisions 20142013 $m$m Employee benefits 40.4 47.4 Workers’ compensation 1.2 2.7 Business closure and rationalisation 8.2 9.3 Other provisions 2.81.5 52.660.9 (A) WORKERS’ COMPENSATION SELF INSURANCE Goodman Fielder is a licensed self insurer under the Victorian Accident Compensation Act. Goodman Fielder obtained the licence on 23 December 2005. Provisions have been made in respect of all assessed workers’ compensation liabilities incurred and both reported and not reported, for the period of self insurance relevant to the Group, based on an independent actuarial assessment. BANK GUARANTEE Of an available facility of $6.6m (2013: $5.2m) in respect of workers’ compensation, the Group has a $6.6m (2013: $5.2m) workers’ compensation bank guarantee in place with the Victorian WorkCover Authority. (B)OTHER Included in other provisions are amounts in the respect of vehicle insurance, customer claims, make good provisions in respect of certain leased premises and unamortised balance of lease incentive payments. These provisions will be utilised over the period that the vehicles are maintained and at the end of the lease terms of the relevant properties. (C) BUSINESS CLOSURE AND RATIONALISATION The business closure and rationalisation provision relates to restructuring costs for specific and identified sites and head office including site remediation, early lease termination and redundancy costs. (D) MOVEMENTS IN PROVISIONS Movements in each class of provision during the financial year, other than employee benefits, are set out in 27(c). 25Non-current liabilities – Borrowings 20142013 $m$m Secured Lease liabilities 0.20.5 Total secured non-current borrowings 0.20.5 Unsecured Bank facility 93.5220.3 US bond issue 317.4328.3 NZ bond issue 230.6211.7 Total unsecured non-current borrowings 641.5760.3 Total non-current borrowings 641.7760.8 98 GOODMAN FIELDER ANNUAL REPORT 2014 GOODMAN FIELDER ANNUAL REPORT 2014 Notes to the Consolidated Financial Statements (continued) (A) DEBT CAPACITY At 30 June 2014, the Group has $110.9m (2013: $277.9m) of undrawn committed funding capacity available (excluding cash at bank). Of this total, $nil (2013: $4.1m) matures in less than 12 months and $110.9m (2013: $273.8m) matures in greater than 12 months. (B) LETTERS OF CREDIT The letter of credit facility is in place for a number of controlled entities and exists for the establishment of import letters of credit, bank guarantees and performance bonds. For the controlled entities the facilities are subject to annual review, repayable on demand and supported by a guarantee from Goodman Fielder Limited. Fees are variable. (C) OTHER BANK LOANS In addition to the detailed facilities there are a number of debt facilities, to a value of $5.1m (2013: $6.1m), extended to various Group companies in the Asia Pacific region. These facilities are guaranteed by Goodman Fielder Limited and certain controlled entities in favour of the lender. (D) OTHER DEBT FACILITIES The Group has access to overnight borrowings facilities to a total of $19.7m (2013: $19.2m). These facilities are uncommitted and provided at call. These facilities were not utilised at 30 June 2014 (2013: unutilised). The Group also has a securitisation facility, details of which are set out in note 10(b). (E) UNSECURED BORROWING FACILITIES There are four (2013: four) committed unsecured bank facilities available to the Group at 30 June 2014. Syndicated facilities are denominated in Australian dollars, however can be drawn down in the New Zealand dollar equivalent. The US bond issue and NZ bond issue are denominated in each local currency and are translated to Australian dollars at the respective year end rate. Drawn amounts and maturities are as follows: Total Amount available utilised 20142014 $m$m Non-current Syndicated Loan Facility entered in November 2011 – available until November 2016 200.093.0 US Bond issue entered in September 2010 – available until September 2020 319.3319.3 NZ Bond issue entered in October 2010 – available until May 2016 232.6232.6 New Caledonia Medium Term Loan entered in April 2014 – available until May 2018 0.50.5 752.4645.4 The borrowing facilities in notes 22 and 25 are shown net of $3.9m (2013: $5.9m) facility establishment costs. The facilities provided to the Group by its principal lenders are unsecured but subject to certain semi annual financial covenants, which are contained within the Group’s banking agreements. The Group complied with these covenants during the year ended 30 June 2014. On 6 August 2013, $150.0m and NZ$40.0m was repaid on the Syndicated Loan Facility maturing November 2014 and NZ$10.0m was repaid on the Bilateral Loan Facility maturing 27 February 2014. On 7 February 2014, the Company repaid NZ$50.0m on the Bilateral Loan Facility maturing 27 February 2014, and cancelled the facility. 26Non-current liabilities – Deferred tax liabilities 20142013 $m$m Property, plant and equipment 18.9 18.4 Land and buildings 8.88.0 Other items 0.9 0.1 Interest bearing loans 0.1 0.1 Intangible assets –1.6 28.728.2 GOODMAN FIELDER ANNUAL REPORT 2014 99 GOODMAN FIELDER ANNUAL REPORT 2014 Notes to the Consolidated Financial Statements (continued) 27Non-current liabilities – Provisions 20142013 $m$m Employee benefits 1.62.9 Workers’ compensation 3.23.1 Other provisions 14.414.5 Business closure and rationalisation 1.4– 20.620.5 (A) WORKERS’ COMPENSATION Goodman Fielder is a licensed self insurer under the Victorian Accident Compensation Act. See note 24(a) for details. (B)OTHER Included in other provisions are amounts in respect of make good provisions for certain leased premises and the unamortised balance of lease incentive payments. These provisions will be utilised at the end of the lease terms of the relevant properties. (C) MOVEMENTS IN PROVISIONS Movements in each class of current and non-current provision during the financial year, other than employee benefits, are set out below: Business closure and Workers’ rationalisationcompensation Other Total $m$m$m$m 2014 Carrying amount at start of year 9.3 5.8 16.0 31.1 Additional provisions recognised 10.3 2.8 1.2 14.3 Amounts used during the year (10.0) (4.2) Carrying amount at end of year 100 GOODMAN FIELDER ANNUAL REPORT 2014 9.6 4.4 –(14.2) 17.2 31.2 GOODMAN FIELDER ANNUAL REPORT 2014 Notes to the Consolidated Financial Statements (continued) 28Contributed equity 20142013 20142013 Notes SharesShares$m$m Other contributed equity 28(b) Share capital 1,955,559,2071,955,559,207 2,060.12,060.1 –– 4.94.9 1,955,559,2071,955,559,207 2,065.02,065.0 (A) MOVEMENTS IN ORDINARY SHARE CAPITAL Number Date Details of shares Issue price $m 1 July 2012 Opening balance 1,955,559,207 – 2,063.7 Revision of estimated tax effect of transaction costs from capital raising – 1.3 30 June 2013 Closing balance 1,955,559,207 2,065.0 1 July 2013 Opening balance 1,955,559,207 2,065.0 30 June 2014 Closing balance1,955,559,2072,065.0 – – (B) ORDINARY SHARES The holders of ordinary shares are entitled to receive dividends as declared from time to time and are entitled to one vote per share at meetings of Goodman Fielder Limited. All shares rank equally with regard to the Group’s residual assets. The Company does not have authorised capital or par value in respect to its issued shares. (C) SHARE CAPITAL The balance of share capital in the financial statements comprises shares on issue of Goodman Fielder Consumer Foods Pty Limited (GFCF) as the deemed acquiring company under reverse acquisition accounting. (D) OTHER CONTRIBUTED EQUITY Other contributed equity is a result of reverse acquisition accounting adopted in the Group accounts. This account is similar in nature to share capital and is not available for distribution. The balance of the account represents a net adjustment for the replacement of the legal parent’s equity with that of the deemed acquirer. (E) DIVIDEND REINVESTMENT PLAN The Dividend Reinvestment Plan (DRP) did not apply to any dividends paid in the current or prior year. GOODMAN FIELDER ANNUAL REPORT 2014 101 GOODMAN FIELDER ANNUAL REPORT 2014 Notes to the Consolidated Financial Statements (continued) 29Other reserves and accumulated losses (A)RESERVES 20142013 $m$m Hedging reserve (19.8)(17.7) Share-based payments reserve 3.4 2.1 Foreign currency translation reserve (92.0)(162.0) (108.4)(177.6) 20142013 $m$m Movements: Hedging reserve Opening balance (17.7)(22.7) Effective changes in fair value of cross currency interest rate derivatives, net of tax (6.2)(0.7) Effective changes in fair value of interest rate derivatives, net of tax 5.16.9 Effective changes in fair value of foreign currency derivatives, net of tax (0.9)(0.1) Effective changes in fair value of commodity price derivatives, net of tax (0.2)(1.1) Transfer to income statement, net of tax 0.10.1 Transfer to inventory and other assets, net of tax –(0.1) Balance 30 June (19.8) (17.7) Share-based payments reserve Opening balance 2.1 0.6 Share based payment recognised in income statement, net of tax 1.31.5 Balance 30 June 3.4 2.1 Foreign currency translation reserve Opening balance (162.0)(230.8) Total recognised income 70.068.8 Balance 30 June (92.0) (162.0) (B) NATURE AND PURPOSE OF OTHER RESERVES (I) HEDGING RESERVE The hedging reserve comprises the effective portion of the cumulative net change in the fair value of derivatives designated as cash flow hedges that relate to hedged transactions that have not yet occurred, as described in note 1(e). (II) SHARE-BASED PAYMENTS RESERVE The share based payments reserve is used to recognise the cumulative expense for the fair value of share rights issued to employees but not exercised. (III) FOREIGN CURRENCY TRANSLATION RESERVE The foreign currency translation reserve comprises exchange differences arising from the translation of the financial statements of foreign subsidiaries where their functional currency is different to the presentation currency of the reporting entity, as described in note 1(d)(iii). 102 GOODMAN FIELDER ANNUAL REPORT 2014 GOODMAN FIELDER ANNUAL REPORT 2014 Notes to the Consolidated Financial Statements (continued) (C) ACCUMULATED LOSSES Movements in retained earnings were as follows: 20142013 $m$m Balance 1 July (339.2)(441.7) Net profit for the year (405.1)102.5 Dividends (79.5)– Balance 30 June (823.8) (339.2) 30Dividends (A) ORDINARY SHARES 20142013 $m$m Final dividend for the year ended 30 June 2014 of 1.0 cents (2013: 3.0 cents) per fully paid share paid on 1 October 2014. Australia: 100% fully franked (2013: nil franked amount) (19.6)– New Zealand: 100% imputed (2013: nil imputation amount) –(58.7) Interim dividend for the half year ended 31 December 2013 of 1.0 cents (2013: nil cents) per fully paid ordinary share paid on 10 April 2014. Australia: nil franked amount (2013: nil franked amount) New Zealand: nil imputation amount (2013: nil imputation amount) (19.6)– Total dividend paid (39.2)(58.7) (B) DIVIDENDS NOT RECOGNISED AT THE END OF THE REPORTING PERIOD 20142013 $m$m Since year end the Directors have resolved to pay a final dividend of 1.0 cents per fully paid ordinary share. (2013: 3.0 cents) Australia: 100% fully franked (2013: nil franked amount) New Zealand: 100% imputed (2013: nil imputation) The aggregate amount of the proposed dividend payable, but not recognised as a liability 19.658.7 (C) FRANKED DIVIDENDS 20142013 $m$m Franking credits available for subsequent reporting periods based on a tax rate of 30.0% (2013 – 30.0%) 9.317.3 Add: Current year tax (receivable)/payable –(9.1) (i) 9.38.2 (i)The 30 June 2014 franking balance has been adjusted for franking credits that will arise from the receipt of the current tax asset recognised as at 30 June 2014 on lodgement of the 2014 tax returns. The above amounts represent the balance of the franking account as at the end of the reporting period, adjusted for: (a)franking credits that will arise from the payment of the current tax liabilities/receipt of current tax receivables; (b)franking credits that will arise from the receipt of dividends recognised as receivables at the reporting date by the tax consolidated group; and (c) franking credits that the entity may be prevented from distributing in subsequent years. GOODMAN FIELDER ANNUAL REPORT 2014 103 GOODMAN FIELDER ANNUAL REPORT 2014 Notes to the Consolidated Financial Statements (continued) 30Dividends (continued) (D) IMPUTATION CREDITS NEW ZEALAND 20142013 $m$m Estimated New Zealand imputation credits expected to be available for the above dividend and subsequent financial years based on a tax rate of 28% (2013: 28%) 22.515.8 The ability to pass on New Zealand imputation credits to New Zealand shareholders through a dividend is possible due to changes in the tax laws operation between New Zealand and Australia (Trans Tasman Triangular Tax Relief) that were enacted at the end of 2003. The impact on the imputation account of dividends recommended after year end, but not recognised as a liability at year end is to reduce it by nil. 31Key management personnel disclosures (A) KEY MANAGEMENT PERSONNEL COMPENSATION 20142013 $’000$’000 Short-term employee benefits 5,7796,973 Post-employment benefits 246 203 Long-term benefits 6 33 Termination benefits 269 Share-based payments 279696 632 6,5798,537 Detailed remuneration disclosures are provided in the remuneration report. Incentives awarded and paid to executives in the year ended 30 June 2014 in respect of performance for the 2014 financial year have been disclosed in the Remuneration Report in the 2014 financial year comparatives. Further details of key management personnel and their remuneration can be found in the table set out in section 3 of the Remuneration Report entitled “Non-Executive Director Remuneration” and in section 7 of the Remuneration Report entitled “Remuneration of Executives for the financial year ended 30 June 2014”. Amounts disclosed as total remuneration of Directors and executives exclude insurance premiums paid by the Group in respect of directors’ and officers’ liability insurance contracts which cover current and former Directors, secretaries and senior managers of Goodman Fielder Limited and its subsidiaries and medical insurance premiums paid by the Group in respect of expatriate employees and their families and employees and their families who have temporarily relocated to Australia for work purposes. These amounts have not been allocated to the individuals covered by the insurance policies as, based upon all available information, the Directors believe that no reasonable basis for such allocation exists. Executives also receive entitlements to shares in Goodman Fielder Limited as remuneration (see note 32). (B) LOANS TO KEY MANAGEMENT PERSONNEL There were no loans to key management personnel or their related parties made by the Group during the financial year and no loans to key management personnel or their related parties were outstanding at the reporting date. (C) TRANSACTIONS WITH KEY MANAGEMENT PERSONNEL Transactions with key management personnel are detailed in note 36. From time to time, key management personnel of the Group may purchase goods from the Group. These purchases are on the same terms and conditions as those entered into by other Group employees or customers and are trivial or domestic in nature. 104 GOODMAN FIELDER ANNUAL REPORT 2014 GOODMAN FIELDER ANNUAL REPORT 2014 Notes to the Consolidated Financial Statements (continued) 32Share-based payments The Chief Executive Officer (CEO) and nominated executives are eligible to receive shares in the Company over rolling three year periods pursuant to the Equity Incentive Plan (EIP) (formerly the Performance Share Plan) approved by shareholders at the Company’s 2007 Annual General Meeting. The total equity settled share based payment expense for the year was $1.3 million (2013: $1.5 million). (A) LONG-TERM INCENTIVE (LTI) Under the LTI, rights to be allocated shares in the Company are offered annually to the CEO and nominated executives. Each right offered is an entitlement to one fully paid ordinary share in the Company on terms and conditions determined by the Board, including vesting conditions linked to both service (through a three year performance period for each offer) and performance based on achieving return on capital employed (ROCE), and relative total shareholder return (TSR) targets. The rights have no dividend or voting entitlement (although shares allocated on vesting have the same rights as other ordinary shares). Further details regarding the operation of the LTI Plan are outlined in the Directors’ Report. 20142013 No. of rights No. of rights LTI plan rights reconciliation Rights outstanding as at 1 July 16,812,5388,215,536 Rights granted 9,321,57612,479,618 Rights forfeited (6,820,492)(2,426,430) Rights lapsed (2,633,120)(1,456,186) Rights outstanding as at 30 June 16,680,50216,812,538 Rights exercisable at 30 June –– No amount has been paid or is payable by the executives to the Group in relation to rights awarded. FAIR VALUE CALCULATION The estimated value of rights granted with the TSR performance hurdle component was determined at grant date using a Monte Carlo model. Inputs into Monte Carlo model 20142013 Expected volatility 35.00%50.00% Dividend yield 5.29%3.01% Risk free interest rate 3.08%2.60% The expected volatility for the 2013 and 2012 awards was determined having regard to the historical share price volatility trend and the volatility at the valuation date. The risk free interest rate was the yield on an Australian Government bond at the grant date matching the remaining life of the award. The yield is converted into a continuously compounded rate in the model. The Goodman Fielder share price at grant date was used to value the rights with a ROCE performance hurdle, adjusted for expected dividends during the vesting period. The grant date and fair value at the date of each share award was as follows: Share plan Grant date Share value 2014 – Equity Incentive Plan – ROCE 10 December 2013 $0.65 2014 – Equity Incentive Plan – TSR 10 December 2013 $0.36 2013 – Equity Incentive Plan – ROCE 7 December 2012 $0.67 2013 – Equity Incentive Plan – TSR 7 December 2012 $0.52 2012 – Equity Incentive Plan – ROCE 13 December 2011 $0.52 2012 – Equity Incentive Plan – TSR 13 December 2011 $0.15 GOODMAN FIELDER ANNUAL REPORT 2014 105 GOODMAN FIELDER ANNUAL REPORT 2014 Notes to the Consolidated Financial Statements (continued) 32Share-based payments (continued) (B) RETENTION PLAN In 2012 the Company introduced the Retention Incentive Plan (RIP) for participation by senior managers and executives of the Company. The invitation to participate is at the discretion of the Group Executive and the Board. The invitation to participate is based on the ability of the senior manager or executive to influence the Company’s financial performance or contribute to the achievement of the Company’s business objectives. Shares are allocated to senior management and executives who successfully complete the three year retention period. The Board has discretion to adjust the number of share rights allocated in particular circumstances (for example, a capital reconstruction) and subject to continued employment with the Group through the retention period and until the retention date. Senior management and executives will receive one share for each share right held. Share rights vest on the retention date if the employee is still an employee of the Group at that time. 20142013 No. of rights No. of rights Retention plan rights reconciliation Rights outstanding as at 1 July 2,120,0002,180,000 Rights granted 3,300,000300,000 Rights forfeited (1,240,000)(360,000) Rights outstanding as at 30 June 4,180,0002,120,000 Rights exercisable at 30 June –– No amount has been paid or is payable by the executives to the Group in relation to rights awarded. FAIR VALUE CALCULATION Rights are valued based on the Goodman Fielder share price as traded on the ASX at grant date adjusted for expected dividends during the vesting period. 33Remuneration of auditors During the period the following fees were paid or payable for services provided by the auditor of the parent entity, its related practices and non-related audit firms: (A) AUDIT AND REVIEW SERVICES 20142013 $’000$’000 KPMG Australia Audit and review of financial statements 8701,051 Overseas KPMG firms Audit and review of financial reports 431431 Total remuneration for audit and other assurance services 1,3011,482 (B) OTHER TAX AND ASSURANCE SERVICES 20142013 $’000$’000 KPMG Australia In relation to other assurance and due diligence services 152 255 Overseas KPMG firms In relation to other assurance and taxation services 15927 Total remuneration for audit and other assurance services 311282 Total auditors’ remuneration 1,6121,764 106 GOODMAN FIELDER ANNUAL REPORT 2014 GOODMAN FIELDER ANNUAL REPORT 2014 Notes to the Consolidated Financial Statements (continued) 34Contingencies (A) CONTINGENT LIABILITIES The Group is subject to litigation in the ordinary course of operations. The Group does not believe that it is engaged in any legal proceedings for which provision has not been made which would be likely to have a material effect on its business, statement of financial position or income statement. The Group has entered into guarantees and security arrangements in respect of certain indebtedness as described in note 25. The Group has entered into a Deed of Cross Guarantee. Details are set out in note 38. 35Commitments (A) CAPITAL COMMITMENTS Capital expenditure contracted for at the reporting date but not recognised as liabilities is as follows: 20142013 $m$m Capital expenditure commitments 4.415.3 (B) LEASE COMMITMENTS (I) NON-CANCELLABLE OPERATING LEASES Significant leases within the Group include the head office premises in Sydney Australia, a manufacturing site at Erskine Park Australia, and the Auckland New Zealand office. 20142013 $m$m Commitments for minimum lease payments in relation to non-cancellable operating leases are payable as follows: Within one year 22.426.2 Later than one year but not later than five years 58.269.5 Later than five years 69.277.0 149.8172.7 (II) FINANCE LEASES During the year, the Group leased various plant and equipment with a carrying amount of $0.6m (2013: $0.3m) under finance leases expiring within 1 to 5 years. All of the leases provide the Group with an option to purchase the equipment at a beneficial price. 20142013 $m$m Commitments in relation to finance leases are payable as follows: Within one year 0.40.9 Later than one year but not later than five years 0.20.6 Later than five years –– Minimum lease payments 0.6 1.5 Future finance charges –(0.2) Recognised as a liability 0.61.3 Representing lease liabilities: Current (note 22) 0.40.8 Non-current (note 25) 0.20.5 0.61.3 The weighted average interest rate implicit in the leases is 4.94% (2013: 2.84%). GOODMAN FIELDER ANNUAL REPORT 2014 107 GOODMAN FIELDER ANNUAL REPORT 2014 Notes to the Consolidated Financial Statements (continued) 36Related party transactions (A) PARENT ENTITY The legal parent entity within the Group is Goodman Fielder Limited. (B)DIRECTORS Information on the remuneration of Directors is disclosed in the Remuneration Report and in note 31. (C)SUBSIDIARIES Interests in subsidiaries are set out in note 37. (D) KEY MANAGEMENT PERSONNEL Disclosures relating to key management personnel are set out in note 31. (E) TRANSACTIONS WITH KEY MANAGEMENT PERSONNEL OR ENTITIES RELATED TO THEM There were no other transactions with key management personnel or entities related to them during the year. (F) OUTSTANDING BALANCE WITH JOINT VENTURE The following balances are outstanding at the reporting date in relation to transactions with joint venture (refer to note 39): 20142013 $m$m Non-current receivables (loans) –0.8 (G) TERMS AND CONDITIONS All of the above transactions were conducted under normal commercial terms and conditions. Outstanding balances at period end are unsecured and settlement occurs in cash. There have been no guarantees provided or received for any related party receivables. For the financial period ended 30 June 2014, the Group has not incurred any impairment losses relating to amounts owed by related parties (2013: nil). 108 GOODMAN FIELDER ANNUAL REPORT 2014 GOODMAN FIELDER ANNUAL REPORT 2014 Notes to the Consolidated Financial Statements (continued) 37Subsidiaries There were no business combinations during the current financial year or the prior financial year. The financial statements incorporate the assets, liabilities and results of the following controlled entities in accordance with the accounting policy described in note 1(b). Equity holding Controlled entities of 20142013 Goodman Fielder Limited at 30 June 2014 Country of incorporation Class of shares %% BCW Hotplate Bakery Pty Ltd Bilgola Foods Pty Ltd Cobbity Farm Bakeries Pty Ltd Country Bake Bakeries Pty Ltd Country Bake Cairns Pty Ltd Country Bake Tasmania Pty Ltd Darwin Bakery Pty Limited Dashboard Bidco Pty Limited Dashboard Holdings Pty Limited Defiance Mills Pty Ltd GF Brand Holding Company Pty Limited GF Defiance Pty Limited GF Services Company Pty Limited Goodman Fielder Consumer Foods Pty Limited Goodman Fielder Custodians Pty Limited Goodman Fielder Food Services Pty Limited Goodman Fielder Superannuation Fund Pty Limited Goodman Fielder Treasury Pty Limited Hawley Nominees Pty Ltd K.F. Holdings Pty Ltd La Famiglia Fine Foods Pty Ltd Oilstream Partners Pty Limited Dashboard Food Industries Pty Limited * Quality Bakers Australia Pty Limited Regal Bakeries Pty Limited Stuart Bakery Pty Ltd Sunicrust Bakeries Proprietary Limited Evercrisp Snack Products (South Seas) Limited Goodman Fielder (Fiji) Limited Goodman Fielder International (Fiji) Limited Tucker Group (Fiji) Limited Tuckers Ice Cream Limited Goodman Fielder International (China) Limited Goodman Fielder International (Hong Kong) Limited Sinar Meadow International Limited Goodman Fielder International Sdn Bhd Goodman Fielder Nouvelle Caledonie SAS GF Retirement Nominees Limited Goodman Fielder New Zealand Limited Goodman Fielder Treasury New Zealand Limited Associated Mills Limited Evercrisp Snacks (PNG) Limited Goodman Fielder International (PNG) Limited Seabreeze Poultry Limited Goodman Fielder International (Philippines) Inc Goodman Fielder (Guangzhou) Trade Co Ltd Goodman Fielder Singapore Pte. Ltd (*) Australia Australia Australia Australia Australia Australia Australia Australia Australia Australia Australia Australia Australia Australia Australia Australia Australia Australia Australia Australia Australia Australia Australia Australia Australia Australia Australia Fiji Fiji Fiji Fiji Fiji Hong Kong Hong Kong Hong Kong Malaysia New Caledonia New Zealand New Zealand New Zealand Papua New Guinea Papua New Guinea Papua New Guinea Papua New Guinea Philippines China Singapore Name changed from Paradise Food Industries Pty Ltd on 7 March 2014. Ordinary Ordinary Ordinary Ordinary Ordinary Ordinary Ordinary Ordinary Ordinary Ordinary Ordinary Ordinary Ordinary Ordinary Ordinary Ordinary Ordinary Ordinary Ordinary Ordinary Ordinary Ordinary Ordinary Ordinary Ordinary Ordinary Ordinary Ordinary Ordinary Ordinary Ordinary Ordinary Ordinary Ordinary Ordinary Ordinary Ordinary Ordinary Ordinary Ordinary Ordinary Ordinary Ordinary Ordinary Ordinary n/a Ordinary 100100 100100 100100 100100 100100 100100 100100 100100 100100 100100 100100 100100 100100 100100 100100 100100 100100 100100 100100 100100 100100 100100 100100 100100 100100 100100 100100 9090 9090 9090 9090 9090 100100 100100 5959 100100 100100 100100 100100 100100 7474 100100 100100 100100 100100 100100 100100 GOODMAN FIELDER ANNUAL REPORT 2014 109 GOODMAN FIELDER ANNUAL REPORT 2014 Notes to the Consolidated Financial Statements (continued) 38Deed of cross guarantee Pursuant to ASIC Class Order 98/1418 (as amended) dated 13 August 1998, the wholly owned subsidiaries listed below are relieved from the Corporations Act 2001 requirements for preparation, audit and lodgement of a financial report, and Directors’ report. Goodman Fielder Custodians Pty Limited is the Trustee appointed under this Deed but is not granted relief from specified accounting requirements in accordance with ASIC Class Order 98/1418 (as amended). It is a condition of the Class Order that Goodman Fielder Limited and certain of the subsidiaries enter into a Deed of Cross Guarantee. The effect of the Deed is that Goodman Fielder Limited guarantees to each creditor payment in full of any debt in the event of winding up of any of the subsidiaries under certain provisions of the Corporations Act 2001. If a winding up occurs under other provisions of the Act, Goodman Fielder Limited will only be liable in the event that after six months any creditor has not been paid in full. The subsidiaries have also given similar guarantees in the event Goodman Fielder Limited is wound up. The members of the Extended Closed Group subject to the deed are: • BCW Hotplate Bakery Pty Ltd • Bilgola Foods Pty Ltd • Cobbity Farm Bakeries Pty Ltd • Country Bake Bakeries Pty Ltd • Country Bake Cairns Pty Ltd • Country Bake Tasmania Pty Ltd • Darwin Bakery Pty Limited • Dashboard Holdings Pty Limited • Dashboard Bidco Pty Limited • Defiance Mills Pty Ltd • GF Brand Holding Company Pty Limited • GF Defiance Pty Limited • GF Services Company Pty Limited • Goodman Fielder Consumer Foods Pty Limited • Goodman Fielder Food Services Pty Limited • Goodman Fielder Treasury Pty Limited • Hawley Nominees Pty Ltd • K.F. Holdings Pty Ltd • La Famiglia Fine Foods Pty Ltd • Oilstream Partners Pty Limited • Dashboard Food Industries Pty Limited * • Quality Bakers Australia Pty Limited • Regal Bakeries Pty Limited • Stuart Bakery Pty Ltd • Sunicrust Bakeries Proprietary Limited (*) Name changed from Paradise Food Industries Pty Ltd on 7 March 2014. 110 GOODMAN FIELDER ANNUAL REPORT 2014 GOODMAN FIELDER ANNUAL REPORT 2014 Notes to the Consolidated Financial Statements (continued) (A)CONSOLIDATED INCOME STATEMENT, STATEMENT OF COMPREHENSIVE INCOME AND SUMMARY OF MOVEMENTS IN CONSOLIDATED RETAINED EARNINGS An income statement prepared in accordance with the accounting policy described in note 1(b), comprising certain wholly owned subsidiaries, which are party to the Deed, after eliminating all transactions between parties to the Deed of Cross Guarantee, is set out as follows: 20142013 $m$m Consolidated income statement Sales of goods 1,074.61,070.0 Other income 17.763.1 Cost of sales of goods (676.4)(648.9) Warehousing and distribution expenses (234.9)(230.2) Selling and marketing expenses (74.6)(63.1) General and administration expenses (132.7)(81.3) Net financing costs (19.1)(27.0) (Loss)/profit before income tax (45.4) 82.6 Income tax benefit/(expense) 12.2(7.6) (Loss)/profit from continuing operations (33.2)75.0 Profit from discontinued operations –16.3 (Loss)/profit for the year (33.2) 91.3 20142013 $m$m Consolidated statement of profit or loss and other comprehensive income Other comprehensive income (Loss)/profit for the year (33.2) 91.3 Items that may be reclassified to profit or loss Changes in the fair value of cash flow hedges 4.14.8 Total (loss)/comprehensive income for the year (29.1) 96.1 20142013 $m$m Summary of movements in consolidated retained earnings Retained earnings at the beginning of the financial year (266.6)(357.9) Profit for the year (33.2) 91.3 Dividends paid (78.2)– Retained earnings at the end of the financial year (378.0) (266.6) GOODMAN FIELDER ANNUAL REPORT 2014 111 GOODMAN FIELDER ANNUAL REPORT 2014 Notes to the Consolidated Financial Statements (continued) 38Deed of cross guarantee (continued) (B) CONSOLIDATED STATEMENT OF FINANCIAL POSITION A statement of financial position prepared in accordance with the accounting policy described in note 1(b), comprising certain wholly owned subsidiaries which are party to the Deed, after eliminating all transactions between parties to the Deed of Cross Guarantee is set out as follows: 20142013 $m$m Current assets Cash and cash equivalents 100.0348.9 Trade and other receivables 91.2126.4 Inventories 50.257.5 Derivatives financial instruments –0.1 Current tax receivable –13.8 Other current assets 8.19.3 Assets classified as held for sale 1.71.7 Total current assets 251.2557.7 Non-current assets Receivables 306.2341.7 Investment in joint venture 11.25.5 Other investments 1,100.51,100.5 Other non-current assets 0.30.3 Property, plant and equipment 270.4320.5 Deferred tax assets 44.426.7 Intangible assets 334.2348.3 Total non-current assets 2,067.22,143.5 Total assets 2,318.42,701.2 Current liabilities Trade and other payables 128.3195.7 Borrowings 0.151.3 Derivative financial instruments 12.517.0 Provisions 30.944.6 Total current liabilities 171.8308.6 Non-current liabilities Borrowings 410.6551.7 Derivative financial instruments 44.932.2 Provisions 19.526.0 Total non-current liabilities 475.0609.9 Total liabilities 646.8918.5 Net assets 112 GOODMAN FIELDER ANNUAL REPORT 2014 1,671.61,782.7 GOODMAN FIELDER ANNUAL REPORT 2014 Notes to the Consolidated Financial Statements (continued) 20142013 $m$m Equity Contributed equity 2,065.02,065.0 Other reserves (15.2)(15.7) Retained earnings (378.2)(266.6) Total equity 1,671.61,782.7 39Interests in joint ventures (A) JOINT VENTURE PARTNERSHIP The Group has a 50% interest (2013: 50% interest) in PT Sinar Meadow International Indonesia (incorporated in Indonesia). PT Sinar Meadow International Indonesia operates a margarine manufacturing and distribution business in Indonesia. The Group’s investment in the company, together with loans made to the company, were written off in prior years. During the year, an impairment reversal of $5.5m (2013: $1.3m) of the Group’s investment in PT Sinar Meadow International Indonesia was recognised. The Group recognised a gain of $0.2m (2013: $0.1m) on investment in PT Sinar Meadow International Indonesia arising on translation of the Group’s share of net assets. PT Sinar Meadow International Indonesia (incorporated in Indonesia) Ownership interest Carrying value of investment 2014201320142013 $m$m$m$m 50.0%50.0% 11.25.5 20142013 $m$m Carrying amount of investment in partnership 11.25.5 20142013 $m$m Joint venture’s assets and liabilities Current assets 14.316.2 Non-current assets 7.85.2 Total assets 22.121.4 Current liabilities 5.3 5.8 Non-current liabilities 4.44.6 Total liabilities 9.710.4 Net assets 12.411.0 Joint venture’s revenue, expenses and results Revenue 50.247.1 Expenses (46.0)(42.5) Profit before income tax 4.24.6 GOODMAN FIELDER ANNUAL REPORT 2014 113 GOODMAN FIELDER ANNUAL REPORT 2014 Notes to the Consolidated Financial Statements (continued) 40Reconciliation of profit after income tax to net cash inflow from operating activities 20142013 $m$m (Loss)/profit for the year (398.0)109.8 Depreciation and amortisation 73.166.8 Impairment charge 358.23.0 Insurance recoveries –(23.8) Net (gain)/loss on sale of property, plant and equipment 4.7(4.6) Net loss/(gain) on disposal of business 97.3(9.1) Reversal of previous period impairments on joint venture (5.7)(1.4) Share-based payments 1.31.5 FX movement on US private placement (9.0)28.6 Change in operating assets and liabilities: (Increase)/decrease in trade and other receivables (2.4)53.6 (Increase) in inventories (6.4)(13.2) Increase/(decrease) in derivative financial instruments 9.7(30.6) Decrease in tax receivable 5.14.6 (Increase)/decrease in deferred tax assets (18.5)10.6 Decrease/(increase) in other assets 0.5(3.6) Increase/(decrease) in trade creditors 29.2(25.5) (Decrease)/increase in current tax liability (12.7)1.4 (Decrease)/increase in provisions (8.6)1.6 Increase in deferred tax liabilities 0.59.0 Net cash inflow (outflow) from operating activities 118.3178.7 41Non-cash investing and financing activities The dividend reinvestment plan (DRP) did not apply to any dividends paid in the current or prior year. 42Events occurring after the reporting period On 2 July 2014 Goodman Fielder Limited (“Goodman Fielder”) announced that it had entered into a Scheme Implementation Deed (“Implementation Deed”) with Wilmar International Limited (“Wilmar”) and First Pacific Company Limited (“First Pacific”) under which Wilmar and First Pacific will acquire all the remaining issued equity in Goodman Fielder that they and their related entities do not already own by way of a scheme of arrangement (“Scheme”). Under the terms of the Scheme, Goodman Fielder shareholders will be entitled to receive A$0.675 cash per share subject to all necessary conditions being satisfied or waived and the Scheme becoming effective. The Scheme also allows for Goodman Fielder to pay a final dividend of A$0.01 per share for the year ended 30 June 2014. In the absence of a superior proposal and subject to an independent expert concluding that the Scheme is fair and reasonable and in the best interests of Goodman Fielder shareholders, the Board of Goodman Fielder unanimously recommends that Goodman Fielder shareholders vote in favour of the Scheme. Subject to the same qualifications, all the members of the Goodman Fielder Board will vote (or will procure the voting of) all Director Goodman Fielder shares at the time of the Scheme Meeting in favour of the Scheme. Goodman Fielder has appointed an independent expert to determine whether the Scheme is fair and reasonable and in the best interests of Goodman Fielder shareholders. The independent expert’s report will be included in a Scheme booklet which is expected to be distributed to shareholders later in the calendar year. 114 GOODMAN FIELDER ANNUAL REPORT 2014 GOODMAN FIELDER ANNUAL REPORT 2014 Notes to the Consolidated Financial Statements (continued) The implementation of the Scheme is subject to a number of conditions which include the following: •Goodman Fielder shareholders approving the Scheme at a Scheme Meeting (requiring approval from a majority in number of shareholders who vote and at least 75% of the total number of shares voted); •all necessary regulatory approvals being obtained, including approval from the Foreign Investment Review Board in Australia, the Overseas Investment Office in New Zealand and the Ministry of Commerce (MOFCOM) in China; •no material adverse change, ‘prescribed occurrence’ or regulatory restraint; and •Court approval of the Scheme. Subject to finalisation of the Scheme, Goodman Fielder will have an obligation in respect of advisory fees relating to the transaction. At balance date the Scheme had not completed and amounts payable cannot be reasonably quantified. Other than stated above, there have been no events subsequent to reporting date which would have a material effect on the Group’s financial statements at 30 June 2014. 43Earnings per share (A) BASIC EARNINGS PER SHARE 20142013 CentsCents Profit/(loss) from continuing operations attributable to the owners of Goodman Fielder Limited (20.7) 4.3 Profit/(loss) from discontinued operations attributable to the owners of Goodman Fielder Limited –1.0 (20.7)5.3 (B) DILUTED EARNINGS PER SHARE 20142013 CentsCents Profit/(loss) from continuing operations attributable to the owners of Goodman Fielder Limited –1.0 (20.7)5.2 Profit/(loss) from discontinued operations attributable to the owners of Goodman Fielder Limited (20.7)4.2 (C) RECONCILIATION OF EARNINGS USED IN CALCULATING EARNINGS PER SHARE 20142013 $m$m Basic and diluted earnings per share Profit attributable to the ordinary equity holders of the Company used in calculating basic earnings per share: Loss/profit for the year from continuing operations (398.0) 90.8 Profit for the year from discontinued operation –19.0 Less: Profit attributable to non-controlling interests (7.1)(7.3) (405.1)102.5 (D) WEIGHTED AVERAGE NUMBER OF SHARES USED AS DENOMINATOR 20142013 Number Number mm Weighted average number of ordinary shares (basic) 1,955.61,955.6 Adjustments for calculation of diluted earnings per share: Effect of share rights on issue –14.1 Weighted average number of ordinary and potential ordinary shares used as the denominator in calculating diluted earnings per share 1,955.61,969.7 In the current year, the impact of dilutive potential ordinary shares that were in existence during the year was not included as the Group is in a loss position. GOODMAN FIELDER ANNUAL REPORT 2014 115 GOODMAN FIELDER ANNUAL REPORT 2014 Notes to the Consolidated Financial Statements (continued) 44Parent entity financial information (A) SUMMARY FINANCIAL INFORMATION As at, and throughout, the financial year ended 30 June 2014 the legal parent entity of the group was Goodman Fielder Limited. The individual financial statements for Goodman Fielder Limited show the following aggregate amounts: 20142013 $m$m Financial position at year end Current assets 0.13.6 Non-current assets 2,512.42,841.3 Total assets 2,512.52,844.9 Current liabilities 2.4– Non-current liabilities 4.23.3 Total liabilities 6.63.3 Net assets 2,505.92,841.6 Total equity comprises: Contributed equity(i) 2,673.62,673.6 Retained earnings to 30 June 2012 89.8115.4 Retained earnings for the year ended 30 June 2013 –52.6 Retained earnings for the year ended 30 June 2014 (257.5)– 2,505.92,841.6 Profit or (loss) for the year(ii) (257.5)(180.9) Other comprehensive income for the year –233.5 Total comprehensive income (257.5)52.6 (i)In the prior year, on 20 June 2013, the parent entity reduced its contributed equity by $233.5 million in accordance with section 258F of the Corporations Act 2001, eliminating the prior year retained loss of the parent entity. This reflected the amount of contributed equity that was not represented by available assets at the time of the reduction. There was no impact on the number of issued shares or on the consolidated income statement, consolidated statement of comprehensive income, consolidated statement of changes in equity and consolidated statement of cash flows. This did not result in any gains or losses being recognised in future reporting periods. (ii)In the current year GFL impaired its investment in Goodman Fielder Consumer Foods Pty Limited (“GFCF”) by $338.2 million and Goodman Fielder New Zealand Limited (“GFNZ”) by $130.2 million. The impairment at the GFCF level arose as a result of the sale of the Biscuits business and lower trading performance in the Grocery segment. The impairment at the GFNZ level arose as a result of the sale of the Meats and Pizza businesses and lower trading performance. In the prior year, the parent entity recognised an impairment of $233.5 million in respect of its investment in the wholly owned subsidiary Goodman Fielder Consumer Foods Pty Limited (“GFCF”). Goodman Fielder Limited’s investment in GFCF included $233.5 million attributable to Integro Foods Australia. The impairment at the parent entity level arose as a result of the sale of the Integro Foods Australian business on 2 October 2012, and as such there were no longer any assets or cash flows to support the investment value in the wholly owned subsidiary GFCF. 116 GOODMAN FIELDER ANNUAL REPORT 2014 GOODMAN FIELDER ANNUAL REPORT 2014 Notes to the Consolidated Financial Statements (continued) (B) GUARANTEES ENTERED INTO BY THE PARENT ENTITY (I) FINANCIAL GUARANTEES The parent entity has also given unsecured guarantees in respect of: (i)bank account set off facility of subsidiaries amounting to $10m (2013: $10m); (ii)receivables purchase agreements of subsidiaries amounting to $102.9m (2013: $99.3m); (iii)bank loans and facilities of subsidiaries outside Australia and New Zealand amounting to $10.0m (2013: $10.2m); (iv)bank guarantees of subsidiaries amounting to $6.6m (2013: $5.5m); (v)commodity futures agreement of subsidiaries amounting to a net asset of $nil (2013: nil); (vi)International Swap Dealer Association (ISDA) agreements of subsidiaries amounting to $57.4m (2013: $49.1m). The fair value of these unsecured guarantees of subsidiaries were considered to be immaterial to Goodman Fielder Limited and therefore no liability has been recognised in the financial statements. (II) DEBT FACILITY GUARANTEE Goodman Fielder Limited and a number of its trading subsidiaries are party to a debt facility guarantee for the Group treasury entities. The treasury entities are the primary vehicles through which the Group sources its external debt funding in Australia and New Zealand. Under the provisions of AASB 139 Financial Instruments: Recognition and Measurement as amended by AASB 2005 9, this debt facility guarantee should be accounted for as a Financial Guarantee Contract as detailed in note 1(z) by Goodman Fielder Limited, the parent entity of the Group. In determining the fair value of the guarantee in respect of these entities Goodman Fielder Limited has given consideration to the following: • the probability of default or the entities being wound up while the guarantee is still in place; • the existence of sufficient assets in the entities to meet their debt repayment obligations; and • the likely timing of the potential winding up of these entities. The fair value of the debt facility guarantee in respect of the treasury entities is considered to be immaterial to Goodman Fielder Limited and therefore no liability has been recognised in the financial statements. (III) DEED OF CROSS GUARANTEE Goodman Fielder Limited and certain of its Australian subsidiaries are party to a Deed of Cross Guarantee. Under the provisions of AASB 139 Financial Instruments: Recognition and Measurement as amended by AASB 2005 9, a Deed of Cross Guarantee should be accounted for as a Financial Guarantee Contract as detailed in note 1(z) by Goodman Fielder Limited, the parent entity of the Group. The fair value of the Deed of Cross Guarantee was considered to be immaterial to Goodman Fielder Limited at its inception and at the time of any subsequent amendments, considered to represent the creation of a new deed, and therefore no liability has been recognised in the financial statements. (C) CONTINGENT LIABILITIES OF THE PARENT ENTITY The parent entity did not have any contingent liabilities as at 30 June 2014 (2013: nil). (D) CONTRACTUAL COMMITMENTS FOR THE ACQUISITION OF PROPERTY, PLANT OR EQUIPMENT As at 30 June 2014, the parent entity did not have any contractual commitments for the acquisition of property, plant or equipment (2013: nil). GOODMAN FIELDER ANNUAL REPORT 2014 117 GOODMAN FIELDER ANNUAL REPORT 2014 Directors’ Declaration In the Directors’ opinion: (a)the financial statements and notes set out on pages 58 to 117 are in accordance with the Corporations Act 2001, including: (i)complying with Accounting Standards, the Corporations Regulations 2001 and other mandatory professional reporting requirements, and (ii)giving a true and fair view of the consolidated entity’s financial position as at 30 June 2014 and of its performance for the year ended on that date, and (b)there are reasonable grounds to believe that the Company will be able to pay its debts as and when they become due and payable, and (c)at the date of this declaration, there are reasonable grounds to believe that the members of the extended closed group identified in note 38 will be able to meet any obligations or liabilities to which they are, or may become, subject by virtue of the deed of cross guarantee described in note 38. Note 1(a) confirms that the financial statements also comply with International Financial Reporting Standards as issued by the International Accounting Standards Board. The Directors have been given the declarations by the chief executive officer and chief financial officer required by section 295A of the Corporations Act 2001. This declaration is made in accordance with a resolution of Directors. S Gregg Director CR Delaney Director Sydney 13 August 2014 118 GOODMAN FIELDER ANNUAL REPORT 2014 GOODMAN FIELDER ANNUAL REPORT 2014 Independent Auditor’s Report Independent auditor’s report to the members of Goodman Fielder Limited REPORT ON THE FINANCIAL REPORT We have audited the accompanying financial report of Goodman Fielder Limited (the company), which comprises the consolidated statement of financial position as at 30 June 2014, and consolidated income statement and consolidated statement of profit or loss and other comprehensive income, consolidated statement of changes in equity and consolidated statement of cash flows for the year ended on that date, notes 1 to 44 comprising a summary of significant accounting policies and other explanatory information and the directors’ declaration of the Group comprising the company and the entities it controlled at the year’s end or from time to time during the financial year. DIRECTORS’ RESPONSIBILITY FOR THE FINANCIAL REPORT The directors of the company are responsible for the preparation of the financial report that gives a true and fair view in accordance with Australian Accounting Standards and the Corporations Act 2001 and for such internal control as the directors determine is necessary to enable the preparation of the financial report that is free from material misstatement whether due to fraud or error. In note 1, the directors also state, in accordance with Australian Accounting Standard AASB 101 Presentation of Financial Statements, that the financial statements of the Group comply with International Financial Reporting Standards. AUDITOR’S RESPONSIBILITY Our responsibility is to express an opinion on the financial report based on our audit. We conducted our audit in accordance with Australian Auditing Standards. These Auditing Standards require that we comply with relevant ethical requirements relating to audit engagements and plan and perform the audit to obtain reasonable assurance whether the financial report is free from material misstatement. An audit involves performing procedures to obtain audit evidence about the amounts and disclosures in the financial report. The procedures selected depend on the auditor’s judgement, including the assessment of the risks of material misstatement of the financial report, whether due to fraud or error. In making those risk assessments, the auditor considers internal control relevant to the entity’s preparation of the financial report that gives a true and fair view in order to design audit procedures that are appropriate in the circumstances, but not for the purpose of expressing an opinion on the effectiveness of the entity’s internal control. An audit also includes evaluating the appropriateness of accounting policies used and the reasonableness of accounting estimates made by the directors, as well as evaluating the overall presentation of the financial report. We performed the procedures to assess whether in all material respects the financial report presents fairly, in accordance with the Corporations Act 2001 and Australian Accounting Standards, a true and fair view which is consistent with our understanding of the Group’s financial position and of its performance. We believe that the audit evidence we have obtained is sufficient and appropriate to provide a basis for our audit opinion. INDEPENDENCE In conducting our audit, we have complied with the independence requirements of the Corporations Act 2001. AUDITOR’S OPINION In our opinion: (a) the financial report of the Group is in accordance with the Corporations Act 2001, including: (i)giving a true and fair view of the Group’s financial position as at 30 June 2014 and of its performance for the year ended on that date; and (ii) complying with Australian Accounting Standards and the Corporations Regulations 2001. (b) the financial report also complies with International Financial Reporting Standards as disclosed in note 1. KPMG, an Australian partnership and a member firm of the KPMG network of independent member firms affiliated with KPMG International Cooperative (“KPMG International”), a Swiss entity. Liability limited by a scheme approved under Professional Standards Legislation. GOODMAN FIELDER ANNUAL REPORT 2014 119 GOODMAN FIELDER ANNUAL REPORT 2014 Independent Auditor’s Report (continued) REPORT ON THE REMUNERATION REPORT We have audited the Remuneration Report included in pages 32 to 55 of the directors’ report for the year ended 30 June 2014. The directors of the company are responsible for the preparation and presentation of the remuneration report in accordance with Section 300A of the Corporations Act 2001. Our responsibility is to express an opinion on the remuneration report, based on our audit conducted in accordance with auditing standards. AUDITOR’S OPINION In our opinion, the remuneration report of Goodman Fielder Limited for the year ended 30 June 2014, complies with Section 300A of the Corporations Act 2001. KPMG Kevin Leighton Partner KPMG Sydney 13 August 2014 KPMG, an Australian partnership and a member firm of the KPMG network of independent member firms affiliated with KPMG International Cooperative (“KPMG International”), a Swiss entity. Liability limited by a scheme approved under Professional Standards Legislation. 120 GOODMAN FIELDER ANNUAL REPORT 2014 GOODMAN FIELDER ANNUAL REPORT 2014 Shareholder Information SECURITIES EXCHANGE LISTINGS Goodman Fielder’s ordinary shares are quoted on the Australian (ASX) and New Zealand (NZX) securities exchanges. There are currently 1,955,559,207 ordinary shares on issue. The shares trade under the code GFF on both the ASX and NZX. The share price and details of trading activity are reported in the share market trading data published in daily newspapers. Share prices can also be accessed on the Company’s website or at ww w.asx.c om.au (ASX website) or ww w.nzx.c om (NZX website). The NZX has registered Goodman Fielder as a dual listed issuer. In accordance with Rule 5.1.5 of the NZX Listing Rules, Goodman Fielder is exempt from various NZX Listing Rules which are detailed in Appendix 17 of the NZX Listing Rules. During the 2012 financial year the Company was granted waivers from ASX Listing Rules 3.20, 7.1, 7.40 and 10.11, subject to a number of customary conditions, in connection with a A$259 million capital raising conducted by the Company. The waivers granted by ASX, which are customarily sought in relation to accelerated offers of the nature made by the Company, enabled the offer to be treated as a pro-rata offer (notwithstanding that it involved separate institutional and retail components) and for related parties of the Company to participate in the offer to the extent of their pro-rata entitlements, for the offer to proceed on a timetable as advised to ASX and for shares to be issued under the offer without shareholder approval. As indicated in the retail entitlement offer information booklet despatched to eligible shareholders on 6 October 2011, the waivers also allowed the Company to ignore transactions occurring after the announcement of a trading halt in the Company’s shares (except in connection with registration of transactions that had already occurred) for the purposes of determining entitlements under the offer. The Company was also granted waivers from ASX Listing Rule 10.15.2 in respect of the information provided to shareholders in the Company’s Notices of Annual General Meeting for 2011, 2012 and 2013 seeking shareholder approval in connection with share rights that may have been granted to Mr Delaney (the Company’s Managing Director and Chief Executive Officer) under the Company’s 2012, 2013 and 2014 short-term incentive plans and under Equity Incentive Plan offers made in respect of the 2013 and 2014 financial years. As a result of the waivers granted by the ASX the Company did not need to specify in each Notice of Meeting the maximum number of securities that Mr Delaney may have acquired. Mr Delaney’s entitlement to share rights and shares under the short-term incentive plan for each year was dependent upon achievement of applicable performance targets set by the Board and the number of securities to which he may have become entitled each year was also dependent upon the closing price of the Company’s shares on 29 June 2012 and 28 June 2013 and upon the average of the daily volume weighted average sale price of shares in the Company traded on the ASX (VWAP) over the ten trading days ending 30 June 2014. While these details were not known at the time each approval was sought, the Notices disclosed to shareholders the process by which the actual number of share rights to be granted (if any) would have been determined. (No share rights were granted to Mr Delaney under the 2012, 2013 and 2014 short-term incentive plans as the Board approved payment of the incentive awards entirely in cash, with no deferred share component.) SHARE REGISTRY AUSTRALIA NEW ZEALAND Link Market Services Limited Level 12, 680 George Street Sydney NSW 2000 Locked Bag A14 Sydney South NSW 1235 Link Market Services Limited Level 7, Zurich House 21 Queen Street Auckland, New Zealand PO Box 91976, Auckland 1142 Investor Enquiries: Investor Enquiries: Tel: 1800 178 254 (in Australia only) Tel: +61 1800 178 254 (international) Fax: +61 2 9287 0303 Email: registrars@ linkmarketservices.c om.au Website: ww w.linkmarketservices.c om.au Tel: 0800 150 013 (in New Zealand only) Tel: +61 2 8280 7201 (international) Fax: +64 9 375 5990 Email: enquiries @linkmarketservices.c o.nz Website: ww w.linkmarketservices.c o.nz SHAREHOLDER ENQUIRIES Holders of ordinary shares seeking information on their security holdings, dividend payments or related matters should contact the registrar, Link Market Services Limited. All enquiries relating to shares held on the Australian register must include your Securityholder Reference Number (SRN) or Holder Identification Number (HIN). Your SRN or HIN is recorded on most documents forwarded to you, including your holding statement, CHESS statement and proxy form. Your holder reference number (HRN) or Common Shareholder Number (CSN) and your FASTER Identification Number (FIN) are required for enquiries relating to shares held on the New Zealand register. Holders can also visit Link’s website and access a wide variety of holding information, download instruction forms and make some changes online. TAX FILE NUMBER INFORMATION The Company is obliged to record tax file number or exemption details provided by Australian resident shareholders. While it is not compulsory to provide your tax file number or exemption details, the Company is obliged to deduct tax at the top marginal income tax rate plus Medicare levy from unfranked or partly franked dividends paid to shareholders resident in Australia who have not supplied this information. Forms can be obtained by contacting our registrar. GOODMAN FIELDER ANNUAL REPORT 2014 121 GOODMAN FIELDER ANNUAL REPORT 2014 Shareholder Information (continued) CHANGE OF ADDRESS Please advise the registrar in writing if you have a new postal address. Shareholders sponsored by a broker should advise their broker of any changes. GOODMAN FIELDER COMMUNICATIONS The Annual Report is the main source of information for shareholders, supplemented by Company announcements. The Company also issues an Annual Review, which provides detail and discussion of the Company’s overall performance for the financial year, including financial, operational, strategic and sustainability measures, and is another option for obtaining information about the Company. The Annual Report, Annual Review and announcements made to the ASX and the NZX are available for viewing on the Company’s website, ww w.goodmanfielder.c om.au. You can subscribe via our registrar’s website, ww w.linkmarketservices.c om.au, to receive email notification of certain of the Company’s announcements. Shareholders wishing to receive a printed copy of the Annual Report should advise the share registry in writing or via our registrar’s website. SUBSTANTIAL SHAREHOLDERS As at 15 September 2014, the following substantial shareholdings had been advised to the Company: Ordinary Shares Anthoni Salim, Salerni International Limited(1)191,644,802 DFA Group 117,742,914 Ellerston Capital Limited(2)208,060,942 First Pacific Company Limited(2)389,081,183 Harris Associates LP 148,190,933 Letko, Brosseau & Associates Inc. 120,927,130 Kuok Brothers Sdn Berhad, Kerry Group Limited, Kuok (Singapore) Limited 197,436,381 (3) Perpetual Limited(2)174,851,623 Wilmar International Limited(2)389,081,183 (1)The named investors and their related bodies corporate collectively have voting power of more than 20% in First Pacific Company Limited (First Pacific) and are therefore deemed to have a relevant interest in the shares in the Company in which First Pacific has an interest. (2)First Pacific and Wilmar International Limited (Wilmar) have made a joint proposal to acquire all of the issued shares of the Company by way of a scheme of arrangement. The voting power disclosed by First Pacific and Wilmar reflects the entry into conditional share sale agreements on 15 May 2014, by a wholly owned subsidiary of First Pacific, for the acquisition of 48,888,980 shares in the Company from each of Ellerston Capital Limited (Ellerston) and a subsidiary of Perpetual Limited (Perpetual), conditional upon receipt of Foreign Investment Review Board Approval (as defined in the share sale agreements) for the acquisition of those shares. At 15 September 2014, Foreign Investment Review Board Approval had not yet been received and the shares continued to be included in the balances disclosed above by Ellerston and Perpetual. (3)The named companies and their related bodies corporate collectively have voting power of more than 20% in Wilmar and are therefore deemed to have a relevant interest in the shares in the Company in which Wilmar has an interest. HOLDERS OF EACH CLASS OF EQUITY SECURITY* As at 15 September 2014, the distribution and number of holders of ordinary shares, together with holders holding less than a marketable parcel, were as follows: Number of Ordinary Shares Held Number of Holders % of Holders Number of Shares % of Issued Capital 1 – 1,000 4,165 20.5 3,105,418 0.16 1,001 – 5,000 9,477 46.7 23,042,932 1.18 5,001 – 10,000 2,892 14.3 21,947,042 1.12 10,001 – 100,000 3,552 17.5 88,160,636 4.51 100,001 and over 211 1.0 1,819,303,179 93.03 Totals Holding less than a marketable parcel * 122 20,297 100.01,955,559,207100.00 1,602 These numbers are the number of holders as shown on the relevant registers. Beneficial holdings may differ. GOODMAN FIELDER ANNUAL REPORT 2014 GOODMAN FIELDER ANNUAL REPORT 2014 Shareholder Information (continued) VOTING RIGHTS At a general meeting, shareholders entitled to vote may vote in person or by proxy, attorney or representative. Every person present who is a shareholder or has been appointed a proxy, attorney or representative has one vote on a show of hands and, on a poll, every shareholder who is present in person or by proxy, attorney or representative has one vote for each fully paid ordinary share held. Where a person present at a general meeting represents more than one shareholder, on a show of hands that person is entitled to one vote only. TWENTY LARGEST SHAREHOLDERS AT 15 SEPTEMBER 2014* Number of Ordinary Shares Held % of Ordinary Shares Held HSBC Custody Nominees (Australia) Limited 498,116,799 25.47 J P Morgan Nominees Australia Limited 406,162,051 20.77 UBS Nominees Pty Ltd 235,129,374 12.02 National Nominees Limited 178,035,616 9.10 Citicorp Nominees Pty Limited 128,289,382 6.56 Oceanica Developments Limited<Oceanica A/C> 93,866,842 4.80 RBC Investor Services Australia Nominees Pty Limited 60,537,098 3.09 Pan Australian Nominees Pty Limited 54,845,961 2.80 BNP Paribas Noms Pty Ltd 40,032,584 2.05 Warbont Nominees Pty Ltd<Accumulation Entrepot A/C> 23,606,544 1.21 12,241,957 0.63 CS Fourth Nominees Pty Ltd 7,774,906 0.40 QIC Limited 6,856,160 0.35 Morgan Stanley Australia Securities (Nominee) Pty Limited<No 1 Account> 6,782,778 0.35 W Singapore Holdings Pte Ltd 5,791,579 0.30 AMP Life Limited 4,651,680 0.24 Narra Holdings Pty Ltd<Lawrence Narra Family A/C> 3,052,900 0.16 MLEQ Nominees Pty Limited<Settle1 A/C> 2,680,656 0.14 Mr Anthony Phillip Maurici 2,593,000 0.13 Goldman Sachs Australia Pty Ltd<House Omni A/C> 2,400,000 0.12 BNP Paribas Nominees Pty Ltd Total 1,773,447,86790.69 Total issued ordinary shares at 15 September 2014 1,955,559,207 * As advised by the share registry; beneficial holdings may differ. As advised by the share registry, at 15 September 2014, the Company had 20,297 ordinary shareholders of which the 20 largest holders held over 1,773 million of the approximately 1,956 million ordinary shares on issue. There are 16,599 ordinary shareholders with registered addresses in Australia, 3,581 in New Zealand and 117 with registered addresses elsewhere, primarily in the United Kingdom, Hong Kong, Singapore and the United States of America. GOODMAN FIELDER ANNUAL REPORT 2014 123 GOODMAN FIELDER ANNUAL REPORT 2014 Company Information GOODMAN FIELDER LIMITED 2014 FINAL DIVIDEND ABN 51 116 399 430 1 cent/share REGISTERED OFFICE T2, 39 Delhi Road Record Date: 15 September 2014 Payment Date: 1 October 2014 North Ryde NSW 2113 SECURITIES EXCHANGE LISTINGS (CODE GFF) Australia Australia (Locked Bag 2222, North Ryde NSW 2113) New Zealand Telephone: +61 2 8899 7000 Facsimile: +61 2 8026 4200 AUSTRALIAN SHARE REGISTRY Website: ww w.goodmanfielder.c om.au Link Market Services Limited DIRECTORS Sydney NSW 2000 Mr Steven Gregg (Chairman) Australia Mr Chris Delaney (Managing Director and CEO) (Locked Bag A14, Sydney South NSW 1235) Mr Ian Cornell Telephone: 1800 178 254 (in Australia) Ms Jan Dawson Telephone: +61 1800 178 254 (International) Ms Chris Froggatt Fax: +61 2 9287 0303 Mr Peter Hearl Fax for proxy voting: +61 2 9287 0309 Mr Clive Hooke Email: registrars @linkmarketservices.c om.au Mr Ian Johnston Website: ww w.linkmarketservices.c om.au COMPANY SECRETARY NEW ZEALAND SHARE REGISTRY Ms Sara Goldstein Link Market Services Limited AUDITOR KPMG 10 Shelley Street Sydney NSW 2000 2014 ANNUAL GENERAL MEETING 20 November 2014 at 10.30am Patrick Goodman and George Fielder Rooms Level 1, T2, 39 Delhi Road North Ryde NSW 2113 124 GOODMAN FIELDER ANNUAL REPORT 2014 Level 12, 680 George Street Level 7, Zurich House 21 Queen Street Auckland, New Zealand (PO Box 91976, Auckland 1142 New Zealand) Telephone: 0800 150 013 (in New Zealand) Telephone: +61 2 8280 7201 (International) Fax: +64 9 375 5990 Email: [email protected] Website: ww w.linkmarketservices.co.nz GOODMAN FIELDER ANNUAL REVIEW 2014 Designed and produced by Sdirect Pty Ltd. For more information on our performance throughout the year, please visit ww w.goodmanfielder.c om.au for the online Goodman Fielder Annual Review 2014. ww w.goodmanfielder.c om.au

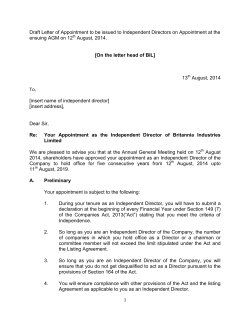


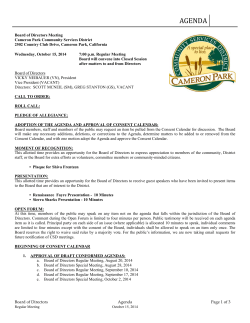

© Copyright 2026