
DHIS2 Implementation Guide 2.16
DHIS2 Implementation Guide
2.16
© 2006-2014
DHIS2 Documentation Team
Revision 1274
Version 2.16 2014-10-21 12:00:34
Warranty: THIS DOCUMENT IS PROVIDED BY THE AUTHORS ''AS IS'' AND ANY EXPRESS
OR IMPLIED WARRANTIES, INCLUDING, BUT NOT LIMITED TO, THE IMPLIED
WARRANTIES OF MERCHANTABILITY AND FITNESS FOR A PARTICULAR PURPOSE ARE
DISCLAIMED. IN NO EVENT SHALL THE AUTHORS OR CONTRIBUTORS BE LIABLE FOR
ANY DIRECT, INDIRECT, INCIDENTAL, SPECIAL, EXEMPLARY, OR CONSEQUENTIAL
DAMAGES (INCLUDING, BUT NOT LIMITED TO, PROCUREMENT OF SUBSTITUTE
GOODS OR SERVICES; LOSS OF USE, DATA, OR PROFITS; OR BUSINESS INTERRUPTION)
HOWEVER CAUSED AND ON ANY THEORY OF LIABILITY, WHETHER IN CONTRACT,
STRICT LIABILITY, OR TORT (INCLUDING NEGLIGENCE OR OTHERWISE) ARISING IN
ANY WAY OUT OF THE USE OF THIS MANUAL AND PRODUCTS MENTIONED HEREIN,
EVEN IF ADVISED OF THE POSSIBILITY OF SUCH DAMAGE.
License: Permission is granted to copy, distribute and/or modify this document under the terms of the
GNU Free Documentation License, Version 1.3 or any later version published by the Free Software
Foundation; with no Invariant Sections, no Front-Cover Texts, and no Back-Cover Texts. A copy
of the license is included in the source of this documentation, and is available here online: http://
www.gnu.org/licenses/fdl.html.
ii
DHIS2 Implementation Guide
Contents
1. Recommendations for National HIS Implementations ............................................................................. 1
1.1. Database development ............................................................................................................ 1
1.2. Import and mapping of existing databases ................................................................................. 1
1.3. Securing necessary resources for the implementation ................................................................... 1
1.4. Integration of parallel systems ................................................................................................. 1
1.5. Setup of a reliable online national server ................................................................................... 2
1.6. Pilot phase ........................................................................................................................... 2
1.7. Roll out ............................................................................................................................... 2
1.8. Training ............................................................................................................................... 3
1.9. Decentralization of data capture and management ....................................................................... 3
1.10. Review and extension ........................................................................................................... 3
2. Conceptual Design Principles ............................................................................................................. 5
2.1. All meta data can be added and modified through the user interface ............................................... 5
2.2. A flexible data model supports different data sources to be integrated in one single data repository ........ 5
2.3. Data input != Data output ....................................................................................................... 6
2.4. Indicator-driven data analysis and reporting ............................................................................... 6
2.5. Maintain disaggregated facility-data in the database ..................................................................... 7
2.6. Support data analysis at any level in the health system ................................................................. 7
3. Setting Up a New Database ............................................................................................................... 9
3.1. Strategies for getting started .................................................................................................... 9
3.2. Controlled or open process? .................................................................................................... 9
3.3. Steps for developing a database ............................................................................................... 9
3.3.1. The organisational hierarchy ....................................................................................... 10
3.3.2. Data Elements .......................................................................................................... 10
3.3.3. Data sets and data entry forms ..................................................................................... 10
3.3.4. Validation rules ......................................................................................................... 11
3.3.5. Indicators ................................................................................................................. 11
3.3.6. Report tables and reports ............................................................................................ 11
3.3.7. GIS (Maps) .............................................................................................................. 11
3.3.8. Charts and dashboard ................................................................................................. 11
4. Deployment Strategies .................................................................................................................... 13
4.1. Offline Deployment ............................................................................................................. 13
4.2. Online deployment ............................................................................................................... 13
4.3. Hybrid deployment .............................................................................................................. 14
4.4. Server hosting ..................................................................................................................... 14
5. DHIS 2 as Data Warehouse ............................................................................................................. 17
5.1. Data warehouses and operational systems ................................................................................ 17
5.2. Aggregation strategy in DHIS 2 ............................................................................................. 18
5.3. Data storage approach .......................................................................................................... 19
6. End-user Training ........................................................................................................................... 21
6.1. What training is needed ........................................................................................................ 21
6.2. Strategies for training ........................................................................................................... 21
6.2.1. Training of trainers .................................................................................................... 21
6.2.2. Workshops and on-site training .................................................................................... 21
6.2.3. Continuation of training ............................................................................................. 22
6.3. Material and courses ............................................................................................................ 22
7. Integration ..................................................................................................................................... 23
7.1. Integration and interoperability ............................................................................................... 23
7.2. Benefits of integration .......................................................................................................... 23
7.3. What facilitates integration and interoperability ......................................................................... 24
7.4. Architecture of interoperable HIS ........................................................................................... 24
8. Installation .................................................................................................................................... 27
8.1. Server specifications ............................................................................................................. 27
8.2. Server setup ........................................................................................................................ 27
8.2.1. Creating a user to run DHIS2 ...................................................................................... 27
8.2.2. Operating system kernel tuning .................................................................................... 28
8.2.3. Setting server time zone and locale .............................................................................. 28
iii
DHIS2 Implementation Guide
Contents
8.2.4. PostgreSQL installation .............................................................................................. 28
8.2.5. PostgreSQL performance tuning .................................................................................. 29
8.2.6. Database configuration ............................................................................................... 30
8.2.7. Install Java ............................................................................................................... 30
8.2.8. Install Tomcat and DHIS2 .......................................................................................... 30
8.2.9. Running DHIS2 ........................................................................................................ 31
8.3. Reverse proxy configuration .................................................................................................. 31
8.3.1. Basic setup for nginx ................................................................................................. 31
8.3.2. Enabling SSL on nginx .............................................................................................. 32
8.3.3. Enabling caching and SSL on nginx ............................................................................. 33
8.3.4. Starting tomcat on boot-time ....................................................................................... 34
8.3.5. Making resources available with nginx .......................................................................... 35
8.3.6. App setup with nginx ................................................................................................. 36
8.3.7. Basic reverse proxy setup with Apache ......................................................................... 36
8.3.8. Basic load-balancing with Apache and Tomcat ............................................................... 37
8.3.9. Basic SSL encryption with Apache ............................................................................... 38
8.4. DHIS 2 Live setup ............................................................................................................... 39
8.5. Backup ............................................................................................................................... 39
8.6. Working with the PostgreSQL database ................................................................................... 39
8.7. Using Amazon Web services ................................................................................................. 40
9. Support ......................................................................................................................................... 43
9.1. Home page: dhis2.org ........................................................................................................... 43
9.2. Collaboration platform: launchpad.net/dhis2 ............................................................................. 43
9.3. Reporting a problem ............................................................................................................. 43
10. Organisation Units ........................................................................................................................ 45
10.1. Organisation unit hierarchy design ........................................................................................ 45
10.2. Organisation unit groups and group sets ................................................................................. 46
11. Data Elements and Custom Dimensions ........................................................................................... 47
11.1. Data elements .................................................................................................................... 47
11.2. Categories and custom dimensions ........................................................................................ 47
11.3. Data element groups ........................................................................................................... 48
12. Data Sets and Forms ..................................................................................................................... 49
12.1. What is a data set? ............................................................................................................. 49
12.2. What is a data entry form? .................................................................................................. 49
12.2.1. Types of data entry forms ......................................................................................... 49
12.2.1.1. Default forms ............................................................................................... 49
12.2.1.2. Section forms ............................................................................................... 49
12.2.1.3. Custom Forms .............................................................................................. 50
12.3. From paper to electronic form - Lessons learned ..................................................................... 50
12.3.1. Identify self-contained data elements ........................................................................... 50
12.3.2. Leave calculations and repetitions to the computer - capture raw data only ......................... 50
13. Data Quality ................................................................................................................................ 53
13.1. Measuring data quality ........................................................................................................ 53
13.2. Reasons for poor data quality ............................................................................................... 53
13.3. Improving data quality ........................................................................................................ 53
13.4. Using DHIS 2 to improve data quality ................................................................................... 53
13.4.1. Data input validation ................................................................................................ 53
13.4.2. Min and max ranges ................................................................................................ 54
13.4.3. Validation rules ....................................................................................................... 54
13.4.4. Outlier analysis ....................................................................................................... 54
13.4.5. Completeness and timeliness reports ........................................................................... 54
14. Indicators .................................................................................................................................... 55
14.1. What is an indicator? .......................................................................................................... 55
14.2. Purpose of indicators .......................................................................................................... 55
14.3. Indicator-driven data collection ............................................................................................. 56
14.4. Managing indicators ........................................................................................................... 56
15. Users and User Roles .................................................................................................................... 57
iv
DHIS2 Implementation Guide
Contents
15.1. Users ............................................................................................................................... 57
15.2. User Roles ........................................................................................................................ 57
16. Data Analysis Tools Overview ........................................................................................................ 59
16.1. Data analysis tools ............................................................................................................. 59
16.1.1. Standard reports ...................................................................................................... 59
16.1.2. Data set reports ....................................................................................................... 59
16.1.3. Data completeness report .......................................................................................... 59
16.1.4. Static reports ........................................................................................................... 59
16.1.5. Organisation unit distribution reports .......................................................................... 60
16.1.6. Report tables ........................................................................................................... 60
16.1.7. Charts .................................................................................................................... 60
16.1.8. Web Pivot tables ..................................................................................................... 60
16.1.9. GIS ....................................................................................................................... 60
16.1.10. My Datamart and Excel Pivot tables ......................................................................... 60
17. Pivot Tables and the MyDataMart tool ............................................................................................. 63
17.1. Pivot table design ............................................................................................................... 63
17.2. Connecting to the DHIS 2 database ....................................................................................... 64
17.3. Dealing with large amounts of data ....................................................................................... 64
17.4. The MyDatamart tool ......................................................................................................... 64
17.5. Using Excel pivot tables and MyDatamart - a work-flow example ............................................... 65
17.5.1. Download and run the MyDatamart tool for the first time ............................................... 65
17.5.2. Setup and distribute the pivot tables ............................................................................ 66
17.5.3. Update MyDatamart ................................................................................................. 66
17.5.4. Update the Pivot tables ............................................................................................. 66
17.5.5. Repeat step 3 and 4 when new data is available on the central server ................................. 66
18. DHIS as a platform ....................................................................................................................... 67
18.1. Web portals ....................................................................................................................... 68
18.2. Apps ................................................................................................................................ 69
18.3. Information Systems ........................................................................................................... 69
19. Localization concepts .................................................................................................................... 71
19.1. DHIS 2 i18n tool ............................................................................................................... 71
19.2. Using the DHIS 2 translation server ...................................................................................... 74
19.3. Important localization concepts ............................................................................................. 75
20. DHIS2 Tools Guide ...................................................................................................................... 77
20.1. Overview .......................................................................................................................... 77
20.2. Architecture ...................................................................................................................... 77
20.3. Installation ........................................................................................................................ 78
20.4. DHIS2 tools reference ........................................................................................................ 79
20.5. Troubleshooting guide ......................................................................................................... 87
A. DHIS 2 Documentation Guide ......................................................................................................... 89
A.1. DHIS 2 Documentation System Overview ............................................................................... 89
A.2. Introduction ........................................................................................................................ 89
A.3. Getting started with GitHub .................................................................................................. 89
A.4. Getting the document source ................................................................................................. 90
A.5. Editing the documentation .................................................................................................... 90
A.6. Using images ..................................................................................................................... 90
A.7. Linking documents together .................................................................................................. 91
A.8. Handling multilingual documentation ..................................................................................... 91
A.9. Building the documentation .................................................................................................. 91
A.9.1. Building the documentation with Apache maven ............................................................ 92
A.9.2. Building with xmlto .................................................................................................. 92
A.10. Committing your changes back to GitHub ............................................................................. 92
(2.16)
v
Recommendations for National HIS
Implementations
Database development
Chapter 1. Recommendations for
National HIS Implementations
The following text gives a brief overview of some of the key aspects of HIS implementations learned by HISP
from numerous missions in developing countries. The various aspects can be used as input for planning of new
implementation efforts or evaluation of ongoing processes.
1.1. Database development
When developing a new database a natural start is to define the data elements for which to capture data and to design
the data entry forms. The data elements are the core building blocks of the database and must be reasonable stable
before moving on. The next step could be to define validation rules based on the mentioned data elements to be able
to better ensure the correctness of the data being captured.
The other core component of the database is the organisational hierarchy which should be identified and set up in the
initial phase. The health facilities are generally the source of the data and the organisational hierarchy is locating the
facilities in both the geographical and in the administrative dimension. In most countries there is no strictly defined
and continuously updated “master registry” for health facilities, hence this process needs to involve the different
stakeholders including the district level as they will be the ones who have best knowledge about the situation.
1.2. Import and mapping of existing databases
Bringing in existing data to the new system adds significant value in the initial phase as it makes it a lot easier to
demonstrate analysis capabilities such as charts and reports. This improves the ability to convince stakeholders such as
health programs and donors to support the new system. In most cases there exists a large amount of electronically stored
data from in-house database systems, excel sheets or other third party systems. This data should whenever possible be
imported and mapped to the data elements and the organisational units (locations/facilities) of the new system with
whatever feasible technical solution. This should be regarded as a one-time job for boot-strapping the database and
does not have to turn into an elegant and reusable routine.
1.3. Securing necessary resources for the implementation
Doing a national roll-out is an expensive effort which requires appropriate funding for aspects mentioned in the
following including procurement of hardware, server hosting, internal and external training workshops. The funding
could be retrieved from the government budget and/or with help from external donors. It is vital that even relatively
small amounts needed for instance for airtime for mobile Internet modem are budgeted for and provided in order to
avoid frustrations and unnecessary problems for end users.
1.4. Integration of parallel systems
The typical government health domain has a lot of existing players and systems. Fist it is apparent that an integrated
database containing data from various sources becomes a lot more valuable and useful than fragmented and isolated
ones. For instance it improves usefulness when analysis of epidemiological data is combined with specialized HIV/
AIDS, TB, financial and human resource data, or when immunization is combined with logistics/stock data as it will
give a more complete picture of the situation. Second there is typically a lot of overlapping data elements being captured
by the various parallel systems. For instance will HIV/AIDS related data elements be captured both by both multiple
general counselling and testing programs and the specialized HIV/AIDS program, or data elements related to malaria
in pregnancy will be captured by both the reproductive health program and the malaria program. Harmonization the
data collection tools of such programs will reduce the total workload of the end users. This implies that such data
1
Recommendations for National HIS
Implementations
Setup of a reliable online national server
sources should be integrated into the national information system and harmonized with the existing data elements,
which involves both data entry and data analysis requirements and requires a flexible and extensible information system
software. It is thus important that individual discussions and work are done with all relevant stakeholders including
all health programs.
1.5. Setup of a reliable online national server
As the technological development moves on most countries have a mobile network and coverage for a certain part of
the districts. The use of networked based information systems accessed over the Internet (also referred to as “cloud
computing”) combined with Internet modems using the mobile network is a great approach for rapid scaling. This
assumes a reliable online server at the national level. The recommended approach is to procure such hosting services
from external providers (such as Linode and Amazon) which relieves the government of providing necessary features
such as back-up electricity solutions, regular data backup, server maintenance and security and reliable Internet/
network access. A typical concern is policy and in-country location of the data storage but this can be mitigated with
special arrangements with the provider.
1.6. Pilot phase
Before initiating the national system roll out a pilot phase is required, typically for all districts in a province/region. The
objective is to field test and get feedback on the system from all stakeholders. Typically end users will provide feedback
on the data entry experience, involving the data entry form designs, the usability of the data entry functionality, content
of reports and other analysis tools, the feasibility of doing online data entry (modem and airtime accessibility) or offline
data entry (reliability of local installation). Typically one will experience some resistance from end-users regarding the
change from paper based to electronic systems paradigms, for instance related to the decoupling of data entry forms
and data analysis tools. One gets to test the feasibility of the network connectivity and the national server configuration
with regard to performance and up-time.
In the situation where one has a running legacy system it is vital to shut that system down in the pilot area. If the legacy
system is still in production the primary focus of the end users will be on entering data in that system and the piloted
system will get peripheral attention with suboptimal testing and learning as a result. If maintaining the legacy system
is a priority then the data should be transferred by the technical team without burdening the end users.
1.7. Roll out
The roll out process is traditionally associated with installation and basic training of the system. It is, however, useful
to consider it as a more comprehensive process involving multiple phases.
The first phase corresponds to the traditional activities where the first objective is about data completeness: To ensure
that close to 100% of the data is being collected. First this implies that the system should be implemented and used at all
districts in the country. Second it implies that data for all data elements included in the forms are actually reported by
the districts or facilities. Data being reported within a reasonable time frame - timeliness - is also relevant in this context.
The second objective is related to data quality: To ensure that data capture errors are reduced to a minimum. Several
measures should be effected to achieve this: First data entry and data review should be done by skilled personnel.
Second automatic data evaluation methods such as logical validation rules and outlier analysis should be applied to
the data.
The second phase is about enabling district and hospital officers to use standard analysis tools such as reports, charts
an pivot tables. Users should be able to find and execute those tools with relevant data. This must be followed by a
basic understanding of the purpose, meaning and consequences of those tools and of the data being analyzed.
The third phase involves data usage: Regular use of data analysis to improve evaluation, planning and monitoring of
health activities at all levels. Data from the information system should be used to evaluate the effects of implemented
measures by looking at key indicators. That learning should later be used to make informed decisions on future
2
Recommendations for National HIS
Implementations
Training
planning. For instance when low immunization rates are discovered through an immunization report coming from the
information system an outreach vaccination campaign could be effectuated. The effects of the campaign could then
be monitored and evaluated based on up-to-date reports and informed decisions made on whether to intensify or wind
down. The system could later provide information regarding what quantity of vaccine doses which must be ordered
from the supplier.
To accommodate for large-scale roll out processes a detailed plan must be made for training and follow-up as covering
all districts in a country represents a logistical challenge in terms of workshop venues, trainers, participants, equipment
and hardware. To speed up the process several teams could give parallel trainings.
1.8. Training
Most of the objectives mentioned in the roll out section depends heavily on appropriate user training. User training
can be conducted in several ways. An effective activity, especially for getting started, is training workshops. Users
such as district and province record officers, district managers, data entry officers and health program managers are
gathered and given training. Training should be done as a combination of theoretical lectures and hands-on practise
on relevant subjects mentioned in the roll out section such as data entry, validation and analysis. Participants should
be kept at a manageable number depending on the facilities and number of trainers available. Sufficient hardware for
all participants to do practical work must be provided.
Another useful activity is on-the-job training which has the advantage that users get individual follow-up in their home
working environment. This provides the ability to help with individual specific needs or questions and sort any issues
related to hardware. Also, giving individual support will often boost the motivation and ownership feeling of end users.
The period between a workshop and on the-the-job training can be used for home work assignments, where users
typically are assigned to create meaningful analysis for their district or province. This work can then be given feedback
on and used as basis for individual training.
1.9. Decentralization of data capture and management
Migrating from paper based systems or primitive databases to full-fledged web based health information systems and
from capturing district based aggregated data to facility based data entails new possibilities for decentralized data
management which should be exploited. Firstly the facilities with sufficient hardware and network connectivity should
be tasked with entering their own data. This will reduce the workload of the district health records officer who might
use the freed up time for data analysis, data use, feedback to facilities and data quality efforts. Secondly maintenance
of the facility hierarchy in terms of facility classification and health services provided at the facilities is a resource
demanding task and should be decentralized and done as a joint effort by all district officers rather than by a single
national team. This will make the facility information more correct and up to date since the district officers have
better knowledge of their local situation and have incentives for proper management as it will eventually affect their
performance indicators and data completeness scores.
1.10. Review and extension
A national HIS is a growing organism which needs to be maintained. As the system usage increases more requirements
and needs will emerge from new and existing stakeholders such as district record officers and health program staff.
Regular review meetings including such stakeholders should take place where data capture tools, such as data elements
and forms, and data analysis tools, such as indicators and reports, should be revised and new tools potentially added.
Also, new functionality requirements should be managed and appropriate software development resources should be
secured. Such regular activities for supporting the extension and enhancement of the system are vital to maintain the
current momentum and learning processes and to improve long-term project sustainability.
3
Conceptual Design Principles
All meta data can be added and modified
through the user interface
Chapter 2. Conceptual Design Principles
This chapter provides a introduction to some of the key conceptual design principles behind the DHIS 2 software.
Understanding and being aware of these principles will help the implementer to make better use of the software when
customising a local database. While this chapter introduces the principles, the following chapters will detail out how
these are reflected in the database design process.
The following conceptual design principles will be presented in this chapter:
• All meta data can be added and modified through the user interface
• A flexible data model supports different data sources to be integrated in one single data repository
• Data Input != Data Output
• Indicator-driven data analysis and reporting
• Maintain disaggregated facility-data in the database
• Support data analysis at any level in the health system
In the following section each principle is described in more detail.
2.1. All meta data can be added and modified through the user interface
The DHIS 2 application comes with a set of generic tools for data collection, validation, reporting and analysis, but
the contents of the database, e.g. what data to collect, where the data comes from, and on what format, will depend
on the context of use. This meta data need to be populated into the application before it can be used, and this can be
done through the user interface and requires no programming. This allows for more direct involvement of the domain
experts that understand the details of the HIS that the software will support.
The software separates the key meta data that describes the raw data being stored in the database, which is the critical
meta data that should not change much over time (to avoid corrupting the data), and the higher level meta like indicator
formulas, validation rules, and groups for aggregation as well as the various layouts for collection forms and reports,
which are not that critical and can be changed over time without interfering with the raw data. As this higher level
meta data can be added and modified over time without interfering with the raw data, a continuous customisation
process is supported. Typically new features are added over time as the local implementation team learn to master
more functionality, and the users are gradually pushing for more advanced data analysis and reporting outputs.
2.2. A flexible data model supports different data sources to be integrated
in one single data repository
The DHIS 2 design follows an integrated approach to HIS, and supports integration of many different data sources into
one single database, sometime referred to as an integrated data repository or a data warehouse.
The fact that DHIS 2 is a skeleton like tool without predefined forms or reports means that it can support a lot of
different aggregate data sources. There is nothing really that limits the use to the health domain either, although use in
other sectors are still very limited. As long as the data is collected by and orgunit, described as a data element (possibly
with some disaggregation categories), and can be represented by a predefined period frequency, it can be collected and
processed in DHIS 2. This flexibility makes DHIS 2 a powerful tool to set up integrated systems that bring together
collection tools, indicators, and reports from multiple health programs, departments or initiatives. Once the data is
defined and then collected or imported into a DHIS 2 database, it can be analysed in correlation to any other data in
the same database, no matter how and by whom it was collected. In addition to supporting integrated data analysis and
reporting, this integrated approach also helps to rationalise data collection and reduce duplication.
5
Conceptual Design Principles
Data input != Data output
2.3. Data input != Data output
In DHIS 2 there are three dimensions that describe the aggregated data being collected and stored in the database;
the where - organisation unit, the what - data element, and the when - period. The organisation unit, data element and
period make up the three core dimensions that are needed to describe any data value in the DHIS 2, whether it is in a
data collection form, a chart, on a map, or in an aggregated summary report. When data is collected in an electronic
data entry form, sometimes through a mirror image of the paper forms used at facility level, each entry field in the
form can be described using these three dimensions. The form itself is just a tool to organise the data collection and
is not describing the individual data values being collected and stored in the database. Being able to describe each
data value independently through a Data Element definition (e.g. ‘Measles doses given <1 year’) provides important
flexibility when processing, validating, and analysing the data, and allows for comparison of data across collection
forms and health programs.
This design or data model approach separates DHIS from many of the traditional HIS software applications which treat
the data collection forms as the key unit of analysis. This is typical for systems tailored to vertical programs’ needs
and the traditional conceptualisation of the collection form as also being the report or the analysis output. The figure
below illustrates how the more fine-grained DHIS design built around the concept of Data Elements is different and
how the input (data collection) is separated from the output (data analysis), supporting more flexible and varied data
analysis and dissemination. The data element ‘Measles doses given <1 y’ is collected as part of a Child Immunisation
collection form, but can be used individually to build up an Indicator (a formula) called ‘Measles coverage <1y’ where
it is combined with the data element called ‘Population <1y’, being collected through another collection form. This
calculated Indicator value can then be used in data analysis in various reporting tools in DHIS 2, e.g. custom designed
reports with charts, pivot tables, or on a map in the GIS module.
2.4. Indicator-driven data analysis and reporting
What is referred to as a Data Element above, the key dimension that describes what is being collected, is sometimes
referred to as an indicator in other settings. In DHIS 2 we distinguish between Data Elements which describe the the
6
Conceptual Design Principles
Maintain disaggregated facility-data in the
database
raw data, e.g. the counts being collected, and Indicators, which are formula-based and describe calculated values, e.g.
coverage or incidence rates that are used for data analysis. Indicator values are not collected like the data (element)
values, but instead calculated by the application based on formulas defined by the users. These formulas are made up
of a factor (e.g. 1, 100, 100, 100 000), a numerator and a denominator, the two latter are both expressions based on
one or more data elements. E.g. the indicator "Measles coverage <1 year" is defined a formula with a factor 100, a
numerator ("Measles doses given to children under 1 year") and a denominator ("Target population under 1 year"). The
indicator "DPT1 to DPT3 drop out rate" is a formula of 100 % x ("DPT1 doses given"- "DPT3doses given") / ("DPT1
doses given"). These formulas can be added and edited through the user interface by a user with limited training, as
they are quite easy to set up and do not interfere with the data values stored in the database (so adding or modifying
an indicator is not a critical operation).
Indicators represent perhaps the most powerful data analysis feature of the DHIS 2, and all reporting tools support the
use of indicators, e.g. as displayed in the custom report in the figure above. Being able to use population data in the
denominator enables comparisons of health performance across geographical areas with different target populations,
which is more useful than only looking at the raw numbers. The table below uses both the raw data values (Doses)
and indicator values (Cov) for the different vaccines. Comparing e.g. the two first orgunits in the list, Taita Taveta
County and Kilifi County, on DPT-1 immunisation, we can see that while the raw numbers (659 vs 2088) indicate
many more doses are given in Kilifi, the coverage rates (92.2 % vs 47.5 %) show that Taita Taveta are doing a better job
immunising their target population under 1 year. Looking at the final column (Immuniz. Compl. %) which indicates
the completeness of reporting of the immunisation form for the same period, we can see that the numbers are more
or less the same in the two counties we compared, which tells us that the coverage rates can be reasonably compared
across the two counties.
2.5. Maintain disaggregated facility-data in the database
When data is collected and stored in DHIS 2 it will remain disaggregated in the database with the same level of detail
as it was collected. This is a major advantage of having a database system for HIS as supposed to a paper-based or
even spreadsheet based system. The system is designed to store large amounts of data and always allow drill-downs
to the finest level of detail possible, which is only limited by how the data was collected or imported into the DHIS 2
database. In a perspective of a national HIS it is desired to keep the data disaggregated by health facility level, which
is often the lowest level in the orgunit hierarchy. This can be done even without computerising this level, through a
hybrid system of paper and computer. The data can be submitted from health facilities to e.g. district offices by paper
(e.g. on monthly summary forms for one specific facility), and then at the district office they enter all the facility data
into the DHIS 2 through the electronic data collection forms, one facility at a time. This will enable the districts health
management teams to perform facility-wise data analysis and to e.g. provide print-outs of feedback reports generated
by the DHIS 2, incl. facility comparisons, to the facility in-charges in their district.
2.6. Support data analysis at any level in the health system
While the name DHIS indicates a focus on the District, the application provides the same tools and functionality to all
levels in the health system. In all the reporting tools the users can select which orgunit or orgunit level to analyse and
the data displayed will be automatically aggregated up to the selected level. The DHIS 2 uses the orgunit hierarchy in
7
Conceptual Design Principles
Support data analysis at any level in the
health system
aggregating data upwards and provides data by any orgunit in this hierarchy. Most of the reports are run in such a way
that the users will be prompted to select an orgunit and thereby enable reuse the same report layouts for all levels. Or of
desired, the report layouts can be tailored to any specific level in the health system if the needs differ between the levels.
In the GIS module the users can analyse data on e.g. the sub-national level and then by clicking on the map (on e.g.
a region or province) drill down to the next level, and continue like this all the way down to the source of the data
at facility level. Similar drill-down functionality is provided in the Excel Pivot Tables that are linked to the DHIS 2
database.
To speed up performance and reduce the response-time when providing aggregated data outputs, which may include
many calculations (e.g. adding together 8000 facilities), DHIS 2 pre-calculates all the possible aggregate values and
stores these in what is called a data mart. This data mart can be scheduled to run (re-built) at a given time interval,
e.g. every night.
8
Setting Up a New Database
Strategies for getting started
Chapter 3. Setting Up a New Database
The DHIS 2 application comes with a set of tools for data collection, validation, reporting and analysis, but the contents
of the database, e.g. what data to collect, where the data comes from, and on what format will depend on the context
of use. This meta data need to be populated into the application before it can be used, and this can be done through
the user interface and requires no programming. What is required is in-depth knowledge about the local HIS context
as well as an understanding of the DHIS 2 design principles (see the chapter “Key conceptual design principles in
DHIS 2”). We call this initial process for database design or customisation. This chapter provides an overview of the
customisation process and briefly explains the steps involved, in order to give the implementer a feeling of what this
process requires. Other chapters in this manual provide a lot more detail into some of the specific steps.
3.1. Strategies for getting started
The following section describes a list of tips for getting off with a good start when developing a new database.
1. Quickly populate a demo database, incl. examples of reports, charts, dashboard, GIS, data entry forms. Use real
data, ideally nation-wide, but not necessarily facility-level data.
2. Put the demo database online. Server hosting with an external provider server can be a solution to speed up the
process, even if temporary. This makes a great collaborative platform and dissemination tool to get buy-in from
stakeholders.
3. The next phase is a more elaborate database design process. Parts of the demo can be reused if viable.
4. Make sure to have a local team with different skills and background: public health, data administrator, IT and project
management.
5. Use the customisation and database design phase as a learning and training process to build local capacity through
learning-by-doing.
6. The country national team should drive the database design process but be supported and guided by experienced
implementers.
3.2. Controlled or open process?
As the DHIS 2 customisation process often is and should be a collaborative process, it is also important to have in
mind which parts of the database that are more critical than others, e.g. to avoid an untrained user to corrupt the data.
Typically it is a lot more critical to customise a database which already has data values, than working with meta data
on an “empty” database. Although it might seem strange, much customisation takes place after the first data collection
or import has started, e.g. when adding new validation rules, indicators or report layouts. The most critical mistake
that can be made is to modify the meta data that directly describes the data values, and these as we have seen above,
are the data elements and the organisation units. When modifying these definitions it is important to think about how
the change will affect the meaning of the data values already in the system (collected using the old definitions). It is
recommended to limit who can edit these core meta data through the user role management, to restrict the access to
a core customisation team.
Other parts of the system that are not directly coupled to the data values are a lot less critical to play around with, and
here, at least in the early phases, one should encourage the users to try out new things in order to create learning. This
goes for groups, validation rules, indicator formulas, charts, and reports. All these can easily be deleted or modified
later without affecting the underlying data values, and therefore are not critical elements in the customisation process.
Of course, later in the customisation process when going into a production phase, one should be even more careful in
allowing access to edit the various meta data, as any change, also to the less critical meta data, might affect how data
is aggregated together or presented in a report (although the underlying raw data is still safe and correct).
3.3. Steps for developing a database
The following section describes concrete steps for developing a database from scratch.
9
Setting Up a New Database
The organisational hierarchy
3.3.1. The organisational hierarchy
The organisational hierarchy defines the organisation using the DHIS 2, the health facilities, administrative areas and
other geographical areas used in data collection and data analysis. This dimension to the data is defined as a hierarchy
with one root unit (e.g. Ministry of Health) and any number of levels and nodes below. Each node in this hierarchy is
called an organisational unit in DHIS 2. The design of this hierarchy will determine the geographical units of analysis
available to the users as data is collected and aggregated in this structure. There can only be one organisational hierarchy
at the same time so its structure needs careful consideration.
Additional hierarchies (e.g. parallel administrative boundaries to the health care sector) can be modelled using
organisational groups and group sets, but the organisational hierarchy is the main vehicle for data aggregation on the
geographical dimension. Typically national organisational hierarchies in public health have 4-6 levels, but any number
of levels is supported. The hierarchy is built up of parent-child relations, e.g. a Country or MoH unit (the root) might
have e.g. 8 child units (provinces), and each province again ( at level 2) might have 10-15 districts as their children.
Normally the health facilities will be located at the lowest level, but they can also be located at higher levels, e.g.
national or provincial hospitals, so skewed organisational trees are supported (e.g. a leaf node can be positioned at
level 2 while most other leaf nodes are at level 5).
3.3.2. Data Elements
The Data Element is perhaps the most important building block of a DHIS 2 database. It represents the what dimension,
it explains what is being collected or analysed. In some contexts this is referred to an indicator, but in DHIS 2 we call
this unit of collection and analysis a data element. The data element often represents a count of something, and its
name describes what is being counted, e.g. "BCG doses given" or "Malaria cases". When data is collected, validated,
analysed, reported or presented it is the data elements or expressions built upon data elements that describes the WHAT
of the data. As such the data elements become important for all aspects of the system and they decide not only how
data is collected, but more importantly how the data values are represented in the database, which again decides how
data can be analysed and presented.
A best practice when designing data elements is to think of data elements as a unit of data analysis and not just as a
field in the data collection form. Each data element lives on its own in the database, completely detached from the
collection form, and reports and other outputs are based on data elements and expressions/formulas composed of data
elements and not the data collection forms. So the data analysis needs should drive the process, and not the look an
feel of the data collection forms.
3.3.3. Data sets and data entry forms
All data entry in DHIS 2 is organised through the use of data sets. A data set is a collection of data elements grouped
together for data collection, and in the case of distributed installs they also define chunks of data for export and import
between instances of DHIS 2 (e.g. from a district office local installation to a national server). Data sets are not linked
directly to the data values, only through their data elements and frequencies, and as such a data set can be modified,
deleted or added at any point in time without affecting the raw data already captured in the system, but such changes
will of course affect how new data will be collected.
Once you have assigned a data set to an organisation unit that data set will be made available in Data Entry (under
Services) for the organisation units you have assigned it to and for the valid periods according to the data set's period
type. A default data entry form will then be shown, which is simply a list of the data elements belonging to the data
set together with a column for inputting the values. If your data set contains data elements with categories such as age
groups or gender, then additional columns will be automatically generated in the default form based on the categories.
In addition to the default list-based data entry form there are two more alternatives, the section-based form and the
custom form. Section forms allow for a bit more flexibility when it comes to using tabular forms and are quick and
simple to design. Often your data entry form will need multiple tables with subheadings, and sometimes you need
to disable (grey out) a few fields in the table (e.g. some categpories do not apply to all data elements), both of these
functions are supported in section forms. When the form you want to design is too complicated for the default or section
forms then your last option is to use a custom form. This takes more time, but gives you full flexibility in term of the
design. In DHIS 2 there is a built in HTML editor (FcK Editor) for the form designer and you can either design the
form in the UI or paste in your html directly (using the Source window in the editor.
10
Setting Up a New Database
Validation rules
3.3.4. Validation rules
Once you have set up the data entry part of the system and started to collect data then there is time to define data
quality checks that help to improve the quality of the data being collected. You can add as many validation rules as
you like and these are composed of left and right side expressions that again are composed of data elements, with an
operator between the two sides. Typical rules are comparing subtotals to totals of something. E.g. if you have two data
elements "HIV tests taken" and "HIV test result positive" then you know that in the same form (for the same period
and organisational unit) the total number of tests must always be equal or higher than the number of positive tests.
These rules should be absolute rules meaning that they are mathematically correct and not just assumptions or "most
of the time correct". The rules can be run in data entry, after filling each form, or as a more batch like process on
multiple forms at the same time, e.g. for all facilities for the previous reporting month. The results of the tests will list
all violations and the detailed values for each side of the expression where the violation occurred to make it easy to
go back to data entry and correct the values.
3.3.5. Indicators
Indicators represent perhaps the most powerful data analysis feature of the DHIS 2. While data elements represent the
raw data (counts) being collected the indicators represent formulas providing coverage rates, incidence rates, ratios
and other formula-based units of analysis. An indicator is made up of a factor (e.g. 1, 100, 100, 100 000), a numerator
and a denominator, the two latter are both expressions based on one or more data elements. E.g. the indicator "BCG
coverage <1 year" is defined a formula with a factor 100, a numerator ("BCG doses given to children under 1 year")
and a denominator ("Target population under 1 year"). The indicator "DPT1 to DPT3 drop out rate" is a formula of
100 % x ("DPT1 doses given"- "DPT3 doses given") / ("DPT1 doses given").
Most report modules in DHIS 2 support both data elements and indicators and you can also combine these in custom
reports, but the important difference and strength of indicators versus raw data (data element's data values) is the ability
to compare data across different geographical areas (e.g. highly populated vs rural areas) as the target population can
be used in the denominator.
Indicators can be added, modified and deleted at any point in time without interfering with the data values in the
database.
3.3.6. Report tables and reports
Standard reports in DHIS 2 is a very flexible way of presenting the data that has been collected. Data can be aggregated
by any organisational unit or orgunit level, by data element, by indicators, as well as over time (e.g. monthly, quarterly,
yearly). The report tables are custom data sources for the standard reports and can be flexibly defined in the user
interface and later accessed in external report designers such as iReport or BIRT. These report designs can then be set
up as easily accessible one-click reports with parameters so that the users can run the same reports e.g. every month
when new data is entered, and also be relevant to users at all levels as the organisational unit can be selected at the
time of running the report.
3.3.7. GIS (Maps)
In the integrated GIS module you can easily display your data on maps, both on polygons (areas) and as points (health
facilities), and either as data elements or indicators. By providing the coordinates of your organisational units to the
system you can qucikly get up to speed with this module. See the GIS section for details on how to get started.
3.3.8. Charts and dashboard
On of the easiest way to display your indicator data is through charts. An easy to use chart dialogue will guide you
through the creation of various types of charts with data on indicators, organisational units and periods of your choice.
These charts can easily be added to one of the four chart sections on your dashboard and there be made easily available
right after log in. Make sure to set the dashboard module as the start module in user settings.
11
Deployment Strategies
Offline Deployment
Chapter 4. Deployment Strategies
DHIS 2 is a network enabled application and can be accessed over the Internet, a local intranet and as a locally
installed system. The deployment alternatives for DHIS 2 are in this chapter defined as i) offline deployment ii) online
deployment and iii) hybrid deployment. The meaning and differences will be discussed in the following sections.
4.1. Offline Deployment
An offline deployment implies that multiple standalone offline instances are installed for end users, typically at the
district level. The system is maintained primarily by the end users/district health officers who enters data and generate
reports from the system running on their local server. The system will also typically be maintained by a national superuser team who pay regular visits to the district deployments. Data is moved upwards in the hierarchy by the end users
producing data exchange files which are sent electronically by email or physically by mail or personal travel. (Note
that the brief Internet connectivity required for sending emails does not qualify for being defined as online). This style
of deployment has the obvious benefit that it works when appropriate Internet connectivity is not available. On the
other side there are significant challenges with this style which are described in the following section.
• Hardware: Running stand-alone systems requires advanced hardware in terms of servers and reliable power supply
to be installed, usually at district level, all over the country. This requires appropriate funding for procurement and
plan for long-term maintenance.
• Software platform: Local installs implies a significant need for maintenance. From experience, the biggest challenge
is viruses and other malware which tend to infect local installations in the long-run. The main reason is that end
users utilize memory sticks for transporting data exchange files and documents between private computers, other
workstations and the system running the application. Keeping anti-virus software and operating system patches up to
date in an offline environment are challenging and bad practises in terms of security are often adopted by end users.
The preferred way to overcome this issue is to run a dedicated server for the application where no memory sticks
are allowed and use an Linux based operating system which is not as prone for virus infections as MS Windows.
• Software application: Being able to distribute new functionality and bug-fixes to the health information software to
users are essential for maintenance and improvement of the system. Relying on the end users to perform software
upgrades requires extensive training and a high level of competence on their side as upgrading software applications
might a technically challenging task. Relying on a national super-user team to maintain the software implies a lot
of travelling.
• Database maintenance: A prerequisite for an efficient system is that all users enter data with a standardized metadata set (data elements, forms etc). As with the previous point about software upgrades, distribution of changes to
the meta-data set to numerous offline installations requires end user competence if the updates are sent electronically
or a well-organized super-user team. Failure to keep the meta-data set synchronized will lead to loss of ability to
move data from the districts and/or an inconsistent national database since the data entered for instance at the district
level will not be compatible with the data at the national level.
4.2. Online deployment
An online deployment implies that a single instance of the application is set up on a server connected to the Internet.
All users (clients) connect to the online central server over the Internet using a web browser. This style of deployment
currently benefits from the huge investments in and expansions of mobile networks in developing countries. This
makes it possible to access online servers in even the most rural areas using mobile Internet modems (also referred
to as dongles).
This online deployment style has huge positive implications for the implementation process and application
maintenance compared to the traditional offline standalone style:
• Hardware: Hardware requirements on the end-user side are limited to a reasonably modern computer/laptop and
Internet connectivity through a fixed line or a mobile modem. There is no need for a specialized server, any Internet
enabled computer will be sufficient.
13
Deployment Strategies
Hybrid deployment
• Software platform: The end users only need a web browser to connect to the online server. All popular operating
systems today are shipped with a web browser and there is no special requirement on what type or version. This
means that if severe problems such as virus infections or software corruption occur one can always resort to reformatting and installing the computer operating system or obtain a new computer/laptop. The user can continue
with data entry where it was left and no data will be lost.
• Software application: The central server deployment style means that the application can be upgraded and maintained
in a centralized fashion. When new versions of the applications are released with new features and bug-fixes it can
be deployed to the single online server. All changes will then be reflected on the client side the next time end users
connect over the Internet. This obviously has a huge positive impact for the process of improving the system as new
features can be distributed to users immediately, all users will be accessing the same application version, and bugs
and issues can be sorted out and deployed on-the-fly.
• Database maintenance: Similar to the previous point, changes to the meta-data can be done on the online server
in a centralized fashion and will automatically propagate to all clients next time they connect to the server. This
effectively removes the vast issues related to maintaining an upgraded and standardized meta-data set related to the
traditional offline deployment style. It is extremely convenient for instance during the initial database development
phase and during the annual database revision processes as end users will be accessing a consistent and standardized
database even when changes occur frequently.
This approach might be problematic in cases where Internet connectivity is volatile or missing in long periods of time.
DHIS 2 however has certain features which requires Internet connectivity to be available only only part of the time for
the system to work properly, such as the MyDatamart tool presented in a separate chapter in this guide.
4.3. Hybrid deployment
From the discussion so far one realizes that the online deployment style is favourable over the offline style but requires
decent Internet connectivity where it will be used. It is important to notice that the mentioned styles can co-exist in
a common deployment. It is perfectly feasible to have online as well as offline deployments within a single country.
The general rule would be that districts and facilities should access the system online over the Internet where sufficient
Internet connectivity exist, and offline systems should be deployed to districts where this is not the case.
Defining decent Internet connectivity precisely is hard but as a rule of thumb the download speed should be minimum
10 Kbyte/second and accessibility should be minimum 70% of the time.
In this regard mobile Internet modems which can be connected to a computer or laptop and access the mobile network
is an extremely capable and feasible solution. Mobile Internet coverage is increasing rapidly all over the world, often
provide excellent connectivity at low prices and is a great alternative to to local networks and poorly maintained
fixed Internet lines. Getting in contact with national mobile network companies regarding post-paid subscriptions
and potential large-order benefits can be a wort-while effort. The network coverage for each network operator in the
relevant country should be investigated when deciding which deployment approach to opt for as it might differ and
cover different parts of the country.
4.4. Server hosting
The online deployment approach raises the question of where and how to host the server which will run the DHIS 2
application. Typically there are several options:
1. Internal hosting within the Ministry of Health
2. Hosting within a government data centre
3. Hosting through an external hosting company
The main reason for choosing the first option is often political motivation for having “physical ownership” of the
database. This is perceived as important by many in order to “own” and control the data. There is also a wish to build
local capacity for server administration related to sustainability of the project. This is often a donor-driven initiatives
as it is perceived as a concrete and helpful mission.
14
Deployment Strategies
Server hosting
Regarding the second option, some places a government data centre is constructed with a view to promoting and
improving the use and accessibility of public data. Another reason is that a proliferation of internal server environments
is very resource demanding and it is more effective to establish centralized infrastructure and capacity.
Regarding external hosting there is lately a move towards outsourcing the operation and administration of computer
resources to an external provider, where those resources are accessed over the network, popularly referred to as “cloud
computing” or “software as a service”. Those resources are typically accessed over the Internet using a web browser.
The primary goal for an online server deployment is provide long-term stable and high-performance accessibility to the
intended services. When deciding which option to choose for server environment there are many aspects to consider:
1. Human capacity for server administration and operation. There must be human resources with general skills in
server administration and in the specific technologies used for the application providing the services. Examples of
such technologies are web servers and database management platforms.
2. Reliable solutions for automated backups, including local off-server and remote backup.
3. Stable connectivity and high network bandwidth for traffic to and from the server.
4. Stable power supply including a backup solution.
5. Secure environment for the physical server regarding issues such as access, theft and fire.
6. Presence of a disaster recovery plan. This plan must contain a realistic strategy for making sure that the service will
be only suffering short down-times in the events of hardware failures, network downtime and more.
7. Feasible, powerful and robust hardware.
All of these aspects must be covered in order to create an appropriate hosting environment. The hardware requirement
is deliberately put last since there is a clear tendency to give it too much attention.
Looking back at the three main hosting options, experience from implementation missions in developing countries
suggests that all of the hosting aspects are rarely present in option one and two at a feasible level. Reaching an acceptable
level in all these aspects is challenging in terms of both human resources and money, especially when compared to the
cost of option three. It has the benefit that is accommodates the mentioned political aspects and building local capacity
for server administration, on the other hand can this be provided for in alternative ways.
Option three - external hosting - has the benefit that it supports all of the mentioned hosting aspects at a very affordable
price. Several hosting providers - of virtual servers or software as a service - offer reliable services for running most
kinds of applications. Example of such providers are Linode and Amazon Web Services. Administration of such servers
happens over a network connection, which most often anyway is the case with local server administration. The physical
location of the server in this case becomes irrelevant as that such providers offer services in most parts of the world. This
solution is increasingly becoming the standard solution for hosting of application services. The aspect of building local
capacity for server administration is compatible with this option since a local ICT team can be tasked with maintaining
the externally hosted server.
An approach for combining the benefits of external hosting with the need for local hosting and physical ownership is
to use an external hosting provider for the primary transactional system, while mirroring this server to a locally hosted
non-critical server which is used for read-only purposes such as data analysis and accessed over the intranet.
15
DHIS 2 as Data Warehouse
Data warehouses and operational systems
Chapter 5. DHIS 2 as Data Warehouse
This chapter will discuss the role and place of the DHIS 2 application in a system architecture context. It will show
that DHIS 2 can serve the purpose of both a data warehouse and an operational system.
5.1. Data warehouses and operational systems
A data warehouse is commonly understood as a database used for analysis. Typically data is uploaded from various
operational / transactional systems. Before data is loaded into the data warehouse it usually goes through various
stages where it is cleaned for anomalies and redundancy and transformed to conform with the overall structure of the
integrated database. Data is then made available for use by analysis, also known under terms such as data mining
and online analytical processing. The data warehouse design is optimized for speed of data retrieval and analysis. To
improve performance the data storage is often redundant in the sense that the data is stored both in its most granular
form and in an aggregated (summarized) form.
A transactional system (or operational system from a data warehouse perspective) is a system that collects, stores and
modifies low level data. This system is typically used on a day-to-day basis for data entry and validation. The design
is optimized for fast insert and update performance.
There are several benefits of maintaining a data warehouse, some of them being:
• Consistency: It provides a common data model for all relevant data and acts as an abstraction over a potentially high
number of data sources and feeding systems which makes it a lot easier to perform analysis.
• Reliability: It is detached from the sources where the data originated from and is hence not affected if data in the
operational systems is purged or lost.
• Analysis performance: It is designed for maximum performance for data retrieval and analysis in contrast to
operational system which are often optimized for data capture.
There are however also significant challenges with a data warehouse approach:
• High cost: There is a high cost associated with moving data from various sources into a common data warehouse,
especially when the operational systems are not similar in nature. Often long-term existing systems (referred to as
legacy systems) put heavy constraints on the data transformation process.
• Data validity: The process of moving data into the data warehouse is often complex and hence often not performed
at regular and timely intervals. This will then leave the data users with out-dated and irrelevant data not suitable for
planning and informed decision making.
Due to the mentioned challenges it has lately become increasingly popular to merge the functions of the data warehouse
and operational system, either into a single system which performs both tasks or with tightly integrated systems hosted
17
DHIS 2 as Data Warehouse
Aggregation strategy in DHIS 2
together. With this approach the system provides functionality for data capture and validation as well as data analysis
and manages the process of converting low-level atomic data into aggregate data suitable for analysis. This sets high
standards for the system and its design as it must provide appropriate performance for both of those functions; however
advances in hardware and parallel processing is increasingly making such an approach feasible.
In this regard, the DHIS 2 application is designed to serve as a tool for both data capture, validation, analysis and
presentation of data. It provides modules for all of the mentioned aspects, including data entry functionality and a wide
array of analysis tools such as reports, charts, maps, pivot tables and dashboard.
In addition, DHIS 2 is a part of a suite of interoperable health information systems which covers a wide range of
needs and are all open-source software. DHIS 2 implements the standard for data and meta-data exhange in the health
domain called SDMX-HD. There are many examples of operational systems which also implements this standard and
potenitally can feed data into DHIS 2:
• iHRIS: System for management of human resource data. Examples of data which is relevant for a national data
warehouse captured by this system is "number of doctors", "number of nurses" and "total number of staff". This data
is interesting to compare for instance to district performance.
• OpenMRS: Medical record system being used at hospital. This system can potentially aggregate and export data on
inpatient diseases to a national data warehouse.
• OpenELIS: Laboratory enterprise information system. This system can generate and export data on number and
outcome of laboratory tests.
5.2. Aggregation strategy in DHIS 2
The analysis tools in DHIS 2 reads aggregated data from data mart tables. A data mart is a data store optimized
for meeting the most common user requests for data analysis. The DHIS 2 data mart contains data aggregated
in the space dimension (the organisation unit hierarchy), time dimension (over multiple periods) and for indicator
formulas (mathematical expressions including data elements). Retrieving data directly from data marts provides good
performance even in high-concurrency environments since most requests for analysis can be served with a single,
simple database query against the data mart. The aggregation engine in DHIS 2 is capable of processing low-level data
in the multi-millions and manage most national-level databases, and it can be said to provide near real-time access
to aggregate data.
DHIS 2 allows for setting up scheduled aggregation tasks which typically will refresh and populate the data mart
with aggregated data every night. You can choose between aggregating data for the last 12 months every night, or
18
DHIS 2 as Data Warehouse
Data storage approach
aggregate data for the last 6 months everry night and the last 6 to 12 months every Saturday. The scheduled tasks can
be configured under "Scheduling" in "Data administration" module. It is also possible to execute arbitrary data mart
tasks under "Data mart" in "Reports" module.
5.3. Data storage approach
There are two leading approaches for storing data in a data warehouse, namely the normalized and dimensional
approach. DHIS 2 lends a bit from the former but mostly from the latter. In the dimensional approach the data is
partitioned into dimensions and facts. Facts generally refers to transactional numeric data while dimensions are the
reference data that gives context and meaning to the data. The strict rules of this approach makes it easy for users to
understand the data warehouse structure and provides for good performance since few tables must be combined to
produce meaningful analysis, while it on the other hand might make the system less flexible and harder to change.
In DHIS the facts corresponds to the data value object in the data model. The data value captures data as numbers,
yes/no or text. The compulsory dimensions which give meaning to the facts are the data element, organisation unit
hierarchy and period dimensions. These dimensions are referred to as compulsory since they must be provided for
all stored data records. DHIS 2 also has a custom dimensional model which makes it possible to represent any kind
of dimensionality. This model must be defined prior to data capture. DHIS 2 also has a flexible model of groups and
group sets which makes it possible to add custom dimensionality to the compulsory dimensions after data capture has
taken place. You can read more about dimensionality in DHIS 2 in the chapter by the same name.
19
End-user Training
What training is needed
Chapter 6. End-user Training
The following topics will be covered in this chapter:
• What training is needed
• Strategies for training
• Material and courses
6.1. What training is needed
In a large system like a country health information system, there will be different roles for different people. The different
tasks usually depends on two factors; what the person will be doing, i.e. mainly collect data, or analyse it, or maintain
the database, and where the person is located, like a facility, a district office, or at national level. A first task will then
be to define the different users. The most common tasks will be:
• Data entry
• Data analysis processing, preparing reports and other information products
• Database maintenance - managing changes to the database
Data entry is typically decentralized to lower levels, such as a district. Data processing takes place at all levels, while
database maintenance usually is centralized. The following table gives an example of user groups and what tasks they
typically have:
Note here that many of the tasks are not directly linked to the use of DHIS2. Data analysis, data quality assessment,
preparing feedback and planning regular review meetings are all integral to the functioning of the system, and should
also be covered in a training strategy.
6.2. Strategies for training
To cover the wide array of tasks/users listed above, a training strategy is helpful. The majority of users will be at
lower level; entering and using data. Only a few will have to know the database in-depth, usually at national level. The
following are useful tips for end-user training strategies.
6.2.1. Training of trainers
Since the number of units and staff increase exponentially for each level (a country may have many provinces, each
with many districts, each with many facilities), training of trainers is the first step. The number of trainers will vary,
depending on the speed of implementation envisioned. As described below, both workshops and on-site training are
useful, and especially for the on-site training many people will be needed.
The trainers should be at least at the level of advanced users, in addition knowing how the database is designed, how
to install and troubleshoot DHIS2, and some issues of epidemiology, i.e. concepts that are useful for monitoring and
evaluation of health services. As the capabilities of the staff increase, the trainers would also need to increase their skills.
6.2.2. Workshops and on-site training
Experience has showed that training both in workshops/training sessions, and on-site in real work situations are
complementary. Workshops are better for training many at the same time, and are useful early on in the training
sessions. Preferably the same type of users should be trained.
On-site training takes place at the work-place of the staff. It is useful to have done more organized training session like
in a workshop before, so that on-site training can focus on special issues the individual staff would need more training
on. Training on-site will involve less people, so it will be possible to include different types of users. An example would
21
End-user Training
Continuation of training
be a district training, where the district information officers and the district medical officer can be trained together.
The communication between different users is important in the sense that it forms a common understanding of what is
needed, and what is possible. Training can typically be centred around local requirements such as producing outputs
(reports, charts, maps) that would be useful for local decision-support.
6.2.3. Continuation of training
Training is not a one off thing. A multi-level training strategy would aim at providing regular training as the skills of
the staff increase. For example, a workshop on data entry and validation should be followed by another workshop on
report generation and data analysis some time later. Regular training should also be offered to new staff, and when
large changes are made to the system, such as redesign of all data collection forms.
6.3. Material and courses
There is comprehensive material available for training and courses. The main source will be the three manuals available
from the DHIS2 documentation repository, to be found at here.
The user documentation covers the background and purpose of DHIS2 together with instructions and explanations of
how to perform data entry, system maintenance, meta-data set-up, import and export of data, aggregation, reporting
and other topics related to the usage of the software. The developer documentation covers the technical architecture,
the design of each module and use of the development frameworks behind DHIS2. The implementation guide is
targeted at implementers and super-users and addresses subjects such as system design, database development, data
harmonization, analysis, deployment, human resources needed and integration with other systems. The end user manual
is a light-weight version of the user documentation meant for end users such as district records officers and data entry
clerks. All can be opened/downloaded as both PDF and HTML, and are updated daily with the latest input from DHIS2
users worldwide.
The development of these guides depend on input from all users. For information how to to add content to them, please
see the appendix on documentation in the User Documentation. Here you will also find information about how to make
localized documentation, including versioning in different languages.
From 2011, regional workshops and courses will be held at least once a year by the international DHIS2 community.
The goal is to have national technical teams working with DHIS2 customization and implementation. Sessions will
also include training and capacity building by these teams in-country. End-user training, i.e. training of district M&E
officers, should take place in each county by these teams.
22
Integration
Integration and interoperability
Chapter 7. Integration
This chapter will discuss the following topics:
• Integration and interoperability
• Benefits of integration
• What facilitates integration and interoperability
• Architecture of interoperable HIS
In the following each topic will be discussed in greater detail.
7.1. Integration and interoperability
In a country there will usually be many different, isolated health information systems. The reasons for this are many,
both technical and organizational. Here the focus will be on what benefits integration of these systems will bring, and
why it should be a priority. First, a couple of clarifications:
• When talking about integration, we think about the process of making different information systems appear as one,
i.e. data from them to be available to all relevant users as well as the harmonization of definitions and dimensions
so that it is possible to combine the data in useful ways.
• A related concept is interoperability, which is one strategy to achieve integration. For purposes related to DHIS2, we
say that it is interoperable with other software applications if it is able to share data with this. For example, DHIS2
and OpenMRS are interoperable, because there is support in both to share data definitions and data with each other.
To say that something is integrated, then, means that they share something, and that they are available from one
place, while interoperability usually means that they are able to do this sharing electronically. DHIS2 is often used
as an integrated data warehouse, since it contains (aggregate) data from various sources, such as Mother and Child
health, Malaria program, census data, and data on stocks and human resources. These data sources share the same
platform, DHIS2, and are available all from the same place. These subsystems are thus considered integrated into one
system. Interoperability will then be a useful way to integrate also those data sources available on also other software
applications. For example, if census data is stored in some other database, interoperability between this database and
DHIS2 would mean census data would be accessible in both (but only stored one place).
7.2. Benefits of integration
There are several potential benefits related to integration of systems. The most important are:i
• Calculation of indicators: many indicators are based on numerators and denominators from different data sources.
Examples include mortality rates, including some mortality data as numerator and population data as denominator,
staff coverage and staff workload rates (human resource data, and population and headcount data), immunization
rates, and the like. For these to be calculated, you need both the numerator and denominator data, and they should
thus be integrated into a single data warehouse. The more data sources that are integrated, the more indicators can
be generated from the central repository.
• Reduce manual processing and entering of data: with different data at the same place, there is no need to manually
extract and process indicators, or re-enter data into the data warehouse. Especially interoperability between systems
of different data types (such as patient registers and aggregate data warehouse) allows software for subsystems to
both calculate and share data electronically. This reduces the amount of manual steps involved in data processing,
which increases data quality.
• There are organizational reasons for integration. If all data can be handled by one unit in the ministry of health,
instead of in various subsystems maintained by the health programs, this one unit can be professionalized. With staff
which sole responsibility is data management, processing, and analysis, more specialized skills can be developed
and the information handling be rationalized.
23
Integration
What facilitates integration and
interoperability
7.3. What facilitates integration and interoperability
There are three levels that need to be addressed in this regard:
• The motivation and will to integrate (organizational level)
• Standard definitions (language level)
• Standard for electronic storage and exchange (technical level)
The first level is less of a topic in this guide, which takes as a point of departure that a decision has been taken about
integration of data. However, it is an important issue and usually the most complex to solve given the range of actors
involved in the health sector. Clear national policies on data integration, data ownership, routines for data collection,
processing, and sharing, should be in place to address this issue. Often some period of disturbance to the normal data
flow will take place during integration, so for many the long-term prospects of a more efficient system will have to
be judged against the short-term disturbance. Integration is thus often a step-wise process, where measures need to be
taken for this to happen as smoothly as possible.
At the language level, there is a need to be consistent about definitions. If you have two data sources for the same data,
they need to be comparable. For example, if you collect malaria data from both standard clinics and from hospitals,
this data need to describe the same thing if they need to be combined for totals and indicators. If a hospital is reporting
malaria cases by sex but not age group, and other clinics are reporting by age group but not sex, this data cannot be
analyzed according to either of these dimensions, though a total amount of cases will be possible to calculate. There
is thus a need to agree on uniform definitions.
In addition to uniform definitions across the various sub-systems, data exchange standards must be adopted if data
is to be shared electronically. The various software applications would need this to be able to understand each other.
DHIS2 is supporting several data formats for import and export, but one standard format now supported by WHO is
called SDMX-HD (Statistical Data and Metadata Exchange - Health Domain). Other software applications are also
supporting this, and it allows the sharing of data definitions and aggregate data between them. For DHIS2, this means it
supports import of aggregate data that are supplied by other applications, such as OpenMRS (for patient management),
iHRIS (for human resources management)
7.4. Architecture of interoperable HIS
Since there are many different use-cases for health information, such as monitoring and evaluation, budgeting, patient
management and tracking, logistics management, insurance, human resource management, etc, there will be many
different types of software applications functioning within the health sector. Above the issue of interoperability has
been addressed, and a plan or overview of the various interoperable software applications and their specific uses, along
with what data should be shared between them, is termed an architecture for health information.
The role of the architecture is to function as a plan to coordinate the development and interoperability of various subsystems within the larger health information system. It is advisable to develop a plan for the various components even
if they are not currently running any software, to be able to adequately see the requirements in terms of data sharing.
These requirements should then be part of any specification for the software when such is developed or procured.
Below is a simple illustration of an architecture, with a focus on the data warehouse for aggregate data. The various
boxes represent use cases, such as managing logistics, tracking TB patients, general patient management, etc. All of
these will share aggregate data with DHIS2. Note that the arrows are two-way, because there is also a synchronization
of meta-data (definitions) involved, to make sure that the right data is shared. Also, an example of the logistics and
financial data applications sharing data is also shown, as there are strong links between procuring drugs and handling
the budget for this. There will be many such instances of sharing data; the architecture helps us to plan better for this
being implemented as the ecosystem of software applications grow.
24
Integration
Architecture of interoperable HIS
25
Installation
Server specifications
Chapter 8. Installation
The installation chapter provides information on how to install DHIS 2 in various contexts, including online central
server, offline local network, standalone application and self-contained package called DHIS 2 Live.
DHIS 2 runs on all platforms for which there exists a Java Runtime Environment (version 6 or higher, 7 is
recommended), which includes most popular operating systems such as Windows, Linux and Mac. DHIS 2 also runs
on many relational database systems such as PostgreSQL, MySQL, H2 and Derby. DHIS 2 is packaged as a standard
Java Web Archive (WAR-file) and thus runs on any Servlet containers such as Tomcat and Jetty.
The DHIS 2 team recommends Ubuntu 14.04 LTS operating system, PostgreSQL database system and Tomcat Servlet
container as the preferred environment for server installations. The mentioned frameworks can be regarded as market
leaders within their domain and is heavily field tested over many years.
This chapter provides a guide for setting up the above technology stack. It should however be read as a guide for
getting up and running and not as an exhaustive documentation for the mentioned environment. We refer to the official
Ubuntu, PostgreSQL and Tomcat documentation for in-depth reading.
8.1. Server specifications
DHIS 2 is a database intensive application and requires that your server has an appropriate amount of RAM, number
of CPU cores and a fast disk. These recommendations should be considered as rules-of-thumb and not exact measures.
DHIS 2 scales linearly on the amount of RAM and number of CPU cores so the more you can afford, the better the
application will perform.
• RAM: At least 1 GB memory per 1 million captured data records per month or per 1000 concurrent users. At least
4 GB for a small instance, 12 GB for a medium instance.
• CPU cores: 4 CPU cores for a small instance, 8 CPU cores for a medium or large instance.
• Disk: Ideally use an SSD. Otherwise use a 7200 rpm disk. Minimum read speed is 150 Mb/s, 200 Mb/s is good,
350 Mb/s or better is ideal.
8.2. Server setup
This section describes how to set up a server instance of DHIS 2 on Ubuntu 14.04 64 bit with PostgreSQL as database
system and Tomcat as Servlet container. This guide is not meant to be a step-by-step guide per se, but rather to serve
as a reference to how DHIS2 can be deployed on a server. There are many possible deployment strategies, which
will differ depending on the operating system and database you are using, and other factors. The term invoke refers
to executing a given command in a terminal.
For a national server the recommended configuration is a quad-core 2 Ghz processor or higher and 12 Gb RAM or
higher. Note that a 64 bit operating system is required for utilizing more than 4 Gb of RAM.
For this guide we assume that 8 Gb RAM is allocated for PostgreSQL and 8 GB RAM is allocated for Tomcat/JVM,
and that a 64-bit operating system is used. If you are running a different configuration please adjust the suggested
values accordingly! We recommend that the available memory is split roughly equally between the database and the
JVM. Remember to leave some of the physical memory to the operating system for it to perform its tasks, for instance
around 2 GB. The steps marked as optional, like the step for performance tuning, can be done at a later stage.
8.2.1. Creating a user to run DHIS2
You should create a dedicated user for running DHIS - it is not recommended to run as the root user. Create a new
user called dhis by invoking:
27
Installation
Operating system kernel tuning
useradd -d /home/dhis -m dhis -s /bin/bash
Then make the user able to perform operations temporarily as root user by invoking:
usermod -G sudo dhis
Then to set the password for your account invoke:
passwd dhis
Make sure you set a strong password with at least 15 random characters. You might want to disable remote login for
the root account for improved security by invoking:
sudo passwd -l root
8.2.2. Operating system kernel tuning
These settings are completely optional and does not have to be changed for normal-sized servers. Open the kernel
configuration file by invoking sudo nano /etc/sysctl.conf At the end of the file add the following lines and save.
kernel.shmmax = 4294967296
net.core.rmem_max = 8388608
net.core.wmem_max = 8388608
Load the settings like this:
sudo sysctl -p
8.2.3. Setting server time zone and locale
It may be necessary to reconfigure the time zone of the server to match the time zone of the location which the DHIS2
server will be covering. If you are using a virtual private server, the default time zone may not correspond to the
time zone of your DHIS2 location. You can easily reconfigure the time zone by invoking the below and following
the instructions.
sudo dpkg-reconfigure tzdata
PostgreSQL is sensitive to locales so you might have to install your locale first. To check existing locales and install
new ones (e.g. Russian):
locale -a
sudo locale-gen ru_RU.UTF-8
8.2.4. PostgreSQL installation
Install PostgreSQL 9.3 by invoking:
sudo apt-get install postgresql-9.3
Switch to the postgres user by invoking:
sudo su postgres
Create a non-privileged user called dhis by invoking:
createuser -SDRP dhis
Enter a secure password at the prompt. Create a database by invoking:
createdb -O dhis dhis2
Return to your session by invoking exit You now have a PostgreSQL user called dhis and a database called dhis2.
28
Installation
PostgreSQL performance tuning
8.2.5. PostgreSQL performance tuning
Tuning PostgreSQL is necessary to achieve a high-performing system but is optional in terms of getting DHIS 2 to
run. PostgreSQL is configured and tuned through the postgresql.conf file which can be edited like this:
sudo nano /etc/postgresql/9.3/main/postgresql.conf
and set the following properties:
shared_buffers = 3200MB
Determines how much memory should be allocated exclusively for PostgreSQL caching. This setting controls the size
of the kernel shared memory which should be reserved for PostgreSQL. Should be set to around 40% of total memory
dedicated for PostgreSQL.
work_mem = 20MB
Determines the amount of memory used for internal sort and hash operations. This setting is per connection, per query
so a lot of memory may be consumed if raising this too high. Setting this value correctly is essential for DHIS 2
aggregation performance.
maintenance_work_mem = 512MB
Determines the amount of memory PostgreSQL can use for maintenance operations such as creating indexes, running
vacuum, adding foreign keys. Incresing this value might improve performance of index creation during the analytics
generation processes.
effective_cache_size = 8000MB
An estimate of how much memory is available for disk caching by the operating system (not an allocation) and is
used by PostgreSQL to determine whether a query plan will fit into memory or not. Setting it to a higher value
than what is really available will result in poor performance. This value should be inclusive of the shared_buffers
setting. PostgreSQL has two layers of caching: The first layer uses the kernel shared memory and is controlled by
the shared_buffers setting. PostgreSQL delegates the second layer to the operating system disk cache and the size of
available memory can be given with the effective_cache_size setting.
checkpoint_segments = 32
PostgreSQL writes new transactions to a log file called WAL segments which are 16MB in size. When a number of
segments have been written a checkpoint occurs. Setting this number to a larger value will thus improve performance
for write-heavy systems such as DHIS 2.
checkpoint_completion_target = 0.8
Determines the percentage of segment completion before a checkpoint occurs. Setting this to a high value will thus
spread the writes out and lower the average write overhead.
wal_buffers = 16MB
Sets the memory used for buffering during the WAL write process. Increasing this value might improve throughput
in write-heavy systems.
synchronous_commit = off
Specifies whether transaction commits will wait for WAL records to be written to the disk before returning to the client
or not. Setting this to off will improve performance considerably. It also implies that there is a slight delay between
the transaction is reported successful to the client and it actually being safe, but the database state cannot be corrupted
and this is a good alternative for performance-intensive and write-heavy systems like DHIS 2.
wal_writer_delay = 10000ms
Specifies the delay between WAL write operations. Setting this to a high value will improve performance on writeheavy systems since potentially many write operations can be executed within a single flush to disk.
Restart PostgreSQL by invoking sudo /etc/init.d/postgresql restart
29
Installation
Database configuration
8.2.6. Database configuration
The database connection information is provided to DHIS 2 through a configuration file called hibernate.properties.
Create this file and save it in a convenient location. A configuration file for PostgreSQL corresponding to the above
setup has these properties:
hibernate.dialect = org.hibernate.dialect.PostgreSQLDialect
hibernate.connection.driver_class = org.postgresql.Driver
hibernate.connection.url = jdbc:postgresql:dhis2
hibernate.connection.username = dhis
hibernate.connection.password = xxxx
hibernate.hbm2ddl.auto = update
encryption.password = xxxx
The encryption.password property is the password used when encrypting and decrypting data in the database. It applies
for version 2.16 and later. Note that the password must not be changed once it has been set and data has been encrypted
as the data can then no longer be decrypted. If the database is copied to another server the encryption password must
be identical. Remember to set a strong password of at least 8 characters. A system-provided password will be used if
not set in the configuration file, this can however not be considered secure.
A common mistake is to have a white-space after the last property value so make sure there is no white-space at the
end of any line. Also remember that this file contains the clear text password for your DHIS 2 database so it needs
to be protected from unauthorized access. To do this invoke the following command which ensures that only the dhis
user which owns the file is allowed to read it:
chmod 0600 hibernate.properties
8.2.7. Install Java
Install Java by invoking the following command:
sudo apt-get install openjdk-7-jdk
Check that your installation is okay by invoking:
java -version
8.2.8. Install Tomcat and DHIS2
To install the Tomcat servlet container we will utilize the Tomcat user package by invoking:
sudo apt-get install tomcat7-user
This package lets us easily create a new Tomcat instance. The instance will be created in the current directory. An
appropriate location is the home directory of the dhis user:
tomcat7-instance-create tomcat-dhis
This will create an instance in a directory called tomcat-dhis. Note that the tomcat7-user package allows for creating
any number of dhis instances if that is desired.
Next edit the file tomcat-dhis/bin/setenv.sh and add the lines below. The first line will set the location of your Java
Runtime Environment, the second will dedicate memory to Tomcat and the third will set the location for where DHIS
2 will search for the hibernate.properties configuration file. Please check that the path the Java binaries are correct as
they might vary from system to system, e.g. on AMD systems you might see /java-7-openjdk-amd64 Note that you
should adjust this to your environment:
export JAVA_HOME='/usr/lib/jvm/java-7-openjdk'
export JAVA_OPTS='-Xmx7500m -Xms4000m -XX:MaxPermSize=500m -XX:PermSize=300m'
export DHIS2_HOME='/home/dhis/config'
30
Installation
Running DHIS2
The Tomcat configiration file is located in tomcat-dhis/conf/server.xml. The element which defines the connection to
DHIS is the Connector element with port 8080. You can change the port number in the Connector element to a desired
port if necessary. If UTF-8 encoding of request data is needed, make sure that the URIEncoding attribute is set to UTF-8.
<Connector port="8080" protocol="HTTP/1.1"
connectionTimeout="20000"
redirectPort="8443"
URIEncoding="UTF-8" />
The next step is to download the DHIS 2 WAR file and place it into the webapps directory of Tomcat. You can
download the DHIS version 2.15 WAR release like this (replace 2.15 with your preferred version if necessary):
wget https://www.dhis2.org/download/releases/2.15/dhis.war
Move the WAR file into the Tomcat webapps directory. We want to call the WAR file ROOT.war in order to make
it available at localhost directly without a context path:
mv dhis.war tomcat-dhis/webapps/ROOT.war
8.2.9. Running DHIS2
Make the Tomcat startup script executable by invoking:
chmod +x tomcat-dhis/bin/*.sh
DHIS 2 can now be started by invoking:
tomcat-dhis/bin/startup.sh
DHIS 2 can be stopped by invoking:
tomcat-dhis/bin/shutdown.sh
To monitor the behavior of Tomcat the log is the primary source of information. The log can be viewed with the
following command:
tail -f tomcat-dhis/logs/catalina.out
Assuming that the WAR file is called ROOT.war, you can now access your DHIS instance at the following URL:
http://localhost:8080
8.3. Reverse proxy configuration
A reverse proxy is a proxy server that acts on behalf of a server. Using a reverse proxy in combination with a servlet
container is optional but has many advantages:
• Requests can be mapped and passed on to multiple servlet containers - this improves flexibility and makes it easier
to run multiple instances of DHIS on the same server. It also makes it possible to change the internal server setup
without affecting clients.
• The DHIS application can be run as a non-root user on a port different than 80 which reduces the consequences
of session hijacking.
• The reverse proxy can act as a single SSL server and be configured to inspect requests for malicious content, log
requests and responses and provide non-sensitive error messages which will improve security.
8.3.1. Basic setup for nginx
We recommend using nginx as reverse proxy due to its low memory footprint and ease of use. To install invoke the
following:
sudo apt-get install nginx
31
Installation
Enabling SSL on nginx
nginx can now be started, reloaded and stopped with the following commands:
sudo /etc/init.d/nginx start
sudo /etc/init.d/nginx reload
sudo /etc/init.d/nginx stop
Now that we have installed nginx we will now continue to configure regular proxying of requests to our Tomcat
instance, which we assume runs at http://localhost:8080. To configure nginx you can open the configuration file by
invoking:
sudo nano /etc/nginx/nginx.conf
nginx configuration is built around a hierarchy of blocks representing http, server and location, where each block
inherit settings from parent blocks. The following snippet will configure nginx to proxy pass (redirect) requests from
port 80 (which is the port nginx will listen on by default) to our Tomcat instance. Include the following configuration
in nginx.conf:
http {
gzip on; # Enables compression
server {
listen
80;
root /home/dhis/tomcat/webapps/ROOT; # Update path!
client_max_body_size 10M;
# Proxy pass to servlet container
location / {
proxy_pass
proxy_redirect
proxy_set_header
proxy_set_header
proxy_set_header
proxy_set_header
}
http://localhost:8080/;
off;
Host
$host;
X-Real-IP
$remote_addr;
X-Forwarded-For
$proxy_add_x_forwarded_for;
X-Forwarded-Proto http;
}
}
You can now access your DHIS instance at http://localhost. Since the reverse proxy has been set up we can improve
security by making Tomcat only listen for local connections. In /conf/server.xml you can add an address attribute with
the value localhost to the Connector element for HTTP 1.1 like this:
<Connector address="localhost" protocol="HTTP/1.1" ... >
8.3.2. Enabling SSL on nginx
In order to improve security it is recommended to configure the server running DHIS to communicate with clients over
an encrypted connection and to identify itself to clients using a trusted certificate. This can be achieved through SSL
which is an cryptographic communication protocol running on top of TCP/IP. First, install the required openssl library:
sudo apt-get install openssl
To configure nginx to use SSL you will need a proper SSL certificate from an SSL provider. The cost of a certificate
varies a lot depending on encryption strength. An affordable certificate from Rapid SSL Online should serve most
purposes. To generate the CSR (certificate signing request) you can invoke the command below. When you are
prompted for the Common Name, enter the fully qualified domain name for the site you are securing.
openssl req -new -newkey rsa:2048 -nodes -keyout server.key -out server.csr
When you have received your certificate files (.pem or .crt) you will need to place it together with the generated
server.key file in a location which is reachable by nginx. A good location for this can be the same directory as where
your nginx.conf file is located.
32
Installation
Enabling caching and SSL on nginx
Below is an nginx server block where the certificate files are named server.crt and server.key. Since SSL connections
usually occur on port 443 (HTTPS) we pass requests on that port (443) on to the DHIS instance running on http://
localhost:8080 The first server block will rewrite all requests connecting to port 80 and force the use of HTTPS/SSL.
This is also necessary because DHIS is using a lot of redirects internally which must be passed on to use HTTPS.
Remember to replace <server-ip> with the IP of your server. These blocks should replace the one from the previous
section.
http {
gzip on; # Enables compression
# HTTP server - rewrite to force use of SSL
server {
listen
rewrite
}
80;
^ https://<server-url>$request_uri? permanent;
# HTTPS server
server {
listen
443 ssl;
root /home/dhis/tomcat/webapps/ROOT; # Update path!
client_max_body_size 10M;
ssl
ssl_certificate
ssl_certificate_key
on;
server.crt;
server.key;
ssl_session_cache
ssl_session_timeout
shared:SSL:20m;
10m;
ssl_protocols
ssl_ciphers
ssl_prefer_server_ciphers
TLSv1 TLSv1.1 TLSv1.2;
HIGH:!aNULL:!MD5;
on;
# Proxy pass to servlet container
location / {
proxy_pass
proxy_redirect
proxy_set_header
proxy_set_header
proxy_set_header
proxy_set_header
}
http://localhost:8080/;
off;
Host
$host;
X-Real-IP
$remote_addr;
X-Forwarded-For
$proxy_add_x_forwarded_for;
X-Forwarded-Proto https;
}
}
Note the last "https" header value which is required to inform the servlet container that the request is coming over
HTTPS. In order for tomcat to properly produce Location URLs using https you also need to add two other parameters
to the Connector in tomcat's server.xml file:
<Connector scheme="https" proxyPort="443" ... >
8.3.3. Enabling caching and SSL on nginx
Requests for reports, charts, maps and other analysis-related resources will often take some time to respond and might
utilize a lot of server resources. In order to improve response times, reduce the load on the server and hide potential
server downtime we can introduce a cache proxy in our server setup. The cached content will be stored in directory /
var/cache/nginx, and up to 250 MB of storage will be allocated. Nginx will create this directory automatically.
http {
33
Installation
Starting tomcat on boot-time
# ...
root
proxy_cache_path
gzip
/home/dhis/tomcat/webapps/ROOT; # Update path!
/var/cache/nginx keys_zone=dhis:250m inactive=1d;
on;
# HTTP server - rewrite to force use of HTTPS
server {
listen
rewrite
}
80;
^ https://<server-ip>$request_uri? permanent;
# HTTPS server
server {
listen
443 ssl;
client_max_body_size 10M;
ssl
ssl_certificate
ssl_certificate_key
on;
server.crt;
server.key;
ssl_session_timeout
30m;
ssl_protocols
ssl_ciphers
ssl_prefer_server_ciphers
SSLv2 SSLv3 TLSv1;
HIGH:!aNULL:!MD5;
on;
# Proxy pass to servlet container and potentially cache response
location / {
proxy_pass
proxy_redirect
proxy_set_header
proxy_set_header
proxy_set_header
proxy_set_header
proxy_cache
}
http://localhost:8080/;
off;
Host
$host;
X-Real-IP
$remote_addr;
X-Forwarded-For
$proxy_add_x_forwarded_for;
X-Forwarded-Proto https;
dhis;
}
}
Important
Be aware that a server side cache shortcuts the DHIS 2 security features in the sense that requests which hit the
server side cache will be served directly from the cache outside the control of DHIS 2 and the servlet container.
This implies that request URLs can be guessed and reports retrieved from the cache by unauthorized users.
Hence, if you capture sensitive information, setting up a server side cahce is not recommended.
8.3.4. Starting tomcat on boot-time
In certain situations a server might reboot unexpectedly. It is hence preferable to have Tomcat start automatically when
the server starts. To achieve that the first step is to create init scripts. Create a new file called tomcat and paste the
below content into it (adjust the HOME variable to your environment):
#!/bin/sh
#Tomcat init script
HOME=/home/dhis/tomcat/bin
case $1 in
34
Installation
Making resources available with nginx
start)
sh ${HOME}/startup.sh
;;
stop)
sh ${HOME}/shutdown.sh
;;
restart)
sh ${HOME}/shutdown.sh
sleep 5
sh ${HOME}/startup.sh
;;
esac
exit 0
Move the script to the init script directory and make them executable by invoking:
sudo mv tomcat /etc/init.d
sudo chmod +x /etc/init.d/tomcat
Next make sure the tomcat init script will be invoked during system startup and shutdown:
sudo /usr/sbin/update-rc.d -f tomcat defaults 81
Tomcat will now be started at system startup and stopped at system shutdown. If you later need to revert this you can
replace defaults with remove and invoke the above commands again.
8.3.5. Making resources available with nginx
In some scenarios it is desirable to make certain resources publicly available on the Web without requiring
authentication. One example is when you want to make data analysis related resources in the Web API available in
a Web portal. The following example will allow access to charts, maps, reports, report table and document resources
through basic authentication by injecting an Authorization HTTP header into the request. It will remove the Cookie
header from the request and the Set-Cookie header from the response in order to avoid changing the currently
logged in user. It is recommended to create a user for this purpose given only the minimum authorities required. The
Authorization value can be constructed by Base64-encoding the username appended with a colon and the password
and prefix it "Basic ", more precisely "Basic base64_encode(username:password)". It will check the HTTP method
used for requests and return 405 Method Not Allowed if anything but GET is detected.
It can be favorable to set up a separate domain for such public users when using this approach. This is because we
don't want to change the credentials for already logged in users when they access the public resources. For instance,
when your server is deployed at somedomain.com, you can set a dedicated subdomain at api.somedomain.com, and
point URLs from your portal to this subdomain.
server {
listen
server_name
80;
api.somedomain.com;
location ~ ^/(api/(charts|chartValues|reports|reportTables|documents|maps|
organisationUnits)|dhis-web-commons/javascripts|images|dhis-web-commons-ajax-json|
dhis-web-mapping|dhis-web-visualizer) {
if ($request_method != GET) {
return 405;
}
proxy_pass
proxy_redirect
proxy_set_header
proxy_set_header
proxy_set_header
proxy_set_header
proxy_set_header
proxy_set_header
http://localhost:8080;
off;
Host
$host;
X-Real-IP
$remote_addr;
X-Forwarded-For
$proxy_add_x_forwarded_for;
X-Forwarded-Proto http;
Authorization
"Basic YWRtaW46ZGlzdHJpY3Q=";
Cookie
"";
35
Installation
App setup with nginx
proxy_hide_header
Set-Cookie;
}
}
8.3.6. App setup with nginx
DHIS 2 supports installation of apps. To avoid having to re-install your apps every time you update and replace the
DHIS 2 WAR file it is beneficial to deploy apps on the server file system outside the DHIS 2 webapp directory.
To install apps directly in nginx you can follow these steps. First create a directory which will be used as the app
installation folder.
sudo mkdir /usr/share/nginx/apps
Make sure that the directory is owned by the user which runs Tomcat in order to allow the Tomcat process to save apps
to this directory when they are uploaded. If the user running Tomcat is dhis you can use the below command.
sudo chown dhis:dhis /usr/share/nginx/apps
You must add an apps location in the nginx.conf configuration file like below. Note that we omit the apps directory
itself in the root directive.
server {
...
location /apps/ {
root
/usr/share/nginx;
expires
max;
}
...
}
Finally navigate to the app configuration screen in your DHIS 2 instance by going to App management > Settings and
adjust the settings accordingly.
The app installation folder should point to the base directory path on the server file system:
/usr/share/nginx/apps
The app base URL should point to the URL where DHIS 2 can find the apps. Replace www.domain.com with your
real domain name and according to how you have deployed DHIS 2.
http://www.domain.com/apps
You should now be ready to upload apps from the App management screen. Remember to reload the nginx
configuration.
8.3.7. Basic reverse proxy setup with Apache
The Apache HTTP server is the most common
Important
Using nginx is the preferred option as reverse proxy with DHIS2 and you should not attempt to install both
nginx and Apache on the same server. If you have installed nginx please ignore this section.
The Apache HTTP server is the most widely used HTTP server currently. Depdenign on your exact nature of
deployment, you may need to use Apache as a reverse proxy for your DHIS2 server. In this section, we will describe
how to implement a simple reverse proxy setup with Apache.
First we need to install a few necessary programs modules for Apache and enable the modules.
sudo apt-get install apache2 libapache2-mod-proxy-html libapache2-mod-jk
36
Installation
Basic load-balancing with Apache and
Tomcat
a2enmod proxy proxy_ajp proxy_connect
Lets define an AJP connector which Apache HTTP server will use to connect to Tomcat with. The Tomcat server.xml
file should be located in the /conf/ director of your Tomcat installation. Be sure this line is uncommented.You can set
the port to anything you like which is unused.
<Connector port="8009" protocol="AJP/1.3" redirectPort="8443" />
Now, we need to make the adjustments to the Apache HTTP server which will answer requests on port 80 and pass
them to the Tomcat server through an AJP connector. Edit the file /etc/apache2/mods-enabled/proxy.conf so
that it looks like the example below. Be sure that the port defined in the configuration file matches the one from Tomcat.
<IfModule mod_proxy.c>
ProxyRequests Off
ProxyPass /dhis ajp://localhost:8009/dhis
ProxyPassReverse /dhis ajp://localhost:8009/dhis
<Location "/dhis">
Order allow,deny
Allow from all
</Location>
</IfModule>
You now can restart Tomcat and the Apache HTTPD server and your DHIS 2 instance should be available on
http://myserver/dhis where myserver is the hostname of your server.
8.3.8. Basic load-balancing with Apache and Tomcat
Load balancing may be employed to more evenly distribute system load across multiple Tomcat instances in situations
where user load is too high to be handled by a single server instance. In this example, we will create a simple loadbalanced architecture using "sticky sessions" to distribute users across two instances of Tomcat.
First, we need at least two instances of Tomcat running DHIS2, which are connected to the same database. There
are various architectures, such as running the application servers (Tomcat) on separate (virtual) machines connected
to a single database server, or perhaps running multiple Tomcat instances and a database on a single-high capacity
machine in situations with I/O is not an issue, but when CPU usage of a single Tomcat instance limits overall system
performance. In this scenario, we will configure connect two Tomcat instances running on the same machine to a single
database through a load-balanced reverse proxy. Apache will take care of the details of determining which Tomcat
instance a particular client is interfaced to with the
The first step is to configure our Tomcat instances. The previous sections have detailed how this should be done.
Importantly, both Tomcat instances should be configured to use the same database server. Some modifications need
to be made to the server.xml file of each Tomcat instance, which will be used to uniquely identify each instance. Two
copies of Tomcat should be extracted to a directory of your choice. Modify the server.xml file so that the following
lines are unique for each instance.
<Server port="8005" shutdown="SHUTDOWN">
...
<Connector port="8009" protocol="AJP/1.3" redirectPort="8444" />
...
<Engine name="Catalina" defaultHost="localhost" jvmRoute="jvm1">
The important parameters here are the server port, the AJP connector port, and the jvmRoute identifier. The jvmRoute
identifier will be appended to the JSESSIONID so that Apache will know which Tomcat instance a particular session
should be routed to. The parameters must be unique for each Tomcat instance. After configuring Tomcat, setup DHIS2
according to the normal procedures detailed in other sections.
Next, we will configure the Apache HTTP server to perform load balancing. Incoming client requests will be assigned
to one of the instances with a sticky session. Alter the /etc/apache2/apache2.conf file (or other appropriate file
37
Installation
Basic SSL encryption with Apache
depending on your exact configuration) to define a proxy load balancer and a proxy and reverse proxy path. Note that
the port numbers and route parameters must match the Tomcat port and jvmRoute parameters which were defined
earlier in the Tomcat configuration.
<Proxy balancer://dhiscluster>
Order Allow,Deny
Allow from all
</Proxy>
<Proxy balancer://dhiscluster>
BalancerMember ajp://127.0.0.1:8009/dhis route=dhis1
BalancerMember ajp://127.0.0.1:9009/dhis route=dhis2
ProxySet lbmethod=byrequests
ProxySet stickysession=JSESSIONID
</Proxy>
ProxyVia Off
ProxyPass /dhis/ balancer://dhiscluster/ stickysession=JSESSIONID nofailover=on
ProxyPassReverse /dhis/ balancer://dhiscluster/ stickysession=JSESSIONID|jsessionid
Finally, start both Tomcat instances, and then restart Apache HTTP.
This example demonstrates how to implement a simple load balanced system with sticky sessions using Apache HTTP
server.
8.3.9. Basic SSL encryption with Apache
Using Apache and the reverse proxy setup described in the previous section, we can easily implement encrypted transfer
of data between clients and the server over HTTPS. This section will describe how to use self-signed certificates,
although the same procedure could be used if you have fully-signed certificates as well.
First (as root), generate the necessary private key files and CSR (Certificate Signing Request)
mkdir /etc/apache2/ssl
cd /etc/apache2/ssl
openssl genrsa -des3 -out server.key 1024
openssl req -new -key server.key -out server.csr
We need to remove the password from the key, otherwise Apache will not be able to use it.
cp server.key server.key.org
openssl rsa -in server.key.org -out server.key
Next, generate a self-signed certificate which will be valid for one year.
openssl x509 -req -days 365 -in server.csr -signkey \ server.key -out server.crt
Now, lets configure Apache by enabling the SSL modules and creating a default site.
a2enmod ssl
a2ensite default-ssl
Now, we need to edit the default-ssl (located at /etc/apache2/sites-enabled/default-ssl) file in order to
enable the SSL transfer functionality of Apache.
<VirtualHost *:443>
ServerAdmin [email protected]
SSLEngine On
SSLCertificateFile /etc/apache2/ssl/server.crt
SSLCertificateKeyFile /etc/apache2/ssl/server.key
...
38
Installation
DHIS 2 Live setup
Be sure that the *:80 section of this file is changed to port *:443, which is the default SSL port. Also, be sure to change
the ServerAdmin to the webmaster's email. Lastly, we need to be sure that the hostname is setup properly in /etc/hosts.
Just under the "localhost" line, be sure to add the server's IP address and domain name.
127.0.0.1 localhost
XXX.XX.XXX.XXX foo.mydomain.org
Now, just restart Apache and you should be able to view https://foo.mydomain.org/dhis.
/etc/init.d/apache2 restart
8.4. DHIS 2 Live setup
The DHIS 2 Live package is extremely convenient to install and run. It is intended for demonstrations, for users who
want to explore the system and for small, offline installations typically at districts or facilities. It only requires a Java
Runtime Environment and runs on all browsers except Internet Explorer 7 and lower.
To install start by downloading DHIS 2 Live from http://dhis2.org and extract the archive to any location. On Windows
click the executable archive. On Linux invoke the startup.sh script. After the startup process is done your default web
browser will automtically be pointed to http://localhost:8082 where the application is accessible. A system tray menu
is accessible on most operating systems where you can start and stop the server and start new browser sesssions. Please
note that if you have the server running there is no need to start it again, simply open the application from the tray menu.
DHIS 2 Live is running on an embedded Jetty servlet container and an embedded H2 database. However it can easily
be configured to run on other database systems such as PostgreSQL. Please read the section above about server
installations for an explanation of the database configuration. The hibernate.properties configuration file is located
in the conf folder. Remember to restart the Live package for your changes to take effect. The server port is 8082 by
default. This can be changed by modifying the value in the jetty.port configuration file located in the conf directory.
8.5. Backup
Doing automated database backups for information systems in production is an absolute must, and might have
uncomfortable consequences if ignored. Backups have two main purposes: The primary is data recovery in case data
is lost, the secondary purpose is archiving of data for a historical period of time.
Backup should be central in a disaster recovery plan. Even though such a plan should cover additional subjects, the
database is the key component to consider since this is where all data used in the DHIS 2 application is stored. Most
other parts of the IT infrastructure surrounding the application can be restored based on standard components.
There are of course many ways to set up backup; however the following describes a setup where the database is copied
into a dump file and saved on the file system. This can be considered a full backup. The backup is done with a cron
job, which is a time-based scheduler in Unix/Linux operating systems.
You can download both files from http://dhis2.com/download/pg_backup.zip
The cron job is set up with two files. The first is a script which performs the actual task of backup up the database. It
uses a PostgreSQL program called pg_dump for creating the database copy. The second is a crontab file which runs
the backup script every day at 23:00. Note that this script backs up the database file to the local disk. It is strongly
recommended to store a copy of the backup at a location outside the server where the application is hosted. This can
be achieved with the scp tool. Make sure that you have set the system date correctly on your server.
8.6. Working with the PostgreSQL database
Common operations when managing a DHIS instance are dumping and restoring databases. To make a dump (copy)
of your database, assuming the setup from the installation section, you can invoke the following:
pg_dump dhis2 -U dhis -f dhis2.sql
39
Installation
Using Amazon Web services
The first argument (dhis2) refers to the name of the database. The second argument (dhis) refers to the database user.
The last argument (dhis2.sql) is the file name of the copy. If you want to compress the file copy immediately you can do:
pg_dump dhis2 -U dhis | gzip > dhis2.sql.gz
To restore this copy on another system, you first need to create an empty database as described in the installation
section. You also need to gunzip the copy if you created a compressed version. You can the invoke:
psql -d dhis2 -U dhis -f dhis2.sql
8.7. Using Amazon Web services
Amazon Web Services (AWS) offers virtual cloud-computing resources which allow developers and implementers to
quickly scale an application, both horizontally and vertically, in a cost effective manner. AWS offers multiple operating
systems and instance sizes depending on the exact nature of the deployment. This section will describe a basic setup
with the AWS Elastic Cloud Compute (EC2) system using the Basic 32 bit Amazon AMI, which is based on the Red
Hat Linux distribution.
Estimating the cost of an AWS instance can be performed using the "Simple Monthly Cal culator". AWS costs are
based entirely on usage. As your application usage grows, you can provision new servers.
1. You will need an existing AWS account. If you do not have one, you can create one here. Once you have created
and enabled your account, login to the AWS console.
2. Once you have logged in, select the "EC2" tab. You will need to select a region in which to instantiate your instance.
Users in Europe and Africa, should probably use the EU West region, while users in Asia should probably use on
of the Asia Pacific regions (either Singapore or Tokyo). Selection of the appropriate region will reduce latency
between the server and clients.
3. Click the "Instances" link on the right menu, and then the "Launch Instances" button.
Select one of the AMIs for your server. Using either of the Basic Amazon AMIs (either 32 or 64 bit) is recommended,
but you can use whichever AMI is most appropriate.
4. Next, you will need to select the size of your instance. The size of the instance selected will depend on the number
of anticipated users. Selecting the "Micro" size, will enable you to test DHIS 2 in the AWS environment for a period
of one year, at no cost if you use one of the "Free tier eligible" AMIs.
5. Once you have selected the instance size, you can select a specific kernel ID and RAM disk ID. If you do not have
a specific reason, just use the defaults and proceed to the next dialog.
6. Next, you can add key-value pairs to help you to easily identify the instance. This is just metadata for your own
usage.
40
Installation
Using Amazon Web services
7. Next, you will need a key pair which will enable you to remotely access your instance. If you have an existing key
pair you can use it, otherwise, you can create a new key pair.
8. You will need to assign a security group to the instance. Security groups can be used to expose certain services
(SSH, HTTP, Tomcat, etc) to the Internet.With security groups, you can control which ports will be open to specific
network ranges. For DHIS 2, you would normally need at least port 22 (SSH) and port 80 (HTTP) open to the
internet or specific address ranges.
9. Finally, you can review and launch your instance.
10.Once the instance, has been launched, you can connect via PuTTY or any other SSH client to the instance using
the instance's Public DNS, which is listed on the EC2 control panel. You will need to install a few packages if you
are using the Amazon default AMI.
yum install jdk.i586 postgresql-server.i686 apache-tomcat-apis.
noarch tomcat-native.i686 httpd.i686
11.Once you have installed these packages, you can follow the instructions provided in the on setting up a server.
41
Support
Home page: dhis2.org
Chapter 9. Support
The DHIS 2 community uses a set of collaboration and coordination platforms for information and provision of
downloads, documentation, development, source code, functionality specifications, bug tracking. This chapter will
describe this in more detail.
9.1. Home page: dhis2.org
The DHIS 2 home page is found at http://dhis2.orgThe download page provides downloads for the DHIS 2 Live
package, WAR files, the mobile client, a Debian package, the source code, sample databases and a tool for editing the
application user interface translations. Please note that the current latest release will be maintained until the next is
released and both the actual release and the latest build from the release branch are provided. We recommend that you
check back regularly on the download page and update your online server with the latest build from the release branch.
The build revision can be found under Help - About inside DHIS 2.
The documentation page provides installation instructions, user documentation, this implementation guide,
presentations, Javadocs, changelog, roadmap and a guide for contributing to the documentation. The user
documentation is focused on the practical aspects of using DHIS 2, such as how to create data elements and reports.
This implementation guide is addressing the more high-level aspects of DHIS 2 implementation, database development
and maintenance. The change log and roadmap sections provide links to the relevant pages in the Launchpad site
described later.
The functionality and features pages give a brief overview with screenshots of the main functionalities and features of
DHIS 2. A demo DHIS 2 application can be reached from the demo top menu link. These pages can be used when a
quick introduction to the system must be given to various stakeholders.
The about page has information about the license under which DHIS 2 is released, how to sign up for the mailing lists,
get access to the source code and more.
9.2. Collaboration platform: launchpad.net/dhis2
DHIS 2 uses Launchpad as the main collaboration platform. The site can be accessed at http://lanchpad.net/dhis2
Launchpad is used for source code hosting, functionality specifications, bug tracking and notifications. The Bazaar
version control system is tightly integrated with Launchpad and is required for checking out the source code.
The various source code branches including trunk and release branches can be browsed at http://code.launchpad.net/
dhis2
If you want to suggest new functionality to be implemented in DHIS 2 you can air your views on the developer mailing
list and eventually write a specification, which is referred to as blueprints in Launchpad. The bueprint will be considered
by the core development team and if accepted be assigned a developer, approver and release version. Blueprints can
be browsed and added at http://blueprints.launchpad.net/dhis2
If you find a bug in DHIS 2 you can report it at Launchpad by navigating to http://bugs.launchpad.net/dhis2 Your bug
report will be investigated by the developer team and be given a status. If valid it will also be assigned to a developer
and approver and eventually be fixed. Note that bugfixes are incorporated into the trunk and latest release branch - so
more testing and feedback to the developer teams leads to higher quality of your software.
9.3. Reporting a problem
If you encounter a problem with the DHIS 2 software you can ask for assistance on the developer's mailing list at
https://launchpad.net/~dhis2-devs. Before reporting, make sure that you have:
• Cleared the web browser cache (also called history or browsing data) completely (select all options before clearing).
43
Support
Reporting a problem
• Cleared the DHIS 2 application cache: Go to Data administration -> Cache statistics and click Clear cache.
If you believe you have found a bug you can report it either to the developer mailing lists or to the bug tracker at
https://bugs.launchpad.net/dhis2 .
For the developers to be able to help you need to provide as much useful information as possible:
• DHIS 2 version: Look in the Help -> About page inside DHIS 2 and provide the version and build revision.
• Web browser including version.
• Operating system including version.
• Servlet container / Tomcat log: Provide any output in the Tomcat log (typically catalina.out) related to your problem.
• Web browser console: In the Chrome web browser, click F12, then "Console", and look for exceptions related to
your problem.
• Actions leading to the problem: Describe as clearly as possible which steps you take leading to the problem or
exception.
• Problem description: Describe the problem clearly, why you think it is a problem and which behavior you would
expect from the system.
44
Organisation Units
Organisation unit hierarchy design
Chapter 10. Organisation Units
In DHIS 2 the location of the data, the geographical context, is represented as organisational units. Organisational
units can be either a health facility or department/sub-unit providing services or an administrative unit representing a
geographical area (e.g. a health district).
Organisation units are located within a hierarchy, also referred to as a tree. The hierarchy will reflect the health
administrative structure and its levels. Typical levels in such a hierarchy are the national, province, district and facility
levels. In DHIS 2 there is a single organisational hierarchy so the way this is defined and mapped to the reality needs
careful consideration. Which geographical areas and levels that are defined in the main organisational hierarchy will
have major impact on the usability and performance of the application. Additionally, there are ways of addressing
alternative hierarchies and levels as explained in the section called Organisation unit groups and group sets further
down.
10.1. Organisation unit hierarchy design
The process of designing a sensible organisation unit hierarchy has many aspects:
• Include all reporting health facilities: All health facilities which contribute to the national data collection should
be included in the system. Facilities of all kinds of ownership should be incorporated, including private, public,
NGO and faith-oriented facilities. Often private facilities constitute half of the total number of facilities in a country
and have policies for data reporting imposed on them, which means that incorporating data from such facilities are
necessary to get realistic, national aggregate figures.
• Emphasize the health administrative hierarchy: A country typically has multiple administrative hierarchies which
are often not well coordinated nor harmonized. When considering what to emphasize when designing the DHIS 2
database one should keep in mind what areas are most interesting and will be most frequently requested for data
analysis. DHIS 2 is primarily managing health data and performing analysis based on the health administrative
structure. This implies that even if adjustments might be made to cater for areas such as finance and local government,
the point of departure for the DHIS 2 organisation unit hierarchy should be the health administrative areas.
• Limit the number of organisation unit hierarchy levels: To cater for analysis requirements coming from various
organisational bodies such as local government and the treasury, it is tempting to include all of these areas as
organisation units in the DHIS 2 database. However, due to performance considerations one should try to limit the
organisation unit hierarchy levels to the smallest possible number. The hierarchy is used as the basis for aggregation
of data to be presented in any of the reporting tools, so when producing aggregate data for the higher levels, the
DHIS 2 application must search for and add together data registered for all organisation units located further down
the hierarchy. Increasing the number of organisation units will hence negatively impact the performance of the
application and an excessively large number might become a significant problem in that regard.
In addition, a central part in most of the analysis tools in DHIS 2 is based around dynamically selecting the “parent”
organisation unit of those which are intended to be included. For instance, one would want to select a province and
have the districts belonging to that province included in the report. If the district level is the most interesting level
from an analysis point of view and several hierarchy levels exist between this and the province level, this kind of
report will be rendered unusable. When building up the hierarchy, one should focus on the levels that will be used
frequently in reports and data analysis and leave out levels that are rarely or never used as this will have an impact
on both the performance and usability of the application.
• Avoid one-to-one relationships: Another guiding principle for designing the hierarchy is to avoid connecting levels
that have near one-to-one parent-child ratios, meaning that for instance a district (parent) should have on average
more than one local council (child) at the level below before it make sense to add a local council level to the hierarchy.
Parent-child ratios from 1:4 or more are much more useful for data analysis purposes as one can start to look at e.g.
how a district’s data is distributed in the different sub-areas and how these vary. Such drill-down exercises are not
very useful when the level below has the same target population and the same serving health facilities as the parent.
Skipping geographical levels when mapping the reality to the DHIS 2 organisation unit hierarchy can be difficult
and can easily lead to resistance among certain stakeholders, but one should have in mind that there are actually
45
Organisation Units
Organisation unit groups and group sets
ways of producing reports based on geographical levels that are not part of the organisational hierarchy in DHIS
2, as will be explained in the next section.
10.2. Organisation unit groups and group sets
In DHIS 2, organisation units can be grouped in organisation unit groups, and these groups can be further organised into
group sets. Together they can mimic an alternative organisational hierarchy which can be used when creating reports
and other data output. In addition to representing alternative geographical locations not part of the main hierarchy,
these groups are useful for assigning classification schemes to health facilities, e.g. based on the type or ownership of
the facilities. Any number of group sets and groups can be defined in the application through the user interface, and
all these are defined locally for each DHIS 2 database.
An example illustrates this best: Typically one would want to provide analysis based on the ownership of the facilities.
In that case one would create a group for each ownership type, for instance “MoH”, “Private” and “NGO”. All facilities
in the database must then be classified and assigned to one and only one of these three groups. Next one would create
a group set called “Ownership” to which the three groups above are assigned, as illustrated in the figure below.
In a similar way one can create a group set for an additional administrative level, e.g. local councils. All local councils
must be defined as organisation unit groups and then assigned to a group set called “Local Council”. The final step is
then to assign all health facilities to one and only one of the local council groups. This enables the DHIS 2 to produce
aggregate reports by each local council (adding together data for all assigned health facilities) without having to include
the local council level in the main organisational hierarchy. The same approach can be followed for any additional
administrative or geographical level that is needed, with one group set per additional level. Before going ahead and
designing this in DHIS 2, a mapping between the areas of the additional geographical level and the health facilities
in each area is needed.
A key property of the group set concept in DHIS 2 to understand is exclusivity, which implies that an organisation unit
can be member of exactly one of the groups in a group set. A violation of this rule would lead to duplication of data
when aggregating health facility data by the different groups, as a facility assigned to two groups in the same group
set would be counted twice.
With this structure in place, DHIS 2 can provide aggregated data for each of the organisation unit ownership types
through the “Organisation unit group set report” in “Reporting” module or through the Excel pivot table third-party
tool. For instance one can view and compare utilisation rates aggregated by the different types of ownership (e.g.
MoH, Private, NGO). In addition, DHIS 2 can provide statistics of the distribution of facilities in “Organisation unit
distribution report” in “Reporting” module. For instance one can view how many facilities exist under any given
organisation unit in the hierarchy for each of the various ownership types. In the GIS module, given that health facility
coordinates have been registered in the system, one can view the locations of the different types of health facilities
(with different symbols for each type), and also combine this information with a other map layer showing indicators
e.g. by district.
46
Data Elements and Custom Dimensions
Data elements
Chapter 11. Data Elements and Custom
Dimensions
This chapter first discusses an important building block of the system: the data element. Second it discusses the category
model and how it can be used to achieve highly customized meta-data structure for storage of data.
11.1. Data elements
The data element is together with the organisation unit the most important building block of a DHIS 2 database. It
represents the what dimension and explains what is being collected or analysed. In some contexts this is referred to an
indicator, however in DHIS 2 this meta-data element of data collection and analysis is referred to as a data element.
The data element often represents a count of some event and its name describes what is being counted, e.g. "BCG
doses given" or "Malaria cases". When data is collected, validated, analysed or presented it is the data elements or
expressions built with data elements that describe what phenomenon, event or case the data is registered for. Hence
the data element become important for all aspects of the system and decide not only how data is collected, but more
importantly how the data is represented in the database and how data can be analysed and presented.
An important principle behind designing data elements is to think of data elements as a self-contained description of
an phenomenon or event and not as a field in a data entry form. Each data element lives on its own in the database,
completely detached and independent from the collection form. It is important to consider that data elements are used
directly in reports, charts and other tools for data analysis, in which the context in any given data entry form is not
accessible nor relevant. In other words, it must be possible to clearly identify what event a data element represents by
only looking at its name. Based on this one can derive a rule of thumb saying that the name of the data element must
be able to stand on its own and describe the data value also outside the context of its collection form.
For instance, a data element called “Malaria” might be concise when seen in a data entry form capturing immunization
data, in a form capturing vaccination stocks as well as in a form for out-patient data. When viewed in a report, however,
outside the context of the data entry form, it is impossible to decide what event this data element represents. If the data
element had been called “Malaria cases”, “Malaria stock doses received” or “Malaria doses given” it would have been
clear from a user perspective what the report is trying to express. In this case we are dealing with tree different data
elements with completely different semantics.
11.2. Categories and custom dimensions
Certain requirements for data capture necessitates a fine-grained breakdown of the dimension describing the event
being counted. For instance one would want to collect the number of “Malaria cases” broken down on gender and
age groups, such as “female”, “male” and “< 5 years” and “> 5 years”. What characterizes this is that the breakdown
is typically repeated for a number of “base” data elements: For instance one would like to reuse this break-down for
other data elements such as “TB” and “HIV”. In order to make the meta-data more dynamic, reusable and suitable for
analysis it makes sense to define the mentioned diseases as data elements and create a separate model for the breakdown
attributes. This can be achieved by using the category model, which is described in the following.
The category model has three main elements which is best described using the above example:
1. The category option, which corresponds to “female”, “male” and “< 5 years” and “> 5 years”.
2. The category, which corresponds to “gender” and “age group”.
3. The category combination, which should in the above example be named “gender and age group” and be assigned
both categories mentioned above.
This category model is in fact self-standing but is in DHIS 2 loosely coupled to the data element. Loosely coupled in
this regard means that there is an association between data element and category combination, but this association may
be changed at any time without loosing any data. It is however not recommended to change this often since it makes
the database less valuable in general since it reduces the continuity of the data. Note that there is no hard limit on the
47
Data Elements and Custom Dimensions
Data element groups
number of category options in a category or number of categories in a category combination, however there is a natural
limit to where the structure becomes messy and unwieldy.
A pair of data element and category combination can now be used to represent any level of breakdown. It is important
to understand that what is actually happening is that a number of custom dimensions are assigned to the data. Just like
the data element represents a mandatory dimension to the data values, the categories adds custom dimensions to it. In
the above example we can now through the DHIS 2 output tools perform analysis based on both “gender” and “age
group” for those data elements, in the same way as one can perform analysis based on data elements, organisation
units and periods.
This category model can be utilized both in data entry form designs and in analysis and tabular reports. For analysis
purposes, DHIS 2 will automatically produce sub-totals and totals for each data element associated with a category
combination. The rule for this calculation is that all category options should sum up to a meaningful total. The above
example shows such a meaningful total since when summarizing “Malaria cases” captured for “female < 5 years”,
“male < 5 years”, “female > 5 years” and “male > 5 years” one will get the total number of “Malaria cases”.
For data capture purposes, DHIS 2 can automatically generate tabular data entry forms where the data elements are
represented as rows and the category option combinations are represented as columns. This will in many situations
lead to compelling forms with a minimal effort. It is necessary to note that this however represents a dilemma these
two concerns are sometimes not compatible. For instance one might want to quickly create data entry forms by using
categories which does not adhere to rule of a meaningful total. We do however consider this a better alternative than
maintaining two independent and separate models for data entry and data analysis.
An important point about the category model is that data values are persisted and associated with a category option
combination. This implies that adding or removing categories from a category combination renders these combinations
invalid and a low-level database operation much be done to correct it. It is hence recommended to thoughtfully consider
which breakdowns are required and to not change them too often.
11.3. Data element groups
Common properties of data elements can be modelled through what is called data element groups. The groups are
completely flexible in the sense that they are defined by the user, both their names and their memberships. Groups
are useful both for browsing and presenting related data, and can also be used to aggregate values captured for data
elements in the group. Groups are loosely coupled to data elements and not tied directly to the data values which means
they can be modified and added at any point in time without interfering with the low-level data.
48
Data Sets and Forms
What is a data set?
Chapter 12. Data Sets and Forms
This chapter discusses data sets and forms, what types of forms are available and describes best practises for the process
of moving from paper based to electronic forms.
12.1. What is a data set?
All data entry in DHIS 2 is organised through the use of data sets. A data set is a collection of data elements grouped
together for data collection, and in the case of distributed installs they also define chunks of data for export and import
between instances of DHIS 2 (e.g. from a district office local installation to a national server). Data sets are not linked
directly to the data values, only through their data elements and frequencies, and as such a data set can be modified,
deleted or added at any point in time without affecting the raw data already captured in the system, but such changes
will of course affect how new data will be collected.
A data set has a period type which controls the data collection frequency, which can be daily, weekly, monthly,
quarterly, six-monthly, or yearly. Both the data elements to include in the data set and the period type is defined by
the user, together with a name, short name, and code. If calculated fields are needed in the collection form (and not
only in the reports), then indicators can be assigned to the data set as well, but these can only be used in custom forms
(see further down).
In order to use a data set to collect data for a specific organisation unit the user must assign the organisation unit to the
data set. This mechanism controls which organisation units that can use which data sets, and at the same time defines
the target values for data completeness (e.g. how many health facilities in a district are expected to submit the RCH
data set every month).
A data element can belong to multiple data sets, but this requires careful thinking as it may lead to overlapping and
inconstant data being collected if e.g. the data sets are given different frequencies and are used by the same organisation
units.
12.2. What is a data entry form?
Once you have assigned a data set to an organisation unit that data set will be made available in Data Entry (under
Services) for the organisation units you have assigned it to and for the valid periods according to the data set's period
type. A default data entry form will then be shown, which is simply a list of the data elements belonging to the data
set together with a column for inputting the values. If your data set contains data elements with categories such as age
groups or gender, then additional columns will be automatically generated in the default form based on the categories.
In addition to the default list-based data entry form there are two more alternatives, the section-based form and the
custom form.
12.2.1. Types of data entry forms
DHIS 2 currently features three differnet types of forms which are described in the following.
12.2.1.1. Default forms
A default data entry form is simply a list of the data elements belonging to the data set together with a column for
inputting the values. If your data set contains data elements with a non-default category combination, such as age
groups or gender then additional columns will be automatically generated in the default form based on the different
options/dimensions. If you use more than one category combination in a data set you will get one table per category
combination in the default form, with different column headings for the options.
12.2.1.2. Section forms
Section forms allow for a bit more flexibility when it comes to using tabular forms and are quick and simple to design.
Often your data entry form will need multiple tables with subheadings, and sometimes you need to disable (grey out)
49
Data Sets and Forms
From paper to electronic form - Lessons
learned
a few fields in the table (e.g. some categories do not apply to all data elements), both of these functions are supported
in section forms. After defining a data set you can define it's sections with subsets of data elements, a heading and
possible grey fields i the section's table. The order of sections in a data set can also be defined. In Data Entry you
can now start using the Section form (should appear automatically when sections are available for the selected data
set). Most tabular data entry forms should be possible to do with sections forms. Utilizing the section or default forms
makes life easy as there is no need to maintain a fixed form design which includes references to data elements. If these
two types of forms are not meeting your requirements then the third option is the completely flexible, although more
time-consuming, custom data entry forms.
12.2.1.3. Custom Forms
When the form you want to design is too complicated for the default or section forms then your last option is to use
a custom form. This takes more time, but gives you full flexibility in terms of the design. In DHIS 2 there is a built
in HTML editor (CK Editor) in the form designer which allows you to either design the form in the GUI or paste in
your html directly (using the "source" window in the editor). In the custom form you can insert static text or data fields
(linked to data elements + category option combination) in any position on the form and you have complete freedom
to design the layout of the form. Once a custom form has been added to a data set it will be available in data entry
and used automatically.
When using a custom form it is possible to use calculated fields to display e.g. running totals or other calculations
based on the data captured in the form. This can e.g. be useful when dealing with stock or logistics forms that need
item balance, items needed for next period etc. In order to do so, the user must first define the calculated expressions
as indicators and then assign these indicators to the data set in question. In the custom form designer the user can then
assign indicators to the form the same way data elements are assigned. The limitation to the calculated expression is
that all the data elements use in the expression must be available in the same data set since the calculations are done
on the fly inside the form, and are not based on data values already stored in the database.
12.3. From paper to electronic form - Lessons learned
When introducing an electronic health information system the system being replaced is often paper based reporting.
The process of migrating to electronic data capture and analysis has some challenges. The following sections suggest
best practises on how to overcome these.
12.3.1. Identify self-contained data elements
Typically the design of a DHIS 2 data set is based on some requirements from a paper form that is already in use. The
logic of paper forms are not the same as the data element and data set model of DHIS, e.g. often a field in a tabular
paper form is described both by column headings and text on each row, and sometimes also with some introductory
table heading that provides more context. In the database this is captured for one atomic data element with no reference
to a position in a visual table format so it is important to make sure the data element with the optional data element
categories capture the full meaning of each individual field in the paper form.
12.3.2. Leave calculations and repetitions to the computer - capture raw data
only
Another important thing to have in mind while designing data sets is that the data set and the corresponding data entry
form (which is a data set with layout) is a data collection tool and not a report or analysis tool. There are other far
more sophisticated tools for data output and reporting in DHIS 2 than the data entry forms. Paper forms are often
designed with both data collection and reporting in mind and therefore you might see things such as cumulative values
(in addition to the monthly values), repetition of annual data (the same population data reported every month) or even
indicator values such as coverage rates in the same form as the monthly raw data. When you store the raw data in the
DHIS 2 database every month and have all the processing power you need within the computerised tool, there is no
need (in fact it would be wrong and most likely cause inconsistency) to register manually calculated values such as
the ones mentioned above. You only want to capture the raw data in your data sets/forms and leave the calculations
to the computer, and presentation of such values to the reporting tools in DHIS. Through the functionality of data set
50
Data Sets and Forms
Leave calculations and repetitions to the
computer - capture raw data only
reports all tabular section forms will automatically get extra columns at the far right providing subtotal and total values
for each row (data element).
51
Data Quality
Measuring data quality
Chapter 13. Data Quality
This chapter discusses various aspects related to data quality.
13.1. Measuring data quality
Is the data complete? Is it collected on time? Is it correct? These are questions that needs to be asked when analysing
data. Poor data quality can take many shapes; not just incorrect figures, but a lack of completeness, or the data being
too old (for meaningful use).
13.2. Reasons for poor data quality
There are many potential reasons for poor quality data, including:
• Excessive amounts collected; too much data to be collected leads to less time to do it, and “shortcuts” to finish
reporting
• Many manual steps; moving figures, summing up, etc. between different paper forms
• Unclear definitions; wrong interpretation of the fields to be filled out
• Lack of use of information: no incentive to improve quality
• Fragmentation of information systems; can lead to duplication of reporting
13.3. Improving data quality
Improving data quality is a long-term task, and many of the measures are organizational in nature. However, data
quality should be an issue from the start of any implementation process, and there are some things that can be addressed
at once, such as checks in DHIS2. Some important data quality improvement measures are:
• Changes in data collection forms, harmonization of forms
• Promote information use at local level, where data is collected
• Develop routines on checking data quality
• Include data quality in training
• Implement data quality checks in DHIS 2
13.4. Using DHIS 2 to improve data quality
DHIS to has several features that can help the work of improving data quality; validation during data entry to make sure
data is captured on the right format and within a reasonable range, user-defined validation rules based on mathematical
relationships between the data being captured (e.g. subtotals vs totals), outlier analysis functions, as well as reports on
data coverage and completeness. More indirectly, several of the DHIS design principles contribute to improving data
quality, such as the idea of harmonising data into one integrated data warehouse, supporting local level access to data
and analysis tools, and by offering a wide range of tools for data analysis and dissemination. With more structured
and harmonised data collection processes and with strengthened information use at all levels, the quality of data will
improve. Here is an overview of the functionality more directly targeting data quality:
13.4.1. Data input validation
The most basic way of data quality check in DHIS 2 is to make sure that the data being captured is on the correct
format. The DHIS 2 will give the users a message that the value entered is not on the correct format and will not save
the value until it has been changed to an accepted value. E.g. text cannot be inputted in a numeric field. The different
types of data values supported in DHIS 2 are explained in the user manual in the chapter on data elements.
53
Data Quality
Min and max ranges
13.4.2. Min and max ranges
To stop typing mistakes during data entry (e.g typing ‘1000’ instead of ‘100’) the DHIS 2 checks that the value being
entered is within a reasonable range. This range is based on the previously collected data by the same health facility
for the same data element, and consists of a minimum and a maximum value. As soon as a the users enters a value
outside the user will be alerted that the value is not accepted. In order to calculate the reasonable ranges the system
needs at least six months (periods) of data.
13.4.3. Validation rules
A validation rule is based on an expression which defines a relationship between a number of data elements. The
expression has a left side and a right side and an operator which defines whether the former must be less than, equal
to or greater than the latter. The expression forms a condition which should assert that certain logical criteria are met.
For instance, a validation rule could assert that the total number of vaccines given to infants is less than or equal to
the total number of infants.
The validation rules can be defined through the user interface and later be run to check the existing data. When running
validation rules the user can specify the organisation units and periods to check data for, as running a check on all
existing data will take a long time and might not be relevant either. When the checks are completed a report will be
presented to the user with validation violations explaining which data values that need to be corrected.
The validation rules checks are also built into the data entry process so that when the user has completed a form the
rules can be run to check the data in that form only, before closing the form.
13.4.4. Outlier analysis
The standard deviation based outlier analysis provides a mechanism for revealing values that are numerically distant
from the rest of the data. Outliers can occur by chance, but they often indicate a measurement error or a heavy-tailed
distribution (leading to very high numbers). In the former case one wishes to discard them while in the latter case one
should be cautious in using tools or interpretations that assume a normal distribution. The analysis is based on the
standard normal distribution.
13.4.5. Completeness and timeliness reports
Completeness reports will show how many data sets (forms) that have been submitted by organisation unit and period.
You can use one of three different methods to calculate completeness; 1) based on completeness button in data entry,
2) based on a set of defined compulsory data elements, or 3) based on the total registered data values for a data set.
The completeness reports will also show which organisation units in an area that are reporting on time, and the
percentage of timely reporting facilities in a given area. The timeliness calculation is based on a system setting called
Days after period end to qualify for timely data submission.
54
Indicators
What is an indicator?
Chapter 14. Indicators
This chapter covers the following topics:
• What is an indicator
• Purposes of indicators
• Indicator-driven data collection
• Managing indicators in DHIS 2
The following describes these topics in greater detail.
14.1. What is an indicator?
In DHIS2, the indicator is a core element of data analysis. An indicator is a calculated formula based on a combination
of data elements, category options, possibly constants and a factor. There are two foms of indicators, those with a
denominator and those which do not have a denominator. Calculated totals, which may be composed of multiple data
elements do not have denominators. Coverage indicators (ratios, percentages, etc) are composed of two formulas of
data elements, one representing the numerator and another representing the denominator.
Indicators are thus made up of formulas of data elements and other components and are always multiplied by a factor
(e.g. 1, 100, 100, 100 000). The factor is essentially a number which is multiplied by the result of the numerator divided
by denominator. As a concrete example, the indicator "BCG coverage <1 year" is defined a formula with a factor 100
(in order to obtain a percentage), a numerator ("BCG doses given to children under 1 year") and a denominator ("Target
population under 1 year"). The indicator "DPT1 to DPT3 drop out rate" is a formula of 100 % x ("DPT1 doses given""DPT3 doses given") / ("DPT1 doses given").
Table 14.1. Indicator examples
Indicator
Formula
Numerator
Denominator
Factor
Fully immunized <1
year coverage
Fully immunized/
Population < 1 year
x 100
Fully immunized
Population < 1
100 (Percentage)
Maternal Mortality
Rate
Maternal
deaths/
Live births x 100
000
Maternal deaths
Live births
100 000(MMR is
measured per 100
000)
Cumulative number
of people Enrolled
in Care
Cumulative number
of people Enrolled
in Care X 1
Cumulative number None
Enrolled in Care
(Male,
Age<18)+Cumulative
number
Enrolled
in Care (Male,
Age18+)+Cumulative
number
Enrolled
in Care (Age<18,
Female)+Cumulative
number
Enrolled
in Care (Age18+,
Female)
1
14.2. Purpose of indicators
Indicators which are defined with both numerators and denominators are typically more useful for analysis. Because
they are proportions, they are comparable across time and space, which is very important since units of analysis and
55
Indicators
Indicator-driven data collection
comparison, such as districts, vary in size and change over time. A district with population of 1000 people may have
fewer cases of a given disease than a district with a population of 10,000. However, the incidence values of a given
disease will be comparable between the two districts because of the use of of the respective populations for each district.
Indicators thus allow comparison, and are the prime tool for data analysis. DHIS2 should provide relevant indicators
for analysis for all health programs, not just the raw data. Most report modules in DHIS 2 support both data elements
and indicators and you can also combine these in custom reports.
14.3. Indicator-driven data collection
Since indicators are more suited for analysis compared to data elements, the calculation of indicators should be the
main driving force for collection of data. A usual situation is that much data is collected but never used in any indicator,
which significantly reduces the usability of the data. Either the captured data elements should be included in indicators
used for management or they should probably not be collected at all.
For implementation purposes, a list of indicators used for management should be defined and implemented in DHIS
2. For analysis, training should focus on the use of indicators and why these are better suited than data elements for
this purpose.
14.4. Managing indicators
Indicators can be added, deleted, or modified at any time in DHIS2 without affecting the data. Indicators are not stored
as values in DHIS2, but as formulas, which are calculated whenever the user needs them. Thus a change in the formulas
will only lead to different data elements being called for when using the indicator for analysis, without any changes
to the underlying data values taking place. For information how to manage indicators, please refer to the chapter on
indicators in the DHIS2 user documentation.
56
Users and User Roles
Users
Chapter 15. Users and User Roles
DHIS 2 comes with an advanced solution for fine-grained management of users and user roles. The system is completely
flexible in terms of the number and type of users and roles allowed.
15.1. Users
A user in the DHIS 2 context is a human who is utilizing the software. Each user in DHIS 2 has a user account which is
identified by a username. A user account allows the user to authenticate to system services and be granted authorization
to access them. To log in (authenticate) the user is required to enter a valid combination of username and password. If
that combination matches a username and password registered in the database, the user is allowed to enter.
In addition, a user should be given a first name, surname, email and phone number. This information is important to
get correct when creating new users since certain functions in DHIS 2 relies on sending emails to notify users about
important events. It is also useful to be able to communicate to users directly over email and telephone to discuss data
management issues or to sort out potential problems with the system.
A user in DHIS 2 is associated with an organisation unit. This implies that when creating a new user account that
account should be associated to the location where user works. For instance when creating a user account for a district
record officer that user account should be linked with the particular district where she works. The link between user
account and organisation unit has several implications for the operation of the system:
• In the data entry module, a user can only be entering data for the organisation unit she is associated with and the
organisation units below that in the hierarchy. For instance, a district records officer will be able to register data for
her district and the facilities below that district only.
• In the user module, a user can only create new users for the organisation unit she is associated with in addition to
the organisation units below that in the hierarchy.
• In the reports module, a user can only view reports her organisation units and those below. (This is something we
consider to open up to allow for comparison reports.)
A user role in DHIS 2 is also associated with a set of user roles. Such user roles are discussed in the following section.
15.2. User Roles
A user role in the DHIS 2 context is a group of authorities. An authority in this regard means the permission to perform
one or more specific tasks. For instance, a user role may contain authorities to create a new data element, update an
organisation unit or view a report. Such a group of authorities constitutes a user role.
In a health system the users are logically grouped with respect to the task they perform and the position they occupy.
Examples of commonly found positions are:
1. National health managers
2. National health information system division officers (HISO)
3. Province health managers
4. District health records and information officers (DHRIO)
5. Facility health records and information officers (HRIO)
6. Data entry clerks
When creating user roles such positions within the health system should be kept in mind and it is often sensible to
create a user role dedicated for each of those positions. The process of creating user roles should be aligned with the
process of deciding which users are doing what tasks in the system.
First it should be defined which users should fulfill the role as system administrators. This will often a part of the
members of the national HIS division and should have full authority in the system. Second a user role should be created
57
Users and User Roles
User Roles
roughly for each position. A sensible consideration of what authorities should be given each role must be done. An
important rule is that each role should only be given the authorities which are needed to perform the job well - not
more. When operating a large, centralized information system there is a need to coordinate the work between the people
involved. This is made easier if only those who are supposed to perform a task have the authorities to perform it.
An example might highlight this issue: The task of setting up the basic structure (meta-data) of the system is critical
to the system and should only be performed by the administrators of system. This means that the system administrator
user role should have the authority to add, update and delete the core elements of the system such as data elements,
indicators and data sets. Allowing users outside the team of system administrators to modify these elements might lead
to problems with coordination.
National and provincial health managers are often concerned with data analysis and monitoring. Hence this group of
users should be authorized to access and use the reports module, GIS module, data quality module and dashboard.
However they would not need authority to enter data or update data elements and data sets. District information officers
are often tasked with both entering data into the system coming from facilities which are not able to do so directly as
well as monitoring, evaluation and analysis of data. This means that they will need access to all of the analysis and
validation modules mentioned above in addition to the authority to access and use the data entry module.
In addition, a user role is associated with a collection of data sets. This affects the data entry module in that the user
is only allowed to enter data for the data sets registered for her user role. This is often useful in situations where one
wants to allow officers from health programs to enter data for their relevant data entry forms only.
A user can be granted one or any number of user roles. In the case of many user roles, the user is privileged with the
sum of all authorities and data sets included in the user roles. This means that user roles can be mixed and matched
for special purposes instead of merely creating new ones.
An important part of user management is to control which users are allowed to create new users with which authorities.
In DHIS 2 one can control which users are allowed to perform this task. In this process the key principle is that a user
can only grant authorities and access to data sets that the user itself has. The users at national, province and district
level are often relatively few and can be created and managed by the system administrators. If a large part of the
facilities are entering data directly into the system the number of users might become unwieldy. Experience suggests
that delegating and decentralizing this task to the district officers will make the process more efficient and support
the facility users better.
58
Data Analysis Tools Overview
Data analysis tools
Chapter 16. Data Analysis Tools
Overview
This chapter offers an overview of the available tools for data analysis provided by DHIS 2 along with a description
of the purpose and benefits of each. If you are looking for a detailed guide on how to use each tool we recommend to
continue to read the user guide after finishing this chapter. The following list shows the various tools:
1. Standard reports
2. Data set reports
3. Data completeness reports
4. Static reports
5. Organisation unit distribution reports
6. Report tables
7. Charts
8. Web Pivot table
9. GIS
10.My Datamart and Excel pivot tables
16.1. Data analysis tools
The following section gives a description of each tool.
16.1.1. Standard reports
Standard reports are reports with predefined designs. This means that the reports are easily accessible with a few clicks
and can be consumed by users at all levels of experience. The report can contain statistics in the form of tables and charts
and can be tailored to suit most requirements. The report solution in DHIS 2 is based on JasperReports and reports are
most often designed with the iReport report designer. Even though the report design is fixed, data can be dynamically
loaded into the report based on any organisation unit from in the hierarchy and with a variety of time periods.
16.1.2. Data set reports
Data set reports displays the design of data entry forms as a report populated with aggregated data (as opposed to
captured low-level data). This report is easily accessible for all types of users and gives quick access to aggregate data.
There is often a legacy requirement for viewing data entry forms as reports which this tool efficiently provides for.
The data set report supports all types of data entry forms including section and custom forms.
16.1.3. Data completeness report
The data completeness report produces statistics for the degree of completeness of data entry forms. The statistical
data can be analysed per individual data sets or per a list of organisation units with a common parent in the hierarchy.
It provides a percentage value for the total completeness and for the completeness of timely submissions. One can use
various definitions of completeness as basis for the statistics: First based on number of data sets marked manually as
complete by the user entering data. Second based on whether all data element defined as compulsory are being filled
in for a data set. Third based on the percentage of number of values filled over the total number of values in a data set.
16.1.4. Static reports
Static reports provides two methods for linking to existing resources in the user interface. First it provides the possibility
to link to a resource on the Internet trough a URL. Second it provides the possibility to upload files to the system
59
Data Analysis Tools Overview
Organisation unit distribution reports
and link to those files. The type of files to upload can be any kind of document, image or video. Useful examples of
documents to link to are health surveys, policy documents and annual plans. URLs can point to relevant web sites such
as the Ministry of Health home page, sources of health related information. In addition it can be used as an interface
to third-party web based analysis tools by pointing at specific resources. One example is pointing a URL to a report
served by the BIRT reporting framework.
16.1.5. Organisation unit distribution reports
The organisation unit distribution report provides statistics on the facilities (organisation units) in the hierarchy based
on their classification. The classification is based on organisation unit groups and group sets. For instance can facilities
be classified by type through assignment to the relevant group from the group set for organisation unit type. The
distribution report produces the number of facilities for each class and can be generated for all organisation units and
for all group sets in the system.
16.1.6. Report tables
Report tables are reports based on aggregated data in a tabular format. A report table can be used as a stand-alone
report or can be used as data source for a more sophisticated standard report design. The tabular format can be crosstabulated with any number of dimensions appearing as columns. It can contain indicator and data element aggregate
data as well as completeness data for data sets. It can contain relative periods which enables the report to be reused over
time. It can contain user selectable parameters for organisation units and periods to enable the report to be reused for all
organisation units in the hierarchy. The report table can be limited to the top results and sorted ascending or descending.
When generated the report table data can be downloaded as PDF, Excel workbook, CSV file and Jasper report.
16.1.7. Charts
The chart component offers a wide variety of charts including the standard bar, line and pie charts. The charts can
contain indicators, data elements, periods and organisation units on both the x and y axis as well as a fixed horizontal
target line. Charts can be view directly or as part of the dashboard as will be explained later.
16.1.8. Web Pivot tables
The web pivot table offers quick access to statistical data in a tabular format and provides the ability to “pivot” any
number of the dimensions such as indicators, data elements, organisation units and periods to appear on columns and
rows in order to create tailored views. Each cell in the table can be visualized as a bar chart.
16.1.9. GIS
The GIS module gives the ability to visualize aggregate data on maps. The GIS module can provide thematic mapping
of polygons such as provinces and districts and of points such as facilities in separate layers. The mentioned layers
can be displayed together and be combined with custom overlays. Such map views can be easily navigated back in
history, saved for easy access at a later stage and saved to disk as an image file. The GIS module provides automatic
and fixed class breaks for thematic mapping, predefined and automatic legend sets, ability to display labels (names) for
the geographical elements and the ability to measure the distance between points in the map. Mapping can be viewed
for any indicator or data element and for any level in the organisation unit hierarchy. There is also a special layer for
displaying facilities on the map where each one is represented with a symbol based on the its type.
16.1.10. My Datamart and Excel Pivot tables
The purpose of the My Datamart tool is provide users with full access to aggregate data even on unreliable Internet
connections. This tool consists of a light-weight client application which is installed at the computer of the users. It
connects to an online central server running a DHIS 2 instance, downloads aggregate data and stores it in a database
at he local computer. This database can be used to connect third-party tools such as MS Excel Pivot tables, which is a
powerful tool for data analysis and visualization. This solution implies that just short periods of Internet connectivity
60
Data Analysis Tools Overview
My Datamart and Excel Pivot tables
are required to synchronize the client database with the central online one, and that after this process is done the data
will be available independent of connectivity. Please read the chapter dedicated to this tool for in-depth information.
61
Pivot Tables and the MyDataMart tool
Pivot table design
Chapter 17. Pivot Tables and the
MyDataMart tool
Excel Pivot Table (see screenshot below) is a powerful and dynamic data analysis tool that can be automatically linked
to the DHIS 2 data. While most reporting tools in DHIS 2 are limited in how much data they can present at the same
time, the pivot tables are designed to give nice overviews with multiple data elements or indicators, and organisation
units and periods (see example below). Furthermore, the dynamic features in pivoting and drill-down are very different
from static spreadsheets or many web reports, and his makes it a useful tool for information users that want to do
more in-depth analysis and to manipulate the views on the data more dynamically. This combined with the well-known
charting capabilities of Excel, the Pivot Table tool has made it a popular analysis tool among the more advanced DHIS
users for a long time.
With the recent shift towards online deployments, the offline pivot tables in Excel also provide a useful alternative to
the online reporting tools as they allow for local data analysis without Internet connectivity, which can be an advantage
on unstable or expensive connections. Internet is only needed to download new data from the online server, and as
soon as the data exists locally, working with the pivot tables require no connectivity. The MyDatamart tool, which is
explained in detail further down, helps the users to maintain a local data mart file (small database) which is updated
over the Internet against the online server, and then used as an offline data source that feeds the pivot tables with data.
17.1. Pivot table design
Typically an Excel pivot table file set up for DHIS 2 will contain multiple worksheets with one pivot table on each
sheet. A table can consist of either raw data values (by data elements) or indicator values, and will usually be named
based on which level of the organisation unit hierarchy the source data is aggregated by as well as the period type
(frequency e.g. Monthly, Yearly) of the data. A standard DHIS 2 pivot table file includes the following pivot tables:
District Indicators, District Data Monthly, District Data Yearly, Facility Indicators, Facility Data Monthly, Facility
Data Yearly. In addition there might be more specialized tables that focus on specific programs and/or other period
types.
One popular feature of pivot tables is to be able to drag-and-drop the various fields between the three positions page/
filter, row, and columns, and thereby completely change the data view. These fields can be seen as dimensions to the
data values and represent the dimensions in the DHIS data model; organisation unit (one field per level), data elements
or indicators, periods, and then a dynamically extended lists of additional dimensions representing organisation unit/
63
Pivot Tables and the MyDataMart tool
Connecting to the DHIS 2 database
indicator/data element group sets and data element categories (see other chapters of this guide for details). In fact a
dynamic pivot table is an excellent tool to represent the many dimensions created in the DHIS 2, and makes it very
easy to zoom in or out on each dimension, e.g. look at raw data values by individual age groups or just by its total, or
in combination with other dimensions like gender. All the dimensions created in the DHIS 2 will be reflected in the
available fields list of each pivot table, and then it is up to the user to select which ones to use.
It is important to understand that the values in the pivot tables are non-editable and all the names and numbers are
fetched directly from the DHIS 2 database, which makes it different from a normal spreadsheet. In order to be edited,
the contents of a pivot table must be copied to a normal spreadsheet, but this is rarely needed as all the names can be
edited in DHIS 2 (and then be reflected in the pivot tables on the next update). The names (captions) on each field
however are editable, but not their contents (values).
17.2. Connecting to the DHIS 2 database
Each pivot table has a connection to the DHIS 2 database and makes use of a pivot source view (SQL query) in the
database to fetch the data. These queries pull all their data from the data mart tables, so it is important to keep the data
mart updated at all times in order to get the most recent data into the pivot tables. A pivot table can connect to a database
on the local computer or on a remote server. This makes it well suitable for use in a local network where there is only
one shared database and multiple client computers using pivot tables. Excel can also connect to databases running
on Linux. The database connection used in the pivot tables is specified in an ODBC data source on the Windows
computers running pivot tables.
For online deployments the recommended way to connect to the DHIS 2 data is to make use of the MyDatamart tool,
which creates and updates a local data mart file (database) that Excel can connect to. The MyDatamart tool will be
described in detail further down.
17.3. Dealing with large amounts of data
The amount of data in a DHIS 2 database can easily go beyond the capabilities of Excel. A table with around 1
million values (rows of data) tend to become less responsive to updates (refresh) and pivoting operations, and on some
computers Excel will give out of memory errors when dealing with tables of this size. Typically, the more powerful
the computer, the more data can be handled, but the top limit seems to be around 1 million rows even on the highend computers.
To deal with this problem the standard DHIS pivot table setup is to split the data over several pivot tables. There are
different ways of splitting the data; by organisation unit aggregation level (how deep), by organisation unit coverage/
boundary area (how wide), by period (e.g. one year of data at a time), or by data element or indicator groups (e.g. by
health programs or themes). Aggregating away the lowest level in the organisation unit hierarchy is the most effective
approach as it reduces the amount of data by a factor of the number of health facilities in a country. Typically there
is no need to look at all the health facilities in a country at the same time, but instead only for a limited area (e.g.
district or province). And when there is a need for data for the whole country that can be provided with district level
aggregates or similar. At a district or province office the users will typically have facility level data only for their own
area, and then for the neighboring areas the data will be aggregated up one or two levels to reduce the size of data, but
still allow for comparison, split into e.g. the two tables Facility Data and Data District Data, and similar for indicator
values. Splitting data by period or by data element/indicator groups work more or less in the same way, and can be
done either in combination with the organisation unit splitting or instead of it. E.g. if a health program wants to analyse
a few data elements at facility level for the whole country that can be possible. The splitting is controlled by the pivot
views in the database where one specifies which data values to fetch.
17.4. The MyDatamart tool
With online deployments and the use of one single central server (and database) the local use of pivot tables becomes
more difficult as Excel connects to the database directly to fetch the data. This means that Excel (and every local
64
Pivot Tables and the MyDataMart tool
Using Excel pivot tables and MyDatamart - a
work-flow example
computer using DHIS2) would need connection details and access to the database on the server, which is not always
wanted. Furthermore, the refresh (update the pivot table) operation in Excel completely empties the table before
reloading all the data again (new and old), which leads to big and duplicated data downloads over the Internet when
connecting to an online server. The solution to these problems has been to build up and maintain an updated "copy"
of the central database in each local office where they use Excel pivot tables. These local databases are called data
marts and are built specifically for serving as data sources for data analysis tools like Excel. The MyDatamart tool is
a newly developed (May 2011) tool that creates a datamart file on a local computer and helps the users to update this
against a central server. The pivot tables in Excel connect only to the local datamart and do not need to know about
the central server at all.
The use of MyDatamart dramatically reduces the download size when routinely updating the local Excel files against
the central server compared to a direct connection from Excel. It also brings comfort to the local level users to have a
copy of their data on their local computer and not to rely on a Internet connection or server up-time to access it. The
figure below explains how the linking between the central online server (in the clouds) and the local offices works.
17.5. Using Excel pivot tables and MyDatamart - a work-flow example
The details of using the MyDatamart tool are explained in a separate user manual and this section only tries to explain
the typical work-flow involved in using the tool together with the pivot tables.
17.5.1. Download and run the MyDatamart tool for the first time
MyDatamart is a small tool that is easy to download and run immediately. Download mydatamart.exe to the Desktop
and run it by double-clicking on the file. The first thing you need to do is to create a new datamart file, and then you
type in the login details needed to access the central server (url, username. password). The tool will connect to the
server (Internet connection needed at this point) and verify your credentials. The next step is to download all the metadata from the server meaning all the organisation units, data elements, indicators, groups etc. This might take some
time depending on your computer's specifications and the speed of the connection, but is a step that is rarely needed
after this first download. Once the tool knows the organisation unit hierarchy you can specify which organisation unit
you "belong" to and the analysis level you are interested in. These are settings that limit which organisation units you
65
Pivot Tables and the MyDataMart tool
Setup and distribute the pivot tables
will download data for. The next thing is to download the data from the server, and then you must specify which
periods to download.
17.5.2. Setup and distribute the pivot tables
The first thing needed is to download and install an ODBC driver for SQLite, which is the database server running the
local datamart. The database connections in the pivot tables depend on this driver and will fail without installed.
The next thing is to set up the pivot tables themselves. This is a one-off job since the file can be reused as a template in
all other locations connecting to the same central database. The MyDatamart tool can produce a skeleton Excel file for
you with all the necessary database connections already defined. This will help the process considerably and most of
the work is to select which fields to use in each table and give them proper names. The user manual has all the detailed
instructions on how to set up a pivot table using the MyDatamart connections.
Once the template Excel file is available it is a matter of distributing it to all local offices that will use pivot tables and
to make sure the connections are still valid on the local computers. The connection details in Excel depend on the odbc
driver being available and on the name and location of the datamart file. Either you can streamline all local datamart
files (by name and location, e.g. "C:\dhis2\dhis2.dmart", or you can use the MyDatamart tool to update the connection
details in an existing Excel file to match the location of the local datamart file.
17.5.3. Update MyDatamart
Whenever there is new data available on the central server, e.g. every month, the users will have to open the
MyDatamart tool, log on to the server, and then pick the months to download. Once the download has finished the
data is available locally in the datamart file.
17.5.4. Update the Pivot tables
Once the local datamart file has been update the users can update the pivot tables by using the Refresh function, once
per table. It is important to remember to save the Excel file after refreshing all the tables.
17.5.5. Repeat step 3 and 4 when new data is available on the central server
Whenever there is new data on the server repeat step number 3 and 4 (the two previous steps) in order to update the
pivot tables and get access to the latest data.
66
DHIS as a platform
Chapter 18. DHIS as a platform
DHIS can be perceived as a platform on several levels. First, the application database is designed ground-up with
flexibility in mind. Data structures such as data elements, organisation units, forms and user roles can be defined
completely freely through the application user interface. This makes it possible for the system to be adapted to a
multitude of locale contexts and use-cases. We have seen that DHIS supports most major requirements for routine data
capture and analysis emerging in country implementations. It also makes it possible for DHIS to serve as management
system for domains such as logistics, labs and finance.
Second, due to the modular design of DHIS it can be extended with additional software modules. These software
modules can live side by side with the core modules of DHIS and can be integrated into the DHIS portal and menu
system. This is a powerful feature as it makes it possible to extend the system with extra functionality when needed,
typically for country specific requirements as earlier pointed out.
The downside of the software module extensibility is that it puts several constraints on the development process. The
developers creating the extra functionality are limited to the DHIS technology in terms of programming language and
software frameworks, in addition to the constraints put on the design of modules by the DHIS portal solution. Also,
these modules must be included in the DHIS software when the software is built and deployed on the web server, not
dynamically during run-time.
In order to overcome these limitations and achieve a looser coupling between the DHIS service layer and additional
software artifacts, the DHIS development team decided to create a Web API. This Web API complies with the rules
of the REST architectural style. This implies that:
• The Web API provides a navigable and machine-readable interface to the complete DHIS data model. For instance,
one can access the full list of data elements, then navigate using the provided hyperlink to a particular data element
of interest, then navigate using the provided hyperlink to the list of forms which this data element is part of. E.g.
clients will only do state transitions using the hyperlinks which are dynamically embedded in the responses.
• Data is accessed through a uniform interface (URLs) using a well-known protocol. There are no fancy transport
formats or protocols involved - just the well-tested, well-understood HTTP protocol which is the main building
block of the Web today. This implies that third-party developers can develop software using the DHIS data model
and data without knowing the DHIS specific technology or complying with the DHIS design constraints.
• All data including meta-data, reports, maps and charts, known as resources in REST terminology, can be retrieved
in most of the popular representation formats of the Web of today, such as HTML, XML, JSON, PDF and PNG.
These formats are widely supported in applications and programming languages and gives third-party developers
a wide range of implementation options.
67
DHIS as a platform
Web portals
There are several scenarios where additional software artifacts may connect to the DHIS Web API.
18.1. Web portals
First, Web portals may be built on top of the Web API. A Web portal in this regard is a web site which functions as a
point of access to information from a potential large number of data sources which typically share a common theme.
The role of the Web portal is to make such data sources easily accessible in a structured fashion under a common lookand-feel and provide a comprehensive data view for end users.
Aggregate data repository: A Web portal targeted at the health domain may use the DHIS as the main source for
aggregate data. The portal can connect to the Web API and communicate with relevant resources such as maps, charts,
reports, tables and static documents. These data views can dynamically visualize aggregate data based on queries on
the organisation unit, indicator or period dimension. The portal can add value to the information accessibility in several
ways. It can be structured in a user-friendly way and make data accessible to inexperienced users. It can provide various
approaches to the data, including:
• Thematic - grouping indicators by topic. Examples of such topics are immunization, mother care, notifiable diseases
and environmental health.
• Geographical - grouping data by provinces. This will enable easy comparison of performance and workload.
Mash-up: The Web portal is not limited to consuming data from a single Web API - it can be connected to any number
of APIs and be used to mash up data from auxiliary systems within the health domain. If available the portal might pull
into specialized data from logistics systems tracking and managing ARV medicines, from finance systems managing
payments to health facilities and from lab systems tracking lab tests for communicable diseases. Data from all of these
sources might be presented in a coherent and meaningful way to provide better insight in the situation of the health
domain.
Document repository: The Web portal can act as a document repository in itself (also referred to as content management
system). Relevant documents such as published reports, survey data, annual operational plans and FAQs might be
68
DHIS as a platform
Apps
uploaded and managed in terms of ownership, version control and classification. This makes the portal a central point
for document sharing and collaboration. The emergence of high-quality, open source repository/CMS solutions such
as Alfresco and Drupal makes this approach more feasible and compelling.
Knowledge management: KM refers to practices for identifying, materializing and distributing insight and experience.
In our context it relates to all aspects of information system implementation and use, such as:
• Database design
• Information system usage and how-to
• End-user training guidelines
• Data use, analysis and interpretation
Knowledge and learning within these areas can be materialized in the form of manuals, papers, books, slide sets, videos,
system embedded help text, online learning sites, forums, FAQs and more. All of these artifacts might be published
and made accessible from the Web portal.
Forum: The portal can provide a forum for hosting discussions between professional users. The subject can range
from help for performing basic operations in the health information system to discussions over data analysis and
interpretation topics. Such a forum can act as interactive source for information and evolve naturally into a valuable
archive.
18.2. Apps
Second, third-party software clients running on devices such as mobile phones, smart phones and tablets may connect
to the DHIS Web API and read and write to relevant resources. For instance, third-party developers may create a client
running on the Android operating system on mobile devices targeted at community health workers who needs to keep
track of the people to visit, register vital data for each encounter and receive reminders of due dates for patient care
while travelling freely in the community. Such a client application might interact with the patient and activity plan
resources exposed by the DHIS Web API. The developer will not be dependent on deep insight in the DHIS internal
implementation, rather just basic skills within HTTP/Web programming and a bit of knowledge of the DHIS data
model. Understanding the DHIS data model is made easier by the navigable nature of the Web API.
18.3. Information Systems
Third, information system developers aiming at creating new ways of visualizing and presenting aggregate data can
utilize the DHIS Web API as the service layer of their system. The effort needed for developing new information
systems and maintaining them over time is often largely under-estimated. Instead of starting from scratch, a new
application can be built on top of the Web API. Developer attention can be directed towards making new, innovative
and creative data representations and visualizations, in the form of e.g. dashboards, GIS and charting components.
69
Localization concepts
DHIS 2 i18n tool
Chapter 19. Localization concepts
Localization involves the adaptation of an application to another location. When implementing DHIS 2 in a given
country, adequate resources should be allocated to translate the application when required. Translation of the user
interface elements, messages, layout, date and time formats, currency and other aspects must be considered. DHIS
2 supports internationalization (i18n) of the user interface through the use of Java property strings. Each element in
the user interface has been assigned a specific key which is linked to a value. As an example, consider the following
key/value pairs.
org_unit_tree=Organisation Unit Tree
error_occurred=An error has occurred.
In French the same key/value pairs would appear as follows
org_unit_tree=Arborescence des unités d'organisation
error_occurred=Une erreur s'est produite
Note that the keys (text before the = symbol) are the same in both examples, but the values (after the = ) symbol are in
each of the respective languages. Each of these key/value pairs would need to be translated from the original language
(English) to the destination language (e.g. French). When the user specifies French for the user interface language,
all of the strings would then appear in French instead of the default language (English). Any strings which have not
been translated, would appear in English.
The translation keys and values are stored in files called resource bundles. The resource bundles follow fallback rules,
meaning that one can create a hierarchy of resource bundles through the file naming convention where property keys
are searched from the bottom of the hierarchy and returned at the first match. This comes in useful when you need
partial translations, for instance to cater for country-specific variances in a language. One example is Portuguese for
which DHIS 2 has several resource bundles:
1. i18n_global.properties (The ulimate fallback locale, which is English)
2. i18n_module_pt.properties (Portuguese translations)
3. i18n_module_pt_BR.properties (Brazilian Portuguese translations)
This structure allows us to have a full general Portuguese translation, and a partial Brazilian Portuguese translation
which provides translations of Brazilian-specific keys. For keys which are not translated in the Brazilian Portuguese
resource bundle, the system will fall back to the general Portuguese translation. If the key is not present in that file
either, the system will fall back to the ultimate fallback locale which is English.
There are a number of different mechanisms to begin to localize DHIS 2, two of which will be discussed in the next
sections.
19.1. DHIS 2 i18n tool
The i18n resource editor is Java desktop application which can be downloaded from http://www.dhis2.org/downloads .
It requires that you have checked out the DHIS 2 source code from Bazaar (check out http://www.dhis2.org/
development if necessary) and have a Java Runtime Environment installed on your computer. On Windows, simly
unpack the ZIP archvie and click the executable file. On Linux, extract the archive, navigate inside the extracted
directory and invoke the following:
java -jar dhis-i18n-resourceeditor.jar
1. Press "Browse" when the application starts and select the path to the "dhis-2" directory inside your local copy
(checkout) of the DHIS 2 source code repository, followed by OK.
71
Localization concepts
DHIS 2 i18n tool
2. Next, select the destination locale which you will translate strings into. Remember that if you want to create or add
to a general language translation, select e.g. "Portuguese - [pt]. If you want to create a country-specific translation,
select e.g. "Portuguese - Brazil [pt_BR]. Locales which already have keys translated will show the text "Resources
for this locale exist".
72
Localization concepts
DHIS 2 i18n tool
3. Select one of the web modules from the left hand side to translate, e.g. dhis-web-maintenance-dataset.
73
Localization concepts
Using the DHIS 2 translation server
Once you have selected a module, click on a particular key from the left-hand side. A reference value for the key will
be displayed in the lower right-hand pane, and the translation value will be displayed in the upper right-hand pane.
Keys with missing values will be indicated with a red icon. If the value does not exist, simply add the translation
there.
4. Once you have finished translating, make sure to press the "Save" button.
19.2. Using the DHIS 2 translation server
A web-based portal solution has been setup in order to facilitate the translation of DHIS 2 into multiple languages.
Simply direct your browser to http://translate.dhis2.net/ and register for an account by providing a username, email
address and password. The server will send you a confirmation email which you can use to activate your account.
Once you have activated your account, simply press the "Log in" link from the main portal page, and provide your
username and password.
The first time you login, you should select your settings, by clicking "My account->Settings". Here you can select your
interface language, the projects which you wish to work on, and the languages which you will translate into. Be sure
to press "Save" when have finished making your changes.
To start translating, be sure you have logged in, and then press the "Home" link in the upper-right hand corner. Select
a project (e.g. DHIS 2) and then click on the language which you wish to translate. The number of words which need
to be translated will be displayed under the "Summary" field. Click on one of the modules (e.g. dhis-2) and the keep
drilling down through the folders to find a module which needs translation, (e.g. dhis-web->dhis-web-caseentry). Now
click on the "Summary" text which will say something like "194 words need attention". You will be directed to the
key/value pair which requires translation.
74
Localization concepts
Important localization concepts
In this case, we need to translate the phrase "Name-based" from English to French. Enter the translation in the window
just below the reference phrase.. If you are unsure if the translation is correct or needs review, you can mark it as
"Fuzzy". Once you have completed the translation, just press "Submit". Your translations will be incorporated into the
source code on a regular basis by the development team.
19.3. Important localization concepts
Important
• There are a number of key/value pairs such as "format.FinancialApril.startDate=dd MMM yyyy 'to '" which
are used for date/time formatting in the application. Part of the value should not be translated because it is
actually a Java date formatting template. It this example it is "dd MMM yyyy". Consult this site for more
information on the Java date formatting syntax. The part of the value which can be translated would be "to",
for instance to "a" in Spanish. If these data format template strings are translated, it may result in errors
in the application.
• It is not necessary to translate a string from the original language (English) if the translated string is the
same. You can simply leave it blank. By default, DHIS 2 will use English values for all strings which have
not been translated.
• All translated strings must be stored in escaped UTF-8 format. If you are using the translation portal, be sure
your browser settings are set to UTF-8 when translating. If you are using a text editor or other tool such as an
IDE, you may need to convert the UTF-8 characters to escaped syntax, using the Java "native2ascii" utility.
• Some special variables (e.g. {0} ) used curly brackets. This denotes a variable which will be replaced by a
number or other value by the application. You must place this variable notation in the correct position.
75
DHIS2 Tools Guide
Overview
Chapter 20. DHIS2 Tools Guide
20.1. Overview
The dhis2-tools package is a collection of tools and utilities for installing and managing DHIS2 applications on an
ubuntu server. The tools provide the ability to go from a "blank" server with only ssh running, to a fully functioning
dhis2 installation in a matter of minutes. Used together they can also be combined into automated scripts to facilitate
rapid reconstruction of a given configuration.
The tools have been collected and developed over a number of years. This documentation differs in some respects
from the installation guidelines in the dhis2 user manual in that it describes the implementation of a specific approach
rather than the more general tutorial nature of the user manual. It is recommended that implementers do also study the
material in the user manual as it provides additional information, eg. how to tune the postgresql server. The rationale
of the tools described in this manual includes:
1. to ease the process of installation so that it can be easily explained, documented and executed;
2. to assist system administrators (particularly, but not exclusively, lesser experienced ones) to implement reasonable
security measures by default and thus minimize vulnerabilities brought about through human error and negligence;
3. to provide a set of scripts to assist the administrator with tasks related to managing their dhis2 system, beyond the
one off process of installation.
The package remains a work in progress and there are a number of areas where it could and should (and hopefully
will be improved). For example,
1. currently the tuning of the postgresql database is not covered. There are ways in which this could be at least semi
automated;
2. nginx configuration is assisted by means of providing a sample configuration file. This configuration could be made
more dynamic;
3. the format of what is currently packaged is an Ubuntu linux deb package. There is also considerable interest in the
Redhat/CentOS flavour of linux for running dhis2. It should be possible to offer a yum format package to facilitate
use on these systems.
20.2. Architecture
The figure below shows the main components involved in a DHIS2 system.
77
DHIS2 Tools Guide
Installation
PHYSICAL SPACE (Data centre/ Server room )
Postgresql Database
DHIS2 instances
DHIS WEB APPLICATION
web Proxy
(nginx)
Webapp container
(tomcat)
Operating system
Hardware
Rout er
Users
Figure 20.1. Single machine all-in-one installation
The dhis2-tools are primarily concerned with the creation and managing of the tomcat instances which deliver the
web application. As you can see in the diagram there may be one or more of these. In addition the system requires a
postgresql database server and an nginx web proxy server. There are many possible configurations where these can be
running on a different server than the dhis2 instances. These tools for the most part assume that they are all installed
together on the one machine. Some customisation is required to separate them.
When an instance is created with the dhis2-create-instance command, a new user is created with the name of the
instance (lets say its called hmis). The home directory of that user is located at /var/lib/dhis2/hmis. A database role is
created also called hmis together with a database with the name of hmis. The DHIS2_HOME environment variable
for the instance is set to the same home directory of the user.
The essential components of a standalone tomcat instance are also created within the same directory (modelled after
the ubuntu tomcat7-user package). The web.xml file of that tomcat instance has been customized to allow an upstream
web proxy server (such as nginx) to cache the static content of the dhis2 application.
The user will also have a crontab configuration automatically setup to manage daily backups, start on computer restart
and log file rotation.
Note that postgresql optimization, as described in the dhis2 user documentation, is not managed by this package and
needs to be done as a post-installation step.
20.3. Installation
This manual assumes that you have installed a minimal distribution of ubuntu server 12.04 LTS or 14.04 LTS.
By minimal we mean that only the base operating system is installed together with an openssh server. During the
installation you should avoid to install ANY other packages The dhis2-tools package will ensure that the required
packages are installed as dependencies.
It is recommended as a general guideline that before proceeding any further you should strengthen the security of the
system at this point by improving the security of your ssh service and installing a host based firewall like ufw. This
process is described eleswhere(?).
Once your base system is properly installed and secured you can proceed to install the dhis2-tools package from the
apt repository at http://apt.dhis2.org. The easiest way to do so is to run the install.sh script available at ...
78
DHIS2 Tools Guide
DHIS2 tools reference
The simplified set of steps to get a dhis2 instance up and running from here are:
1. turn your user (eg bobj) into a dhis2-admin user by running:
sudo dhis2-create-admin bobj
2. create an instance named eg dhis with:
dhis2-instance-create dhis
3. deploy the latest stable war file with:
dhis2-deploy-war dhis
4. setup a basic nginx template with:
dhis2-nginx
Note that nginx configuration is not done automatically. Though running the command dhis2-nginx will create a
simple site configuration file under /etc/nginx/sites-enabled/dhis2. You may need to edit this file to ensure that
instance names and port numbers are correct.
5. start your dhis instance with:
dhis2-startup dhis
A full description of these commands and others used for managing your instance is included in the command reference
section below.
20.4. DHIS2 tools reference
The reference documentation for the commands contained in the package is listed in the pages below. This
documentation should also be included as man pages when the package is installed. So for example you should be
able to type
man dhis2-instance-create
to read the documentation for that command on the system. Typing
apropos dhis2
will show you all the dhis2 related man pages.
79
DHIS2 Tools Guide
Name
dhis2-instance-create — Creates a new dhis2 instance
Synopsis
/usr/bin/dhis2-instance-create [ OPTIONS ] name
Description
Use this tool to create a new dhis2 instance in a tomcat container. The name that is specified will be used to create a
new user and a new database with the name of that user. The user will be assigned to the dhis2 group. The user will
have a home directory created in /var/lib/dhis2/<username>. This directory acts as both the DHIS2_HOME directory
and also the CATALINA_BASE directory for the tomcat servlet container.
By default the instance is allocated 2G of heap space RAM. This can be adjusted by editing the parameters in /var/
lib/dhis2/<name>/bin/setenv.sh.
The servlet container is configured to run with an http connector pool of a maximum of 100 threads. This parameter
can be adjusted by editing /var/lib/dhis2/<name>/conf/server.conf.
The servlet container configuration has been specially tweaked for running DHIS2. For example tomcat filters are used
to ensure that all static content from the web application are cacheable by web proxy servers such as nginx or apache.
The lib directory of the webapp has been explicitly placed in the application classpath so that additional jars such as
java compiled apache camel routes can be made available to the DHIS2 application.
Note that a dhis2 war file is not deployed by default. See the manual page for dhis2-deploy-war for instructions to
deploy a dhis2 war file over the internet from the latest stable global build, latest trunk build or from a user specified
war file on the filesystem.
You need to be a member of the dhis2-admin group to use these and other tools for managing the instance. See the
manual page for dhis2-create-admin.
OPTIONS
-p
http port
-n
DO NOT create the database when creating the instance. Note if you use this option you will have to manually
edit the properties file at /var/lib/dhis2/<instance>/hibernate.properties.
Examples
dhis2-instance-create -p 8080 hmis
Creates a new instance called hmis listening on http port 8080.
See also
dhis2-create-admin (1), dhis2-deploy-war (1), dhis2-startup (1), dhis2-shutdown (1), dhis2-deploy-war (1) and dhis2log (1).
80
DHIS2 Tools Guide
Name
dhis2-startup — Starts a dhis2 instance
Synopsis
/usr/bin/dhis2-startup {instance name}
Description
Start a dhis2 instance
Examples
dhis2-startup myInstance
See also
dhis2-shutdown (1), dhis2-deploy-war (1) and dhis2-instance-create (1).
81
DHIS2 Tools Guide
Name
dhis2-shutdown — Stops a dhis2 instance
Synopsis
/usr/bin/dhis2-shutdown {instance name}
Description
Stop a dhis2 instance
Examples
dhis2-shutdown myInstance
See also
dhis2-startup (1)
82
DHIS2 Tools Guide
Name
dhis2-clone — Clones the database of one instance to another instance
Synopsis
/usr/bin/dhis2-clone {master} {copy}
Description
This command creates a copy of the database and war file of one instance into another instance. The main use case for
this is where you want to setup an instance for training purposes. Trainees can be "let loose" on the training instance
without fear of disturbing the data or configuration of the production instance. They will however be working with the
same usernames, forms and reports which exist in the master. The command should be executed with care as it will
completely replace the existing database of the target instance
Scheduled datamart and analytics generation jobs are disabled in the target instance.
The command could conceivably be scheduled to run in the early morning to ensure that the database is restored to a
pristine state for the start of each day's training. Or it can be run on demand.
Examples
dhis2-clone hmis training
Creates a new instance called training from an existing instance called hmis.
83
DHIS2 Tools Guide
Name
dhis2-deploy-war — Deploys a war file
Synopsis
/usr/bin/dhis2-deploy-war [ OPTIONS ] instance name
OPTIONS
-t
Deploy war from latest trunk build. NOT RECOMMENDED for production systems
-l
Deploy war located at a custom url
-f
Deploy war from a file on the filesystem
Description
Deploys a dhis2 war file to the instance. The default behaviour when no options are given is to download and deploy
the latest stable release from http://stable.dhis2.org.
Examples
dhis2-deploy-war myInstance deploys the latest stable release from dhis2.org into myInstance.
dhis2-deploy-war -f wars/dhis.war myInstance deploys the war file at wars/dhis.war into myInstance.
dhis2-deploy-war -t myInstance deploys the latest trunk build from the dhis2 team integration server into myInstance.
Don't use this in production.
dhis2-deploy-war -l http://mywars.org/dhis.war myInstance deploys the war file from a user provided url into
myInstance.
84
DHIS2 Tools Guide
Name
dhis2-logview — Shows log file
Synopsis
/usr/bin/dhis2-logview {instance name}
Description
Use this tool to view log of dhis2 instance using less. Type ":q" to exit. See the man page for less for tips in navigating
and searching the file.
Examples
dhis2-logview myInstance
See also
dhis2-logtail (1).
85
DHIS2 Tools Guide
Name
dhis2-logtail — Shows the bottom log file in real time. Type Ctrl-C to exit.
Synopsis
/usr/bin/dhis2-logtail {instance name}
Description
Use this tool to show the log of dhis2 instance in real time.
Examples
dhis2-logtail myInstance
See also
dhis2-logview (1).
86
DHIS2 Tools Guide
Name
dhis2-create-admin — Create a user for administering dhis2 instances
Synopsis
/usr/bin/dhis2-create-admin {username}
Description
Creates a new dhis2 admin user. If the specified user does not exist, she will be created on the system. Otherwise an
existing user is modified. The dhis2 admin user will have postgres superuser privileges and wil be a member of the
dhis2admin group.
Examples
Create it like this
20.5. Troubleshooting guide
The following table shows some common problems which occur and likely remedies:
Table 20.1. Troubleshooting guide
Problem
Solution
When you attempt to access the site with your browser
it does not connect.
Either there is a network problem or nginx is not
running. Check first to see if you can ping the host.
If not you have a network problem. If you can ping
the site, the most likely problem is that nginx is not
installed or is not running. Verify that nginx is up and
running and listening on ports 443 and 80 by typing:
sudo netstat -ntlp
You should see the nginx process listening on those 2
ports
You can access the site but you see a 502 gateway
error in your browser.
This means that nginx is unable to connect to your
backend dhis2 instance. Either the instance is not
running or your nginx location configuration has
an error. Running the same netstat command above
should show your instance listening on 127.0.0.1 with
a port number typically 8080 or whatever you have
configured it as.
If its not running, try to start it with dhis2-startup
[instance name]
If it is still not running, check the log file with dhis2logview [instance name] to see if there is any
information indicating why it has failed to start.
If it is running and you can see it with netstat then you
need to check your nginx configuration file to ensure
that the locatio is correctly mapped.
You can access the site but you see a blank page in
your browser.
This usually means that the dhis2 instance is running,
but you have forgotten to deploy a war file to it. You
87
DHIS2 Tools Guide
Problem
Troubleshooting guide
Solution
need to run dhis2-deploy-war on that instance. See the
reference section above for details of options.
88
DHIS 2 Documentation Guide
DHIS 2 Documentation System Overview
Appendix A. DHIS 2 Documentation
Guide
A.1. DHIS 2 Documentation System Overview
DHIS 2 is a web-based aggregate information management system under very active development. Given the modular
nature of the system, its wide user base and distributed, global nature of development, a comprehensive documentation
system is required. An in-depth discussion of the need for documentation of DHIS 2 has been considered previously.
[Store2007] DocBook is a comprehensive XML based system for creation of books, papers and other technical
documents maintained by OASIS .
A.2. Introduction
One of the main advantages of DocBook is that there is complete separation between the content and presentation.
DocBook is a pure XML format, and is well documented. It is believed that only a very small subset of its features
will be required in order to achieve much higher quality documentation for DHIS. There are some 400 separate markup elements that cater to almost any level of technical documentation needs, but in reality, only a few dozen of these
element will probably need to be employed to achieve high-quality documentation for DHIS 2, both for printed as well
as on-line formats such as HTML or integrated help systems within the application itself. Therefore, there are wide
range of possibilities in terms of which editor can be used for the creation of DocBook files. A fairly complete list
of possibilities is located here. It is currently recommended to use WYSIWYG Syntext Serna Free editor for editing
DocBook source files. In principle, any text editing program or XML editor can be used to author DocBook files.
Note
It is not recommended to use the editor XMLmind XML Editor Personal Edition (also known as XXE Personal),
as the editor "silently" places unneeded whitespace and other ornamentation to the DocBook source which
makes collaborative editing of documents very difficult.
One of the key concepts to keep in mind when authoring documentation in DocBook, or other presentation neutral
formats, is that the content of the document should be considered in the first instance. The presentation of the
document will take place in a separate step, where it will be rendered into different formats, such as HTML and PDF. It
is therefore important that the document is will organised and structured, with appropriate DocBook tags and structural
elements being considered.
It is good practice to break your document in to various sections using the "sect", or section element. Section elements
can also be nested within each other, such as "Section 1" and "Section 2". This concept is essentially the same as
Microsoft Word™ or other word processing programs. DocBook will automatically take care of numbering the sections
for you when the document is produced. Two other important elements are the "itemizedlist" and "numberedlist".
These are quite similar, but an itemised list corresponds to a bulleted list, which a numbered list will be rendered with
each element being numbered sequentially. Other key elements are "screenshot" and "table" which should be selfexplanatory.
A.3. Getting started with GitHub
Currently, the documentation system is part of the source code housed at GitHub. GitHub is a collaborative platform
that enables multiple people to work on software projects collaboratively. In order for this to be possible, a version
control system is necessary in order to manage all the changes that multiple users may make. GitHub uses the git
source control system. While it is beyond the scope of this document to describe the functionality of git, users who
wish to create documentation will need to gain at least a basic understanding of how the system works. A basic guide
is provided in the next section.
89
DHIS 2 Documentation Guide
Getting the document source
In order to start adding or editing the documentation, you should first perform a checkout of the source code. If you do
not already have a GitHub account, you will need to get one. This can be done here. Once you register with GitHub,
you will need to request access to the dhis2-documenters group. Login to GitHub, and then file an issue here. Your
request will need to be approved by the group administrators. Once you have been granted access to the group, you
can commit changes to the documentation branch and send and receive notifications if you wish.
A.4. Getting the document source
In order to edit the documentation, you will need to download the source pages of the documentation to your computer.
GitHub uses a version control system known as git . There are different methods for getting Git working on your
system, depending on which operating system you are using. A good step-by-step guide for Microsoft™ operating
systems can be viewed here. Alternatively, if you are comfortable using the command line, you can download git from
this pageIf you are using Linux, you will need to install git on your system through your package manager, or from
source code. A very thorough reference for how git is used is available in a number of different formats here.
Once you have installed git on your system, you will need to download the document source. Just follow this procedure:
1. Make sure you have git installed.
2. On Windows systems, visit https://github.com/dhis2/dhis2docs and press "Clone in Desktop". If you are using the
command line, just type git clone [email protected]:dhis2/dhis2docs.git
3. The download process should start and all the documentation source files will be downloaded to the folder that
you specified.
4. The DHIS2 documents depend on other branches for their documentation. Be sure to keep these these up to date
as well. When you build the documentation, the necessary submodules will be downloaded automatically as part
of the build process ,if you have not already done so.
A.5. Editing the documentation
Once you have downloaded the source, you should have a series of folders inside of the dhis2docs directory. All
documents should be placed in the dhis2docs/src/docbkx/XX folder. Note that the XX represents the ISO 639-1
(two-letter) language code of the documentation. If you are developing English language documentation, place it
inside the /dhis2docs/src/docbkx/en/ folder. Place any image files that may be linked to your document in the
/dhis2docs/src/docbkx/XX/resources/images folder and link these inside your DocBook document using a
relative file link. When the documentation is built, in a separate step, the images will be automatically copied over to
the correct directory during the build process.
A.6. Using images
Screen shots are very useful for providing information to users on how particular actions should be performed. DocBook
has no intrinsic mechanisms to know exactly how an image should be rendered in the final document. Therefore, it is
necessary to provide instructions through element attributes. The following XML code fragment demonstrates how an
image can be specified to occupy 80% of the available page width. For screen shots in landscape format, this seems to
be an appropriate amount. You may need to experiment a bit to obtain a proper width for your image. Alternatively,
you can edit the resolution of the image itself, in order to obtain a proper size during rendering.
<screenshot>
<screeninfo>DHIS2 Login screen</screeninfo>
<mediaobject>
<imageobject>
<imagedata fileref="dhis2_login_screen.jpg" format="JPG" width="80%"/>
</imageobject>
</mediaobject>
</screenshot>
90
DHIS 2 Documentation Guide
Linking documents together
For other images, depending on their size, a different value may be necessary. If you do not specify a width for you
image, and its intrinsic size is larger than the available screen width, the image may overflow in certain document
types with a fixed width, such as PDF.
A.7. Linking documents together
DocBook provides a modular framework where many separate documents can be linked together into a master
document. Fragments from different documents can also be reused in different contexts. It is therefore important to
consider whether your document should be constructed as an article or a chapter. Chapters are essentially portions of
a book, and can therefore be linked together into a larger document very easily. Articles are essentially standalone
documents, but they can also be assembled together into a larger document at the component level.
Should you wish to link several articles together into a book, DocBook provides a mechanism to assign an id to a
section. In the example below, a section has been assigned an id. This id must be unique within the document.
<section id="mod2_1">
<title>Getting started with DHIS2</title> ....
In order to include an article into a book, an Xinclude statement must be used. The following example shows how.
<chapter>
<title>Getting started with DHIS2</title>
<xi:include xmlns:xi="http://www.w3.org/2001/XInclude" href="dhis2_user_man_mod2.xml"
xpointer="mod2_1" encoding="UTF-8"/>
...
Note that the file name and id have been assigned in the parent document, referring to the actual file (href) and particular
fragment of the child document that should be referenced in the parent document (xpointer).
Including chapters in a book is very simple. The example below illustrates how:
<xi:include xmlns:xi="http://www.w3.org/2001/XInclude" href="dhis2_user_man_
mod1.xml" encoding="UTF-8"/>
In this case, there is no need to explicitly reference a part of the document, unless you only want to include a portion
of the chapter. If you want to use a section of the chapter, you can assign an id to that section, and then reference that
section through an xpointer.
A.8. Handling multilingual documentation
The directory structure of the documentation has been created in order to facilitate the creation of documents in any
language. If you want to create a new set of documents in a given language, simply create a new directory in the
dhis2-docbook-docs/src/docbkx/ directory. Be sure to use the ISO 639-1 code for the language you are going to
create documents in. A complete list of these codes can be found here. Add a new folder for images in a sub-directory ,
replacing XX with the actual ISO 639-1 code for the language you will create documents in. You will also need to edit
the pom.xml file in the main dhis2docs directory. If you are unsure of what changes need to be made to this file, ask
on the mailing list first, as this file controls the generation of all the documentation.
A.9. Building the documentation
One of the key advantages of the DocBook format is that the source documentation can be transformed into a wide
variety of formats, including HTML, chunked HTML, XHTML, PDF, and a number of other formats. There are a wide
variety of tools that are capable of performing this task. Basically the XML source of the document is transformed using
the standard DocBook XSL style sheets into the desired format. The complete list of tools capable of transforming
DocBook will not be listed here, but a few examples are provided below.
91
DHIS 2 Documentation Guide
Building the documentation with Apache
maven
Latest builds of the documentation are available from the DHIS2 website. The latest snapshot builds are available
through the continuous integration server located here.
A.9.1. Building the documentation with Apache maven
In order to transform the documentation source files to different formats, such as HTML or PDF, you will need to
install the Apache Maven program. You can get a copy here or by installing it through your package manager if you are
using Linux. Just execute the command mvn clean package on Windows or on Linux from the /dhis2-docbookdocs directory. Maven will start to download the necessary components to transform the documents into HMTL,PDF
and RTF. Once the process has completed (be patient the first time, as there are a number of components that must
be downloaded), all of the target document types will be generated in the /dhis2docs/target/docbkx directory
in respective sub-directories.
A.9.2. Building with xmlto
xmlto is a useful utility available on Linux platforms for transforming DocBook documents into many different formats.
More information on the package can be found here. If you do not want to use Apache Maven for some reason,
you can install xmlto through your package manager. Once you have installed xmlto you can just execute xmlto
htmlfile_to_transform where the file_to_transform parameter is the name of the file you wish to transform.
There are many other formats available, such as PDF, PS, JavaHelp and others.
A.10. Committing your changes back to GitHub
Once you have finished editing your document, you will need to commit your changes back to GitHub. Open
up a command prompt on Windows or a shell on Linux, and navigate to the folder where you have placed your
documentation. If you have added any new files or folders to your local repository, you will need to add them to the
source tree with the git add command, followed by the folder or file name(s) that you have added. After that you
need to commit your changes. Be sure to include a descriptive comment with your commit. git commit -m "Created
Amharic translation of documentation" Finally, you should push the changes back to the repository with git push
origin master
If you have any questions, or cannot find that you can get started, just send an email with your problem to
<[email protected]>.
92


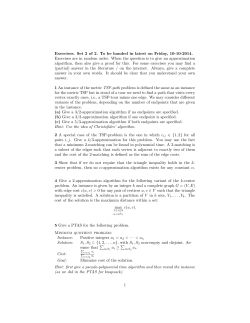


© Copyright 2026