
CHANSON, H. (2011). "Turbulent Shear Stresses in Hydraulic Jumps and... Experimental Study." Earth Surface Processes and Landforms, Vol. 36, No....
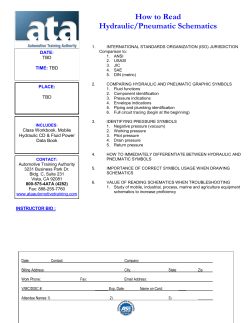
CHANSON, H. (2011). "Turbulent Shear Stresses in Hydraulic Jumps and Decelerating Surges: An Experimental Study." Earth Surface Processes and Landforms, Vol. 36, No. 2, pp. 180-189 & 2 videos (DOI: 10.1002/esp.2031 ) (ISSN 0197-9337). TURBULENT SHEAR STRESSES IN HYDRAULIC JUMPS, BORES AND DECELERATING SURGES Hubert CHANSON Professor in Civil Engineering, The University of Queensland, Brisbane QLD 4072, Australia, Ph.: (61 7) 3365 4163, Fax: (61 7) 3365 4599, E-mail: [email protected] Abstract: In an open channel, a sudden rise in water level induces a positive surge, or bore, that may develop as a hydraulic jump in translation. When the surge propagates against an adverse slope, it decelerates until it becomes a stationary hydraulic jump. Both hydraulic jumps and decelerating surges induce some intense turbulent mixing and have some major impact on the sediment transport in natural systems. Herein, a physical investigation was conducted in a relatively large rectangular channel. Hydraulic jumps and surges were generated by the rapid closure of a gate at the channel downstream end. The turbulent shear stresses were measured with a high temporal and spatial resolution (200 Hz sampling rate) in the jump flow. A comparison between the stationary hydraulic jump, hydraulic jump in translation and decelerating surge measurements showed some marked differences in terms of turbulent mixing. The results highlighted some intense mixing beneath the jump front and roller for all configurations. The levels of turbulent stresses were one to two orders of magnitude larger than a critical threshold for sediment motion. The findings provide some insights into the hydraulic jump migration processes in mobile bed channels, and the complex transformation from a moving jump into a stationary jump. Keywords: Hydraulic jumps, Positive surges, Decelerating surges, Turbulent shear stress, Turbulent mixing, Sediment transport. INTRODUCTION A hydraulic jump in translation results from a sudden change in flow that increases the depth. Called a positive surge or bore, it is the quasi-steady flow analogy of the stationary hydraulic jump (HENDERSON 1966). The positive surges were studied by hydraulic engineers and applied mathematicians for a few 1 CHANSON, H. (2011). "Turbulent Shear Stresses in Hydraulic Jumps and Decelerating Surges: An Experimental Study." Earth Surface Processes and Landforms, Vol. 36, No. 2, pp. 180-189 & 2 videos (DOI: 10.1002/esp.2031 ) (ISSN 0197-9337). centuries. Pertinent reviews comprised BENJAMIN and LIGHTHILL (1954), CUNGE (2003) and CHANSON (2009). Although most studies of positive surges and bores considered horizontal channels, a wide range of practical applications encompasses some hydraulic jumps propagating upstream on downward sloping channels: e.g., step pool channels during a flash flood, rejection surges in power canals serving hydro-power stations during sudden decrease in power output, swash runup against rundown on a beach slope. When a positive surge propagates upstream against a supercritical flow on a steep slope, the surge will progressively decelerate and become a stationary hydraulic jump. A key feature of jumps, bores and surges is the intense turbulent mixing generated by the jump roller (HENDERSON 1966, PARKER 1996). In a natural system, the formation and propagation of hydraulic jumps have some major impact on the channel bed and associated sediment transport (MACDONALD et al. 2009). For example, in a mobile bed flume, BELLAL et al. (2003) observed the bed deformation associated with the upstream propagation of a positive surge until its stabilisation and ultimately its disappearance in response to a change in bed topography. The formation of a hydraulic jump propagating upstream against a steep slope, its deceleration and vanishing were also associated with some cyclic behaviour (PARKER 1996, GRANT 1997, PARKER and IZUMI 2000, YOKOKAWA et al. 2009). Some pertinent studies included CARLING (1995) and MACDONALD et al. (2009) with the stationary hydraulic jumps, and CHEN et al. (1990), WOLANSKI et al. (2004) and KOCH and CHANSON (2008) in tidal bores. Other relevant studies encompassed the studies of bores generated by wave runup in the swash zone of the shoreline (e.g. KOBAYASHI 2001, BARNES et al. 2009). Recent laboratory findings hinted some differences in terms of the turbulent properties between a stationary hydraulic jump and a hydraulic jump in translation (LIU et al. 2004, KOCH and CHANSON 2009), while the properties during the deceleration phase(s) remain poorly understood. This study aims to comprehend the flow structure, turbulent mixing and sediment transport associated with the hydraulic jumps with a focus on the millimetric scale. Some turbulence measurements were performed in hydraulic jumps in translation and in decelerating hydraulic jumps over a fixed bed. The results were compared with some stationary hydraulic jump measurements. The findings yield a better understanding of the turbulence in decelerating surges and their slow transformation process into stationary hydraulic jumps. 2 CHANSON, H. (2011). "Turbulent Shear Stresses in Hydraulic Jumps and Decelerating Surges: An Experimental Study." Earth Surface Processes and Landforms, Vol. 36, No. 2, pp. 180-189 & 2 videos (DOI: 10.1002/esp.2031 ) (ISSN 0197-9337). EXPERIMENTAL CONFIGURATION AND INSTRUMENTATION The new experiments were performed in a 12 m long, 0.5 m wide tilting flume (Fig. 1 & 2). The flume had a smooth PVC bottom and glass walls. Two series of experiments were conducted: Series 1 was performed with a horizontal bed while Series 2 was conducted with a bed slope So ranging between 0.009 and 0.027 (Table 1). In steady flows, the water depths were measured using rail mounted pointer gauges. The unsteady water depths were measured with a series of non-intrusive acoustic displacement meters Microsonic™. The pressure and velocity measurements in steady flows were performed with a Prandtl-Pitot tube (3.3 mm ). The instantaneous velocity measurements were conducted with an acoustic Doppler velocimeter (ADV) Nortek™ Vectrino+ (Serial No. VNO 0436) equipped with a three-dimensional side-looking head. The ADV unit is sketched in Figure 1A and seen in Figure 2B behind an acoustic displacement meter. Figure 2C is a sketch of the side-looking head configuration. For each experiment, the ADV velocity range was 1.0 m/s, the sampling rate was 200 Hz, the sampling volume size was 1 mm, and the data accuracy was 1%. The ADV was located at x = 5 m where x is the longitudinal distance from the glass-walled channel upstream end, and its translation in the vertical direction was controlled by a fine adjustment travelling mechanism connected to a MitutoyoTM digimatic scale unit with an accuracy of 0.1 mm. Both the acoustic displacement meters and acoustic Doppler velocimeter were sampled simultaneously at 200 Hz and synchronised within 1 ms. Further details of the experimental configurations were reported in CHANSON (2008). Reynolds stress estimates in rapidly-varied flow motion The turbulence measurements were conducted with one discharge (Q = 0.058 m3/s) and two bed slopes (So = 0 & 0.0145). At the ADV unit location (x = 5 m), the initial steady flow was partially-developed with /do = 0.3 where is the boundary layer thickness and do is the initial flow depth. The instantaneous turbulent velocity data were decomposed as: v = V - V , where V is the instantaneous velocity measurement and V is a variable-interval time average (VITA) velocity (PIQUET 1999). A cutoff frequency was selected such that the VITA averaging period was greater than the characteristic period of 3 CHANSON, H. (2011). "Turbulent Shear Stresses in Hydraulic Jumps and Decelerating Surges: An Experimental Study." Earth Surface Processes and Landforms, Vol. 36, No. 2, pp. 180-189 & 2 videos (DOI: 10.1002/esp.2031 ) (ISSN 0197-9337). fluctuations, and small with respect to the characteristic period for the time-evolution of the mean properties. During the undular surge flows, the surge front was followed by a train of secondary waves and the Eulerian flow properties showed an oscillating pattern with a period of about 2 s that corresponded to the period of the free-surface undulations. Hence the unsteady data were filtered with a low/high-pass filter threshold greater than 0.5 Hz (i.e. 1/2 s-1) and smaller than the Nyquist frequency (herein 100 Hz). Following KOCH and CHANSON (2008, 2009), the cutoff frequency was deduced from a sensitivity analysis: Fcutoff = 1 Hz. The same filtering technique was applied to all velocity components for all experiments. The instantaneous Reynolds stresses were calculated from the high-pass filtered signals. Experimental flow conditions and surge generation The present observations were focused on a detailed characterisation of the hydraulic jumps in translation and decelerating surges, including some turbulent stress measurements conducted with high temporal and spatial resolutions. The experimental setup was selected to have an initially steady open channel flow with a discharge Q ranging from 0.035 to 0.060 m3/s (Table 1). The positive surge was generated by the rapid closure of the downstream tainter gate; its closure time was less than 0.2 s. The tainter gate was a plane gate sketched in Figure 1A. It could be shut completely as sketched in Figure 1A or partially. After closure, the hydraulic jump propagated upstream and each experiment was stopped when the bore front reached the intake structure to avoid wave reflection interference. On the horizontal slope (series 1), the positive surge developed rapidly immediately after the gate closure, and it reached a nearly constant celerity between x = 7 m and x = 3 m along which the measurements were conducted, with x the longitudinal distance from the channel intake positive downstream. That is, the surge was a true hydraulic jump in translation. For each experiment against an adverse slope (series 2), the initially steady flow was supercritical and the gradually-varied flow had a S2 profile (BRESSE 1860, HENDERSON 1966). After the gate closure, the travelling jump propagated upstream against the supercritical flow (Fig. 1B) and it decelerated with increasing distance from the gate. For some experiments, the jump travelled the full channel length and the experiment was stopped when the bore reached the channel intake. In other tests, the surge front decelerated and stopped prior to the channel upstream end, and the data acquisition ended 14 minutes after gate closure. 4 CHANSON, H. (2011). "Turbulent Shear Stresses in Hydraulic Jumps and Decelerating Surges: An Experimental Study." Earth Surface Processes and Landforms, Vol. 36, No. 2, pp. 180-189 & 2 videos (DOI: 10.1002/esp.2031 ) (ISSN 0197-9337). The turbulent velocity measurements were performed for z/do < 0.75 to ensure that all ADV receivers were beneath the free-surface for the entire duration of the study: i.e., prior to and after the passage of the jump. It is important to note further that the experiments were performed with flow velocities less than 1 m/s and the visual observations indicated some limited aeration of the jump roller (e.g. Fig. 2B). The present study was simply limited to monophase flow measurements and, although negligible at the laboratory scale, the interactions between entrained air and turbulence were ignored. This was discussed and developed elsewhere (VALLE and PASTERNACK 2006, CHANSON 2007, MURZYN and CHANSON 2008). HYDRAULIC JUMP PROPAGATION AND FLOW PATTERNS On the horizontal slope, the positive surge became rapidly a hydraulic jump in translation propagating upstream with a nearly constant celerity U. The visual observations indicated several types of hydraulic jumps in translation: an undular (non-breaking) bore for Froude numbers Fr less than 1.3, an undular surge with some slight breaking for Froude numbers between 1.3 and 1.45, and a breaking jump with a marked roller for Froude numbers greater than 1.45 (Fig. 2B). Figure 2B illustrates the propagation of the breaking surge beneath the acoustic displacement meter located at x = 5 m. In the digital appendix, the movie 080422ChansonP1040516.MOV illustrates an undular jump in translation propagating upstream with a celerity U = 0.55 m/s. Herein the surge Froude number is defined in the system of reference in translation with the jump: Fr (Vo U) / g d o where Vo and do are respectively the initial flow velocity and depth, U is the surge celerity and g is the gravity acceleration (Fig. 1B) (HENDERSON 1966). On a steep slope, the positive surge was generated by the rapid closure of the gate at the downstream end of the channel, and the breaking surge propagated against the supercritical flow. Its shape evolved progressively with time and the surge front speed decreased with increasing time. The movie 080424ChansonP1040541.MOV in the digital appendix shows a decelerating surge advancing against the supercritical flow with an average celerity U = 0.034 m/s. Figure 3 presents another example with several photographs of the surge at four different longitudinal locations. The figure caption includes the time t after gate closure, the location of the jump xs and the surge front celerity U. The decelerating surge appearance changed progressively as it advanced upstream as shown in Figure 3. 5 CHANSON, H. (2011). "Turbulent Shear Stresses in Hydraulic Jumps and Decelerating Surges: An Experimental Study." Earth Surface Processes and Landforms, Vol. 36, No. 2, pp. 180-189 & 2 videos (DOI: 10.1002/esp.2031 ) (ISSN 0197-9337). In some experiments, the decelerating surge remained a breaking bore. In others, the surge front transformed progressively into an undular bore. During some experiments, the surge front travelled up to the upstream intake structure. For others, the positive surge became arrested before the channel upstream end and the bore transformed into a stationary hydraulic jump. In some experiments, the shape of the surge changed from a breaking bore into an undular surge, before becoming a stationary undular hydraulic jump. During others, the bore remained a breaking surge until it became a stationary hydraulic jump with a roller. The observations of the hydraulic jump propagation showed consistently an initial rapid deceleration of the front until the surge leading edge progressed at a very slow pace (U = 1 to 10 mm/s). Ultimately the surge became arrested after a long time. Figure 4 presents some typical dimensionless graphs with the dimensionless time t g / d c as a function of the dimensionless distance from the downstream gate (xgate- xs)/dc and of the dimensionless surge front celerity U / g d c as a function of (xgate-xs)/dc. Herein dc is the critical flow depth of the initially steady flow: d c 3 Q 2 /(g B 2 ) where Q is the steady flow rate, g is the gravity acceleration and B is the channel width (B = 0.5 m). Figure 4 shows in particular a comparison between an experiment with an arrested surge (Run 071105_02) and a non-arrested surge (Run 071105_03). A non-arrested surge propagated all along the channel and entered into the intake structure. The experimental observations highlighted that the transformation from a positive surge into a stationary hydraulic jump was a very slow process, taking anywhere between 5 to 12 minutes (e.g., Fig. 4, Run 071105_2). These observations were consistent with the anecdotal observations of CHANSON (1995) in a 0.25 m wide 20 m long channel. The qualitative and quantitative experiments emphasised the complicated transformation of a positive surge into an arrested surge (i.e. stationary hydraulic jump). Within the present experimental flow configurations (Table 1), the transformation time scale was about 300-600 s (5 to 10 min.) in the laboratory flume. At full scale, the duration of the process would be longer and should be scaled up based upon a Froude similitude. The decelerating surge might evolve from a breaking bore to an undular (non-breaking) surge. The change would be very gradual and the evolution time scale was a minute to several minutes in the laboratory. 6 CHANSON, H. (2011). "Turbulent Shear Stresses in Hydraulic Jumps and Decelerating Surges: An Experimental Study." Earth Surface Processes and Landforms, Vol. 36, No. 2, pp. 180-189 & 2 videos (DOI: 10.1002/esp.2031 ) (ISSN 0197-9337). TURBULENT VELOCITY MEASUREMENTS On the horizontal slope, the turbulent velocity measurements highlighted a rapid flow deceleration during the jump passage associated with large turbulent fluctuations afterwards. The longitudinal velocity component decreased rapidly when the bore front passed above the sampling volume. This is illustrated in Figure 5 showing the time-variations of the water depth and of the longitudinal, transverse and vertical velocity components some hydraulic jumps in translation (Fr = 1.2 & 1.5). During all experiments, the horizontal velocity Vx data showed a rapid deceleration with the passage of the bore: e.g., 158 < tU/do < 162 in Figure 5A and 1200 < tU/do < 1206 in Figure 5B. The measurements highlighted some differences in velocity redistributions between the undular and breaking surges. When the undular bore passed above the ADV control volume, a relatively gentle longitudinal flow deceleration was noted at all vertical elevations. The horizontal velocity component Vx was minimum beneath the first wave crest and oscillated afterwards with the same period as the surface undulations and out of phase. The pattern is clearly seen in Figure 5A. The vertical velocity component Vz presented a similar oscillating pattern beneath the free-surface undulations with the same periodicity, but out of phase. The present observations were in agreement with the earlier findings of KOCH and CHANSON (2008). The breaking surge exhibited in contrast a marked roller and a sharp flow depth discontinuity. The freesurface elevation curved upwards immediately prior to the roller as shown by HORNUNG et al. (1995) and KOCH and CHANSON (2009). This is illustrated in Figure 5B for 1199 < tU/do < 1201. The velocity data showed some distinct redistribution patterns depending upon the vertical elevation z/do. For z/do > 0.5, Vx decreased rapidly at the surge front although the longitudinal velocity data tended to remain positive beneath the roller. For z/do < 0.2, the longitudinal velocity became negative although for a short duration. Such flow feature was first reported by KOCH and CHANSON (2009). Positive surge propagating against an adverse steep slope The velocity measurements in a decelerating surge advancing against an adverse sloping surge were conducted for z/do < 0.7 only because the ADV head could not be placed at higher sampling locations without interfering with the free-surface. Some typical measurements are presented in Figure 6 showing the 7 CHANSON, H. (2011). "Turbulent Shear Stresses in Hydraulic Jumps and Decelerating Surges: An Experimental Study." Earth Surface Processes and Landforms, Vol. 36, No. 2, pp. 180-189 & 2 videos (DOI: 10.1002/esp.2031 ) (ISSN 0197-9337). dimensionless water depth, and velocity components recorded at x = 5 m and z/do = 0.65. In Figure 6, the data spanned between t = 75 s and 115 s after the gate closure. At tU/do = 70 (i.e. t = 115 s), the surge front was located at xs = 4.3 m. For the experiment shown in Figure 6, the arrested surge became a stationary hydraulic jump at xs = 2.65 m about 330 s (6.5 minutes) after the gate closure. The experimental observations demonstrated that the decelerating bore propagation was a very slow but highly turbulent process. In Figure 6 (at x = 5 m), the surge front celerity was 27 times slower than that of the experiment shown in Figure 5B. As a result, the longitudinal velocity data exhibited a gentle deceleration when the bore passed the sampling location (Fig. 6, tU/do = 53 to 55). Interestingly the longitudinal velocity component remained positive at all times and at all vertical elevations. This differed from what occurred under a propagating breaking surge where negative values of the longitudinal velocity were associated with some transient flow separation (KOCH and CHANSON 2009). The mechanisms triggering the change are presently unknown. In the upper flow region (z/do > 0.3), the longitudinal velocity Vx data showed some long-period oscillations with a period of about 2 s. These are seen in Figure 6 for 54 < tU/do < 60. The oscillations were caused by the growth, advection, and pairing of large-scale vortices in the developing shear layer of the surge roller. This process was also observed in stationary hydraulic jumps. The pulsation frequency F of the longitudinal velocity gave a Strouhal number Fdo/Vo = 0.021 herein that was close to some classical hydraulic jump data (LONG et al. 1991, CHANSON and GUALTIERI 2008, MURZYN and CHANSON 2009). TURBULENT STRESSES IN HYDRAULIC JUMPS During the surge passage, the unsteady flow field was associated with large fluctuations in Reynolds stresses (Fig. 7). Figures 7A and 7B present some typical unsteady Reynolds stress data beneath a bore propagating in a horizontal and sloping channel respectively (Series 1 and 2). In each figure, the graph presents the timevariation of the dimensionless Reynolds stresses vx2/Vo2 and vxvz/Vo2, and water depth d/do, where v is the turbulent velocity, the subscripts x and z refer respectively to the longitudinal and vertical velocity components. Table 2 summarises further the range of dimensionless Reynolds stress fluctuations. The turbulent stress measurements indicated systematically the large magnitudes and large fluctuations of the 8 CHANSON, H. (2011). "Turbulent Shear Stresses in Hydraulic Jumps and Decelerating Surges: An Experimental Study." Earth Surface Processes and Landforms, Vol. 36, No. 2, pp. 180-189 & 2 videos (DOI: 10.1002/esp.2031 ) (ISSN 0197-9337). Reynolds stresses below the jump front and in the flow behind the hydraulic jump in translation. The findings were observed for both undular and breaking surges. The Reynolds stress levels were significantly larger than before the surge passage, and some substantial normal and tangential stress fluctuations were observed. In the breaking surge some large shear stress levels and fluctuations were observed in particular for z/do > 0.5. This is illustrated in Figure 7A. It is believed that these were caused by the proximity of the jump roller and its developing mixing layer. A comparison between undular and breaking surges showed further that (a) the amplitude of the turbulent stresses was comparable for both undular (non-breaking) and breaking bores as shown in Table 2, and (b) the large fluctuations in Reynolds stresses lasted for a significantly longer period beneath the undular bore. The latter finding was partly caused by the long-lasting undular wave motion that induced an oscillatory vertical motion. Turbulent stresses beneath a decelerating surge In a decelerating surge, the flow field changed very slowly from a positive surge into a stationary hydraulic jump. The turbulent stress data highlighted some large stress levels and fluctuations when the ADV sampling volume was in the "wake" of the roller mixing layer. Figure 7B presents some typical data. With increasing time, the levels of shear stresses and shear stress fluctuations tended to decrease slightly. A comparative analysis between a decelerating surge and a stationary jump highlighted some marked differences (Fig. 8). Figure 8 presents the vertical distributions of time-averaged turbulent stresses vx2/Vo2 calculated for the first 2,000 samples beneath the breaking roller (i.e. a 10 s record). The results are compared with the stationary hydraulic jump data of LIU (2004). Both experiments were performed with similar flow conditions: a weak hydraulic jump with roller with similar Froude number and inflow depth, while the metrology technique was the same (acoustic Doppler velocimetry). In Figure 8, the comparative results highlighted the higher turbulence levels in the decelerating surge, especially in the lower flow region (z/do < 0.4 to 0.5) (Fig. 8). DISCUSSION The present experimental data demonstrated some intense turbulent mixing beneath the hydraulic jump front 9 CHANSON, H. (2011). "Turbulent Shear Stresses in Hydraulic Jumps and Decelerating Surges: An Experimental Study." Earth Surface Processes and Landforms, Vol. 36, No. 2, pp. 180-189 & 2 videos (DOI: 10.1002/esp.2031 ) (ISSN 0197-9337). and the roller for all experiments with hydraulic jumps in translation (series 1) and decelerating surges (series 2). Large magnitude and rapid fluctuations of the turbulent stresses were recorded beneath the jumps. For non-cohesive sediment materials, the Shields diagram gives a critical shear stress for sediment bed load motion about: c = 0.13 to 5.6 N for quartz particles with sizes between 0.1 and 10 mm (GRAF 1971, JULIEN 1995). Herein, the instantaneous turbulent shear stress magnitudes ranged between 0 and 8 to 75 N. depending upon the experiments. Quantitatively the levels of turbulent stresses were one to two orders of magnitude larger than the critical threshold for sediment motion and transport at the laboratory scale. Note however that the comparison is limited by two issues. First the present experiments were performed with a smooth bed whereas a natural mobile bed has a natural rougher surface. Second, in hydraulic jumps, the entrainment of sediments takes place by very-large scale vortices and the sediment motion occurs by convection since the turbulent mixing length is large compared to the sediment distribution length scale. The validity of the Shields diagram, hence of the critical shear stress estimate, is arguable. The experiments showed further the complicated transformation of a hydraulic jump in translation into a stationary hydraulic jump on a steep slope. The entire process was very slow as illustrated in the movie 080424ChansonP1040541.MOV (digital appendix) where the propagation speed of the jump was 0.034 m/s in average. The turbulent velocity field in the decelerating surge presented turbulent characteristics that were closer to those of a stationary hydraulic jump than of a fully-developed surge, despite a few key differences seen in Figure 8 next to the bed. The experimental data showed larger normal stresses next to the bed in a decelerating jump (Fig. 8), implying that decelerating surges have a greater potential for bed scour and erosion than stationary jumps in natural systems. On a movable bed, the present findings would imply that a hydraulic jump propagating upstream could scour the bed since the levels of bed shear stress are greater than the onset of sediment motion. As it decelerates, the surge would continue to scour the bed materials until a stage when the conservation of momentum is no longer satisfied across the jump. The free-surface would flatten and the jump could vanish downstream. The entire process might become cyclic in presence of sediment wash load with mobile bed. The whole sequence is consistent wit the field observations of GRANT (1997), the laboratory study of BELLAL et al. (2003), and some analytical solution summarised by GOUTIERE et al. (2009). 10 CHANSON, H. (2011). "Turbulent Shear Stresses in Hydraulic Jumps and Decelerating Surges: An Experimental Study." Earth Surface Processes and Landforms, Vol. 36, No. 2, pp. 180-189 & 2 videos (DOI: 10.1002/esp.2031 ) (ISSN 0197-9337). CONCLUSION Some detailed turbulent measurements were conducted in hydraulic jumps in translation and decelerating surges and bores to gain some new understanding of the flow structure, turbulent mixing and sediment transport. The results highlighted some large turbulent stress magnitudes and turbulent stress fluctuations beneath the jumps and surges. In a breaking jump, the largest turbulent stresses were observed next to the roller in a region of high velocity gradients. In an undular bore, some large velocity fluctuations and Reynolds stresses were recorded beneath the first wave crest and the secondary waves (i.e. free-surface undulations). The present experimental data demonstrated some intense turbulent mixing beneath the hydraulic jumps for all experiments. Quantitatively, the levels of turbulent stresses were one to two orders of magnitude larger than the critical threshold for sediment motion at the laboratory scale. The experiments highlighted the complicated transformation of a hydraulic jump in translation into a stationary hydraulic jump on an adverse steep slope. The entire process was very slow and the turbulent velocity field in the decelerating surge presented turbulent characteristics that were closer to those of a stationary hydraulic jump than of a fully-developed surge, despite a few key differences. The turbulence flow measurements highlighted further the complex evolution of a hydraulic jump in translation into a stationary hydraulic jump. On a movable bed, the entire process would yield a cyclic pattern similar to that observed in laboratories and in the field. Further detailed turbulence measurements should be conducted with movable boundaries. ACKNOWLEDGEMENTS The author acknowledges the technical assistance of Graham ILLIDGE (The University of Queensland). He thanks Dr Pierre LUBIN (University of Bordeaux, France) for his helpful comments DIGITAL APPENDIX A series of short movies were taken during some key experiments (Table 3). The Digital Files are a series of QuicktimeTM movies recorded with a digital camera PanasonicTM Limux FZ20. 11 CHANSON, H. (2011). "Turbulent Shear Stresses in Hydraulic Jumps and Decelerating Surges: An Experimental Study." Earth Surface Processes and Landforms, Vol. 36, No. 2, pp. 180-189 & 2 videos (DOI: 10.1002/esp.2031 ) (ISSN 0197-9337). REFERENCES BARNES, M.P., O'DONOGHUE, T., ALSINA, J.M., and BALDOCK, T.E. (2009). "Direct Bed Shear Stress Measurements in Bore-Driven Swash." Coastal Eng., Vol. 56, No. 8, pp. 853-867. BELLAL, M., SPINEWINE, B., SAVARY, C., and ZECH, Y. (2003). "Morphological Evolution of SteepSloped River Beds in the Presence of a Hydraulic Jump: Experimental Study." Proc. 30th IAHR Biennial Congress, Thessaloniki, Greece, Theme C, Vol. II, pp. 133-140. BENJAMIN, T.B., and LIGHTHILL, M.J. (1954). "On Cnoidal Waves and Bores." Proc. Royal Soc. of London, Series A, Math. & Phys. Sc., Vol. 224, No. 1159, pp. 448-460. BRESSE, J.A. (1860). "Cours de Mécanique Appliquée Professé à l'Ecole des Ponts et Chaussées." ('Course in Applied Mechanics lectured at the Pont-et-Chaussées Engineering School.') Mallet-Bachelier, Paris, France (in French). CARLING, P.A. (1995). "Flow-Separation Berms Downstream of a Hydraulic Jump in a Bedrock Channel." Geomorphology, Vol. 11, pp. 245-253. CHANSON, H. (1995). "Flow Characteristics of Undular Hydraulic Jumps. Comparison with Near-Critical Flows." Report CH45/95, Dept. of Civil Engineering, University of Queensland, Australia, June, 202 pages. CHANSON, H. (2007). "Bubbly Flow Structure in Hydraulic Jump." European Journal of Mechanics B/Fluids, Vol. 26, No. 3, pp.367-384 (DOI:10.1016/j.euromechflu.2006.08.001). CHANSON, H. (2008). "Turbulence in Positive Surges and Tidal Bores. Effects of Bed Roughness and Adverse Bed Slopes." Hydraulic Model Report No. CH68/08, Div. of Civil Engineering, The University of Queensland, Brisbane, Australia, 121 pages & 5 movie files. CHANSON, H. (2009). "Current Knowledge In Hydraulic Jumps And Related Phenomena. A Survey of Experimental Results." European Journal of Mechanics B/Fluids, Vol. 28, No. 2, pp. 191-210 (DOI: 10.1016/j.euromechflu.2008.06.004). CHANSON, H., and GUALTIERI, C. (2008). "Similitude and Scale Effects of Air Entrainment in Hydraulic Jumps." Jl of Hyd. Res., IAHR, Vol. 46, No. 1, pp. 35-44. 12 CHANSON, H. (2011). "Turbulent Shear Stresses in Hydraulic Jumps and Decelerating Surges: An Experimental Study." Earth Surface Processes and Landforms, Vol. 36, No. 2, pp. 180-189 & 2 videos (DOI: 10.1002/esp.2031 ) (ISSN 0197-9337). CHEN, Jiyu, LIU, Cangzi, ZHANG, Chongle, and WALKER, H.J. (1990). "Geomorphological Development and Sedimentation in Qiantang Estuary and Hangzhou Bay." Jl of Coastal Research, Vol. 6, No. 3, pp. 559-572. CUNGE, J.A. (2003). "Undular Bores and Secondary Waves - Experiments and Hybrid Finite-Volume Modelling." Jl of Hyd. Res., IAHR, Vol. 41, No. 5, pp. 557-558. GOUTIERE, L., BELLAL, M., SOARES-FRAZAO, S., and ZECH, Y. (2009). "Experimental, Analytical and Numerical Simulation of the Propagation of a Hydraulic Jump over Mobile Bed." Proc. 33rd IAHR Biennial Congress, Vancouver, Canada, pp. 5075-5082. GRANT, G.E. (1997). "Critical Flow Constrains Flow Hydraulics in Mobile-Bed Streams: a New Hypothesis." Water Res. Res., Vol. 33, No. 2, pp. 349-358. Discussion : Vol. 35, No. 3, pp. 903-908. HENDERSON, F.M. (1966). "Open Channel Flow." MacMillan Company, New York, USA. HORNUNG, H.G., WILLERT, C., and TURNER, S. (1995). "The Flow Field Downsteam of a Hydraulic Jump." Jl of Fluid Mech., Vol. 287, pp. 299-316. GRAF, W.H. (1971). "Hydraulics of Sediment Transport". McGraw-Hill, New York, USA. JULIEN, P.Y. (1995). "Erosion and Sedimentation." Cambridge University Press, Cambridge, UK, 280 pages. KOBAYASHI, N. (2001). "Sand Suspension, Storage, Advection, and Settling in Surf and Swash Zones." Jl of Geophys. Res.-Oceans, AGU, Vol. 106, No. C5, pp. 9363-9376. KOCH, C., and CHANSON, H. (2008). "Turbulent Mixing beneath an Undular Bore Front." Journal of Coastal Research, Vol. 24, No. 4, pp. 999-1007 (DOI: 10.2112/06-0688.1). KOCH, C., and CHANSON, H. (2009). "Turbulence Measurements in Positive Surges and Bores." Journal of Hydraulic Research, IAHR, Vol. 47, No. 1, pp. 29-40 (DOI: 10.3826/jhr.2009.2954). LIU, M. (2004). "Turbulence Structure in Hydraulic Jumps and Vertical Slot Fishways." Ph.D. thesis., Dept. of Civil and Env. Eng., University of Alberta, Edmonton, Canada, 313 pages. LIU, M., RAJARATNAM, N., and ZHU, D.Z. (2004). "Turbulent Structure of Hydraulic Jumps of Low Froude Numbers." Jl of Hyd. Engrg., ASCE, Vol. 130, No. 6, pp. 511-520. LONG, D., RAJARATNAM, N., STEFFLER, P.M., and SMY, P.R. (1991). "Structure of Flow in Hydraulic 13 CHANSON, H. (2011). "Turbulent Shear Stresses in Hydraulic Jumps and Decelerating Surges: An Experimental Study." Earth Surface Processes and Landforms, Vol. 36, No. 2, pp. 180-189 & 2 videos (DOI: 10.1002/esp.2031 ) (ISSN 0197-9337). Jumps." Jl of Hyd. Research, IAHR, Vol. 29, No. 2, pp. 207-218. MACDONALD, R.G., ALEXANDER, J., BACON, J.C., and COOKER, M.J. (2009). "Flow Patterns, Sedimentation and Deposit Architecture under a Hydraulic Jump on a Non-Eroding Bed: Defining Hydraulic Jump Unit Bars." Sedimentology, Vol. 56, pp. 1346-1367 (DOI: 10.1111/j.13653091.2008.01037.x). MURZYN, F., and CHANSON, H. (2008). "Experimental Assessment of Scale Effects Affecting Two-Phase Flow Properties in Hydraulic Jumps." Experiments in Fluids, Vol. 45, No. 3, pp. 513-521 (DOI: 10.1007/s00348-008-0494-4). MURZYN, F., and CHANSON, H. (2009). "Free-Surface Fluctuations in Hydraulic Jumps: Experimental Observations." Experimental Thermal and Fluid Science, Vol. 33, No. 7, pp. 1055-1064 (DOI: 10.1016/j.expthermflusci.2009.06.003). PARKER, G. (1996). "Some speculations on the relation between Channel Morphology and Channel Scale Flow Structures." in "Coherent Flow structures in Open Channels", John Wiley, Chichester, UK, P.J. ASHWORTH, S.J. BENNETT, J.L. BEST and S.J. McLELLAND Ed., pp. 423-458. PARKER, G., and IZUMI, N. (2000). "Purely Erosional Cyclic and Solitary Stepd Created by Flow over a Cohesive Bed." Jl of Fluid Mech., Vol. 419, pp. 203-238. PIQUET, J. (1999). "Turbulent Flows. Models and Physics." Springer, Berlin, Germany, 761 pages. VALLE, B.L., and PASTERNACK, G.B. (2006). "Air Concentrations of Submerged and Unsubmerged Hydraulic Jumps in a Bedrock Step-Pool Channel." Jl of Geophysical Res., Vol. 111, No. F3, paper F030l6, 12 pages (DOI: 10.1029/2004JF000140). WOLANSKI, E., WILLIAMS, D., SPAGNOL, S., and CHANSON, H. (2004). "Undular Tidal Bore Dynamics in the Daly Estuary, Northern Australia." Estuarine, Coastal and Shelf Science, Vol. 60, No. 4, pp. 629-636. YOKOKAWA, M., OKUNO, K., NAKAMURA, A., MUTO, T., MIATA, Y., NARUSE, H., and PARKER, G. (2009). "Aggradational Cyclic Steps: Sedimentary Structures Found in Flume Experiments." Proc. 33rd IAHR Biennial Congress, Vancouver, Canada, pp. 5547-5554. 14 CHANSON, H. (2011). "Turbulent Shear Stresses in Hydraulic Jumps and Decelerating Surges: An Experimental Study." Earth Surface Processes and Landforms, Vol. 36, No. 2, pp. 180-189 & 2 videos (DOI: 10.1002/esp.2031 ) (ISSN 0197-9337). Table 1- Experimental flow conditions Reference (1) Series 1 Series 2 So Q (m3/s) (3) 0.058 do (m) (4) 0.137 Surge type U Fr Remarks at x = 5 m (m/s) (2) (5) (6) (7) (8) 0 Undular to 0.56 to 1.17 to Smooth PVC bed. breaking 0.90 1.49 L = 12 m, B = 0.5 m. 0.009 to 0.035 to 0.040 to Decelerating: 0.002 to 1.71 to Smooth PVC bed. 0.027 0.06 0.072 undular to 0.22 2.83 L = 12 m, B = 0.5 m. breaking Notes: do: initial depth measured at x = 5 m; Fr: surge Froude number ( Fr ( Vo U ) / g d o ); Q: initial steady flow rate; So: bed slope; U: surge front celerity measured at x = 5 m. Table 2 - Experimental observations: range of dimensionless Reynolds stress fluctuations z/do vx2/Vo2 (4) (5) 0.15 0-0.04 0.76 0-0.025 0 1.50 Breaking 0.15 0-0.04 0.76 0-0.07 0.0145 2.02 Breaking 0.15 0-0.08 (decelerating 0.65 0-0.07 ) Slope (1) 0 Fr (2) 1,17 Surge type (3) Undular vy2/Vo2 (6) 0-0.015 0-0.01 0-0.015 0-0.015 0-0.03 0-0.03 15 vz2/Vo2 (7) 0-0.05 0-0.06 0-0.06 0-0.1 0-0.15 0-0.2 vxvz/Vo2 (6) 0.02 0.02 0.02 0.03 0.04 0.04 vxvy/Vo2 (7) 0.01 0.008 0.015 0.012 0.03 0.025 vyvz/Vo2 (8) 0.015 0.01 0.015 0.015 0.035 0.025 CHANSON, H. (2011). "Turbulent Shear Stresses in Hydraulic Jumps and Decelerating Surges: An Experimental Study." Earth Surface Processes and Landforms, Vol. 36, No. 2, pp. 180-189 & 2 videos (DOI: 10.1002/esp.2031 ) (ISSN 0197-9337). Table 3 - List of movies Filename 080422ChansonP1040516.MOV Format Quicktime 080424ChansonP1040541.MOV Quicktime Description Positive surge (Fr = 1.2) on a horizontal slope Undular surge passing the ADV unit and progressing upstream. Duration: 6 s. Experiment Series 1A, Run 080422, Q= 57.8 L/s, do = 138.5 mm, U = 0.553 m/s, So = 0, Gate opening after closure: 100 mm. Decelerating surge (Fr = 2.02) against an adverse slope Propagation of the decelerating breaking surge past the ADV unit (x = 5 m). Duration: 33 s. Experiment Series 2A, Run 080424, Q= 57.5 L/s, do = 70.1 mm, U = 0.034 m/s, So = 0.0145, Gate opening after closure: 90 mm. Notes: do: initial flow depth; Fr: surge Froude number; Q: initial discharge; So: bed slope (So = sin); U: surge front celerity; all properties were recorded at x = 5 m. 16 CHANSON, H. (2011). "Turbulent Shear Stresses in Hydraulic Jumps and Decelerating Surges: An Experimental Study." Earth Surface Processes and Landforms, Vol. 36, No. 2, pp. 180-189 & 2 videos (DOI: 10.1002/esp.2031 ) (ISSN 0197-9337). LIST OF CAPTIONS Fig. 1 - Definition sketches of the upstream propagation of a hydraulic jump (not drawn to scale) (A) Experimental configuration and positive surge propagating upstream on a horizontal slope - Note the tainter gate sketched at the channel downstream end (B) Decelerating surge propagating against an adverse slope Fig. 2 - Photographs of the experimental facility (A) Experimental channel looking downstream (B) Propagation of a breaking surge from left to right: Q= 0.057.8 m3/s, do = 0.139 m, So = 0, Fr = 1.5, U = 0.90 m/s - Note the pointer gauge (right), the acoustic displacement meter unit (connected to cable) and the ADV unit behind - The surge roller just passed beneath the acoustic displacement and advanced towards the pointer gauge (C) Sketch of the ADV side-looking head configuration Fig. 3 - Photographs of a decelerating surge front propagating upstream against a steep slope: So = 0.00943, Q = 0.0354 m3/s, do = 0.0538 m (Series 2) - Initial flow from right to left, surge propagation from right to left (A) t = 12.3 s, xs = 8 m (U = 0.18 m/s, breaking) (B) t = 31.5 s, xs = 5 m (U = 0.10 m/s, breaking) (C) t = 48.2 s, xs = 3 m (U = 0.075 m/s, breaking) (D) t = 67.5 s, xs = 1 m (U = 0.05 m/s, breaking) Fig. 4 - Dimensionless surge front position (xgate-xs)/dc and surge celerity U/ gdc for an arrested and nonarrested decelerating surges (Exp. Series 2) Experiments Series 2 Run 071105_02 071105_03 So 0.01417 Q (m3/s) 0.0423 h (m) 0.065 0.060 Type Arrested Non-arrested Fig. 5 - Dimensionless time variations of the instantaneous velocity components beneath a hydraulic jump in translation on a smooth horizontal invert (Series 1) (A) Dimensionless instantaneous velocity components and water depth with an undular jump: do = 0.1385 m, 17 CHANSON, H. (2011). "Turbulent Shear Stresses in Hydraulic Jumps and Decelerating Surges: An Experimental Study." Earth Surface Processes and Landforms, Vol. 36, No. 2, pp. 180-189 & 2 videos (DOI: 10.1002/esp.2031 ) (ISSN 0197-9337). Vo = 0.830 m/s, U = 0.553 m/s, Fr = 1.17, So = 0, z/do = 0.692 (Exp. Series 1) (B) Dimensionless instantaneous velocity components and water depth with a breaking jump: do = 0.1388 m, Vo = 0.832 m/s, U = 0.903 m/s, Fr = 1.50, So = 0, z/do = 0.762 (Exp. Series 1) Fig. 6 - Dimensionless time variations of the instantaneous velocity components beneath a positive surge propagating upstream against a steep slope: do = 0.0701 m, Vo = 1.641 m/s, U = 0.034 m/s, Fr = 2.02, So = 0.0145, z/do = 0.653 (Exp. Series 2) Fig. 7 - Dimensionless time variations of the instantaneous turbulent stresses vx2/Vo2 and vxvz/Vo2 beneath a breaking bore (A) On a smooth horizontal invert: do = 0.1388 m, Vo = 0.832 m/s, U = 0.903 m/s, Fr = 1.50, So = 0, z/do = 0.762 (Exp. Series 1) (B) Against a steep slope: do = 0.0701 m, Vo = 1.641 m/s, U = 0.034 m/s, Fr = 2.02, So = 0.0145, z/do = 0.653 (Exp. Series 2) Fig. 8 - Dimensionless vertical distributions of the time-averaged normal stresses in a decelerating jump: Fr = 2.02, do = 0.0701 m, x = 5 m, So = 0.0145 - Comparison with some stationary hydraulic jump data: Fr = 2.0, do = 0.071 m, x = 0, 0.13 m, 0.23 m and 0.33 m downstream of toe (LIU 2004) 18 CHANSON, H. (2011). "Turbulent Shear Stresses in Hydraulic Jumps and Decelerating Surges: An Experimental Study." Earth Surface Processes and Landforms, Vol. 36, No. 2, pp. 180-189 & 2 videos (DOI: 10.1002/esp.2031 ) (ISSN 0197-9337). Fig. 1 - Definition sketches of the upstream propagation of a hydraulic jump (not drawn to scale) (A) Experimental configuration and positive surge propagating upstream on a horizontal slope - Note the tainter gate sketched at the channel downstream end (B) Decelerating surge propagating against an adverse slope 19 CHANSON, H. (2011). "Turbulent Shear Stresses in Hydraulic Jumps and Decelerating Surges: An Experimental Study." Earth Surface Processes and Landforms, Vol. 36, No. 2, pp. 180-189 & 2 videos (DOI: 10.1002/esp.2031 ) (ISSN 0197-9337). Fig. 2 - Photographs of the experimental facility (A) Experimental channel looking downstream 20 CHANSON, H. (2011). "Turbulent Shear Stresses in Hydraulic Jumps and Decelerating Surges: An Experimental Study." Earth Surface Processes and Landforms, Vol. 36, No. 2, pp. 180-189 & 2 videos (DOI: 10.1002/esp.2031 ) (ISSN 0197-9337). (B) Propagation of a breaking surge from left to right: Q= 0.057.8 m3/s, do = 0.139 m, So = 0, Fr = 1.5, U = 0.90 m/s - Note the pointer gauge (right), the acoustic displacement meter unit (connected to cable) and the ADV unit behind - The surge roller just passed beneath the acoustic displacement and advanced towards the pointer gauge 21 CHANSON, H. (2011). "Turbulent Shear Stresses in Hydraulic Jumps and Decelerating Surges: An Experimental Study." Earth Surface Processes and Landforms, Vol. 36, No. 2, pp. 180-189 & 2 videos (DOI: 10.1002/esp.2031 ) (ISSN 0197-9337). (C) Sketch of the ADV side-looking head configuration 22 CHANSON, H. (2011). "Turbulent Shear Stresses in Hydraulic Jumps and Decelerating Surges: An Experimental Study." Earth Surface Processes and Landforms, Vol. 36, No. 2, pp. 180-189 & 2 videos (DOI: 10.1002/esp.2031 ) (ISSN 0197-9337). Fig. 3 - Photographs of a decelerating surge front propagating upstream against a steep slope: So = 0.00943, Q = 0.0354 m3/s, do = 0.0538 m (Series 2) - Initial flow from right to left, surge propagation from right to left (A) t = 12.3 s, xs = 8 m (U = 0.18 m/s, breaking) (B) t = 31.5 s, xs = 5 m (U = 0.10 m/s, breaking) (C) t = 48.2 s, xs = 3 m (U = 0.075 m/s, breaking) (D) t = 67.5 s, xs = 1 m (U = 0.05 m/s, breaking) 23 CHANSON, H. (2011). "Turbulent Shear Stresses in Hydraulic Jumps and Decelerating Surges: An Experimental Study." Earth Surface Processes and Landforms, Vol. 36, No. 2, pp. 180-189 & 2 videos (DOI: 10.1002/esp.2031 ) (ISSN 0197-9337). Fig. 4 - Dimensionless surge front position (xgate-xs)/dc and surge celerity U/ gdc for an arrested and nonarrested decelerating surges (Exp. Series 2) Experiments Series 2 Run 071105_02 071105_03 So 0.01417 Q (m3/s) 0.0423 h (m) 0.065 0.060 Type Arrested Non-arrested 70 0.21 x(t) Run 071105_2 U(x) Run 071105_2 x(t) Run 071105_3 U(x) Run 071105_3 0.18 50 0.15 40 0.12 30 0.09 20 0.06 Run 071105_2 : arrested surge Run 071105_3 : surge vanishing in intake 10 0.03 0 0 20 40 60 (xgate-xs)/dc 24 80 100 0 120 U/sqrt(gdc) tsqrt(g/dc) 60 CHANSON, H. (2011). "Turbulent Shear Stresses in Hydraulic Jumps and Decelerating Surges: An Experimental Study." Earth Surface Processes and Landforms, Vol. 36, No. 2, pp. 180-189 & 2 videos (DOI: 10.1002/esp.2031 ) (ISSN 0197-9337). Fig. 5 - Dimensionless time variations of the instantaneous velocity components beneath a hydraulic jump in translation on a smooth horizontal invert (Series 1) (A) Dimensionless instantaneous velocity components and water depth with an undular jump: do = 0.1385 m, 1.5 1.1 1.6 Vx 1.44 Vy Vz Depth 1.28 0.9 1.12 0.7 0.96 0.5 0.8 0.3 0.64 0.1 0.48 -0.1 0.32 -0.3 0.16 V/Vo 1.3 -0.5 155 157.5 160 162.5 165 167.5 170 172.5 t U/do 175 177.5 180 182.5 d/do Vo = 0.830 m/s, U = 0.553 m/s, Fr = 1.17, So = 0, z/do = 0.692 (Exp. Series 1) 0 185 (B) Dimensionless instantaneous velocity components and water depth with a breaking jump: do = 0.1388 m, Vo = 0.832 m/s, U = 0.903 m/s, Fr = 1.50, So = 0, z/do = 0.762 (Exp. Series 1) 1.5 Vz Depth 1.8 1.1 1.6 0.9 1.4 0.7 1.2 0.5 1 0.3 0.8 0.1 0.6 -0.1 0.4 -0.3 0.2 -0.5 0 1190 1192 1194 1196 1198 1200 1202 1204 1206 1208 1210 1212 1214 1216 1218 1220 t U/do 25 d/do V/Vo 1.3 2 Vx Vy CHANSON, H. (2011). "Turbulent Shear Stresses in Hydraulic Jumps and Decelerating Surges: An Experimental Study." Earth Surface Processes and Landforms, Vol. 36, No. 2, pp. 180-189 & 2 videos (DOI: 10.1002/esp.2031 ) (ISSN 0197-9337). Fig. 6 - Dimensionless time variations of the instantaneous velocity components beneath a positive surge propagating upstream against a steep slope: do = 0.0701 m, Vo = 1.641 m/s, U = 0.034 m/s, Fr = 2.02, So = 0.0145, z/do = 0.653 (Exp. Series 2) Vx Vy V/Vo 1.3 3 Vz Depth 2.7 1.1 2.4 0.9 2.1 0.7 1.8 0.5 1.5 0.3 1.2 0.1 0.9 -0.1 0.6 -0.3 0.3 -0.5 0 50 51 52 53 54 55 56 57 58 59 60 61 62 63 64 65 66 67 68 69 70 t U/do 26 d/do 1.5 CHANSON, H. (2011). "Turbulent Shear Stresses in Hydraulic Jumps and Decelerating Surges: An Experimental Study." Earth Surface Processes and Landforms, Vol. 36, No. 2, pp. 180-189 & 2 videos (DOI: 10.1002/esp.2031 ) (ISSN 0197-9337). Fig. 7 - Dimensionless time variations of the instantaneous turbulent stresses vx2/Vo2 and vxvz/Vo2 beneath a breaking bore (A) On a smooth horizontal invert: do = 0.1388 m, Vo = 0.832 m/s, U = 0.903 m/s, Fr = 1.50, So = 0, z/do = 0.762 (Exp. Series 1) 2 0.14 1.6 0.12 1.4 0.1 1.2 0.08 1 0.06 0.8 0.04 0.6 0.02 0.4 0 0.2 -0.02 0 -0.04 1190 1192 1194 1196 1198 1200 1202 1204 1206 1208 1210 1212 1214 1216 1218 1220 t U/do 27 v2/Vo2 d/do 1.8 0.16 Depth vx2 vxvz CHANSON, H. (2011). "Turbulent Shear Stresses in Hydraulic Jumps and Decelerating Surges: An Experimental Study." Earth Surface Processes and Landforms, Vol. 36, No. 2, pp. 180-189 & 2 videos (DOI: 10.1002/esp.2031 ) (ISSN 0197-9337). (B) Against a steep slope: do = 0.0701 m, Vo = 1.641 m/s, U = 0.034 m/s, Fr = 2.02, So = 0.0145, z/do = 0.653 (Exp. Series 2) 3 0.225 2.4 0.195 2.1 0.165 1.8 0.135 1.5 0.105 1.2 0.075 0.9 0.045 0.6 0.015 0.3 -0.015 0 47.5 50 52.5 55 57.5 60 t U/do 28 62.5 65 67.5 70 -0.045 72.5 v2/Vo2 d/do 2.7 0.255 Depth vx2 vxvz CHANSON, H. (2011). "Turbulent Shear Stresses in Hydraulic Jumps and Decelerating Surges: An Experimental Study." Earth Surface Processes and Landforms, Vol. 36, No. 2, pp. 180-189 & 2 videos (DOI: 10.1002/esp.2031 ) (ISSN 0197-9337). Fig. 8 - Dimensionless vertical distributions of the time-averaged normal stresses in a decelerating jump: Fr = 2.02, do = 0.0701 m, x = 5 m, So = 0.0145 - Comparison with some stationary hydraulic jump data: Fr = 2.0, do = 0.071 m, x = 0, 0.13 m, 0.23 m and 0.33 m downstream of toe (LIU 2004) 1 vx2/Vo2 Present data vy2/Vo2 Present data vz2/Vo2 Present data vx2/Vo2 x/do = 1.83 Liu (2004) vx2/Vo2 x/do = 3.24 Liu (2004) vx2/Vo2 x/do = 4.65 Liu (2004) 0.9 0.8 0.7 z/do 0.6 0.5 0.4 0.3 0.2 0.1 0 0 0.01 0.02 0.03 0.04 0.05 v2/Vo2 29 0.06 0.07 0.08 0.09 0.1


© Copyright 2026