
Dutton, E., & Lynn, R. (2013)
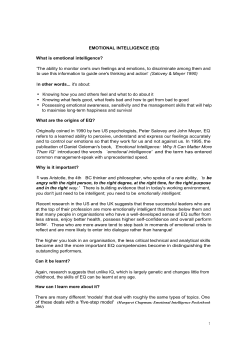
Intelligence 41 (2013) 817–820
Contents lists available at ScienceDirect
Intelligence
A negative Flynn effect in Finland, 1997–2009
Edward Dutton a,⁎, Richard Lynn b
a
b
University of Oulu, Finland
University of Ulster, UK
a r t i c l e
i n f o
Article history:
Received 9 March 2013
Received in revised form 21 March 2013
Accepted 27 May 2013
Available online 30 June 2013
a b s t r a c t
The average IQs of approximately 25,000 18–20 year old male military conscripts in Finland
per year are reported for the years 1988 to 2009. The results showed increases in the scores on
tests of Shapes, Number and Words over the years 1988 to 1997 averaging 4.0 IQ points a
decade. From 1997 to 2009 there were declines in all three tests averaging 2.0 IQ points a
decade.
© 2013 Elsevier Inc. All rights reserved.
Keywords:
Flynn effect
Negative Flynn effect
Finland
1. Introduction
Numerous studies have shown that performance on IQ
tests of around 3 to 5 IQ points per decade has improved
during much of the twentieth century (Flynn, 1984, 1987,
2012; Lynn, 2013). From the mid-1990s these increases went
into reverse in Norway, Denmark, Australia, Britain, the
Netherlands and Sweden. These negative Flynn effects are
summarized in Table 1. In Denmark, Borge Priene's Prove is
the average of tests of letter matrices, verbal analogies,
number series and geometric figures. In Norway, the General
Ability test is a combination of arithmetic, word meaning and
figures (resembling the Progressive Matrices). In Sweden, the
General Ability test is a combination of instructions (verbal
comprehension), synonyms, metal folding (spatial ability),
and technical comprehension. In the Netherlands, the GATB
is the Dutch version of the General Aptitude Test Battery.
Contrary to these declines, IQs have continued to increase in
Estonia (Must, te Nijenhuis, Must, & van Vianen, 2009) and
for vocabulary and non-verbal reasoning ability measured by
the progressive Matrices from 1979 to 2008 for children aged
5 to 12 years, although there was no increase in the IQs of
older children aged 13–15 (Lynn, 2009). In the present paper
⁎ Corresponding author.
E-mail address: [email protected] (E. Dutton).
0160-2896/$ – see front matter © 2013 Elsevier Inc. All rights reserved.
http://dx.doi.org/10.1016/j.intell.2013.05.008
we present data showing a decline in the average IQs of
military conscripts in Finland over the years 1997–2009.
2. Method
In Finland, military service (‘maanpuolustusvelvollisuus’) of
at least six months is compulsory for every able young man
aged 18 years or over. They can defer the service if they have
sound reason to do so but they can only postpone it until they
are 28. Conscripts are paid a modest salary, which varies
according to their rank. Around 88% of the eligible Finnish male
population underwent military service every year in the years
between 1988 and 2001 (Koivunen, 2007). The remaining 12%
have been rejected or excused for various reasons. Around 5%
have been rejected on grounds of poor health (AppelqvistSchmidlechner, Upanne, Henriksson, Parkkola, & Stengård,
2010). 3% of those who do not undertake military service opt
for ‘civil service’ (siviilipalvelus) (which lasts 362 days) on the
grounds that they are conscientious objectors or have religious
objections. However, in some cases they began military service
and dropped out. In 2007, 15% of conscripts failed to complete
their military service and 12% dropped out in the first two
weeks (prior to the administration of any IQ test) with the
remainder dropping out towards the end of the service period
(Helsingin Sanomat, 08/10/06). According to a representative
of the Finnish civil service organization (pers. comm. 4/03/13),
818
E. Dutton, R. Lynn / Intelligence 41 (2013) 817–820
Table 1
IQ declines in six countries.
Country
Age
Test
Years
IQ decline
IQ decline per decade
Reference
Norway
Australia
Denmark
Britain
Britain
Sweden
18–19
6–11
18–19
11–12
13–14
18–19
General ability
CPM
Borge Priene's Prove
Piagetian
Piagetian
General ability
1996–2002
1975–2003
1998–2003/4
1975–2003
1976–2006
1992–1993
0.23
3.00
1.50
12.00
7.50
0.026
0.38
1.07
2.70
4.30
2.50
0.26
Netherlands
Various
GATB
1975–2005
10.05
1.35
Sundet, Barlaug, and Torjussen (2004)
Cotton et al. (2005)
Teasdale and Owen (2008)
Shayer and Ginsburg (2007)
Shayer and Ginsburg (2009)
Ronnlund, Carlstedt, Blomstedt, Nilsson,
and Weinehall (2013)
Woodley and Meisenberg (2013)
this has meant that, overall, 7% of each year group undergoes
civil service work with around 3% initially opting for it, and this
has been stable since the 1980s. Refusal to pursue either form of
service leads to 182 days in prison (this being the minimum
length of military service) with no parole. Practicing Jehovah's
Witnesses are exempted from military and civil service.
Since 1955, an intelligence test developed by the Finnish
Army and called the Peruskoe (literally ‘Basic Test’) has been
administered to all Finnish conscripts in their third and again
in their sixth week of military service. Since 1981 this test
has been designated Peruskoe-1 (P1). The test is composed
of three sub-tests: Shapes (kuviotesti), a non-verbal test
resembling the Progressive Matrices, Number (numerotesti)
and Words (sanatesti). In terms of Carroll's (1993, p.626)
taxonomy of eight major second order (stratum 2) factors,
Shapes (kuviotesti) is a non-verbal test resembling the
Progressive Matrices and is a measure of Carroll's stratum 2
F Fluid Intelligence. Number is measures of Carroll's 2 F Fluid
Intelligence and stratum 1 Quantitative Reasoning. Words
(sanatesti) is a measure of Carroll's stratum 2C Crystallized
Intelligence and stratum 1 Verbal Language Comprehension.
There are 40 multiple-choice questions in each sub-test,
ordered in increasing difficulty. The army uses the results to
decide, in part, who should be selected for Non-Commissioned
Officer School and who should begin training at Reserve Officer
School.
The Finnish Army has declassified P1 test results obtained
between 1988 and 2001 and has released these and the
results for 2009 to the authors. These contain data for
382,022 Finnish conscripts for 1988 through 2001, and for a
further 25,144 recruits for 2009, giving a total sample of
407,166. The recruits took P1 when they were aged either 19
or 20 and were born between 1968 and 1982.
3. Results
The average raw scores for each year from 1988 to 2001
and in 2009 on the P1 tests are given in Table 2. The time
series showing the increases and declines in scores in ds
(sd units) are shown in Fig. 1. It will be seen that scores on
Shapes increased over the time period from 1988 to 1997,
followed by a small decline. Scores on Words and Number
show a rise to 1996/1997 and then fall far more sharply.
Because of the very large sample sizes of approximately
25,000 in each year, all of these differences are statistically
significant.
4. Discussion
The results show three points of interest. First, IQs
measured by tests of Shapes, Number and Words increased
in Finland over the years 1988 to 1997, showing the Flynn
effects that have been reported in numerous studies. The
largest increase took place in the Shapes test (.46d = 6.9
conventional IQ points), and smaller increases took place in
the Number and Words tests (.22d = 3.3 and .12d = 1.8
conventional IQ points, respectively). The larger increase in
the non-verbal Shapes test than in the Number and Words
tests is consistent with results in numerous previous studies
(Flynn, 1984, 1987, 2012; Lynn, 2013). The average of the
increases from 1988 to 1997 in the three tests is 4.0 IQ points
per decade and therefore about the same as that reported for
military conscripts in a number of previous studies (Flynn,
1987, 2012).
Second, the results show a decline of IQs in Finland for
the years 1997–2009. This confirms the studies noted in
the introduction showing that average IQs declined from
the mid-1990s in Norway, Denmark, Australia, Britain, Sweden
and the Netherlands. The largest declines in the present study
took place in the Number and Words tests (−.22d = 3.3
and −.34d = 5.1 conventional IQ points, respectively). The
smallest decline took place in the Shapes test (−.18d = 2.7
conventional IQ points) for which scores peaked in 1997,
followed by only a small decline and then a plateau thereafter.
The 1991 cohort was an anomaly in so far as it was brighter for
some unknown reason.
Table 2
Average raw scores of Finnish conscripts on P1 test between 1988 and 2009.
Year
Shapes test (sd)
Number test (sd)
Word test (sd)
1988
1989
1990
1991
1992
1993
1994
1995
1996
1997
1998
1999
2000
2001
2009
24.337 (5.81)
24.535 (5.70)
24.715 (5.68)
25.454 (5.48)
25.262 (5.55)
25.813 (5.44)
26.226 (5.38)
26.417 (5.32)
26.718 (5.27)
26.891 (5.34)
26.780 (5.38)
26.284 (5.70)
26.419 (5.67)
26.345 (5.67)
26.49 (5.88)
19.724
19.932
19.966
21.251
20.605
20.830
21.159
21.181
21.402
21.460
21.245
20.595
20.525
20.285
19.81
22.750
22.724
22.563
23.549
22.816
22.942
23.201
23.485
23.591
23.413
22.986
22.113
22.055
21.804
21.26
(8.08)
(7.98)
(7.95)
(7.84)
(7.91)
(7.79)
(7.79)
(7.69)
(7.63)
(7.63)
(7.54)
(7.61)
(7.63)
(7.56)
(7.60)
(7.46)
(7.44)
(7.32)
(7.14)
(7.18)
(7.01)
(6.98)
(6.92)
(6.85)
(6.90)
(6.85)
(6.97)
(6.98)
(6.99)
(6.96)
E. Dutton, R. Lynn / Intelligence 41 (2013) 817–820
819
combination of simulations involving demographic changes
and interpolation based on theoretical IQ losses due to the
negative fertility-IQ correlation, estimates the decline in IQ
attributable to the combined effects of both within and
between population dysgenic fertility for the period 1979–
2010 at 3.11 points equivalent to approximately one point
per decade.
References
Fig. 1. Intelligence test results plotted against year of testing.
The magnitude of the rate of decline of IQ in Finland in the
present study calculated as the average of the decline in the
three tests was approximately 2 IQ points per decade.
Third, the declines of IQ in Norway, Denmark, Australia,
Great Britain, Sweden and the Netherlands may be partly
attributable to the large numbers of non-European immigrants with lower IQs who settled in these countries from the
mid-1960s onwards. At the end of the first decade of the
twenty-first century, 13.1% of the Norwegian population
were non-European (Statistics Norway, 2012), as were 11.4%
in Denmark (StatBank, 2012), 21% in the Netherlands (CBS
StatLine, 2012), 11% in the UK (UK Census, 2011), and
approximately 20% in Australia (Australian Bureau of Statistics,
2011). These non-European peoples, with the exception of the
Chinese, have average IQs ranging from 10 to 30 points lower
than the European average (Lynn, 2006; Lynn & Vanhanen,
2012), so immigrants from these countries are likely to reduce
the average IQs in Western nations, and this could explain some
or even all of the decline in IQs in Western European nations.
This is unlikely to have been a factor in Finland because
there were few non-European immigrants in Finland during
the years 1997–2009. In 2012, 4.8% of the Finnish population
were immigrants or had at least one immigrant parent
(Statistics Finland, 2012) and the great majority of these
were Russians and Estonians, whose average IQ is the
approximately same as that of the Finns at around 100
(Lynn & Vanhanen, 2012). Those of non-European, including
American, origin made up just 1.8% of the Finnish population
in 2012 (Statistics Finland, 2012). Thus, the decline of IQs in
Finland cannot be attributed to the arrival of significant
numbers of immigrants who may have had lower average IQs
than the indigenous population. The most probable reason
for the declines in IQs that have now been recorded
in a number of countries is the presence of dysgenic fertility,
i.e. the negative association between intelligence and numbers of children that has been reported in Sweden (Nystrom,
Bygren, & Vining, 1991), Denmark (Nyborg, 2012), Finland
(Dutton, 2012) and a number of other countries reviewed in
Lynn (2011). For Denmark, Nyborg (2012), employing a
Appelqvist-Schmidlechner, K., Upanne, M., Henriksson, M., Parkkola, K., &
Stengård, E. (2010). Young men exempted from compulsory military or
civil service in Finland — A group of men in need of psychosocial
support? Scandinavian Journal of Public Health, 38, 168–178.
Australian Bureau of Statistics (2011). Migration, Australia, 2009–2010. http://
www.abs.gov.au/ausstats/[email protected]/Products/52F24D6A97BC0A67CA2578B
0001197B8?opendocument
Carroll, J. B. (1993). Human cognitive abilities: A survey of factor-analytic
studies. Cambridge: Cambridge University Press.
CBS StatLine (2012). http://statline.cbs.nl/StatWeb/publication/?DM=
SLEN&PA=37325eng&D1=0&D2=0&D3=0&D4=0&D5=01,84,102,
139,145,210,225&D6=a&LA=EN&HDR=G2,G3,G4,T&STB=G1,G5&VW=T
Cotton, S., Kiely, P., Crewther, D., Thompson, B., Laycock, R., & Crewther, S.
(2005). A normative and reliability study of the Raven's Colored
Matrices for primary school aged children from Victoria, Australia.
Personality and Individual Differences, 39, 647–659.
Dutton, E. (2012). Recent ethnographic research on the modern Finnish
social class system as an evolutionary strategy. Acta Ethnographica
Hungarica, 57, 409–424.
Flynn, J. R. (1984). The mean IQ of Americans: Massive gains 1932 to 1978.
Psychological Bulletin, 95, 29–51.
Flynn, J. R. (1987). Massive IQ gains in 14 nations: What IQ tests really
measure. Psychological Bulletin, 101, 171–191.
Flynn, J. R. (2012). Are we getting smarter? Rising IQ in the twenty first century.
Cambridge: Cambridge University Press.
Helsingin Sanomat. (08/10/06). Numbers of those exempted from
military service heading upwards. http://www.hs.fi/english/article/
Numbers+of+those+exempted+from+military+service+heading+
upwards/1135237057121
Koivunen, S. (2007). Suomalaismiesten kognitiivisen kykyprofiilin muutokset
1988–2001: Flynnin efektiä suomalaisessa aineistossa? Pro Gradu: Jyväskylä University.
Lynn, R. (2006). Race differences in intelligence: An evolutionary analysis.
Augusta, GA: Washington Summit Publishers.
Lynn, R. (2009). Fluid intelligence but not vocabulary has increased in
Britain, 1979–2008. Intelligence, 37, 249–255.
Lynn, R. (2011). Dysgenics: Genetic deterioration in modern populations.
London: Ulster Institute for Social Research.
Lynn, R. (2013). Who discovered the Flynn effect? A review of early studies
of the secular increase of intelligence. Intelligence, 41, 765–769.
Lynn, R., & Vanhanen, T. (2012). Intelligence: A unifying construct for the social
sciences. London: Ulster Institute for Social Research.
Must, O., te Nijenhuis, J., Must, A., & van Vianen, A. E. M. (2009).
Comparability of IQ scores over time. Intelligence, 37, 25–33.
Nyborg, H. (2012). The decay of Western civilization: Double relaxed
Darwinian selection. Personality and Individual Differences, 53,
118–125.
Nystrom, S., Bygren, L. O., & Vining, D. R. (1991). Reproduction and level of
intelligence. Scandinavian Journal of Social Medicine, 19, 187–189.
Ronnlund, M., Carlstedt, B., Blomstedt, Y., Nilsson, L. -G., & Weinehall, L.
(2013). Secular trends in cognitive test performance: Swedish conscript
data 1970–1993. Intelligence, 41, 19–24.
Shayer, M., & Ginsburg, D. (2007). Thirty years on — A large anti-Flynn
effect? The Piagetian test Volume & Heaviness norms 1975–2003.
Journal of Educational Psychology, 77, 25–41.
Shayer, M., & Ginsburg, D. (2009). Thirty years on—A large ant-Flynn
effect? 11: 13-year olds. Piagetian tests of formal operations norms
1976–2006/7. British Journal of Educational Psychology, 79,
409–418.
StatBank (2012). Denmark in figures, 2012. http://www.dst.dk/pukora/
epub/upload/14852/dkinfigures.pdf
Statistics Finland (2012). Population structure. http://www.stat.fi/til/vaerak/
index_en.html
Statistics Norway (January 1). Immigrants and Norwegian born to immigrant parents. http://www.ssb.no/en/innvbef/
820
E. Dutton, R. Lynn / Intelligence 41 (2013) 817–820
Sundet, J. M., Barlaug, D. G., & Torjussen, T. M. (2004). The end of the Flynn
effect? A study of secular trends in mean intelligence test scores of
Norwegian conscripts during half a century. Intelligence, 32, 349–362.
Teasdale, T. W., & Owen, D. R. (2008). Secular declines in cognitive test
scores: A reversal of the Flynn effect. Intelligence, 36, 121–126.
UK Census (2011). http://www.ons.gov.uk/ons/guide-method/census/2011/
index.html
Woodley, M., & Meisenberg, G. (2013). In the Netherlands the anti-Flynn
effect is a Jensen effect. Personality and Individual Differences, 54,
871–876.


© Copyright 2026