
Flybe - 2012/13
Half-year Results
Analyst and Investor Presentation
8 November 2012
Agenda
Introduction – JJim French, Chairman & CEO
Financial Review
Strategy Update
Strategic
Review&&Business
BusinessReview
Update
Outlook
2
H1 2012/13 - Overview
Highlights
g g
•
Flybe at a Glance
Building European business to reduce reliance on UK economy
38.6% of airline revenue from non-UK domestic flying (H1 2011/12: 32.1%)
•
•
•
•
Further 12 E190s flying under contract for Finnair from Winter 2012/13
52.6%
52
6%
UK Regions
market
k t share
h
Launch of ‘Making flying better’ and Manchester hub in UK
New routes at East Midlands
Fleet renewal and matching aircraft capacity to market needs
Delivery of four E175 aircraft, further two in H2 2012/13
29.1% share of UK domestic market
Disposed of two Q400s
4 0m
4.0m
Four Q400s contract flying
y g for Brussels Airlines in H2 2012/13
/
Flybe UK passengers (H1 2011/12: 4.2m)
Challenging period
•
•
•
•
•
(1)
Continuing weak economic backdrop
6.2m
Stubbornly high fuel prices
Regulatory and infrastructure cost pressures
Flybe UK seats flown
((H1 2011/12:
/ 6.4m))
Ever increasing APD
Transition towards more transparent ancillary model
Strategy remains on track
(1)
3
Including Loganair
Loganair, excluding London airports
Flybe – Europe’s Largest Regional Airline
209 Routes
35 UK airports
71 European airports
20 Countries
3,500+ Staff
97 Aircraft
Route map from Winter 2012/13, based on new
contract flying agreement with Finnair
4
Agenda
Introduction
Financial Review – Andrew Knuckey, CFO
Strategy Update
Strategic
Review&&Business
BusinessReview
Update
Outlook
5
Financial Highlights
•
Revenue under management, including Flybe Finland, up 13.2% to
£396.3m
•
•
•
Group revenue stable at £340.8m
•
•
•
•
•
•
EBITDAR(1) down 23.9% to £46.7m
(1)
(2)
(3)
Financials at a Glance
£396.3m
Revenue under management
up 13.2%
Flybe UK passenger revenue per seat stable at £49.90
Flybe
y UK costs pper seat ((at constant currencyy and fuel)) upp 5.0% to
£52.57
£46 7
£46.7m
EBITDAR
Operating profit(2) of £1.1m vs. £16.7m in H1 2011/12
Loss before tax of £(1.3)m vs. profit of £14.3m in H1 2011/12
£1.1m
Operating profit
O
Operating
i cashh outflow
fl off £(4
£(4.8)m
8) vs. inflow
i fl off £13
£13.0m
0 iin H1 2011/12
£85.4m
Net debt(3) of £(50.0)m vs. £(29.7)m at March 2012
Net assets
Net assets £85
£85.4m
4m vs.
vs £89.4m
£89 4m at March 2012
EBITDAR comprises (loss)/profit before tax and adds back interest, depreciation (exc. maintenance assets),
amortisation and aircraft rental charges
Operating profit before share of joint venture result
Net debt comprises total cash (including restricted cash) less borrowings
6
Group – Divisional Revenues & EBITDAR
H1 2012/13
£m
H1 2011/12
£m
Change
328 5
328.5
329 1
329.1
(0 2)%
(0.2)%
Flybe Europe
55.5
8.6
n/m
Flybe Aviation Support
21.6
22.6
(4.4)%
I t
Inter-segment
t sales
l
(9 3)
(9.3)
(10 1)
(10.1)
79%
7.9
396.3
350.2
13.2 %
(55.5)
(8.6)
n/m
Revenues
Flybe UK
Revenue under management
Less: Revenue from Flybe Europe joint venture
340.8
341.6
(0.2)%
Flybe
ybe U
UK
49.5
.5
62.1
6
.
((20.3)%
0.3)%
Flybe Europe
(0.5)
(0.1)
n/m
Flybe Aviation Support
(0.5)
0.9
n/m
Group costs
(1 8)
(1.8)
(1 5)
(1.5)
(20 0)%
(20.0)%
Group revenue (excluding investment income)
EBITDAR
Group
46.7
61.4
7
(23.9)%
Flybe
l b Finland
i l d only
l
trading for one
month in H1 2011/12
Growth in revenue
under management
di
driven
by
b Flybe
l b
Finland
Group revenues
stable at £340.8m
EBITDAR down
(23.9)% to £46.7m
Group - Divisional Results
H1 2012/13
£m
H1 2011/12
£m
Flybe UK
3.8
16.0
Flybe Europe
(2 4)
(2.4)
(0 6)
(0.6)
Flybe Aviation Support
(0.9)
0.4
Total Divisional results
0.5
15.8
Group costs
(1.8)
(1.5)
(Loss)/profit before tax
(1.3)
14.3
-
03
0.3
(Loss)/profit after tax
(1.3)
14.6
(Loss)/profit before tax - reported
(1 3)
(1.3)
14 3
14.3
Add back of revaluation gain on USD aircraft loans
(0.7)
-
Underlying (loss)/profit before tax
(2.0)
14.3
(1.7)
19.4
Tax credit
(Loss)/earnings per share (basic), pence
8
Flybe Finland only
trading for one
month in H1 2011/12
BNDES USD loans on
six E175 finance
leases
Flybe UK - Divisional Results
H1 2012/13
£m
H1 2011/12
£m
Revenue
328.5
329.1
F l
Fuel
(68 6)
(68.6)
(55 9)
(55.9)
Operating costs (exc fuel and aircraft ownership costs)
(210.4)
(211.1)
EBITDAR
(0.2)% margin down
(3 8)ppt to
(22 7)% (3.8)ppt
(22.7)%
15.1%
0.3 %
49.5
62.1
(20.3)%
EBITDAR (1)
Margin
Finance and ownership
+15.1 %
+18.9 %
(3.8)ppt
(45.7)
(46.1)
+0.9 %
38
3.8
16 0
16.0
(76 2)%
(76.2)%
+4.9 %
(3.7)ppt
Di i i
Divisional
l profit
fit
Margin
Change
+1.2 %
Fuell cost per seat, £
11 0
11.06
8 3
8.73
(2 )
(26.7)%
Other costs per seat, £
41.51
40.11
(3.5)%
Other costs per seat at constant currency, £
41.51
39.50
(5.1)%
Operating costs per total seats (exc fuel)
increased by less than inflation vs. H1 2011/12
(1)
EBITDAR comprises PBT and adds back interest,
interest depreciation (exc maintenance assets)
assets), amortisation and aircraft rental charges
9
Despite macro-economic challenges
and fuel costs up 22.7%, core Flybe UK
business generated a profit
Flybe UK - Revenue
H1 2012/13
H1 2011/12
Change
Passengers (m)
4.0
4.2
(3.4)%
Load factor (%)
65 0
65.0
65 6
65.6
(0 6)ppt
(0.6)ppt
Seats (m)
6.2
6.4
(2.6)%
Sector length (km)
466
468
(0.4)%
Passenger revenue (£m)
310.3
318.4
(2.5)%
Passenger yield (£)
76.77
76.06
+0.9 %
Contract flying revenue (£m)
4.5
-
n/m
Revenue from other activities (£m)
13.7
10.7
+28.0 %
Total revenue (£m)
328 5
328.5
329 1
329.1
(0 2)%
(0.2)%
Passenger revenue per seat (£)
49.90
49.88
+0.0 %
Contract flying revenue from Brussels
Airlines, also increase in charter revenue
10
Load factor down
(0.6)ppt, passengers
d
down
( ) (3.4)%
impact of macroeconomic backdrop
and Olympic effect
Ticket yield increase
offset by loss of
debit card charges in
ancillary
ill revenue
Flybe UK – Operating Cost per Seat
54
Effective cost per tonne
increased from $798 to $1,008
53
0 75
0.75
52
0 01
0.01
52.57
0.66
Effective USD rate moved
from 1.58 to 1.61
51
0.14
0.45
2.54
£
50
49
48.84
(0.82)
Excluding costs relating to contract
fl i bbroadly
flying,
dl iin liline with
ith H1 11/12
48.02
48
47
H1 2011/12
Operating
cost per seat
Foreign
exchange
H1 2011/12
Operating
cost per seat
at constant
currency
Fuel
Net airport, Aircraft rental Staff costs
en route
charges,
charges and maintenance
ground
and
operations depreciation
11
Marketing
and
distribution
costs
Other
operating
expenses
H1 2012/13
Operating
cost per seat
Flybe UK – Impact of Fuel
H1 2012/13
H1 2011/12
Change
- Market rate
1,008
1,044
36
- Effective price
1,008
798
(210)
- Market rate
1.58
1.62
$(0.04)
- Effective pprice
1.61
1.58
$0.03
Actual cost of fuel £ / metric tonne
626
505
((121))
Fuel $ / metric tonne
USD rate
12
Flybe UK – Hedging Positions
J t fuel
Jet
f l
•
84% of anticipated requirement for half year to March 2013 hedged at $1,015 per
tonne
•
59% of anticipated requirement for half year to September 2013 hedged at $980 per
tonne
US Dollar
•
•
87% of anticipated requirement for half year to March 2013 hedged at $1.59
•
Small net exposure of <€20m, no formal hedging
60% of anticipated requirement for half year to September 2013 hedged at $1.58
Euro
13
Flybe Europe - Financial Results
H1 2012/13
£m
55.5
(11.3)
(40.4)
3.8
H1 2011/12
£m
8.6
(1.5)
(6.1)
1.0
+6.8 %
+11.6 %
(8.3)
(8
3)
(4.5)
(1.6)
(1
6)
(0.6)
(8.1)%
(7.0)%
Tax credit
Flybe Finland - loss after tax
11.11
(3.4)
(0.6)
Flybe Group - 60% share of loss after tax
Fl b EEurope
Flybe
- central management costs
- interest received
Flybe Europe - divisional result
(2.1)
(0.5)
(0.5)
0.2
(2.4)
(0.1)
(0.6)
Revenue
Fuel
Operating costs (exc fuel and aircraft ownership costs)
EBITDAR (1)
Margin
Finance andd ownership
Fi
hi
Flybe Finland - loss before tax
Margin
(1)
EBITDAR comprises PBT and adds back interest, depreciation (exc maintenance assets), amortisation and aircraft rental charges
14
Flybe 60% share of
loss from JV of
£(2.1)m,
( ) , on plan
p
After central
management costs
and interest
received, Flybe
Europe loss was
(7.2)% of Flybe’s
share of revenue
Flybe Europe - Revenue
H1 2012/13
H1 2011/12
Passengers (('000)
000)
194
31
Load factor (%)
42.2
39.4
Seats ('000)
459
79
Sector length (km)
401
366
Passenger revenue (£m)
16.4
2.5
Passenger yield (£)
84.55
80.43
Contract flying (£m)
36.7
5.8
24
2.4
03
0.3
55.5
8.6
35 70
35.70
31 66
31.66
Revenue from other activities (£m)
Total revenue (£m)
Passenger revenue per seat (£)
15
H1 2011/12 contract
flying revenue
generated from
seven ATR
turboprops and two
E170s
12 E190 aircraft from
October 2012, taking
total to 21 out of 28
Flybe
l b Finland
i l d aircraft
i f
deployed on
contract flying
Flybe Aviation Support
H1 2012/13
H1 2011/12
Change
Financial results
Maintenance, repair and overhaul
19.1
21.1
(9.5)%
Training Academy
2.5
1.5
66.7 %
Total revenue
21.6
22.6
(4.4)%
Operating costs
(22.5)
(22.2)
(1.4)%
Divisional profit
(0 9)
(0.9)
04
0.4
n/m
Operational headlines
Third party man hours
179
186
(3 8)%
(3.8)%
Flybe man hours
96
120
(20.0)%
Total man hours
275
306
(10.1)%
16
MRO loss
l off
£(0.7)m, Training
Academy loss of
£(0 2)
£(0.2)
(10.1)% YOY decline
in MRO man hours –
impact of weak Q2
Group - Fleet Under Management
At September
S t b
2012
At March
M h
2012 Movements
Flybe UK
Embraer 118-seat E195 regional jet
Embraer 88-seat E175 regional jet
Bombardier 78-seat Q400 turboprop
y UK total
Flybe
14
8
47
69
14
4
50
68
-
Flybe Europe
ATR 48-seat ATR42 turboprop
ATR 68
68- and 72
72-seat
seat ATR72 turboprop
Embraer 76-seat E170 regional jet
Flybe Europe total
3
11
2
16
3
11
2
16
-
Total
85
84
1
Held on operating lease
Owned and debt financed
Total
75
10
85
74
10
84
1
7,078
83.3
47
4.7
6,960
82.9
46
4.6
Total seats in fleet under management
Average seats per aircraft
A
Average
age off fleet
fl t (years)
(
)
17
4
(3)
1
1
118
0.4
(0 1)
(0.1)
Fleet
l substitution
b i i
continues, Flybe UK
fleet up by one
aircraft at
September 2012 –
four Q400s now
contract flying for
B
Brussels,
l four
f
grounded for
Winter 12/13
Now 28 aircraft in
fleet, of which 21 are
contract flying
Now 97 aircraft (of
which 25 are
contract flying),
total seats 8,302,
average age 4.7
years
ears
Group Cash Flow
80
Two E175 deliveries acquired on
finance lease, disposal of two Q400s
70
31.2
59.1
60
50
42.9
£m
(1 3)
(1.3)
(4.0)
6.9
(6 4)
(6.4)
40
(22.0)
11.8
30
27 9
27.9
20
10
Group operating cash
outflow £(4.8)m
0
Free cash at Loss for period Depreciation
March 2012
and
amortisation
Net working
Transfer to
Capital
capital
restricted cash expenditure
net of disposal
proceeds
18
Financing
Free cash at Restricted cash
September
2012
Total cash
Group Balance Sheet
At September
2012
£m
At March
2012 Movements
£m
£m
Fixed assets
181.6
162.1
19.5
Cash and restricted cash
59.1
67.6
(8.5)
Landing slots and other intangible assets
10 2
10.2
10 1
10.1
01
0.1
Joint ventures
14.4
16.2
(1.8)
Derivative financial instruments
(3.6)
3.9
(7.5)
Aircraft deposits
16.4
19.8
(3.4)
Other assets
131.6
135.6
(4.0)
Total assets
409 7
409.7
415 3
415.3
(5 6)
(5.6)
Debt
(109.1)
(97.3)
(11.8)
Other liabilities
(215 2)
(215.2)
(228 6)
(228.6)
13 4
13.4
Net assets and shareholders' funds
85.4
89.4
(4.0)
19
Net debt at 30
September
2012 of
£(50.0)m, vs
£(29.7)m at
March 2012
Net assets of
£85.4m
Agenda
Introduction
Financial Review
Strategic
Strategy Review
Update&&Business
BusinessUpdate
Review
- Jim French, Chairman & CEO
Outlook
20
Flybe Today
Europe’s Largest Regional Airline
•
UK’s No. 1 regional airline
•
•
Europe’s largest regional airline
Rapidly growing European business
•
•
29.1% brand market share, 52.6% share of regional domestic market
Led by low risk, long-term contract flying
Europe’s leading regional MRO and training facilities
Independent – relationships
i
i include:
i
Finnair – joint venture, contract flying, codeshare
BA – shareholder,
h h ld codeshare
d h
Air France/KLM – codeshare, capacity share
Brussels Airlines – contract flying
21
Delivering Our Strategy – Capitalising on UK Leadership
Manchester hub concept
Fully functioning regional hub
17 connecting routes
•
7 new routes from East Midlands and Birmingham
following closure of BMI Baby
•
Challenging UK domestic market
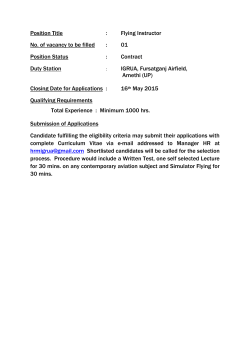
UK Domestic Travel 2002 ‐ 2011
30
6
25
5
20
4
15
3
10
2
5
1
Down 20.6% since 2007
Flybe brand market share increased from 14.2% to
29.1%
Millionss
•
160% increase in APD
Sum of BE
0
0
2002
22
Sum of Total
Sum of Total
2003
2004
2005
2006
2007
2008
2009
2010
2011
Delivering Our Strategy – Capitalising on UK Leadership
•
Launch of ‘Making
i flying
i better’
Removal of debit card charges – transitional impact
on ancillary revenues
Other airlines continue to impose
‘administration’ fees
Key components of
Making flying better
Upgrade to
175 jets
winter
New FFP
winter
Manchester
Hub
Assigned
Seating
Promotional
codes
Fli ht
Flight
frequency
October
•
Focus on cost and capacity management
17 aircraft out of scheduled service since 2008
Initiatives under way to deliver £2 per seat
cost saving from 2013/14 onwards
summer
june
Online self
management
for disruptions
New
website
Making
flying
better
Onboard
Wi-fi trial
New look
advertising
inc TV
Self Bag
Tag Trials
Mobile
booking,
apps,
check-in
No debit
card
charges
Larger
hand
baggage
sizes
“New
economy”
ticket inc
ancillaries
Per
booking
credit card
charges
22
•
Growth in revenue from contract flying and charters
23
Delivering Our Strategy – European Growth
•
•
•
Flybe Finland
Now Finland’s largest domestic airline
New contract flying agreement with Finnair – 12 E190s
E190s,
commenced 28 October 2012
Significant overhead cost reduction since acquisition in
August 2011
Revenue in 2013/14 expected to be €300m+, targeted
profitability in line with original business plan and cash
generative
Further opportunities in Europe
Significant
g
rationalisation and consolidation
Through alliances with national carriers such as joint
ventures, contract flying or codeshare
Fl b wellll placed
Flybe
l d tto benefit
b fit
38.6% of Flybe’s airline revenue ‘touches’ Europe
Expected to increase
24
Delivering Our Strategy – Fleet Renewal
At October 2012 – 97 aircraft, average age 4.7 years
•
•
•
•
36 Embraer E-Series regional Jets
47 Bo
Bombardier
ba d e Q400
Q 00 turboprops
t bop ops
14 ATR turboprops
25 contract flying, 72 scheduled flying
Scheduled deliveries to March 2013
•
Deliveryy of two Embraer 88-seat E175 regional
g
JJets
Indicative profile of fleet under management at March 2013
•
•
•
•
•
38 EEmbraer
b
E-Series
E S i regional
i l Jets
J t
47 Bombardier 78-seat Q400 turboprops
14 ATR turboprops
99 total aircraft
25 contract flying, 74 scheduled flying
25
Agenda
Introduction
Financial Review
Strategy Update
Strategic
Review&&Business
BusinessReview
Update
Outlook – Jim French, Chairman & CEO
26
Outlook
UK
•
•
•
•
•
Forward passenger sales revenue in Flybe UK for Winter 2012/13 ahead c2.5% YOY, on capacity
1% to 2% down
H2 YOY fuel increase expected
e pected to be c.£6m,
c £6m compared with
ith c.£13m
c £13m in H1 2012/13
Six new routes at East Midlands
Four Q400 aircraft contract flying for Brussels, four aircraft grounded for Winter 2012/13
Initiatives underway to deliver £2 per seat annual cost savings from 2013/14
Europe
•
•
Excellent progress in Flybe Finland – on plan and targeted to be profitable in 2013/14
Other low risk growth opportunities being evaluated
Aviation Support
•
•
Adjusting cost base to reflect current weaker trends in 3rd party MRO activity
Commercialisation of Training Academy progressing well – targeting profitability in 2013/14
27
Outlook
No change to 2012/13 revised guidance given on 10 August 2012
•
•
Group revenue – current trends point to YOY growth of between flat and 2%
Group costs – including fuel, an increase YOY of c2.5%
St t
Strategy
on track
t k
•
But against backdrop of current macro-economic headwinds
Medium term financial target remains 7% operating margin
With actions being taken to restore profitability to Flybe UK,
UK and the
continuing growth and move to profitability in Flybe Europe, the Board
remains
e a s co
confident
de t abo
aboutt Flybe’s
ybe s future
t e prospects
p ospects
28
Flybe - 2012/13
Half-year Results
Analyst and Investor Presentation
8 November 2012
Legal Disclaimer
This presentation has been prepared by Flybe Group plc (the “Company”)
Company ). This presentation does not constitute or form part of any offer to sell or issue,
issue or invitation to
purchase or subscribe for, or any solicitation of any offer to purchase or subscribe for, any securities of the Company or in any other entity, nor shall this document or any
part of it, or the fact of its presentation, form the basis of, or be relied on in connection with, any contract or investment decision, nor does it constitute a recommendation
regarding the securities of the Company or any other company.
The information contained in this presentation has not been independently verified. This presentation does not purport to be all-inclusive or to contain all the information
that a prospective investor in securities of the Company may desire or require in deciding whether or not to offer to purchase such securities.
No representation or warranty, express or implied, is made or given by or on behalf of the Company or any of its affiliates (within the meaning of Rule 405 under the US
Securities Act 1933) (“Affiliates”), members, directors, officers or employees or any other person as to the accuracy, completeness or fairness of the information or opinions
contained in this presentation or any other material discussed verbally. None of the Company or any of its Affiliates, members, directors, officers or employees nor any
other person accepts any liability whatsoever for any loss howsoever arising from any use of this presentation or its contents or otherwise arising in connection therewith.
therewith
The information in this presentation includes forward-looking statements which are based on the Company's or, as appropriate, the Company's directors' current
expectations and projections about future events. These forward-looking statements may be identified by the use of forward-looking terminology, including the terms
"believes", "estimates", "plans", "projects", "anticipates", "expects", "intends", "may", "will" or "should" or, in each case, their negative or other variations or comparable
terminology, or by discussion of strategy, plans, objectives, goals, future events or intentions. These forward-looking statements, as well as those included in any other
material discussed at any analyst presentation, are subject to risks, uncertainties and assumptions about the Company and its subsidiaries and investments, including,
among other things, the development of its business, trends in its operating industry, and future capital expenditures. In light of these risks, uncertainties and assumptions,
the events or circumstances referred to in the forward-looking statements may differ materially from those indicated in these statements.
Forward-looking statements may and often do materially differ from actual results. None of the future projections, expectations, estimates or prospects in this presentation
should be taken as forecasts or promises nor should they be taken as implying any indication
indication, assurance or guarantee that the assumptions on which such future
projections, expectations, estimates or prospects have been prepared are correct or exhaustive or, in the case of the assumptions, fully stated in the presentation.
Forward-looking statements speak only as of the date of this presentation. Subject to obligations under the listing rules and disclosure rules made by the Financial Services
Authority under Part VI of the Financial Services and Markets Act 2000 (as amended), neither the Company nor any of its affiliates, or individuals acting on its behalf,
undertakes to publicly update or revise any such forward-looking statement, whether as a result of new information, future events or otherwise. As a result of these risks,
uncertainties and assumptions
assumptions, you should not place undue reliance on these forward-looking
forward looking statements as a prediction of actual results or otherwise.
otherwise
The information and opinions contained in this presentation and any other are material discussed verbally are provided as at the date of this presentation and are subject
to verification, completion and change without notice.
In giving this presentation, neither the Company nor its advisers and/or agents undertakes any obligation to provide the recipient with access to any additional information
or to
t update
d t this
thi presentation
t ti or any additional
dditi l iinformation
f
ti or tto correctt any iinaccuracies
i iin any suchh iinformation
f
ti which
hi h may become
b
apparent.
t
30


© Copyright 2026