
Prediction of the Apnea-Hypopnea Index From Overnight Pulse Oximetry*
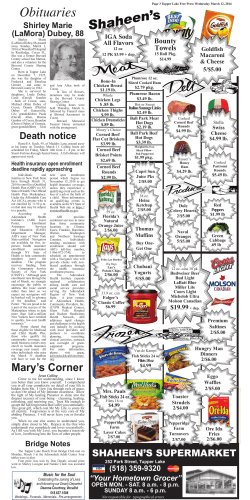
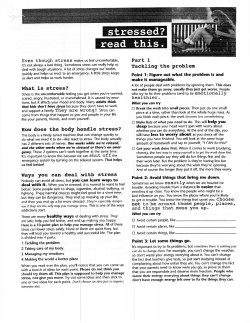
Prediction of the Apnea-Hypopnea
Index From Overnight Pulse Oximetry*
Ulysses J. Magalang, MD, FCCP; Jacek Dmochowski, PhD;
Sateesh Veeramachaneni, MD; Azmi Draw, MD; M. Jeffery Mador, MD;
Ali El-Solh, MD; and Brydon J. B. Grant, MD, FCCP
Study objectives: To compare the relative usefulness of the different indexes derived from pulse
oximetry in the diagnosis of obstructive sleep apnea (OSA), and to determine if a combination of
these indexes improves the prediction of the apnea-hypopnea index (AHI) measured by
polysomnography.
Design: Prediction model developed from 224 patients, validated prospectively in 101 patients
from the same center (group 1) and in 191 patients from a different sleep center (group 2).
Setting: Two independent sleep clinics run by university sleep specialists.
Participants: Patients who underwent polysomnography for suspicion of OSA.
Interventions: The following indexes were calculated from pulse oximetry recordings performed
simultaneously during polysomnography: (1) ⌬ index, the average of the absolute differences of
oxygen saturation between successive 12-s intervals; (2) desaturation events per hour to 2%, 3%,
and 4% levels; and (3) cumulative time spent below 90%, 88%, 86%, 84%, 82%, and 80%
saturation.
Measurements and results: The best predictor was the ⌬ index, although desaturation events
provided similar levels of diagnostic accuracy. An aggregation of multivariate models using
combination of indexes reduced the prediction error (r2 ⴝ 0.70) significantly (p < 0.05) compared to using the ⌬ index alone (r2 ⴝ 0.60). The proportion of subjects from the validation
groups within 95% confidence interval (CI) of the derivation group was 90% (95% CI, 83 to 95%)
and 91% (95% CI, 86 to 95%) for groups 1 and 2, respectively. The overall likelihood ratios for
the aggregated model in all patient groups were 4.2 (95% CI, 3.3 to 15.3), 3.4 (95% CI, 2.7 to 4.3),
3.0 (95% CI, 2.2 to 4.1), and 6.7 (95% CI, 4.9 to 9.2) for normal (AHI < 5/h), mild (AHI 5 to
< 15/h), moderate (AHI 15 to < 30/h), and severe (AHI > 30/h) disease, respectively.
Conclusions: The ⌬ index and oxygen desaturation indexes provided similar levels of diagnostic
accuracy. The combination of indexes improved the precision of the predicted AHI and may offer
a potentially simpler alternative to polysomnography.
(CHEST 2003; 124:1694 –1701)
Key words: bootstrap aggregation; clinical prediction rules; multivariate adaptive regression splines; overnight
polysomnography; pulse oximetry; sleep apnea syndrome
Abbreviations: AHI ⫽ apnea-hypopnea index; ASC ⫽ Associated Sleep Center; CI ⫽ confidence interval;
CPAP ⫽ continuous positive airway pressure; MARS ⫽ multivariate adaptive regression splines; OSA ⫽ obstructive
sleep apnea; ROC ⫽ receiver operator characteristic; VAMC ⫽ Veterans Affairs Medical Center
sleep apnea (OSA) syndrome is a
T hemajorobstructive
health problem affecting 2 to 4% of the
middle-aged population.1 At present, polysomnography is considered the reference standard diagnostic
test for this condition.2 However, polysomnography
*From the Division of Pulmonary, Critical Care, and Sleep
Medicine (Drs. Magalang, Draw, and El-Solh), Department of
Medicine (Dr. Veeramachaneni); Department of Social and
Preventive Medicine (Dr. Dmochowski), University at Buffalo;
and Veterans Affairs Medical Center (Drs. Mador and Grant),
Buffalo, NY.
Supported by Research for Health in Erie County, Inc. and
Veterans Affairs Enhancement Funds.
Manuscript received April 23, 2002; revision accepted June 16,
2003.
1694
Downloaded From: http://journal.publications.chestnet.org/ on 10/21/2014
is costly and time consuming. As a result, primary
care providers may be reluctant about ordering
polysomnography and patients unwilling to attend
For editorial comment see page 1628
their tests. Overnight pulse oximetry has been proposed as a simpler alternative to polysomnography in
Reproduction of this article is prohibited without written permission from the American College of Chest Physicians (e-mail:
[email protected]).
Correspondence to: Brydon J. B. Grant, MD, FCCP, Veterans
Affairs Medical Center (111-S), 3495 Bailey Ave, Buffalo, NY
14215; e-mail: [email protected]
Clinical Investigations
the diagnosis of OSA because it is readily available,
relatively inexpensive, and could potentially meet the
large demand for diagnostic testing in the community. It can be easily done at home and repeated, if
need be, which is not the case with polysomnography
even performed at home.
Several quantitative indexes derived from overnight pulse oximetry have been used to predict the
presence of OSA. These indexes include the number
of oxyhemoglobin desaturations below a certain
threshold, usually 3% or 4% decline from baseline,3– 6 the cumulative time spent below an oxyhemoglobin saturation of 90%,4 and the ⌬ index, a
measure of the variability of the oxyhemoglobin
saturation.7 One study has suggested that the number of desaturations ⬎ 4% as well as the 12-s ⌬ index
also predicts the response to continuous positive
airway pressure (CPAP) therapy in patients with
OSA.8 Although these quantitative indexes appear to
hold more promise than visual inspection of the
overnight pulse oximetry tracing, there has been no
systematic comparison of their relative utility in the
diagnosis of OSA. As a result, physicians select
different parameters to interpret overnight pulse
oximetry results.
Most published studies utilizing these quantitative
oximetry indexes have been performed at a single
institution. Thus, the applicability of these indexes to
the general population remains uncertain.9 In addition, their accuracy has been validated using different threshold values of the apnea-hypopnea index
(AHI) due to a lack of established criterion for the
diagnosis of OSA. In practice, most physicians tend
to modify the initiation of treatment for OSA depending on the patient’s symptoms and clinical
characteristics. Prediction of the actual AHI from
overnight pulse oximetry is likely to be more useful
than using threshold values to define OSA that has
been customary in all but a few studies involving
pulse oximetry.3–7,10,11 The objectives of this study
were to compare the relative utility of the different
quantitative oximetry indexes that are used to confirm the presence of OSA, and to determine if a
combination of these indexes may be superior to a
single index for predicting the AHI from overnight
pulse oximetry data.
Materials and Methods
Patient Population
Five hundred sixteen patients suspected of having OSA were
enrolled into this prospective study. Patients were recruited from
two independent sleep clinics in Buffalo, NY: the Associated
Sleep Center (ASC) and the Buffalo Veterans Affairs Medical
Center (VAMC) Sleep Center. The eligibility criteria were all
www.chestjournal.org
Downloaded From: http://journal.publications.chestnet.org/ on 10/21/2014
patients who underwent overnight polysomnography for suspected sleep apnea. The exclusion criteria were age ⬍ 18 years;
oxygen supplementation was used during the sleep study, or
CPAP titration was performed on the same night as the diagnostic study (split-night study). Eighty-four patients (20.5%; 95%
confidence interval [CI], 17 to 24%) who were scheduled for
polysomnography at the ASC and 71 patients (27%; 95% CI, 22
to 32%) who were scheduled for polysomnography at the Buffalo
VAMC did not show up for testing.
The derivation group consisted of 224 consecutive eligible
patients referred to the ASC. The prediction model developed
from this derivation group was then validated in the subsequent
101 consecutive patients studied at the ASC (validation group 1).
In order to test whether the prediction model will be applicable
at another sleep laboratory, the model was further validated in
191 consecutive patients studied at the Buffalo VAMC Sleep
Center (validation group 2). The study was approved by the
Institutional Review Boards of the University at Buffalo and the
Buffalo VAMC. Informed consent was obtained from patients
studied at ASC, but it was not required by the Institutional
Review Board of the Buffalo VAMC for this particular study.
Polysomnography
All patients underwent standard overnight polysomnography
with recordings of EEG, electro-oculogram, submental and
bilateral leg electromyograms, and ECG. Airflow was measured
qualitatively by an oral-nasal thermistor and respiratory effort by
thoracoabdominal piezoelectric belts. Measurement of arterial
oxyhemoglobin saturation was performed with a pulse oximeter
(ASC: Nellcor N-200, Nellcor Puritan Bennett, St. Louis, MO;
and Buffalo VAMC: Biox 3740, Ohmeda, Boulder, CO) with the
probe placed on the patient’s finger. All signals were collected
and digitized on a computerized polysomnography system (ASC:
Rembrandt, Aerosep Corporation, Buffalo, NY; and Buffalo
VAMC: Acquitron, Mallinckrodt, St. Louis, MO).
Sleep stages were scored in 30-s epochs using standard criteria.12 Each epoch was analyzed for the number of apneas,
hypopneas, EEG arousals, oxyhemoglobin desaturation, and disturbances in cardiac rate and rhythm. Apnea was defined as the
absence of airflow for at least 10 s. Hypopnea was defined as a
visible reduction in airflow lasting at least 10 s associated with
either a 4% decrease in arterial oxyhemoglobin saturation or an
EEG arousal. An arousal was defined according to the criteria
proposed by the Atlas Task Force.13 Apneas and hypopneas were
classified as obstructive if respiratory effort was present, and
central if respiratory effort was absent during the event. The AHI
was defined as the number of apneas and hypopneas per hour of
sleep. Only one person in each sleep laboratory, blinded to the
off-line analysis of pulse oximetry data, scored the sleep studies.
Pulse Oximetry
Pulse oximetry data were collected as part of the polysomnography. Oximetry data were digitized and collected at 8 Hz and 10
Hz at the ASC and Buffalo VAMC, respectively, into a computerized polysomnography system along with the other sleep study
parameters. The recording time was defined as lights-off to
lights-on (approximately 10 pm to 6 am). Recording time was
used as the denominator for the various indexes of overnight
pulse oximetry rather than total sleep time since EEG will not be
available when oximetry is to be utilized outside of the sleep
laboratory. The oximeters in both sleep laboratories employed a
moving average of 3 s. The oximetry data were then extracted
from the computerized polysomnography system for further
off-line analysis. Oximetry data were averaged over 2-s sampling
CHEST / 124 / 5 / NOVEMBER, 2003
1695
intervals. Artifacts were removed by eliminating all changes of
oxygen saturation between consecutive sampling intervals of
⬎ 4%/s,14 and any oxygen saturation ⬍ 20%. The definition of a
desaturation event was also based on the work of Taha and
colleagues.14 Every data point was examined sequentially to
determine if criteria were met to define an event. The criteria for
an event were a decrease of at least the set amount (2%, 3%, or
4%) in oxygen saturation from the initial data value for at least
10 s, and at a rate that is ⬎ 0.1%/s. In addition, the oxygen
saturation must return within 60 s to within 1% of the initial
value, or increase from its nadir by 1.5 times or more of the set
amount of the dip. Once the criteria were met, a new search for
an event was initiated at the next data point after the event. The
⌬ index was calculated as the average of absolute differences of
oxygen saturation between successive 12-s intervals (sum of the
absolute differences between two successive points, divided by
the number of intervals measured).7 The index quantifies oxygen
saturation variability. In OSA, oxygen desaturations associated
with respiratory events cause fluctuations in the oxygen saturation
signal leading to high ⌬ index values. A total of 10 indexes were
calculated for each patient in the derivation group using a
computer program: ⌬ index, number of desaturation events (to
2%, 3%, and 4% levels) per hour of recording time, and the
cumulative time spent below 90%, 88%, 86%, 84%, 82%, and
80% saturation as a proportion of total recording time.
Prediction of the AHI
We used modern multivariate regression techniques to develop
a prediction model15 of the AHI from the calculated quantitative
indexes with commercially available software (Multivariate Adaptive Regression Splines; Salford Systems; San Diego, CA). The
various indexes of overnight oximetry correlated with each other.
As a result, we anticipated that the models may be unstable and
that the structure of the model would depend heavily on the cases
used in the derivation set. To address this issue, we used one of
a new group of techniques (“committee of experts”) that used the
aggregated result from 20 different models.16 Details of the approach that we used are provided in the appendix. The prediction
model was validated in two independent facilities so that it could
be used as a predictive instrument.
Statistical Analysis
The characteristics of the patients in the derivation and two
validation groups were compared using nonparametric one-way
analysis of variance. If a significant difference was found, a
multiple comparison procedure (Dunn method) was used to
determine a source of the difference (Sigmastat; SPSS; San
Rafael, CA).
Although our goal was to provide a prediction model of AHI,
we did use a threshold value to define OSA as a summary
comparison and to facilitate quantitative comparisons with previous studies. Sensitivity, specificity, and receiver operator characteristic (ROC) curves were generated for each of the quantitative oximetry indexes using an AHI threshold value of ⱖ 15
events/h based on the polysomnography to define the presence of
OSA. Comparison of the diagnostic accuracy of the univariate
oximetry indexes was assessed from the area under the ROC
curve. The area under the ROC curve was estimated by the c
index,17 and is calculated using a sampling with replacement
(bootstrap) method with our own software.18 95% CI was used in
all analysis of confidence limits. All values represented by ⫾ are
SE unless stated otherwise. A logarithmic transformation of
predicted and actual AHI was used in order to achieve a normal
distribution of residuals as previously done.19 The validity of the
prediction models developed using the aggregation of models was
tested by calculating the proportions of patients in the validation
groups that were within the confidence limits of the derivation
group. In addition, we compared the positive likelihood ratios of
the aggregated model and the ⌬ index, an approach previously
used by others.20 Positive likelihood ratios were calculated from
the true positive rate predicted from oximetry compared with
polysomnography for that level of severity of sleep apnea divided
by the false-positive rate.
Results
Patient Characteristics
A total of 224 patients were entered into the
derivation group. Another 101 patients were enrolled in validation group 1, and 191 patients were
enrolled in validation group 2. Therefore, a total of
516 patients were included in the analysis. The
patient characteristics of the derivation and two
validation groups are shown in Table 1. All groups
have similar body mass index and AHI. The patients
in validation group 2 were significantly older compared to the derivation group and validation group 1,
and have a larger neck circumference compared to
the derivation group.
Table 1—Summary of Patient Characteristics*
Characteristics
Derivation Group (n ⫽ 224)
Validation Group 1 (n ⫽ 101)
Validation Group 2 (n ⫽ 191)
Age, yr
Body mass index
Neck circumference, cm
AHI, events/h
AHI range, events/h
AHI ⬍ 5/h, %
AHI 5 to ⬍ 15/h, %
AHI 15 to ⬍ 30/h, %
AHI ⱖ 30/h, %
48.9 ⫾ 12.3
32.3 ⫾ 7.4
41.6 ⫾ 4.5
18.2 ⫾ 20.0
0–108.6
33.0
23.2
25.5
18.3
51.8 ⫾ 11.5
32.7 ⫾ 7.1
42.6 ⫾ 4.8
20.2 ⫾ 19.5
0–92.1
19.8
33.7
20.8
25.7
56.0 ⫾ 12.8†
32.9 ⫾ 8.7
43.7 ⫾ 4.2‡
18.2 ⫾ 21.2
0–147.2
25.7
35.6
18.3
20.4
*Data are presented as mean ⫾ SD unless otherwise indicated.
†Significantly different from derivation group and validation group 1 (p ⬍ 0.05).
‡Significantly different from derivation group (p ⬍ 0.05).
1696
Downloaded From: http://journal.publications.chestnet.org/ on 10/21/2014
Clinical Investigations
Relative Utility of Oximetry Indexes
Table 2 shows the c index of the different quantitative indexes calculated from the raw oximetry data
in the 224 patients in the derivation group. The best
predictor of the presence of OSA using a threshold
value of 15 events/h was the ⌬ index (c index,
0.88 ⫾ 0.02), although the number of desaturation
events provided similar levels of diagnostic accuracy.
In addition, the definition of desaturation events
(2%, 3%, or 4%) did not alter the diagnostic accuracy
of the desaturation indexes (c index, 0.87 ⫾ 0.02,
0.87 ⫾ 0.02, and 0.85 ⫾ 0.03, respectively). The sensitivity of a ⌬ index of ⬎ 0.63 in the diagnosis of OSA
was 91% (CI, 84 to 95%), while the specificity was
59% (CI, 49 to 69%).
Prediction of the AHI
Derivation Group: The prediction equation using
the ⌬ index alone derived from the multivariate
model in the derivation group is as follows (equation 1):
log 10 共AHI ⫹ 1兲 ⫽ 1.306 ⫹ 0.269
⫻ BF1 ⫺ 2.316 ⫻ BF2
where BF1 is the maximal value of either zero or (⌬
index ⫺ 0.57), and BF2 is the maximal value of
either zero or (0.570 ⫺ ⌬ index). The coefficient of
determination (r2) between the actual and predicted
AHI was 0.60 using this initial multivariate prediction model involving the ⌬ index alone. The aggregated model using a combination of the various
oximetry indexes increased the r2 between the actual
and predicted AHI (r2 ⫽ 0.70), which was significantly higher than the initial model (p ⬍ 0.05). The
predicted and actual AHIs of the 224 patients in the
derivation group using the aggregated model are
shown in Figure 1.
In comparison with the derivation model using
only the ⌬ index, there was an improvement in terms
of diagnostic accuracy using ⱖ 15/h to define OSA
with the aggregated model. The area under the ROC
curve was increased to 0.9 ⫾ 0.02 with a sensitivity of
90% (CI, 82 to 95%) and a specificity of 70% (CI, 62
to 78%) using the aggregated model.
Validation Group: In validation group 1, the actual AHI values of 92 of 101 patients were within the
CI of the predictions for the AHI using the aggregated model. The proportion of patients within the
CI of the prediction was 90% (CI, 83 to 95%). In
validation group 2, actual AHI values of 174 of 191
patients were within the CI of the predicted AHI.
The proportion of patients within the CI of the
prediction was 91% (CI, 86 to 95%).
Likelihood Ratios
To determine exactly at what levels of disease
severity the ⌬ index model and the aggregated model
differed, we stratified the data into four groups
according to the AHI measured by polysomnography: normal (AHI ⬍ 5/h), mild (5 to ⬍ 15/h), moderate (15 to ⬍ 30/h), and severe (ⱖ 30/h). Figure 2
shows the positive likelihood ratios in all patient
Table 2—Accuracy of the Indexes Derived From
Overnight Oximetry in the Diagnosis of OSA
Oximetry Index
c Index
95% CI
⌬ index
Desaturation index (3% level)
Desaturation index (2% level)
Desaturation index (4% level)
Cumulative time spent below
90% saturation
Cumulative time spent below
88% saturation
Cumulative time spent below
86% saturation
Cumulative time spent below
84% saturation
Cumulative time spent below
82% saturation
Cumulative time spent below
80% saturation
0.881
0.873
0.868
0.852
0.772
0.8384–0.9236
0.8284–0.9176
0.8222–0.9138
0.8010–0.9030
0.7096–0.8344
0.757
0.6924–0.8216
0.723
0.6566–0.7894
0.692
0.6262–0.7578
0.674
0.6108–0.7372
0.647
0.5854–0.7086
www.chestjournal.org
Downloaded From: http://journal.publications.chestnet.org/ on 10/21/2014
Figure 1. The aggregated model using a combination of all 10
oximetry indexes to predict the AHI from the derivation group
(n ⫽ 224). The predicted and actual AHI values are shown on
logarithmic scale. The coefficient of determination (r2) between
the actual and predicted AHI was 0.70, which is significantly
improved compared to 0.60 (data not shown) using the initial
model (p ⬍ 0.05).
CHEST / 124 / 5 / NOVEMBER, 2003
1697
ⱖ 30/h). The aggregated model was superior to the
⌬ index model in the severe level in the derivation
group and the severe level and normal level in
validation group 1, but no different in validation
group 2 (Fig 2).
The likelihood ratios for the aggregated model in
the derivation group were 6.9 (95% CI, 4.4 to 10.8),
4.3 (95% CI, 2.8 to 6.5), 3.6 (95% CI, 2.5 to 5.4), and
12 (95% CI, 7.1 to 20) for normal, mild, moderate,
and severe disease severity, respectively. The likelihood ratios fell within the 95% CI for the normal and
mild levels in validation group 1 and for the moderate and severe levels in validation group 2 (Fig 2).
The likelihood ratios for the ⌬ index model in the
derivation group were 5.4 (95% CI, 2.2 to 12.6), 2.5
(95% CI, 1.7 to 5.3), 3.0 (95% CI, 2.1 to 4.4), and 4.0
(95% CI, 3.6 to 6.5) for normal, mild, moderate, and
severe disease severity, respectively. The likelihood
ratios fell within the 95% CI for the mild level only
in validation group 1 and for all levels in validation
group 2 (Fig 2).
To obtain an overall estimate, we combined the
results from the derivation and both validation
groups for the aggregated model. The overall likelihood ratios for the aggregated model in the derivation group were 4.2 (95% CI, 3.3 to 15.3), 3.4 (95%
CI, 2.7 to 4.3), 3.0 (95% CI, 2.2 to 4.1), and 6.7 (95%
CI, 4.9 to 9.2) for normal, mild, moderate, and
severe disease severity, respectively. The overall
likelihood ratios for the ⌬ index were 3.3/h, 2.5/h,
3.0/h, and 4.9/h for normal, mild, moderate, and
severe disease severity, respectively. Therefore, the
likelihood ratios were at the lower 95% CI in both
the normal and severe levels of disease severity.
Discussion
Figure 2. The positive likelihood ratios (⫾ SE) in the derivation
group (top, A), validation group 1 (center, B), and validation
group 2 (bottom, C) according to the severity of the AHI derived
from multivariate prediction models using the ⌬ index alone
(filled triangles) vs the aggregated model (filled circles). The
aggregated model improved the prediction mainly at both ends of
the AHI spectrum (⬍ 5/h and ⱖ 30/h).
groups according to the severity of the AHI of the
multivariate prediction models using the ⌬ index
alone vs the aggregated model. Both the ⌬ index and
the aggregated models improved the prediction
mainly at both ends of the AHI spectrum (⬍ 5/h and
1698
Downloaded From: http://journal.publications.chestnet.org/ on 10/21/2014
The major findings of this study are as follows:
(1) among the different oximetry indexes, the ⌬
index was the best predictor of the presence of OSA,
although desaturation events provided similar levels
of diagnostic accuracy; (2) the ⌬ index had good
sensitivity but low specificity; (3) a bootstrap aggregation of models involving a combination of all the
oximetry indexes (compared to using the ⌬ index
alone) improved the precision of the prediction of
the AHI; and (4) the prediction model developed in
this article was validated in two independent sleep
clinics. To our knowledge, there has been no previous study that has compared systematically the relative utility of the various quantitative indexes derived
from overnight oximetry in the diagnosis of OSA.
At present, there is no definite established AHI
criterion for the diagnosis of OSA with the threshold
varying from 5 to 20 events per hour. Most clinicians
Clinical Investigations
will modify initiation of treatment depending on the
symptoms and other clinical characteristics. Reports
suggest that even what is considered as mild sleepdisordered breathing is associated with hypertension21,22 and cardiovascular disease,23 and that these
patients with mild disease may also benefit from
CPAP therapy.24,25 A consensus statement26 recommended that treatment be administered if the AHI is
ⱖ 30/h regardless of symptoms. However, results
from a published study27 do not support this recommendation since patients with an AHI ⱖ 30/h who
did not have daytime sleepiness did not benefit from
CPAP therapy. Therefore, we reasoned that a prediction of the actual AHI from overnight oximetry
would be more clinically meaningful than a dichotomous answer to the presence of OSA, and that it
would be more useful if this prediction can be
computerized to eliminate the problem of interobserver and intraobserver variability.
The aggregation method16 resulted in a significant
improvement of the precision of the predicted AHI.
The methodology belongs to a group of methods that
are known as the committee of experts, and has been
described only recently and is still being developed.
Although modest, this improvement is important
because even small improvements in precision can
increase the confidence in the prediction.
Comparison to the Results of Others
A study11 using an automated analysis of oximetry
data and a desaturation event definition ⱖ 4% lower
than baseline reported a very high sensitivity of 98%
and specificity of 88%; however, this study used a
definition of arousals that differs substantially from
the criteria proposed by the Atlas Task Force13 that
has come into general use in the United States. As a
result, their definition of hypopnea will differ substantially from ours. These investigators found that
the addition of arousal-based scoring criteria (using
their definition of arousal) for hypopnea causes only
small changes in the AHI.28 However, a large study29
found that incorporating arousals based on the Atlas
Task Force criteria on the hypopnea definition does
impact on the value of the AHI. Table 3 shows the
comparison of our results to others using an AHI
cutoff value of ⱖ 15/h to define the presence of
OSA. Our results are consistent with others in the
field, although our specificity was higher using the
aggregated model compared to the previously published studies using the ⌬ index.
The study by Levy and colleagues7 reported that
the correlation between the ⌬ index and actual AHI
was 0.72, whereas in the study by Olson et al10 the
Spearman correlation coefficient between the ⌬
index and actual AHI was 0.71. In our study, the
www.chestjournal.org
Downloaded From: http://journal.publications.chestnet.org/ on 10/21/2014
Table 3—Comparison of Results
Source
Method Used
Vazquez et al11
Levy et al7
Olson et al10
Present study
4% desaturation
⌬ index ⱖ 0.6
⌬ index ⱖ 0.4
4% desaturation
⌬ index ⱖ 0.63
AHI predicted from
aggregated model
Sensitivity, % Specificity, %
(95% CI)*
(95% CI)*
98
98 (96–100)
88
94 (87–98)
91 (84–95)
90 (82–95)
88
46 (37–55)
40
44 (35–52)
59 (49–69)
70 (62–78)
*Based on an AHI cutoff value ⱖ 15/h.
correlation (expressed as Pearson correlation) between the predicted and actual AHI was 0.77, which
improved to 0.83 when we used a combination of the
oximetry indexes. Therefore, our prediction model
provides modest improvement compared to using a
simple regression between the ⌬ index alone and
actual AHI.
Limitations
A limitation to the applicability of our prediction
model is that it was validated using overnight pulse
oximetry that was obtained simultaneously with polysomnography data in the sleep laboratory. Using the
oximetry data performed together with polysomnography has the advantage of eliminating such potential
confounders as night-to-night variability of the AHI,
as well as ensuring that oximetry data were collected
in exactly the same environment as the polysomnography data. Further validation of the prediction
model is necessary using overnight oximetry done in
the home setting unattended by technicians.
Clinical Applicability and Controversy
The fact that our prediction was validated in two
independent sleep laboratories suggests that the
model could be potentially applied widely, although
its impact on clinical practice has yet to be established. The exact role of our predictive instrument in
the clinical management of patients with suspected
OSA remains to be elucidated. Overnight oximetry
analysis even incorporating a combination of the
different quantitative indexes may not take into
account hypopneas that were defined on the basis of
EEG arousals rather than changes in oxygen saturation. This may partly explain the variance of our AHI
prediction. In fact, in both validation groups, most of
the discrepancy involved cases where the actual AHI
was greater than the predicted AHI as anticipated.
An argument can be made that the prediction developed in this article will miss cases of upper airway
resistance syndrome, since by definition these paCHEST / 124 / 5 / NOVEMBER, 2003
1699
tients do not have oxygen desaturation during
sleep.30 The existence of this syndrome is controversial.31 The prevalence of the condition remains unknown.32 In addition, the percentage of patients
presenting to a sleep clinic for evaluation of daytime
sleepiness with upper airway resistance syndrome is
also unknown. In view of their significant daytime
hypersomnia, these may be the patients that would
eventually end up requiring overnight polysomnography despite a low predicted AHI from our model.
A concern with unattended overnight oximetry
is that there is no assurance for controlling for
technical difficulties and completeness of data
collection. However, oximetry is such a simple
procedure that a repeat test in the patient’s home
on a separate night in the event of technical
difficulties would be reasonable. Portable oximeters capable of storing data over a prolonged
recording period are now readily available. The
oximeter can be sent home with the patient, and
after the overnight recording mailed back to the
sleep laboratory or physician’s office for downloading of the data and a computer-generated
report of the predicted AHI with its 95% CI
reported back to the physician through an automated system.
The clinical utility of pulse oximetry can be assessed quantitatively from the likelihood ratios. The
Bayesian approach is to multiply the pretest odds by
the likelihood ratio to determine the posttest odds.
Positive likelihood ratios that cause large changes in
the likelihood of disease are ⬎ 10, moderate changes
5 to ⬍ 10, small changes 2 to ⬍ 5, and trivial changes
⬍ 2.9 Our data show that pulse oximetry using the
aggregated method can produce moderate shifts in
the pretest to posttest probability of OSA in the
normal and severe ranges of disease severity, but
only of limited usefulness in the mild-to-moderate
range.
In summary, we have compared the relative utility
of different quantitative indexes derived from overnight oximetry in the diagnosis of OSA. To our
knowledge, our study is the first to have made this
comparison. We have developed a novel prediction
model of the AHI using a combination of these
quantitative oximetry indexes with a better precision
compared to using a single index. We validated this
improved prediction in two independent sleep clinics prospectively.
Appendix
Multivariate Prediction Models
We used multivariate adaptive regression splines (MARS) to
develop prediction models.15 The splines used in this study
1700
Downloaded From: http://journal.publications.chestnet.org/ on 10/21/2014
consisted of one or more of a series of linear segments joined at
adjacent ends that could be fitted to nonlinear data. MARS is a
multivariate nonparametric procedure that builds flexible regression-like models using exhaustive search techniques to test the
necessity of different predictors. Interactions between independent variables are simultaneously tested. The model is adaptive
because it overfits the data, and then determines the size of the
model that optimizes the tradeoff between accuracy (bias) and
variance (precision) using a tenfold cross-validation. The final
model is obtained through backward elimination to the optimal
model size. Predicted value is derived as linear combination of
basic functions.
Aggregated Model
The various indices of overnight pulse oximetry (predictor
variables) are correlated so that there may be several difference
plausible models that could be fitted to the data, and may account
for some of the prediction error. To address this issue, we used
one of a new group of techniques (committee of experts) that
average the predictions of different plausible models to reduce
this error. Specifically, we used bootstrap aggregation model
averaging (“bagging”) by developing 20 random samples (with
replacement) from the original data set,16 a process known as
bootstrapping. Each of the 20 data sets has the same size as the
original data set. Because we used random sampling with replacement, a particular patient could occur more than once in any of
the 20 generated data sets, and some may not appear at all. For
each of the 20 data sets, a MARS model was generated in a
similar form to that shown in equation 1.
For every patient (P) in the original derivation data set (i), and
each of predictive models (m), the predictive value of AHI
0 ⱕ Pi,m ⱕ 360 was determined, so that every patient was
assigned 20 predictions. Predictions beyond this range were
truncated at the end point values because results outside this
range are unachievable. The maximal value, 360/h, would indicate continuous apnea since apnea is defined as an event ⱖ 10 s
in duration.
The multiple linear regression model with bootstrap sample
predictions as independent variables was fitted to transformed
response (equation 2):
log 10(AHI ⫹ 1) ⫽ b0 ⫹ b1p1. . .⫹ b20p20 ⫹ e
where AHI is measured for that patient by overnight polysomnography, and e is the error term. The best regression model was
found with the all-subsets method. If the model was not included
in the final regression model, the corresponding coefficient was
assigned as zero. We used the weighted average of the predictions to obtain a single aggregated prediction of AHI for a
particular patient (equation 3):
log 10 共AHI ⫹ 1兲 ⫽ ⌺共bm ⫻ pm兲/⌺bm
References
1 Young T, Palta M, Dempsey J, et al. The occurrence of
sleep-disordered breathing among middle-aged adults.
N Engl J Med 1993; 328:1230 –1235
2 Systematic review of the literature regarding the diagnosis of
sleep apnea: summary, evidence report/technology assessment number 1. Rockville, MD: Agency for Health Care
Policy and Resarch (AHCPR), Department of Health and
Human Services, U. S. Public Health Service. February 1999,
AHCPR Publication 99-E002
Clinical Investigations
3 Douglas NJ, Thomas S, Jan MA. Clinical value of polysomnography. Lancet 1992; 339:347–350
4 Gyulay S, Olson LG, Hensley MJ, et al. A comparison of
clinical assessment and home oximetry in the diagnosis of
obstructive sleep apnea. Am Rev Respir Dis 1993; 147:50 –53
5 Yamashiro Y, Kryger MH. Nocturnal oximetry: is it a screening tool for sleep disorders? Sleep 1995; 18;167–171
6 Chiner E, Signes-Costa J, Arriero JM, et al. Nocturnal
oximetry for the diagnosis of the sleep apnea hypopnoea
syndrome: a method to reduce the number of polysomnographies? Thorax 1999; 54:968 –971
7 Levy P, Pepin JL, Deschaux-Blanc C, et al. Accuracy of
oximetry for detection of respiratory disturbances in sleep
apnea syndrome. Chest 1996; 109:395–399
8 Choi S, Bennett LS, Mullins R, et al. Which derivative from
overnight oximetry best predicts symptomatic response to
nasal continuous positive airway pressure in patients with
obstructive sleep apnea? Respir Med 2000; 94:895– 899
9 Jaeschke R, Guyatt GH, Sackett DL. Users’ guides to the
medical literature, III: How to use an article about a diagnostic test B; What are the results and will they help me in
caring for my patients? The Evidence-Based Medicine Working Group. JAMA 1994; 271:703–707
10 Olson LG, Ambrogetti A, Gyulay SG. Prediction of sleepdisordered breathing by unattended overnight oximetry. J
Sleep Res 1999; 8:51–55
11 Vazquez J, Tsai WH, Flemons WW, et al. Automated analysis
of digital oximetry in the diagnosis of obstructive sleep apnea.
Thorax 2000; 55:302–307
12 Rechtschaffen A, Kales A. A manual of standardized technology, techniques and scoring system for sleep stages of human
subjects. Los Angeles, CA: Brain Information Service, Brain
Information Institute, University of California, 1968
13 The Atlas Task Force. EEG arousals: scoring rules and
examples: a preliminary report from the Sleep Disorders Task
Force of the American Sleep Disorders Association. Sleep
1992; 15:173–184
14 Taha BH, Dempsey JA, Weber SM, et al. Automated detection and classification of sleep-disordered breathing from
conventional polysomnography data. Sleep 1997; 20:991–
1001
15 Friedman JH. Multivariate adaptive regression splines (with
discussion). Ann Stat 1991; 19:1–141
16 Breiman L. The heuristics of instability in model selection.
Ann Stat 1996; 24:2350 –2383
17 Hanley JA, McNeil BJ. The meaning and use of the area
under the receiver operating characteristics (ROC) curve.
Radiology 1982; 143:29 –36
18 El-Solh AA, Grant BJB. A comparison of severity of illness
www.chestjournal.org
Downloaded From: http://journal.publications.chestnet.org/ on 10/21/2014
19
20
21
22
23
24
25
26
27
28
29
30
31
32
scoring systems for critically ill obstetric patients. Chest 1996;
110:1299 –1304
El-Solh AA, Ten-Brock E, Shucard DW, et al. Validity of
neural network in sleep apnea. Sleep 1999; 22:105–111
Flemons WW, Whitelaw WA, Brant R, et al. Likelihood ratios
for a sleep apnea clinical prediction rule. Am J Respir Crit
Care Med 1994; 150:1279 –1285
Nieto FJ, Young TB, Lind BK, et al. Association of sleepdisordered breathing, sleep-apnea, and hypertension in a
large community-based study. Sleep Heart Health Study.
JAMA 2000; 283:1829 –1836
Peppard PE, Young T, Palta M, et al. Prospective study of the
association between sleep-disordered breathing and hypertension. N Engl J Med 2000; 342:1378 –1384
Shahar E, Whitney CW, Redline S, et al. Sleep-disordered
breathing and cardiovascular disease: cross-sectional results
of the sleep heart health study. Am J Respir Crit Care Med
2001; 163:19 –25
Redline S, Adams N, Strauss ME, et al. Improvement of mild
sleep-disordered breathing with CPAP compared with conservative therapy. Am J Respir Crit Care Med 1998; 157:858 –
865
Engleman HM, Kingshott RN, Wraith PK, et al. Randomized
placebo-controlled crossover trial of continuous positive airway pressure for mild sleep/apnea hypopnea syndrome. Am J
Respir Crit Care Med 1999; 159:461– 467
Loube DI, Gay PC, Strohl KP, et al. Indications for positive
airway pressure treatment of adult obstructive sleep apnea
patients: a consensus statement. Chest 1999; 115:863– 866
Barbe F, Mayoralas LR, Duran J, et al. Treatment with
continuous positive airway pressure is not effective in patients
with sleep apnea but no daytime sleepiness. Ann Intern Med
2001; 134:1015–1023
Tsai WH, Flemons WW, Whitelaw WA, et al. A comparison
of apnea-hypopnea indices derived from different definitions
of hypopnea. Am J Respir Crit Care Med 1999; 159:43– 48
Redline S, Kapur VK, Sanders MH, et al. Effects of varying
approaches for identifying respiratory disturbances on sleep
apnea assessment. Am J Respir Crit Care Med 2000; 161:
369 –374
Guilleminault C, Stoohs R, Clerk A, et al. A cause of excessive
daytime sleepiness: the upper airway resistance syndrome.
Chest 1993; 104:781–787
Douglas NJ. Upper airway resistance syndrome is not a
distinct syndrome. Am J Respir Crit Care Med 2000; 161:
1413–1416
Guilleminault C, Kim YD, Palombini L, et al. Upper airway
resistance syndrome and its treatment. Sleep 2000; 23(suppl
4):S197–S200
CHEST / 124 / 5 / NOVEMBER, 2003
1701


© Copyright 2026