
physical activity and sedentary behaviour in association with
LIKES – Research Reports on Sport and Health 292
PHYSICAL ACTIVITY AND SEDENTARY
BEHAVIOUR IN ASSOCIATION WITH ACADEMIC
PERFORMANCE AND COGNITIVE FUNCTIONS
IN SCHOOL-AGED CHILDREN
HEIDI SYVÄOJA
Academic dissertation to be publicly discussed, by permission of the
Faculty of Social Sciences of the University of Jyväskylä,
in the Seminarium S212, on November 15th, 2014, at 12 noon
LIKES – Research Center for Sport and Health Sciences
Jyväskylä 2014
University of Jyväskylä
Faculty of Social Sciences
Department of Psychology
Author’s address
Heidi Syväoja
LIKES – Research Center for Sport and Health Sciences
Viitaniementie 15a, FI-40720 Jyväskylä, Finland
[email protected]
Supervisors
Professor Timo Ahonen
Department of Psychology
University of Jyväskylä
Research Director Tuija Tammelin
LIKES – Research Center for Sport and Health Sciences
Doctor Marko Kantomaa
LIKES – Research Center for Sport and Health Sciences
Imperial College London, UK
Reviewers
Professor Charles H. Hillman
Department of Kinesiology and Community Health
University of Illinois, Urbana-Champaign, Illinois
Professor Urho Kujala
Department of Health Sciences
University of Jyväskylä
Opponent
Professor Charles H. Hillman
Department of Kinesiology and Community Health
University of Illinois, Urbana-Champaign, Illinois
LIKES – Research Reports on Sport and Health 292
ISBN | ISSN (print)
978-951-790-367-7 | 0357-2498
ISBN | ISSN (pdf)
987-951-790-368-4 | 2342-4788
Editor
Tuija Tammelin
Distribution
LIKES – Research Center for Sport and Health Sciences
Viitaniementie 15a, 40720 Jyväskylä, Finland
Copyright © 2014, Heidi Syväoja & LIKES – Research Center for Sport and Health Sciences
Printing
Grano, Jyväskylä
ABSTRACT
Syväoja, Heidi
Physical activity and sedentary behaviour in association with academic performance and
cognitive functions in school-aged children
LIKES – Research Reports on Sport and Health 292
Jyväskylä: LIKES – Research Center for Sport and Health Sciences, 2014.
In addition to physical health benefits, physical activity may enhance children’s cognitive
and academic performance. Excessive sedentary behaviour, in turn, may have harmful effects on cognitive functions and academic achievement in children and adolescents. The
purpose of this study was to determine the associations of physical activity and sedentary
behaviour with academic achievement and cognitive functions in school-aged children. In
addition, this study aimed to evaluate the internal consistency and one-year stability of the
seven tests of computerized neuropsychological test battery used to assess children’s cognitive functions.
Two hundred seventy-seven children from five schools in the Jyväskylä school district
in Finland (58% of the 475 eligible students; mean age 12.2 years; 56% girls) participated
in the study in the spring of 2011. Children’s physical activity and sedentary behaviour were
self-reported and measured objectively using accelerometers. Academic achievement
scores (teacher-rated grade point averages) were provided by the education services of the
city of Jyväskylä. Cognitive functions were evaluated with Cambridge Neuropsychological
Test Automated Battery (CANTAB) using two tests for visual memory, three test for executive functions and two tests for attention. During spring 2012, the follow-up measurements
were conducted among 74 children.
Self-reported physical activity had an inverse curvilinear association with academic
achievement, and total screen time had a linear negative association with academic achievement, whereas objectively measured physical activity or sedentary time had no association
with academic achievement. High levels of objectively measured physical activity were associated with good performance in attentional reaction time test. High levels of objectively
measured sedentary time was associated with good performance in sustained attention test.
Objectively measured physical activity or sedentary time had no association with other domains of cognitive functioning. Self-reported physical activity, total screen time or TV viewing had no association with assessed cognitive functions. High self-reported time spent in
video game play and computer use was associated with poor performance in the tests measuring visuospatial working memory and shifting and flexibility of attention, respectively.
The one-year stability of most cognitive tests was moderate-to-good, but the internal consistency was below an acceptable level for most of the tests, highlighting the need to confirm
the psychometric characteristics of the computerized tests among target populations.
The results of this study showed that physical activity was positively – and screen
time negatively – associated with academic achievement and certain cognitive functions in
children. In addition, the positive association with objectively measured sedentary time and
sustained attention shows that sedentary time also includes activities that may benefit certain cognitive functions. The results highlight the importance of promoting a physically active lifestyle.
Keywords: Physical activity, sedentary behaviour, academic achievement, cognitive functions, internal consistency, stability, children.
TIIVISTELMÄ
Syväoja, Heidi
Liikunnan ja liikkumattomuuden yhteydet lasten kognitiiviseen toimintaan ja koulumenestykseen
Liikunnan ja kansanterveyden julkaisuja 292
Jyväskylä: LIKES-tutkimuskeskus, 2014.
Liikunta saattaa terveyshyötyjensä lisäksi vaikuttaa myönteisesti myös lasten kognitiiviseen ja akateemiseen suoriutumiseen. Liiallinen ruutuaika voi puolestaan heikentää lasten
ja nuorten kognitiivista toimintaa ja koulumenestystä. Tämän tutkimuksen tarkoituksena
oli selvittää liikunnan ja liikkumattomuuden yhteyksiä koulumenestykseen ja kognitiiviseen toimintaan kouluikäisillä lapsilla. Lisäksi selvitettiin lasten kognitiivisten toimintojen
mittaamiseen käytetyn neuropsykologisen testipatteriston seitsemän eri testin luotettavuutta ja pysyvyyttä.
Tutkimukseen osallistui 277 lasta viidestä eri Jyväskylän alueen koulusta (58 prosenttia kutsutuista; keski-ikä 12,2 vuotta; 56 prosenttia tyttöjä) keväällä 2011. Lapset täyttivät liikuntaa ja ruutuaikaa koskevan kyselyn. Liikunnan ja liikkumattoman ajan määrää
mitattiin myös objektiivisesti kiihtyvyysanturilla. Lasten koulumenestystiedot (todistuksen
arvosanat) kerättiin Jyväskylän kaupungin opintorekisteristä. Kognitiivisia toimintoja mitattiin tietokonepohjaisella CANTAB-testipatteristolla (Cambridge Neuropsychological Test
Automated Battery), johon valittiin kaksi testiä mittaamaan muistia, kolme testiä mittaamaan toiminnanohjausta ja kaksi testiä mittaamaan tarkkaavaisuutta. Osa lapsista (n=74)
osallistui seurantamittauksiin keväällä 2012.
Itseraportoitu liikunta oli myönteisesti ja ruutuaika käänteisesti yhteydessä koulumenestykseen, kun taas objektiivisesti mitattu liikunta ja liikkumaton aika eivät olleet yhteydessä koulumenestykseen. Runsas objektiivisesti mitattu liikunta oli yhteydessä parempaan reaktioaikaan tarkkaavaisuustestissä. Runsas objektiivisesti mitattu liikkumaton aika
oli yhteydessä parempaan pitkäkestoiseen tarkkaavaisuuteen. Objektiivisesti mitattu liikunta ja liikkumaton aika eivät olleet yhteydessä muihin mitattuihin kognitiivisen toiminnan osa-alueisiin. Runsas itseraportoitu videopelien peluu oli yhteydessä heikompaan suoriutumiseen työmuistitehtävässä ja tietokoneen käyttö heikompaan suoriutumiseen tarkkaavaisuuden joustavuutta mittaavassa testissä. Itseraportoitu liikunta, kokonaisruutuaika
tai television katselu eivät olleet yhteydessä mitattuihin kognitiivisen toiminnan osa-alueisiin. Kognitiivisten testien mittaustulosten pysyvyys vuoden välein mitattuna vaihteli kohtalaisesta hyvään, kun taas eri testien sisäinen konsistenssi oli suhteellisen heikko suurimmassa osassa testejä, minkä vuoksi tietokonepohjaisten testipatteristojen psykometriset
ominaisuudet tulisi tarkistaa aina kohdejoukossa.
Tulosten mukaan liikunta on myönteisesti ja ruutuaika käänteisesti yhteydessä koulumenestykseen ja tiettyihin kognitiivisen toiminnan osa-alueisiin. Kuitenkaan kaikki liikkumattomuus ei ole samanarvoista kognition kannalta, vaan osa liikkumattomasta ajasta
saattaa sisältää toimintoja, jotka ovat kognition kannalta hyödyllisiä. Tutkimus antaa tukea
liikunnallisen elämäntavan edistämiseen koulumenestyksen ja kognitiivisen toiminnan näkökulmasta.
Avainsanat: Liikunta, liikkumattomuus, koulumenestys, kognitiivinen toiminta, luotettavuus, pysyvyys, lapset.
No sensible decision can be made any longer without taking into
account not only the world as it is but also the world as it will be.
-Isaac Asimov
ACKNOWLEDGEMENTS
This study was carried out at the LIKES – Research Center for Sport and Health Sciences, Jyväskylä, and at the Department of Psychology, University of Jyväskylä between 2011 and 2014. I would like to express my sincere thanks and appreciation
to all those who have contributed to or otherwise participated in this work.
I wish to express my deepest gratitude to my three indispensable supervisors:
Professor Timo Ahonen, PhD, from the Department of Psychology, University of
Jyväskylä, for his wisdom, encouragement, and warm support throughout the whole
project; Research Director Tuija Tammelin, PhD, from the LIKES Research Center,
for her unending enthusiasm and the way she trusted me and introduced me to the
scientific world; Doctor Marko Kantomaa, PhD, from the LIKES Research Center and
Department of Epidemiology and Biostatistics, MRC–HPA Centre for Environment
and Health, Imperial College London, UK, for his positive attitude, guidance and help
whenever I needed it. I have been privileged to work with this valuable team.
I sincerely thank Professor Charles H. Hillman, PhD, from Department of Kinesiology and Community Health, University of Illinois, Urbana-Champaign, Illinois,
and Professor Urho Kujala, PhD, from the Department of Health Sciences, University
of Jyväskylä, the official reviewers of this doctoral thesis, for their constructive criticism and valuable comments that have improved the quality of the thesis.
I also wish to thank other co-authors for their valuable contributions to this
work: Professor Asko Tolvanen, PhD, from the Department of Psychology, University of Jyväskylä, for his full professionalism and significant guidance in the area of
statistical approaches. Sincere thanks to Pekka Räsänen, Lic. in psychology, clinical
neuropsychologist, Niilo Mäki Institute, for valuable comments and important discussions about the neuropsychological testing. I owe my warmest gratitude to Anna
Kankaanpää and Harto Hakonen, from the LIKES Research Center, for their patient
assistance and priceless help in the field of statistics and data analysis.
I want to express warm thanks to Virpi Inkinen, Kirsti Siekkinen and Janne
Kulmala, from the LIKES Research Center, for their contribution and commitment to
data collection. Many thanks also go to Annaleena Aira, Martta Walker, and Maija
Mörsky, from the LIKES Research Center, for their help in the area of informing.
I wish to thank the director Eino Havas and the staff of the LIKES – Research
Center for Sport and Health Sciences, Jyväskylä, for creating a unique working environment. Special thanks go to my colleagues, Katariina Kämppi and Jaana Kari, for
sharing the thoughts and moods every day in the office.
I am very grateful to all my friends and relatives, especially to Hanna-Kaisa,
Eveliina and girls in our dance team, for giving me something else to think about and
for sharing fun and not always so fun moments during these years.
Finally, I express my feeling of thankfulness and appreciation to my dear parents, Ritva and Antti, for their unconditional love and unstinting support throughout
every step of my life. I wish to thank my dear sisters, Henna and Henni, with all my
heart, for sharing important moments in my life, and for helping me to overcome
setbacks. I owe my love and deepest gratitude to Janne for giving me his unfailing
love, sympathy, and support. I love you all!
Jyväskylä 1.11. 2014
Heidi Syväoja
This study was financially supported by the Finnish Ministry of Education and
Culture and the Research Programme on the Future of Learning, Knowledge and
Skills (TULOS), Academy of Finland (grant 273971).
LIST OF ORIGINAL PUBLICATIONS
The thesis is based on the following original publications, which are referred to in
the text by their Roman numerals.
I
Syväoja, H.J., Kantomaa, M.T., Ahonen, T., Hakonen, H., Kankaanpää, A.
& Tammelin, T.H. 2013. Physical activity, sedentary behavior, and academic performance in Finnish children. Medicine and Science in Sports
and Exercise 45 (11), 2098–2104.
II
Syväoja, H.J., Tammelin, T.H., Ahonen, T., Räsänen, P., Tolvanen, A.,
Kankaanpää, A. & Kantomaa, M.T. Internal consistency and stability of
the CANTAB neuropsychological test battery in children. Submitted
manuscript.
III
Syväoja, H.J., Tammelin, T.H., Ahonen, T., Kankaanpää, A. & Kantomaa,
M.T. 2014. The Associations of Objectively Measured Physical Activity
and Sedentary Time with Cognitive Functions in School-aged Children.
PloS one 9 (7): e103559.
ABBREVIATIONS
ADHD
B
BDNF
Beta
CANTAB
CFI
CI
CRF
FIML
GPA
HBSC
HRR
ICC
IED
IRT
MET
MLR
MPA
MVPA
OR
p
PA
PACER
PE
PRM
RCT
RMSEA
RTI
RVP
SD
SE
SOC
SRM
SRMR
SSP
TLI
UK
US
VPA
WHO
∆R2
attention deficit hyperactivity disorder
unstandardized coefficient (in Table 5), estimate (in Table 6)
brain-derived neurotrophic factor
standardized coefficient
Cambridge Neuropsychological Test Automated Battery
comparative fit index
confidence interval
cardiorespiratory fitness
full information maximum likelihood
grade point average
Health Behaviour in School-aged Children
heart rate reserve
intra-class correlations
Intra-Extra Dimensional Set Shift
item response theory
metabolic equivalent
robust standard errors
moderate physical activity
moderate to vigorous physical activity
odds ratio
p-value
physical activity
Progressive Aerobic Cardiovascular Endurance Run
physical education
Pattern Recognition Memory
randomized controlled trial
root mean square error of approximation
Reaction Time
Rapid Visual Information Processing
standard deviation (in Tables 1–3)
standard error (in Tables 5–6)
Stockings of Cambridge
Spatial Recognition Memory
standardized root-mean-square residual
Spatial Span
Tucker–Lewis Index
United Kingdom
United States
vigorous physical activity
World Health Organization
change in R square
CONTENTS
ABSTRACT
TIIVISTELMÄ
ACKNOWLEDGEMENTS
LIST OF ORIGINAL PUBLICATIONS
ABBREVIATIONS
CONTENTS
1
INTRODUCTION ......................................................................................................................13
1.1 Physical activity and sedentary behaviour among school-aged
children ....................................................................................................... 14
1.2 Academic achievement and cognitive functions ..................................... 16
1.2.1 Academic achievement..................................................................... 16
1.2.2 Cognitive functions ........................................................................... 18
1.2.3 Assessments of cognitive functions ................................................ 19
1.3 Associations of physical activity, academic achievement and cognitive
functions ..................................................................................................... 20
1.3.1 Physical activity in association with academic achievement........ 21
1.3.2 Physical activity in association with cognitive functions .............. 24
1.4 Associations of sedentary behaviour, academic performance and
cognitive functions ..................................................................................... 27
1.4.1 Sedentary behaviour in association with academic achievement 28
1.4.2 Sedentary behaviour in association with cognitive functions ...... 30
1.5 Summary of literature ............................................................................... 31
2
AIMS OF THE STUDY .............................................................................................................33
3
MATERIAL AND METHODS ................................................................................................35
3.1 Study population and data collection ....................................................... 35
3.2 Measurements ............................................................................................ 39
3.2.1 Self-reported physical activity and screen time............................. 39
3.2.2 Objective measures of physical activity and sedentary time ........ 39
3.2.3 Academic performance .................................................................... 40
3.2.4 Cognitive functions ........................................................................... 40
3.2.4.1 Visual memory ................................................................................. 41
3.2.4.2 Executive function ......................................................................... 41
3.2.4.3 Attention ............................................................................. 41
3.2.5 Potential confounders ...................................................................... 42
3.3 Ethics statement ......................................................................................... 42
3.4 Analytical strategies................................................................................... 42
3.4.1 Study I ................................................................................................ 42
3.4.2 Study II............................................................................................... 43
3.4.3 Study III ............................................................................................. 44
4
AN OVERVIEW AND THE MAIN RESULTS OF THE ORIGINAL STUDIES...........45
4.1 Study I: Physical activity, sedentary behaviour, and academic
performance in Finnish children .............................................................. 45
4.2 Study II: Internal consistency and stability of the CANTAB
neuropsychological test battery in children ............................................ 48
4.3 Study III: The associations of objectively measured physical activity and
sedentary time with cognitive functions in school-aged children ......... 52
5
DISCUSSION ..............................................................................................................................55
5.1 Physical activity, academic achievement and cognitive functions ........ 55
5.1.1 Possible mechanisms explaining the associations between
physical activity, academic achievement and cognitive
functions ............................................................................................ 57
5.1.2 Differences between objectively measured and self-reported
physical activity in terms of their association with academic
achievement and cognitive functions ............................................. 57
5.2 Sedentary behaviour, academic achievement and cognitive functions. 58
5.3 Methodological considerations ................................................................. 60
5.3.1 General strengths and limitations ................................................... 60
5.3.2 Measurement of physical activity and sedentary behaviour ........ 61
5.3.3 Measurement of academic achievement ........................................ 61
5.3.4 Measurement of cognitive functions – Reliability and stability of
cognitive test battery (CANTAB) ..................................................... 62
6
CONCLUSIONS..........................................................................................................................65
6.1 Summary and main conclusions ............................................................... 65
6.2 Implications and future directions ........................................................... 66
REFERENCES…………………………………………………………………………………………………...69
APPENDICES.…………………………………………………………………………………...………………89
ORIGINAL PUBLICATIONS ..……………………………………………………………………………113
1
INTRODUCTION
Along with numerous societal changes over the past few decades, our lifestyle has
become increasingly sedentary. This phenomenon is not only found among adults,
but also in children (Nelson et al. 2006), who on average spend 4–8 hours per day
being sedentary (Pate et al. 2011). In addition, only one-third of children are
sufficiently active according to current physical activity recommendations (Ekelund,
Tomkinson & Armstrong 2011). In Finland, about one half of primary school pupils
and only one sixth of lower secondary school pupils fulfill the minimum
recommendation for physical activity (Tammelin, Laine & Turpeinen 2013).
Lack of physical activity is seen as one of the increasing risk factors for lifestyle
diseases: physical inactivity is associated with higher levels of obesity, metabolic
and cardiovascular risk factors, depression symptoms, and lower physical fitness in
children, whereas adequate physical activity may benefit all of these risk factors
(Mountjoy et al. 2011, Tremblay et al. 2011b, Ekelund et al. 2012). Children’s
physical fitness has decreased and obesity has increased globally during the past
couple decades (Tomkinson & Olds 2007, Lakshman, Elks & Ong 2012), including in
Finland (Kautiainen et al. 2002, Huotari et al. 2010).
Along with convincing research evidence on the significance of regular
physical activity for health, the idea that physical activity may enhance and support
learning has also emerged in recent years. There is evidence that physical activity
enhances cognitive functions, especially executive functions in the elderly (Hillman,
Erickson & Kramer 2008, Guiney & Machado 2013). In addition, there is a recent
increase in research suggesting that physical activity benefits children’s cognitive
functions and academic performance (Donnelly et al. 2009, Davis et al. 2011, Fisher
et al. 2011, Kamijo et al. 2011, Chaddock-Heyman et al. 2013, Ardoy et al. 2014). In
turn, excessive sedentary behaviour, especially screen-based sedentary behaviour,
has been linked to poorer academic performance (Sharif & Sargent 2006, Mößle et
al. 2010) and elevated risk of attention and learning difficulties (Swing et al. 2010,
Weis & Cerankosky 2010).
Physical activity may have an underestimated and underused potential to
support learning. However, evidence of the favourable effects of physical activity
and the harmful effects of sedentary behaviour on cognitive functions and academic
achievement in healthy children and adolescents is still inconsistent and based on
scarce research data. Moreover, most of the previous studies have used selfreported measures of physical activity and sedentary behaviour, with only a few
using objectively measured physical activity or sedentary time in connection with
educational outcomes and cognitive functions.
As the rates of childhood physical inactivity are increasing worldwide,
systematic research on the effects of physical activity and sedentary life on cognitive
functions and academic performance is needed for both practitioners and policy
makers to promote learning, education and health. This study aims to determine
how subjectively and objectively measured physical activity and sedentary
behaviour are associated with academic performance and cognitive functions in
elementary school-aged children.
13
1.1 Physical activity and sedentary behaviour among schoolaged children
According to traditional definition, physical activity is any bodily movement, which
is produced by the contraction of skeletal muscle and increases energy expenditure
above a basal level (Caspersen, Powell & Christenson 1985). Physical activity can be
classified according to intensity using metabolic equivalent (MET) as a reference.
One MET refers to the rate of energy expenditure while sitting at rest (US Department of Health and Human Services & US Department of Health and Human Services
2008). Therefore, moderate to vigorous physical activity (MVPA) is activity that increases the rest energy expenditure threefold (≥3 METs) (World Health Organization 2010), while small-to-large increases in breathing and heart-rate are caused by
such activities as brisk walking, bicycling, running and swimming (US Department
of Health and Human Services & US Department of Health and Human Services
2008).
In addition to energy expenditure, physical activity can be defined as biocultural behaviour: it occurs in many forms and contexts that are strongly influenced
by culture (Malina 2001). Exercise is a subcategory of physical activity. It is planned,
structured and repetitive bodily movement that aims to improve or maintain one or
more components of physical fitness (Caspersen, Powell & Christenson 1985).
Sedentary behaviour can be defined as any waking behaviour requiring low
levels of energy expenditure (≤ 1.5 METs) while in a sitting or reclining posture
(Barnes et al. 2012). Sedentary behaviour includes many different activities, such
as watching television, playing video games, computer use, reading, desk-based
work, doing homework, and sitting while socializing. Sedentary behaviour and physical activity are independent constructs, as a person can have a great amount of sedentary time, but still meet the physical activity guidelines (Pate et al. 2011, Pate,
O'Neill & Lobelo 2008).
Physical activity guidelines for health benefits state that children (aged 5–11
years) and youth (aged 12–17 years) should accumulate at least 60 minutes of MVPA
per day, including vigorous-intensity activities at least three days per week and activities that strengthen muscle and bone at least three days per week (World Health
Organization 2010, Tremblay et al. 2011c). In addition, recent American guidelines
for physical activity during school day, state that children should have opportunity
to accomplish more than half of the recommended 60 minutes per day of MVPA during regular school hours provided by school district, administrators, teachers and
parents (Kohl & Cook 2013). Furthermore, Canadian guidelines on sedentary behaviour recommend that children and youth should minimize the time spent being sedentary each day and especially limit recreational screen time to no more than two
hours per day (Tremblay et al. 2011a). Finnish physical activity recommendations
for school-aged children are consonant with these international guidelines (Tammelin & Karvinen 2008). As indicated before, the majority of children and youth
both internationally and nationally do not meet these recommendations (Ekelund,
Tomkinson & Armstrong 2011, Salmon et al. 2011). Exacerbating these issues, physical activity continues to decrease and sedentary time continues to increase from
childhood to adolescence (Troiano et al. 2008).
14
Traditionally, physical activity and sedentary behaviour have been measured
subjectively with self-reported questionnaires or diaries. For children and youth,
physical activity questionnaires typically assess specific types of physical activity,
but also recreational physical activity, mostly expressed as duration of physical activity, time spent in MVPA or estimates of energy expenditure (Ekelund, Tomkinson
& Armstrong 2011). Questionnaires have been accepted as being capable of ranking
inter-individual differences in physical activity and demonstrating correlations between physical activity and other variables (Strath et al. 2013, Shephard 2014).
However, one of the main weaknesses of self-reports is accuracy, especially among
children (Ekelund, Tomkinson & Armstrong 2011). Children may overestimate their
physical activity levels, compared to objectively measured physical activity (Corder
et al. 2010).
Questionnaires used to evaluate sedentary behaviour have usually assessed
the time spent in screen-based sedentary behaviour, especially time spent watching
television (Tremblay et al. 2011b). In addition, non-screen-based sedentary behaviour such as educational sedentary behaviour, sedentary hobbies and social sedentary behaviours have been measured in self-reports (Pate et al. 2011). Recollection
is also a potential issue for self-reports of sedentary behaviour. However, according
to Pate et al. (2011), the estimated times spent in sedentary behaviour are similar
between self-reports and objectively measured studies.
Objective measurements of physical activity and sedentary time have improved the ability to accurately determine the volume, intensity, duration and frequency of children’s physical activity (Ekelund, Tomkinson & Armstrong 2011,
Strath et al. 2013), eliminating bias caused by issues of recollection and social desirability and overcoming challenges caused by language and literacy difficulties
(Evenson et al. 2006). Accelerometers are the most commonly used tools for objectively measuring physical activity and sedentary time (Ekelund, Tomkinson & Armstrong 2011).
Accelerometers record acceleration and deceleration of the body. Raw accelerometer data is often converted into other units, such as activity counts (Strath et
al. 2013). Activity counts can be used to determine the intensity of activity by using
thresholds, which have been developed by calibrating activity counts with measurements of oxygen consumption. (Evenson et al. 2006). There is ongoing debate about
the thresholds for different intensity categories (sedentary, light, moderate or vigorous) and how the lack of consensus influences interpretation of data (Ekelund,
Tomkinson & Armstrong 2011, Strath et al. 2013). In addition, accelerometers cannot track all activities, such as cycling or actions that require lifting a load (Strath et
al. 2013); this is one weakness of accelerometers.
Usually, both questionnaires and objective measurements assess the total
amount (frequency, duration and intensity) of physical activity and sedentary behaviour, not content or context. In this study, both self-report and accelerometer
measurements were used to assess the amount of children’s physical activity and
sedentary behaviour when determining the relationship of physical activity and sedentary behaviour with academic performance and cognitive functions.
15
1.2 Academic achievement and cognitive functions
1.2.1 Academic achievement
Learning may be seen as a life-sustaining and an inevitable part of human growth
and development. It is an active and interactive process, which results in changes in
behaviour, but also in the skills, knowledge and emotional reactions underlying behaviour. Learning occurs in a specific cultural and social context. Many theories have
been advanced over the years to understand how people learn. The social theory of
learning was chosen to form the basis of this thesis. According to the social theory
of learning, learning is seen as social participation (Bandura & McClelland 1977).
This participation shapes who we are, what we do and how we interpret what we
do (Figure 1) (Wenger 1998, 3–11, Wenger 2000).
Learning as
doing
Learning as
belonging
Community
Practice
Learning
Identity
Meaning
Learning as experience
FIGURE 1.
Learning as
becoming
Components of the social theory of learning. (Figure modified after
Wenger 1998, 5).
At schools, learning is the centre of action. Students’ learning is evaluated, monitored and supported. Academic achievement is one way of assessing how well children have achieved their educational goals. The purpose of assessment is to support
and enhance learning and teaching. Internationally, different standardized tests –
including the disciplines of reading, spelling, arithmetic and science – are used to
measure academic achievement, and grades given by teachers at the end of the term
are also used. (Rasmussen & Laumann 2013).
In Finland, national standardized tests are not in use in primary or secondary
schools. Assessment is based on teacher-rated academic achievement scores, which
describe the level of performance in relation to the objectives outlined by the National Core Curriculum for Basic Education (National core curriculum for basic education 2004). Objectives not only include skills and knowledge, but also behaviour
and students’ working skills, such as the ability to plan, carry out and evaluate their
16
own work. Children’s working abilities make up part of the subject-based assessment, but behaviour is assessed separately. Teachers’ evaluate children’s academic
achievements scores independently. (Ouakrim-Soivio 2013).
There is ongoing debate about the best possible method for grading, which is
both comparable and commensurable. Grading that strongly depends on standardized achievement tests enables uniform evaluation and comparison between students. Standardized tests are practical, when measuring large group of children
quickly, efficiently and affordably. (Ouakrim-Soivio 2013). However, it has been criticized for directing students to rehearse response techniques and for excluding incorrect responses rather than supporting actual knowledge and skills (Koretz &
Hamilton 2006, Hamilton, Stecher & Yuan 2012). In addition, standardized tests
have been criticized for being unable to measure children’s learning comprehensively enough, for example they are not suitable for estimating children’s ability to
produce own stories (Ansley 1997). Grading, which is administered by the teacher
and based on objectives outlined beforehand, enables a more versatile evaluation of
children’s learning. However, if the objectives of the national curriculum for each
grade are not carefully followed in the process of evaluation, a teacher’s independent role as evaluator may result in discrepancies in grades between students from
different classes or schools with the same level of competence. Inequity and bias in
grading weakens the opportunity to directly compare children’s academic achievements. (Ouakrim-Soivio 2013).
From a psychological perspective, there are a lot of factors that influence and
are associated with academic achievement (Winne & Nesbit 2010). The classic metaanalytic study by Wang, Haertel and Walberg (1994) showed that factors that directly influence children and children’s close social interactions had a greater impact on academic achievement than indirect influences. Children’s metacognitive
and cognitive skills, classroom management, home environment and parental support, and social interactions between students and teachers had the greatest effect
on academic achievement (Wang, Haertel & Walberg 1994).
Cognitive processes, especially executive functions (defined later) (Lu et al.
2011, McClelland & Cameron 2011, Weber et al. 2013), have been shown to be
strong predictors of academic achievement in elementary school. Motivation, and
ultimately, achievement are influenced by people’s beliefs about their capability to
do different tasks, but also the reasons for doing them (Wigfield & Cambria 2010).
When individuals have high self-efficacy beliefs (strong beliefs about their own capabilities) (Caprara et al. 2011, Weber et al. 2013), they are more likely to engage in
activities, persist in spite of difficulties, and succeed (Wigfield & Cambria 2010).
Reasons for performing tasks – such as achievement values, goal orientations
and interest, and intrinsic value – are also important predictors of achievement outcomes and learning (Wigfield & Cambria 2010, Weber et al. 2013). In addition, parental involvement in their children’s education (Karbach et al. 2013) also plays an
important role in predicting children’s academic achievement.
This study focused on teacher-rated academic scores, on the basis of which
grade point averages (GPA) were calculated in order to represent children’s overall
academic performance.
17
1.2.2 Cognitive functions
From the neurocognitive perspective, learning is the reconstruction of neuronal networks. These neuronal networks form the biological foundation of cognition, intelligence and learning (Anderson 1997). Intelligence can be defined as an individual’s
comprehensive cognitive ability to reason, plan, solve problems, think abstractly,
understand complex ideas, learn quickly and learn from experience (Neisser et al.
1996, Nisbett et al. 2012). In addition, several specific concepts of cognition have
been defined such as executive functions, memory and attention.
Executive functions (also called executive control, the central executive, or
cognitive control) are the collection of higher-order cognitive processes that control
goal-directed actions. Essential for purposeful behaviour, executive functions regulate cognition, emotion and action. Three core executive functions are inhibition,
working memory and mental flexibility. (Diamond 2013). Inhibitory control (inhibition) includes selective attention and the inhibition of inappropriate or interfering
responses. In other words, inhibition enables appropriate action by controlling attention, behaviour, thoughts, and emotions to suppress dominant, automatic, or prepotent responses. (Best, Miller & Jones 2009, Diamond 2013). Working memory is
defined as the ability to actively retain information in one’s mind and mentally manipulate it for brief periods of time. Working memory can be considered as a threecomponent system involving a control system of limited attentional capacity (a part
of executive functions) and two assisting temporary storage systems (Baddeley &
Hitch 1974, Baddeley 2012, Diamond 2013). Mental flexibility (shifting), in turn, is
defined as the ability to change perspectives and shift between mental states, operations or tasks. These core functions are tightly linked together, and higher executive functions like reasoning, problem-solving and planning are built from these
core functions. (Best, Miller & Jones 2009, Diamond 2013).
According to one definition, memory is a lasting representation reflected in
thought, experience, or behaviour. It is not a single unitary system, but consists of
subsystems called working memory, short-term and long-term memory, which can
also be divided into different components. Short-term memory refers to simple temporary storage of information, whereas working memory points to active manipulation of shortly maintained information (Baddeley 2012). As stated above, working
memory consists of a supervisory system, which uses two short-term memory systems: one concerning speech and sound (phonological loop) and the other visuospatial information (visuospatial sketchpad) (Baddeley & Hitch 1974, Baddeley 2012,
Diamond 2013). Long-term memory includes stored memories and learned
knowledge and skills. It can be divided into explicit memory, which includes perceptual, episodic and semantic memories, and implicit memory, which includes implicit
knowledge, primed biases and goals as well as highly practised habits and motor
skills (Jeneson & Squire 2011, Baddeley 2012).
Attention can be divided into three sub-systems: alerting, orienting and the
executive network. Alerting involves achieving and maintaining optimal vigilance
during a task, while orienting concerns the ability to prioritize sensory input by selecting a modality or location. The executive network, in turn, is active when processing targets, conflicts and errors (Petersen & Posner 2012, Posner & Rothbart
2014). Attention can be voluntary, goal-directed executive attention or spontaneous
bottom-up attention. Executive attention (also called selective or focused attention)
18
enables us to selectively attend to and focus on what we decide, as well as to suppress attention to other stimuli. Spontaneous attention, in turn, is driven by the
properties of these stimuli. Due to the selective and controlling nature of executive
attention, it can be seen as one executive function, as described above. (Diamond
2013).
Even though many cognitive tests evaluate one specific cognitive function, cognitive functioning is usually a dynamic interactive process of many different functions. For example, paying attention to sensory or internal information is directed
by selective attention, after which information becomes available for working
memory. Working memory can actively manipulate information, while inhibitory
control hinders internal and external distractions. Managing information in working
memory is determined by our goals and our existing information (in long-term
memory), and attending to selective aspects of the environment. Manipulated information is encoded into long-term memory, and learning takes place. (Baars & Gage
2010, 33–60).
From a developmental perspective, these neurocognitive functions emerge
during the early years of life. However, especially the executive functions continue
to develop throughout childhood and adolescence, due to protracted development
of the brain structures that support them. Different domains of executive functions
vary in their developmental trajectories and may not be fully functionally mature by
the age of 12 years. (Luciana & Nelson 1998, Luciana & Nelson 2002, Best & Miller
2010). The focus of this thesis is to study associations of physical activity and sedentary behaviour on visual memory, executive functions and attention. Therefore,
other domains of cognitive functions will not be discussed further.
1.2.3 Assessments of cognitive functions
Traditionally, cognitive functions have been measured with paper-and-pencil tests
to assess specific cognitive ability, for example, the Corsi Blocks test for measuring
visuospatial working memory (Milner 1971), Tower of London measuring planning
and spatial working memory (Shallice & Shallice 1982, Owen et al. 1990) and the
Wisconsin Card Sorting test for measuring mental flexibility (Heaton et al. 1993).
In recent years, the use of computer technology in neuropsychological assessments has increased worldwide, and computer-based test batteries have been used
for psychological assessments, for evaluating changes over time, and for evaluating
the effects of interventions (Lowe & Rabbitt 1998). Computer technology has made
valuable contributions to neuropsychological assessments by increasing efficiency,
ease and standardization of administration; reducing errors during scoring; and increasing accuracy of timing and response latencies (Cernich et al. 2007, Parsey &
Schmitter-Edgecombe 2013).
In this study, the Cambridge Neuropsychological Test Automated Battery
(CANTAB) was used to assess children’s cognitive functions. The CANTAB is one of
the oldest computer-based test batteries used to evaluate neurocognitive functions,
particularly in clinical trials research. CANTAB tests are mainly based on traditional
neuropsychological tests. These non-verbal tests measure visual and spatial
memory, working memory, planning, different aspects of attention, and other areas
of cognition. (Cambridge Cognition Ltd., 2006). According to previous reports, CANTAB has been found suitable for assessing cognitive functions in 4- to 90-year-old
19
individuals (Lowe & Rabbitt 1998, Luciana 2003). In addition, it has been found sensitive to cognitive deficits due to several neuropsychological and psychiatric conditions and diseases, especially in the elderly (e.g. Sahakian et al. 1993, Robbins et al.
1998, Blackwell et al. 2004, Levaux et al. 2007) but also in children (Luciana et al.
1999, Gau & Shang 2010, Rhodes et al. 2011, Fried et al. 2012).
However, earlier studies did not provide adequate information about the reliability of CANTAB tests (Luciana & Nelson 2002). Luciana (2003) reported that internal consistency coefficients for CANTAB tests were high (0.73 – 0.95) in 4–12year-old children. Furthermore, studies measuring the test-retest reliability of CANTAB have been sparse. Lowe and Rabbit (1998) reported that in an elderly adult
population, the test-retest agreement for the CANTAB tests was either moderate,
ranging from 0.70 to 0.86, or low, ranging from 0.09 to 0.68. According to Fisher et
al. (2011), intra-class correlations for CANTAB subtests, Spatial Span length, and
Working Memory errors were quite low (ICC = 0.51 – 0.59) in healthy children. However, Gau and Shang (2010) reported higher intra-class correlations for CANTAB
tests (Intra-Extra Dimensional Set Shift, Spatial Span, Spatial Working Memory,
Stockings of Cambridge), ranging from 0.55 to 0.94 in a group of 10 children with
attention deficit hyperactivity disorder (ADHD).
To our knowledge, there are no other studies that establish the internal consistency agreement or test-retest agreement for CANTAB tests in a child population
(Luciana 2003, Henry & Bettenay 2010), while the results of existing studies are, to
some extent, inconsistent.
1.3 Associations of physical activity, academic achievement
and cognitive functions
Previous studies have shown that physical activity enhances neurocognitive functions and protects against neurodegenerative diseases in the elderly (Kramer & Erickson 2007, Hillman, Erickson & Kramer 2008, Lautenschlager et al. 2008, Erickson
et al. 2011). Most typically the effects have been seen in executive functioning, related to selective attention and inhibitory control, mental flexibility and working
memory (Guiney & Machado 2013). More recently, physical activity has been linked
to better academic performance (Shephard 1997, Trost 2008, Trudeau & Shephard
2008, Trudeau & Shephard 2010, Centers for Disease Control and Prevention. 2010,
Singh et al. 2012) and enhanced cognitive functions (Sibley & Etnier 2003, Hillman,
Erickson & Kramer 2008, Hillman, Kamijo & Scudder 2011, Guiney & Machado 2013)
in children.
Earlier studies have reported that physical activity may benefit (Tuckman &
Hinkle 1986, Tremblay, Inman & Willms 2000, Dwyer et al. 2001, Coe et al. 2004,
Coe et al. 2006, Fredericks, Kokot & Krog 2006, Hillman et al. 2006, Nelson et al.
2006, Davis et al. 2007, Tremarche, Robinson & Graham 2007) or do not compromise (Low 1990, Sallis et al. 1999, Dollman, Boshoff & Dodd 2006, Yu et al. 2006,
Ahamed et al. 2007, Sigfusdottir, Kristjansson & Allegrante 2007) academic and cognitive performance, but conflicting results have also been observed (Themane et al.
2006). In addition, acute exercise during the school day has been shown to have
20
benefits on academic and cognitive performance (McNaughten & Gabbard 1993, Catering & Polak 1999, Maeda & Randall 2003). Moreover, physical fitness (Sollerhed
& Ejlertsson 1999, Kim et al. 2003, Grissom 2005, Hillman, Castelli & Buck 2005,
Castelli et al. 2007) and participation in sports (Silliker & Quirk 1997, Dexter 1999,
Lindner 1999, Stephens & Schaben 2002, Eitle 2005) has been linked to enhanced
academic achievement and cognition, but not in all studies (Schumaker, Small &
Wood 1986, Hanson & Kraus 1998, Daley & Ryan 2000, Eitle & Eitle 2002, Lindner
2002, Miller et al. 2005).
In 2010, the results of these earlier studies were synthesized and published by
the Centers for Disease Control and Prevention. A comprehensive report summarizes the scientific literature (43 articles) published between 1985 and October
2008 that concerns the associations of school-based physical activity and academic
performance (Centers for Disease Control and Prevention 2010). School-based
physical activity included physical education, physical activity during recess, classroom physical activity and extracurricular activity, while academic performance included academic achievement, academic behaviour and indicators of cognitive skills
and attitudes. According to the report, physical activity had a positive association
(50.5% of the associations summarized), no association (48% of the associations
summarized), or negative association (1.5% of the associations summarized) with
academic performance. Moreover, increased physical activity on school days was
not associated with attenuated academic performance (Centers for Disease Control
and Prevention 2010). The associations of physical activity, academic achievement
and cognitive functions observed in studies published in 2008 or later are described
in more detail below.
1.3.1 Physical activity in association with academic achievement
A few intervention studies have reported that integrated physical activity in academic lessons (Donnelly et al. 2009, Reed et al. 2010), increased physical education
(Ericsson 2008, Spitzer & Hollmann 2013, Ardoy et al. 2014) and aerobic exercise
programmes (Davis et al. 2011) benefit children’s academic achievement.
In the study of Donelly et al. (2009), academic achievement scores for reading,
spelling and math significantly improved from the baseline to three years in children
participating in the intervention, compared to control children. In addition, improvements in total academic achievement have been reported (Ardoy et al. 2014),
as well as in math (Ericsson 2008, Davis et al. 2011, Spitzer & Hollmann 2013, Ardoy
et al. 2014), mother tongue (Ericsson 2008, Spitzer & Hollmann 2013) and social
studies (Reed et al. 2010). However, in some of these studies, physical activity had
no effect on achievements of reading and language (Reed et al. 2010, Davis et al.
2011, Ardoy et al. 2014), foreign language (Spitzer & Hollmann 2013) or science
(Reed et al. 2010).
To summarize the results of these few intervention studies, increasing physical activity to the school week benefits academic achievement in certain school subjects in certain studies, but has no effect on certain subjects. These interventions
lasted for about four months with the exception of the intervention of Donelly et al.
(2009), which lasted for three years. Davis et al. (2011) speculated that a longer intervention may result in more benefit. Short-term interventions may partly explain
the somewhat diverging results.
21
The associations of physical activity and academic achievement have also been
measured by longitudinal studies. In the longitudinal study by Stevens et al. (2008),
physical activity, but not physical education, was positively associated with mathematics and reading achievement in both boys and girls. Whereas Carlson et al. (2008)
reported that girls who had the highest amount of physical education had better
math and reading achievement compared to girls with the lowest physical education
exposure, while no effect was realized for boys.
Haapala et al. (2014a) examined the association of different types of physical
activities in first grade with reading and arithmetic skills in grades 1–3. According
to the results, children who had more physical activity during recess and children
who most often commuted actively to school had better reading fluency across
grades 1–3. In addition, children who engaged in organized sports had better arithmetic skills. However, the results were slightly different when data was analysed
separately for boys and girls. Boys who had more total physical activity and most
often commuted actively to school had better reading fluency and reading comprehension. However, among girls, total physical activity was positively associated with
reading fluency and arithmetic skills only for girls whose parents had university
level education, while the association was inverse in girls whose parents were less
educated (Haapala et al. 2014a).
Booth et al. (2014), in turn, examined the associations of objectively measured
MVPA at the age of 11 with academic achievement at the age of 11, 13 and 16. MVPA
at the age of 11 predicted higher English scores in both sexes at all ages, and higher
science scores in females at age of 11 and 16. (Booth et al. 2014). Booth et al. (2014)
concluded that MVPA may have a long-term positive influence on academic performance. These results of the longitudinal studies are slightly inconsistent. The authors highlighted factors like intensity and type of physical activity or other factors
independent of physical activity such as social development, which may explain the
differences (Carlson et al. 2008, Stevens et al. 2008, Booth et al. 2014, Haapala et al.
2014a).
Cross-sectional studies determining the relationship of self-reported physical
activity and academic achievement (mostly examined by GPA) in children and adolescents have reported a positive association between physical activity and overall
academic achievement (Kristjansson et al. 2009, Vindfeld, Schnohr & Niclasen 2009,
Fox et al. 2010, Kantomaa et al. 2010, Kristjansson, Sigfusdottir & Allegrante 2010,
Edwards, Mauch & Winkelman 2011, So 2012, Kantomaa et al. 2013, Shi et al. 2013).
In addition, reported physical activity was especially associated with math performance in girls (Martínez-Gómez et al. 2012), and in boys (O'Dea & Mugridge 2012).
However, studies using objectively measured physical activity to determine
association with academic achievement have not been as unanimous. According to
Kwak et al. (2009), objectively measured vigorous physical activity was positively
associated with overall academic achievement in girls, but not in boys. In addition,
Telford et al. (2012) reported that objectively measured physical activity was associated with better writing scores, but not with reading or math scores. However, LeBlanc et al. (2012) reported that objectively measured MVPA was not associated
with performance gains in academic achievement tests in children.
The effects of acute exercise on academic achievement has also been slightly
inconsistent. Acute aerobic exercise has been shown to improve reading comprehension (Hillman, Pontifex & Themanson 2009, Duncan & Johnson 2014) and
22
spelling (Duncan & Johnson 2014), have no effect on sentence comprehension (Duncan & Johnson 2014) or spelling and arithmetic (Hillman, Pontifex & Themanson
2009), and attenuate arithmetic (Duncan & Johnson 2014). The timing of the academic testing after an acute bout of exercise may be one factor explaining these conflicting findings. According to Hillman et al. (2009), acute exercise only enhanced
reading comprehension, which was measured first, and had no effects on spelling or
arithmetic, which were assessed following reading comprehension. This suggests
that the benefits of acute exercise may subside over time.
Physical fitness has often been used as a proxy indicator of regular physical
activity, when the association of physical activity and academic achievement has
been examined. In the longitudinal study by London and Castrechini (2011), persistently fit children had higher English and math test scores compared to persistently
unfit children. Similarly, Wittberg, Northrup and Cottrell (2010) reported that students who stayed in the “healthy” fitness zone from fifth to seventh grade had significantly higher academic scores than students who stayed in the “needs improvement” zone.
According to previous cross-sectional studies, good physical fitness has been
associated with better performance in literature and math test scores (Chomitz et
al. 2009, Blom et al. 2011, Van Dusen et al. 2011). In addition, aerobic fitness in particular has had a positive association with literature and math test scores (Roberts,
Freed & McCarthy 2010, Welk et al. 2010, Wittberg et al. 2010, Davis & Cooper 2011,
Scudder et al. 2014). In the study by Edwards, Mauch and Winkelman (2011), higher
aerobic fitness was related to math scores, but not reading scores. Moreover, Padilla-Moledo et al. (2012) reported a positive association between muscular fitness
and academic achievement.
However, there are also studies reporting no associations between physical
fitness and academic achievement (Chic & Chen 2011, Wingfield et al. 2011), aerobic
fitness and academic skills (Haapala et al. 2014b, Moore et al. 2014), and muscular
fitness and math and reading scores (Edwards, Mauch & Winkelman 2011). In addition, in some studies the association between fitness and academic achievement has
been different for girls and boys. Eveland-Sayers et al. (2009) reported that aerobic
fitness was positively associated with math and reading scores only in girls, while
Kwak et al. (2009) reported that cardiovascular fitness was positively associated
with GPA only in boys.
To sum up the association between physical activity and academic achievement, it seems that children who are more physically active have better academic
achievement. However, the reports to date have generally been weak and inconsistent. Especially, there is no intervention, longitudinal, or cross-sectional studies
that have replicated the study design and confirmed the results. In addition, previous studies were conducted in various countries with varying educational systems,
which makes it difficult to compare the results. Moreover, most of the previous studies have used self-reported measurements of physical activity and academic performance; only a few have objectively measured physical activity to determine the association with educational outcomes. In conclusion, existing studies only show that
certain physical activities are associated with certain academic achievements in certain child populations.
23
1.3.2 Physical activity in association with cognitive functions
In recent intervention studies, physical activity has been reported to benefit children’s cognitive functions. Ardoy et al. (2014) reported that participating in four
high-intensity PE lessons per week improved children’s overall cognitive performance (including non-verbal and verbal abilities, abstract reasoning, spatial ability,
numerical ability and verbal reasoning), compared to two or four hours of normal
PE lessons per week. In addition, Reed et al. (2010) reported that intervention integrating physical activity into core curricula at school enhanced performance in fluid
intelligence, which is considered to illustrate general intelligence and cognitive ability. Likewise, intervention providing 45 minutes of daily physical education led to
improvements in fluid intelligence and perceptual speed (Reed et al. 2013). However, the improvements were only observed in certain sections of the fluid intelligence test and were dependent on age and gender (Reed et al. 2013).
In particular, executive functions have been reported to benefit from physical
activity interventions. Different types of interventions like physical education interventions (Fisher et al. 2011, Spitzer & Hollmann 2013, Crova et al. 2014) and schoolbased physical activity programmes (Davis et al. 2011, Chaddock-Heyman et al.
2013) led to improvements in selective attention and inhibition performance. In addition, aerobically intense physical education intervention and afterschool physical
activity programme enhancing aerobic fitness improved children’s spatial working
memory and temporal working memory, respectively (Fisher et al. 2011, Kamijo et
al. 2011). However, in Puder et al.’s (2011) study, a multidimensional physical activity programme enhancing fitness did not affect spatial working memory or selective attention. In addition, physical education programme including cognitively
challenging activities had no effect on verbal working memory (Crova et al. 2014).
Puder et al. (2011) speculated that the fairly weak reproducibility of the measures
in 5-year-old children and the lack of power may explain contradictory results.
Davis et al. (2011) reported that overweight children participating in aerobic
exercise programme had higher scores in planning scale assessing strategy generation and application, self-regulation, intentionality and utilization of knowledge, but
not in attention, simultaneous or successive sub-scales of the Cognitive Assessment
System compared to control children at post-test. They stated that only planning
scale measures executive functions, and especially, executive functions are cognitive
functions that seems to benefit from physical activity (Davis et al. 2011). However,
Fisher et al. (2011), reported that aerobically intense physical education intervention had no effect on any scale of Cognitive Assessment System in healthy children.
According to Fisher et al. (2011), intervention was not able to increase time spent in
MVPA during physical education lessons enough, which may explain the lack of effect. In addition, the respond to physical activity may differ between lean and overweight children (Davis et al. 2011).
In the study Monti, Hillman and Cohen (2012), there were no differences in
relational memory performance between children participating in an aerobic exercise programme and control children after a nine-month after-school intervention
promoting fitness. However, compared to the control children, children who participated in the aerobic exercise intervention displayed eye-movement patterns indicative of superior relational memory accuracy (Monti, Hillman & Cohen 2012). This
24
indicates that behavioural test may not been sensitive enough to detect small
changes in memory performance.
To sum up the results of these intervention studies, it seems that physical activity enhances children’s cognitive functions, and especially executive functions.
However, there are only a few intervention studies and hardly any randomized controlled trials. In addition, there have been differences in how physical activity is implemented, what cognitive domains have been assessed and how they have been
measured, and the ages of the children have also been varied across studies, making
it hard to draw any further conclusions.
The association of physical activity and cognitive functions has also been
measured with cross-sectional studies, which supports the results of the intervention studies. In the study by Ruiz et al. (2010), leisure-time physical activity was associated with better cognitive performance, including verbal, numeric and reasoning abilities in adolescents. In addition, Castelli et al. (2011) reported that engagement in vigorous physical activities had a positive association with performance in
inhibitory control task.
Besides chronic effects of physical activity, recent studies have also shown that
acute physical exercise induces positive changes in free-recall memory performance
(Pesce et al. 2009), working memory performance (Hill et al. 2010), and inhibitory
control performance (Budde et al. 2008, Hillman, Pontifex & Themanson 2009, Hill
et al. 2010, Best 2012, Drollette et al. 2012, Gallotta et al. 2012, Hogan et al. 2013).
In addition, in the study by Drollette et al. (2014), the effects of acute aerobic exercise on inhibitory control performance were examined in two groups of children
categorized as higher- and lower-performers. Children were divided into two
groups according to their inhibitory control performance following the resting session. According to the results, higher-performers maintained their performance,
while lower-performers improved their performance in inhibitory control task following exercise. However, acute physical activities have not improved spatial working memory performance (Drollette et al. 2012) or inhibitory control (Stroth et al.
2009) in all studies. According to Stroth et al. (2009), the selected task assessing
inhibition was too easy for children, and due to a ceiling effect the effects of acute
exercise on inhibition was not revealed. Drollette et al. (2012), in turn, suggested
that acute exercise may affect selectively to executive functions enhancing inhibitory control, but not working memory.
As stated before, physical fitness has been used as a proxy measure of regular
physical activity. Associations of physical fitness and cognition have been measured
with cross-sectional and longitudinal studies. According to the longitudinal study by
Chaddock et al. (2012b), children with higher aerobic fitness outperformed less fit
children in an inhibitory control task at the initial time of fitness testing, as well as
one year later. In addition, children with high aerobic fitness have demonstrated
better inhibitory control performance in cross-sectional studies (Buck, Hillman &
Castelli 2008, Hillman et al. 2009, Chaddock et al. 2010b, Pontifex et al. 2011, Voss
et al. 2011, Wu et al. 2011, Chaddock et al. 2012a, Pontifex et al. 2012, Crova et al.
2014). In addition, Hogan et al. (2013) reported a positive interactive effect of physical fitness level and acute aerobic exercise on inhibitory control: higher fit children
had shorter reaction times after exercise compared to a resting condition. However,
according to Stroth et al. (2009) and Castelli et al. (2011), aerobic fitness were not
associated with inhibitory control.
25
High aerobic fitness have also been connected to better memory performance
(Chaddock et al. 2010a, Chaddock et al. 2011, Raine et al. 2013), planning ability
(Davis & Cooper 2011), attentional performance (Davis & Cooper 2011, Wu & Hillman 2013) and arithmetic cognition (Moore et al. 2014). Furthermore, Chaddock et
al. (2012c) reported that aerobically more fit children outperformed less fit children
in a virtual street-crossing task. More fit children maintained street-crossing performance when distracted, whereas the performance of less fit children attenuated
when conversing on a phone. Finally, Åberg et al. (2009) reported that cardiovascular fitness was associated with intelligence in young adulthood. Still, fitness has not
always been reported to have an association with cognition. Ruiz et al. (2010) reported that neither aerobic nor muscular fitness was associated with overall cognitive performance. Whereas Davis et al. (2011) reported that fitness was not associated with the Simultaneous (processing with spatial and logical questions) or Successive (analysis/recall of stimuli arranged in sequence) sub-categories of the Cognitive Assessment System.
These apparent inconsistencies in associations between physical activity and
cognition suggest that physical activity may selectively affect certain cognitive functions such as executive functions. However, it seems that studies have most often
measured the association between physical activity and executive functions. In addition, there are no studies with exactly the same design, which attenuates the interpretation of the results. Furthermore, physical fitness has often been used as a
proxy indicator of regular physical activity, without direct measurement of actual
physical activity levels. This is particularly important because in childhood habitual
physical activity is rarely intensive and lengthy enough to enhance aerobic fitness,
and therefore, the relationship between physical activity and fitness may not be
meaningful (Armstrong, Tomkinson & Ekelund 2011). This may cause discrepancies
in results. For example, Ruiz et al. (2010) and Castelli et al. (2011) reported that
physical activity was associated with cognition, while fitness was not.
In summary, it seems that physical activity benefits children’s cognitive functions. However, evidence of the favourable effects of physical activity on cognitive
functions in healthy children and adolescents is still somewhat inconsistent and
based on scarce research data. Especially, the type of physical activity assessed and
measurements of physical activity used have varied across studies. Similarly, the assessments of certain cognitive domains have been divergent. Moreover, only a few
studies have measured a broad range of cognitive functions. This highlights the need
for new studies to clarify the benefits of physical activity on different dimensions of
cognitive functions.
26
1.4 Associations of sedentary behaviour, academic performance and cognitive functions
Since the invention of television, the effects of children’s exposure to TV has been
discussed in terms of academic achievement and cognitive development (Maccoby
1951). According to these early studies, excessive television viewing may have an
unfavourable impact on children’s cognitive functions and academic achievement,
but the evidence is ambiguous (Gaddy 1986, Gortmaker et al. 1990, Levine & Waite
2000), suggesting that the effects of TV consumption may vary as a function of socioeconomic background, intelligence and other sub-groups of children (Anderson &
Collins 1988, Beentjes & Van der Voort, Tom HA 1988, Smith 1992, Cooper et al.
1999). In addition, the association may not be linear, implying that the association
turns negative with high amounts of TV viewing (Williams et al. 1982).
Newer studies seem to support this observation by reporting an inverse association between high amounts of TV viewing and lower academic achievement
(Chernin & Linebarger 2005, Schmidt & Vandewater 2008, Tremblay et al. 2011b),
curvelinearity of the association (Razel 2001) and an association between high
amounts of TV viewing and attention problems in school-aged children (Schmidt &
Vandewater 2008).
Especially early-childhood TV exposure may have a negative impact on children’s development, including language, cognition and attention capacity, and readiness to attend school (Clarke & Kurtz-Costes 1997, Wright et al. 2001, Christakis
2009). In addition, early-childhood TV viewing has been associated with attention
problems (Christakis et al. 2004, Zimmerman & Christakis 2007), attenuated cognitive outcomes (Zimmerman & Christakis 2005) and decreased academic achievements (Pagani et al. 2010) at school-age. However, inconsistent results have also
been reported in early childhood, showing no association between TV exposure and
language or visual motor skills (Schmidt et al. 2009). On the other hand, educational
TV viewing has been linked to enhanced academic and cognitive outcomes (Linebarger et al. 2004, Chernin & Linebarger 2005, Kirkorian, Wartella & Anderson 2008,
Schmidt & Vandewater 2008).
Besides TV viewing, computer use, video game playing and other screenbased sedentary behaviour have also been linked to cognitive skills and academic
achievement. According to recent studies, playing computer or video games may
even benefit cognitive functions, especially attentional, visuospatial and problemsolving skills in young adults (Spence & Feng 2010, Granic, Lobel & Engels 2013), as
well as in children and adolescents (Subrahmanyam et al. 2001, Schmidt & Vandewater 2008). In addition, computer use has been associated with slightly better academic performance (Subrahmanyam et al. 2001). However, previous results have
not been consistent. The associations of screen-based sedentary behaviour, academic achievement and cognitive functions in school-aged children are described
more in detail below.
27
1.4.1 Sedentary behaviour in association with academic achievement
According to recent studies, media use in childhood – especially time spent viewing
TV, playing video games, and using the Internet – has a negative association with
academic achievement. In a longitudinal study by Sharif, Wills and Sargent (2010),
screen-time exposure – including TV viewing, video game playing and the presence
of a television in the bedroom – had adverse effects on improvements in overall
school performance in children aged 10–14 years.
Similarly, Mößle et al. (2010) reported the results of two studies among primary school students. According to the cross-sectional results among fourth-grade
students, the time used for playing computer or video games and watching TV, DVDs
and videos was negatively associated with school achievement, including grades in
mother tongue, science and math (Mößle et al. 2010). Similarly, in another study
that evaluated cross-sectional associations, media use – especially playing computer
games – was negatively associated with marks in mother tongue, foreign language
and science, but to a lesser extent with marks in math at all measurement occasions
in 3rd, 4th and 5th grades. In addition, in longitudinal analysis, negative correlations
were observed between the duration of daily computer game playing and academic
achievement, while the duration of TV usage had only few negative associations with
academic achievements (Mößle et al. 2010).
Especially, frequent TV viewing in childhood and adolescence has been connected to poor reading achievement in childhood (Ennemoser & Schneider 2007),
poor academic grades, failure to complete high school, negative attitudes towards
school and poor homework completion in adolescence, as well as long-term academic failure (Johnson et al. 2007) and poor educational achievement at the age of
26 (Hancox, Milne & Poulton 2005). In cross-sectional studies, high amounts of television viewing have been shown to have negative associations with math and reading achievement in 6- to 13-year-old children (Shin 2004) and school performance
in 5th–8th graders (Sharif & Sargent 2006). Furthermore, children having a TV in
their bedroom, the number of television sets at home and the number of hours that
televisions are on have been negatively associated with academic achievement
(Gentile & Walsh 2002, Borzekowski & Robinson 2005, Espinoza 2009).
Munasib and Bhattacharya (2010), however, reported no association between
television viewing and academic achievement in 5–10 years old children after adjusting for socioeconomic determinants, parents’ TV-viewing behaviour and parents’
role in monitoring children’s viewing. Similarly, in a longitudinal study by Bittman
et al. (2011), in which two age cohorts (younger cohort aged 0–1 years and older
cohort aged 4–5 years at the beginning of the study) were followed for four years,
television viewing was not associated with language skills after the parents’ involvement in the child’s media use was taken into account. In addition, Haapala et al.
(2014a) reported that television viewing in first grade was not associated with reading and arithmetic skills in grades 1–3.
Besides TV viewing, computer use and video game playing have been reported
to have negative associations with academic achievement. However, these results
are more inconsistent: in the intervention study by Weis and Cerankosky (2010),
the effects of video game ownership on academic achievement were evaluated in
boys aged six to nine. Boys were randomly assigned into two groups: the experi28
mental group received a video game system at the beginning of the four month intervention, whereas the control group received a video game system after follow-up
assessments. According to the results at the post-test, children with video games
spent more time playing them and received lower reading and writing scores, but
not math scores, compared to control children (Weis & Cerankosky 2010).
In a longitudinal study by Jackson et al. (2011), video game playing was associated with lower academic achievement, especially lower GPAs in 12-year-old children. Similarly, according to the study by Bittman et al. (2011) presented earlier, the
ownership of game consoles was negatively associated with literature achievements
in the older cohort (children aged 8 years). However, in the study by Sharif and Sargent (2006), video game use was not associated with school performance in 5–8
graders. According to Ferguson et al. (2013), violent video game exposure had neither positive nor negative predictive short-term or long-term associations with
math achievement in children and youths aged 10–17 years. Similarly, in the longitudinal study by Willoughby (2008), the association between computer game play
and academic performance was not significant at the age of 14–16. Haapala et al.
(2014a), in turn, reported that high levels of computer use and video game playing
in first grade predicted better arithmetic skills among boys in grades 1–3, while no
effect was realized for girls.
According to Jackson et al. (2011), Internet use was associated with better
reading skills in 12-year-olds, but only in children with initially low reading skills.
The same kind of effect was not realized for math skills (Jackson et al. 2011). Moreover, moderate use of the Internet has been connected to more positive academic
performance than non-use or high use in ninth to 12th graders (Willoughby 2008,
Kim & So 2012). In the other study by Jackson et al. (2006), those children and
youths from low-income families who used the Internet more frequently achieved
higher reading (but not math) test scores and higher grade point averages 6, 12 and
16 months later, compared to children who used the Internet less frequently. In addition, Bittman et al. (2011) reported that computer use was associated with higher
developed language skills. Likewise, Borzekowski and Robinson (2005) reported
that computer access and use were positively associated with academic achievement.
In conclusion, the association between screen-based sedentary behaviour and
academic achievement is still somewhat inconsistent. The association seems to depend on the type of screen-based behaviour assessed, the age of the children, and
other factors like socioeconomic status. For instance, media use may be more controlled in small children, and the effects of screen time on academic achievement
may become emphasized in older children (Gortmaker et al. 1990). In addition, the
amount of time spent in front of the screen (non-use vs. moderate use vs. high use)
and content of screen time may be critical factors affecting the association between
screen time and academic achievement. Screen time – such as playing video games
or using the Internet – may be beneficial when the use is light or moderate, but may
be harmful when the use is excessive. However, the literature concerning screenbased sedentary time in association with academic achievement is divergent and
there are no replicated study designs, so more research is needed to clarify the association. Besides, to our knowledge, no one has studied the association between
objectively measured sedentary time and academic performance.
29
1.4.2 Sedentary behaviour in association with cognitive functions
Extensive screen time has been linked to an elevated risk of attention and learning
difficulties. In the study by Swing et al. (2010), high amounts of screen time were
associated with attention problems. The association of screen time and attention
problems was similar for both TV viewing and video game playing, as well as for
both age groups (6–12 years and 18–32 years) (Swing et al. 2010). In addition, a
high amount of TV viewing in both childhood and adolescence has been associated
with frequent attention difficulties in adolescence. (Johnson et al. 2007, Landhuis et
al. 2007). However, in the intervention study by Weis and Cerankosky (2010),
where 6–9-year-old boys were randomly assigned to an experimental group receiving a video game system at the beginning of the four-month intervention or a control
group receiving a video game system after the follow-up, the ownership and playing
of video games did not affect attention problems. On the other hand, Weis and
Cerankosky (2010) observed higher learning problems in boys with the video game
system compared to control childen.
Excessive screen time has also been connected to weaker executive functions
in some studies, but not in the others. Mizuno et al. (2013) reported that high
amounts of television viewing were associated with a weaker ability for adolescents
to divide attention (mean age 13 years). In the study by Dye, Green and Bavelier
(2009), the inhibitory control skills of action-game players and a non-playing control group aged 7 to 22 years were compared. The results, however, showed that
action-game playing was associated with enhanced attention skills (Dye et al. 2009).
Video game playing has been linked to decreased verbal memory performance
(Dworak et al. 2007). Drowak et al. (2007) studied the effects of excessive television
and video game exposure on the visuospatial and verbal memory performance of
13-year-old children. According to the results, excessive video game playing, but not
television viewing, decreased verbal memory performance compared to the basal
condition. Visuospatial memory performance was not affected by either television
or video game exposure (Dworak et al. 2007). In turn, Ferguson et al. (2013) reported that violent video game exposure had neither positive nor negative predictive short-term or long-term association with visuospatial cognition in children and
youths aged 10–17 years. In addition, in the study of Ruiz et al. (2010), television
viewing and video game playing were not associated with overall cognitive performance, including verbal, numeric and reasoning abilities in adolescents.
Differing research results based on scarce and heterogeneous research data,
indicates that the association between sedentary behaviour and cognition is more
complicated than previously believed and needs clarification. In addition, to our
knowledge, no previous studies have examined the associations of objectively measured overall sedentary time on cognitive functions in children.
30
1.5 Summary of literature
In sum, children today spend excessive amounts of time engaged in sedentary activities and not enough time in physical activities. Low levels of physical activity have
raised concerns over the effects of a physically inactive lifestyle on children’s physical health and, recently, also on children’s learning. Learning is an active and interactive process, which results in changes in skills, knowledge and behaviour. At
school, academic achievements have been used to monitor and evaluate children’s
learning. Cognitive functions, especially executive functions, can be seen as prerequisites of learning. According to recent studies, physical activity may benefit children’s cognitive functions and academic performance, while sedentary behaviour,
especially screen-based sedentary behaviour, may attenuate them.
Although the number of studies examining the association of physical activity
and sedentary behaviour with academic and cognitive performance has almost doubled during recent years, research in this area is still in its infancy, and the evidence
is somewhat inconsistent. In particular, the definitions, patterns and measurements
of cognitive functions, academic performance and physical activity have varied
across different studies. In previous studies, physical activity has often been measured with self-reports or physical fitness has been used as a proxy measure of regular physical activity instead of measuring physical activity levels directly. Likewise,
sedentary behaviour has usually been assessed with self-reports of screen time and,
especially in earlier studies, with self-reports of the time spent viewing TV.
Furthermore, the use of computerized test batteries to measure cognitive
functions has increased worldwide, but the psychometric properties of such test
batteries have not been adequately measured. Future studies are needed to clarify
the associations between physical activity, sedentary behaviour, academic performance and cognitive functions in school-aged children.
31
32
2
AIMS OF THE STUDY
The purpose of the present thesis was to determine how physical activity and sedentary behaviour are associated with academic performance and cognitive functions in elementary school-aged children. The specific aims were:
Aim 1.
To examine the associations of self-reported and objectively measured physical activity and sedentary behaviour with teacher-rated
academic performance in children.
Aim 2.
To evaluate the internal consistency and the one-year stability of
seven tests of the Cambridge Neuropsychological Test Automated
Battery (CANTAB) used to measure visual memory, executive function, and attention in children.
Aim 3.
To examine how objectively measured and self-reported physical
activity and sedentary behaviour are associated with cognitive
functions in children.
33
34
3
MATERIAL AND METHODS
3.1 Study population and data collection
During spring 2011, 475 5th and 6th graders from five schools in the Jyväskylä
school district in Finland were invited to participate in the study, which included a
self-reported questionnaire filled out in the classroom, an objective measurement of
physical activity for seven days, and cognitive tests. Fifty-eight percent (N=277) of
475 eligible children participated in the study. Children engaged in normal curriculum-based instruction, and the language of instruction was Finnish. They had normal or corrected-to-normal vision. Of the 277 children, 230 were selected to participate in cognitive tests according to successful objective measurement of their physical activity. If a child’s physical activity measurement did not succeed, because of
technical problems or the child did not remember to wear the accelerometer, they
were not invited to the cognitive tests. Seven children (three boys and four girls)
were excluded from the analysis of the association of physical activity and cognitive
functions because, according to their parents’ survey, they had physical disabilities,
chronic diseases or severe learning disabilities. During spring 2012, students who
had been fifth graders in spring 2011 were invited to participate in follow-up measurements. Seventy-four children (49% of 151 eligible) participated in these followup measurements. The sample characteristics of the study are presented in Tables
1–3.
35
TABLE 1.
Sample characteristics concerning explanatory variables.
Boys
Explanatory variables
Physical activity
Self-reported MVPA (d/ week
with ≥60 min MVPA)
Objectively measured MVPA
(min/day)
Sedentary behaviour
Self-reported screen time
(h/day)
TV
Computer/video games
Computer use (other than
playing)
Objectively measured sedentary time (%/day)
Girls
pa
All
Mean±SD
N
Mean±SD
N
Mean±SD
N
5.2±1.8
121
4.9±1.6
153
5.0±1.7
274
0.049
59.9±22.3
95
56.3±17.1
125
57.9±19.5
220
0.623
3.8±2.0
121
3.5±1.9
154
3.6±1.9
275
0.095
1.6±1.0
122
1.6±1.0
154
1.6±1.0
276
0.663
1.3±0.9
121
0.7±0.8
154
1.0±0.9
275
<0.001
0.9±0.7
122
1.2±0.9
154
1.1±0.8
276
0.011
39.6±3.5
95
40.8±3.1
125
40.3±3.3
220
0.006
Abbreviations: SD, standard deviation; MVPA, moderate to vigorous physical activity.
a p-values for the gender differences.
TABLE 2.
Sample characteristics concerning outcome variables.
Boys
Outcome variables
Academic performance
Grade point average (range 4–
10)
Cognitive function
Visual memory
PRM no. of correct responses (max 24)
SRM no. of correct responses (max 20)
Executive functions
SSP span length (max 9)
SOC no. of problems solved
in minimum moves (max 12)
IED no. of children who
completed the test (%)
Attention
RTI five-choice movement
time (ms)
RTI five-choice reaction time
(ms)
RVP A’ (range 0–1)
Girls
pa
All
Mean±SD
N
Mean±SD
N
Mean±SD
N
8.1±0.7
122
8.4±0.6
153
8.2±0.7
275
<0.001
20.9±2.80
99
20.8±2.3
131
20.9±2.5
230
0.478
16.5±1.6
99
16.8±1.7
131
16.7±1.7
230
0.152
6.5±1.3
99
6.7±1.3
131
6.6±1.3
230
0.385
7.7±1.8
99
7.6±1.7
131
7.6±1.8
230
0.746
67
99
67
131
67
230
0.935
329±74
99
364±87
131
349±83
230
0.001
300±36
99
318±32
131
310±35
230
<0.001
0.97±0.02
99
0.97±0.03
131
0.97±0.02
230
0.973
Abbreviations: SD, standard deviation; PRM, Pattern Recognition Memory; SRM, Spatial Recognition Memory; SSP, Spatial Span;
SOC, Stockings of Cambridge; RTI, Reaction Time; RVP, Rapid Visual Information Processing; IED, Intra-Extra Dimensional Set Shift.
a p-values for the gender differences.
TABLE 3.
Sample characteristics concerning other variables.
Boys
Girls
pa
All
Other variables
Mean±SD
N
Mean±SD
N
Mean±SD
N
Age (years)
Families in which the highest level
of parental education was tertiary-level education (%)
Family income (€)
Parents, who are married or cohabiting (%)
Children with learning difficulties
(%)
Children with need for remedial
education
Amount of sleep (h)
12.2±0.7
123
12.2±0.6
154
12.2±0.6
277
0.765
80
94
79
126
79
220
0.826
65319±29443
69
63755±27346
103
64383±28132
172
0.722
77
94
75
126
76
220
0.734
9
91
6
124
7
215
0.371
19
92
14
126
16
218
0.405
9.1±0.8
122
9.0±0.7
154
9.1±0.7
276
0.414
18.9±3.4
121
18.9±3.2
149
18.9±3.3
270
0.997
Body mass index
Abbreviations: SD, standard deviation.
a p-values for gender differences.
3.2 Measurements
3.2.1 Self-reported physical activity and screen time
Physical activity and screen time were assessed with a self-reported questionnaire
used earlier in the World Health Organization (WHO) Health Behaviour in Schoolaged Children (HBSC) study (Currie et al. 2012). Self-reported MVPA was measured
with the following question: “Over the past 7 days, on how many days were you
physically active for a total of at least 60 minutes per day?” The response categories
were: 0 days, 1 day, 2 days, … 7 days. There was a short description about what kind
of physical activity should be taken into account when answering the question: “In
the next question, physical activity is defined as any activity that increases your
heart rate and makes you get out of breath some of the time when you are for example exercising, playing with friends, commuting actively to school or in physical education lessons.” Examples included running, walking quickly, rollerblading, biking,
dancing, skateboarding, swimming, snowboarding, cross-country skiing, soccer,
basketball, and Finnish baseball. Test-retest agreement for self-reported MVPA has
been very good (ICC=0.82) (Booth et al. 2001, Liu et al. 2010).
Self-reported screen time was evaluated with the question: “About how many
hours a day do you usually a) watch television (including videos), b) play computer
or video games, or c) use a computer (for purposes other than playing games, for
example, emailing, chatting, or surfing the Internet or doing homework) in your free
time?” The response options were: not at all, about half an hour per day, about an
hour a day, about two hours per day, … about five hours per day or more. Children
responded separately for both weekdays and weekends. Test-retest agreement for
watching television (ICC=0.72–0.74) and for playing computer or video games
(ICC=0.54–0.69) has been substantial, and fair to moderate (ICC=0.33–0.50) for using the computer (Liu et al. 2010). Daily screen-time averages were calculated by
adding these three questions together, including weekdays and weekends.
3.2.2 Objective measures of physical activity and sedentary time
Children’s physical activity was measured objectively by using the ActiGraph
GT1M/GT3X accelerometer with one vertical axle. Children wore the accelerometer
on their right hip with an elastic waistband during waking hours for seven consecutive days. During bathing, swimming, and other water activities, it was requested
that the monitor be removed, because it was not water-resistant. The ActiLife accelerometer software (ActiLife version 5; http://support.theactigraph.com/dl/ActiLife-software) was used to initialize the monitors and download the data. Epoch
length was 10 seconds and non-wearing time 30 minutes. Customized software was
used for data reduction and analysis. A cut-off value of 2,296 counts per minute was
used for MVPA (Evenson et al. 2006) and 100 counts per minute for sedentary time.
Children were included in the analysis if they had valid data for at least 500 minutes
per day on two weekdays and on one weekend day. In order to compare children
who had worn the accelerometers for different amounts of time per day, objectively
measured sedentary time was expressed as the percentage of daily amount of time
in which data was being registered.
39
3.2.3 Academic performance
Academic achievement scores (grades in individual school subjects and GPAs) were
provided by the education services of the city of Jyväskylä. Individual grades were
assessed in the following school subjects: mother tongue (in most cases Finnish or
Swedish), first foreign language (started in 3rd grade), mathematics, physics/chemistry, biology, history, geography, religion or ethics, visual arts, music and physical
education. The grades refer to numerical assessment on a scale of 4–10, where 4
denotes a failure (US grade: F) and 10 denotes excellent knowledge and skills (US
grade: A). The GPAs were calculated on the basis of the individual grades and were
used as a measure of academic achievement in the analysis. A Finnish GPA 5.0–5.9
equals 1.0 in US GPA, 6.0–6.9 equals 2.0, 7.0–8.9 equals 3.0, and 9.0–10.0 equals 4.0,
respectively.
3.2.4 Cognitive functions
CANTAB (CANTABeclipse version 3 on a PaceBlade Slimbook P110 tablet PC with a
12-inch touch-screen monitor and Windows XP Professional operating system) was
used to assess a broad range of cognitive functions: a) visual memory (Pattern
Recognition Memory [PRM] and Spatial Recognition Memory [SRM]), b) executive
function (Spatial Span [SSP], Stockings of Cambridge [SOC], Intra-Extra Dimensional
Set Shift [IED]), and c) attention (Reaction Time [RTI] and Rapid Visual Information
Processing [RVP]) (Table 4). The tests were run individually with the help of a
trained research assistant and according to the standard protocol. Standard instructions for the tests were provided in the CANTAB manual and were translated into
Finnish. The execution required about 45 minutes. The test battery was administered in a silent room without distractions. A Motor Screening Task measuring simple psychomotor speed and accuracy was used as a training procedure at the beginning of a test session. A more detailed description of the tests can be found in the
original study II.
TABLE 4.
Summary of the CANTAB tests used to measure different dimensions of cognitive function.
Dimension of cognitive function
Test
Visual memory
Pattern Recognition Memory
Spatial Recognition Memory
Spatial Span
Stockings of Cambridge
Intra-Extra Dimensional Set Shift
Reaction Time
Rapid Visual Information Processing
Executive function
Attention
40
Abbreviation
PRM
SRM
SSP
SOC
IED
RTI
RVP
3.2.4.1
Visual memory
Visual memory performance was assessed with PRM and SRM. PRM measures
recognition memory for visual patterns and SRM for spatial locations in a two-alternative forced-choice paradigm. In these tests, children had to remember presented
geometric patterns (PRM) or the locations of white squares (SRM) and discriminate
them from novel patterns and locations. The scores in these tasks are based on the
number of correct responses (PRM maximum 24, SRM maximum 20).
3.2.4.2
Executive function
Children’s executive functions were assessed with SSP, SOC and IED tests. The SSP
is based on the Corsi Blocks task (Milner 1971), which measures the length of
visuospatial memory span. In this test, a specified number of white boxes changed
their colour one by one and children had to reproduce the same sequence by touching the boxes in the same order that the boxes had changed colour. The score in the
task is based on the length of the maximum sequence that the child can reproduce.
The SOC is a computerized version of the Tower of London task (Shallice &
Shallice 1982, Owen et al. 1990), measuring spatial planning and spatial working
memory. In this test, children had to move coloured balls in the lower part of the
screen to the same position in the stockings as they were in the upper part of the
screen. Children had a specified number of moves to use. The score in this task is
based on the number of problems that the child solves with a minimum number of
moves.
IED is a computerized analogue of the Wisconsin Card Sorting test and
measures rule acquisition and reversal in a set-shifting condition. Specifically, it
measures the ability to focus attention on different stimuli within a relevant dimension and shift attention to a previously irrelevant dimension. In this task, there are
nine stages with increasing levels of difficulty. The children were instructed to
choose one of two different dimensions: one was correct and the other was incorrect.
According to immediate feedback, they were expected to choose the correct pattern
and learn the rule. The score in this task is based on the number of stages completed.
3.2.4.3
Attention
The children’s attention abilities were assessed with RTI and RVP. RTI measures the
children’s speed of response to an unpredictable visual target. In the unpredictable
five-choice scenario, a yellow spot appeared randomly in one of five circles on the
screen, and children were asked to respond as soon as possible by touching the correct circle. The scores in this task are based on reaction time (ms) and movement
time (ms).
Measuring sustained attention, the RVP is similar to the Continuous Performance Task. In this test, children had to press a button every time they discriminated the target sequence (digits 3, 5, and 7) from the digits appearing in a pseudorandom order at the rate of 100 digits per minute. The score in this task is based on
RVP A’, which measures how successful the child is at detecting target sequences
(range: .00 to 1.00; bad to good).
41
3.2.5 Potential confounders
The parent or the child’s main caregiver filled in a questionnaire concerning family
background. The mother’s and father’s education were measured with the following
questions: “What is the highest level of mother’s/father’s education?” The highest
level of parental education (calculated on the basis of the mother’s and father’s education) were categorized as 1) tertiary-level education and 0) basic or upper secondary education. Family income was measured with the question: “What was your
household's total income last year (with taxes)?” Marital status was assessed with
the question: “Which of the following best describes the marital status of the child's
main caregiver? A) Married or cohabiting with child’s mother/father, B) Divorced,
single parent, C) Divorced, joint custody, D) Divorced, a new marriage, E) Single, D)
Widow.” The marital status of the main caregiver was categorized as 1) married or
cohabiting with child’s mother/father and 0) divorced or single/widow. Children’s
learning difficulties and need for remedial education were measured with the questions: “Has your child been diagnosed with a learning difficulty?” and “Has your child
received remedial education?” Children’s learning difficulties and need for remedial
education were categorized as 1) yes or 0) no or don’t know. Children also reported
times when they usually went to sleep and woke up on school days.
3.3 Ethics statement
The study was approved by the Ethics Committee of the University of Jyväskylä, and
it followed the principles of the Declaration of Helsinki and the Finnish legislation.
Participation in the study was voluntary, and all participants had the right to drop
out of the study at any time without any specific reason. Only children with a fully
completed consent form (Certificate of Consent signed by a parent/guardian and the
child) on the day of the first measurements were included in the study.
3.4 Analytical strategies
3.4.1 Study I
In Study I, the main objective was to examine cross-sectional associations of physical
activity and sedentary behaviour with academic achievement. In addition, potential
confounding factors were taken into account. These associations were examined
with analysis of variance and linear regression analysis using the SPSS 19.0 for Windows statistical package (SPSS (2010) IBM SPSS Statistics 19 Core System User’s
Guide (SPSS Inc., Chicago, IL)).
For the analysis of variance, children were divided into tertile groups (33%
each) according to the amount of objectively measured MVPA (first tertile ≤47.0 min,
second tertile 47.1–65.0 min, third tertile ≥65.1 min) and sedentary time (first tertile ≤38.4%, second tertile 38.5–41.4%, third tertile ≥41.5%). In addition, children
were classified into groups according to the self-reported MVPA (1=0–2 days/week,
2=3–4 days/week, 3=5–6 days/week, 4=7 days/week) and screen time (1=0.00–
42
1.99 h/day, 2=2.00–2.99 h/day, 3=3.00–3.99 h/day, 4=4.00–4.99 h/day, 5=≥5.00
h/day).
Before proceeding with multiple regression, the Pearson’s correlation coefficients for continuous variables were calculated to estimate associations between
single variables and GPA. To investigate whether the associations between self-reported or objectively measured MVPA and GPA are quadratic, quadratic terms were
calculated using an equation x2=((x-mean(x))*(x-mean(x)), where x was logarithmically transformed, self-reported MVPA or logarithmically transformed, objectively
measured MVPA. After that, the enter method for the multiple regression was used.
To calculate change in R square, the variables of interest were added to the second
block one by one, while all other variables of the model (potential confounders and
other variables of interest) were added to the first block. The change in R square for
all variables of interest was calculated and tested for significance. In order to study
whether the assumptions of the regression analysis were fulfilled, we examined the
distribution of model residuals.
3.4.2 Study II
In Study II, the main objective was to examine internal consistency and one-year
stability of the seven CANTAB tests. The analyses were performed using the SPSS
19.0 for Windows statistical package (SPSS (2010) IBM SPSS Statistics 19 Core System User’s Guide (SPSS Inc., Chicago, IL)) and the Mplus statistical package (Version
7; Muthèn & Muthèn, 1998–2012).
The internal consistency of each nonhampering test was estimated with
Cronbach’s alpha reliability coefficient (α). The reliability could not be determined
for hampering tests. As preliminary analysis of stability, Pearson’s correlation for
continuous variables and tetrachoric correlations for dichotomously scored variables were calculated between the assessments.
To examine the stability of the CANTAB tests, structural equation models were
applied. To combine a very large number of measured variables for each latent factor, item parcels were constructed by summing every third pattern into the same
parcel (Little et al. 2002). Item parcels were used in order to achieve continuous
indicators and not to end up with too large of a model in terms of the ratio of sample
size to number of free parameters (Herzog & Boomsma 2009, Christopher Westland
2010). Underlying latent traits were assumed to be unidimensional. The constructed
parcels were then used as indicator variables in the confirmatory factor analyses.
The measurement models were first specified at both measurement times to
test the association between the observed variables and the underlying factors. After demonstrating the fit of the measurement models, longitudinal confirmatory factor analyses were performed. The baseline stability model was estimated, in which
the factor (or factors) in the second assessment (2012) was predicted by the factor
(or factors) in the previous measurement point (2011). To detect time invariance in
the latent constructs, equality constraints were imposed on the corresponding factor loadings across two time points. Furthermore, if the invariance assumption of a
stability model was supported, a more parsimonious model in which all the factor
loadings were fixed to be one was estimated.
43
Full information maximum likelihood (FIML) estimation with robust standard
errors (MLR) was used under the assumption of data missing at random. Item response theory (IRT) modelling using FIML estimation was applied to the CANTAB
tests with hampering nature. The Satorra–Bentler scaled χ2-test, the comparative fit
index (CFI), the Tucker–Lewis Index (TLI), the root mean square error of approximation (RMSEA) and the standardized root mean square residual (SRMR) were used
to evaluate the goodness of fit of the models. The model fits the data well if the pvalue for the χ2-test is non-significant, CFI and TLI values are close to 0.95, the
RMSEA value is below 0.06 and the SRMR value is below 0.08 (Hu & Bentler 1999).
A Satorra–Bentler scaled χ2 difference test was conducted for the nested models. If
the χ2-test produces a non-significant loss of fit for the constrained model as compared to the baseline stability model, the equality constraints are supported.
3.4.3 Study III
In Study III, the main focus was to examine the associations of objectively and subjectively measured physical activity, sedentary behaviour and cognitive tests. On the
basis of the reliability and stability results of the CANTAB tests, five of seven cognitive tests were chosen. In addition, structural equation modelling was chosen to examine the associations, because it enables estimation of measurement errors and
therefore increases the reliability of cognitive tests. The analyses were performed
using the SPSS 19.0 for Windows statistical package (SPSS (2010) IBM SPSS Statistics 19 Core System User’s Guide (SPSS Inc., Chicago, IL)) and the Mplus statistical
package (Version 7; Muthèn & Muthèn, 1998–2012).
In this study also, item parcels (Little et al. 2002) were constructed and then
used as indicators for latent variables. Single scores of every problem or level of the
cognitive tests were applied instead of the total score. When the outcome was dichotomous, multiple logistic regression was used to examine physical activity and
sedentary time in association with cognitive function. Full information maximum
likelihood estimation with robust standard errors was used under the assumption
of data missing at random.
Gender, the highest level of parental education and the child’s need for remedial education were chosen to represent different aspects of potential confounders
and were added to the main analysis. In order to avoid multicollinearity, highly correlated objectively measured MVPA and sedentary time were added to the model
using a Cholesky factoring of the predictors (de Jong 1999). The Satorra-Bentler
scaled χ2-test, the CFI, the TLI, the RMSEA and the SRMR were used to evaluate the
goodness of fit of the models, as described above.
44
4
AN OVERVIEW AND THE MAIN RESULTS OF THE
ORIGINAL STUDIES
4.1 Study I: Physical activity, sedentary behaviour, and
academic performance in Finnish children
Purpose of the study. Study I aimed to examine how both objectively measured and
self-reported physical activity and sedentary behaviour are associated with teacherrated academic achievement in children. Based on the previous studies, it was hypothesized that physical activity would have a positive association, while sedentary
behaviour would have a negative association with academic performance.
Methods. For this purpose, information on children’s academic achievement
(GPA) was provided by the education services of the city of Jyväskylä. Children selfreported how many days per week they were physically active (for a total of at least
60 minutes per day) and how many hours per day they spent watching TV, playing
video games or computer games, or using a computer for other purposes than play.
Children’s physical activity and sedentary time were measured objectively by using
an ActiGraph GT1M/GT3X accelerometer. Cross-sectional associations were examined using analysis of variance and linear regression analysis.
Results. Our results showed that objectively measured MVPA (p = 0.955) and
sedentary time (p = 0.285) were not associated with GPA (Figure 2). However, selfreported MVPA had an inverse U-shaped curvilinear association with GPA (p =
0.001), and screen time had a linear negative association with GPA (p = 0.002), after
adjusting for gender, children’s learning difficulties, the highest level of parental education, and amount of sleep (Table 5). Children who were physically active at least
60 minutes per day 5–6 days per week had the highest GPAs, whereas children who
were physically active 0–2 days per week had the lowest GPAs (Figure 2). Children
who had less than 2 hours per day of screen time had the highest GPAs, whereas
children who had more than 5 hours per day of screen time had the lowest GPAs
(Figure 2).
Conclusions. Our finding that self-reported physical activity was directly, and
screen time inversely, associated with academic achievement, is consistent with earlier studies (Fox et al., 2010; Kantomaa et al., 2010; Möble et al., 2010; Sharif et al.,
2006). However, objectively measured physical activity and sedentary time were
not associated with academic achievement. This inconsistency between the subjective and objective measurements suggests that objective and subjective measurements may reflect different constructs and contexts of physical activity and sedentary behaviour in association with academic outcomes.
45
FIGURE 2.
Grade point averages according to a) self-reported MVPA, b) self-reported
screen time, c) objectively measured MVPA, and d) objectively measured sedentary time. Results from the regression analysis.
46
TABLE 5.
Regression analysis of grade point average (GPA).
Academic achievement (GPA)
Pearson’s
correlations
Variables in the model
Children’s learning difficultiesa
Highest level of parental educationb
Amount of sleep (h/day)
Gender (female)
c
Self-reported MVPA
Quadratic self-reported
MVPAd
Self-reported screen time
(h/day)e
The regression model
B (SE)
-0.697***
(0.139)
Beta (SE)
-0.297***
(0.139)
0.247***
0.307** (0.087)
0.207** (0.087)
0.211***
0.114* (0.052)
0.129* (0.052)
0.223***
0.176* (0.072)
0.144* (0.072)
0.003
0.065 (0.061)
0.067 (0.061)
-0.368***
∆R2f
0.004
-0.247***
-0.337** (0.104) -0.199** (0.104) 0.035**
-0.276***
-0.198** (0.062) -0.193** (0.062) 0.033**
R Square
0.328
Adjusted R Square
0.305
N
212
Abbreviations: B, unstandardized coefficient; Beta, standardized coefficient; SE, standard error; ∆R 2f,
change in R square.
a Parental report of child’s diagnosed learning difficulties categorized as 1) yes and 0) no or don´t
know.
b The highest level of parental education categorized as 1) tertiary-level education and 0) basic or
upper secondary education.
c Distribution of self-reported MVPA was reflected and transformed logarithmically and reflected
again to restore the original order of the variable (-ln((max+1)-y)).
d To measure quadratic associations between self-reported physical activity and grade point average,
quadratic terms were formed with the equation: Quadratic self-reported MVPA = ((x-mean(x)) * (xmean(x)), where x was logarithmically transformed self-reported MVPA (-ln((max+1)-y)).
e Distribution of self-reported screen time was transformed logarithmically (ln(y)).
f The change in R square, Self-reported MVPA, Quadratic self-reported MVPA and Screen time were
added to the model one by one.
The level of statistical significance: *** = p<0.001, ** = p<0.01, * = p<0.05.
47
4.2 Study II: Internal consistency and stability of the CANTAB
neuropsychological test battery in children
Purpose of the study. Study II was conducted to ensure the internal consistency
and stability of the cognitive tests before examining the associations of physical activity, sedentary behaviour and cognitive functions. The main purpose of Study II
was to evaluate the internal consistency and the one-year stability of seven CANTAB
tests measuring visual memory, executive function, and attention in elementary
school-aged children.
Methods. For this purpose, children participated in cognitive measurements
in spring 2011 and again in spring 2012. The CANTAB tests Pattern Recognition
Memory (PRM), Spatial Recognition Memory (SRM), Spatial Span (SSP), Stockings of
Cambridge (SOC), Intra-Extra Dimensional Set Shift (IED), Reaction Time (RTI) and
Rapid Visual Information Processing (RVP) were chosen according to previous studies and hypotheses about the association of physical activity and cognitive functions.
In addition, a goal was to test different dimensions of cognitive functions. The internal consistency of the tests was estimated with Cronbach’s alpha reliability coefficient (α), while the stability of these tests was examined using structural equation
modelling.
Results. In terms of internal consistency, Cronbach’s alpha reliability coefficients were 0.65 for the PRM number of correct responses, 0.21 for the SRM number
of correct responses, 0.87 for the RTI five-choice movement time, 0.66 for the RTI
five-choice reaction time and 0.49 for the RVP A’. For hampering tests (SSP, SOC and
IED), Cronbach’s alpha could not be determined.
Stability of visual memory tests. The estimation results of the stability model
for PRM are presented in Figure 3. The goodness-of-fit statistics of the constrained
model for the PRM number of correct responses were good (χ2 (12) = 17.30, p = 0.14,
CFI = 0.96, TLI = 0.95, RMSEA = 0.04, SRMR = 0.13). The stability for the PRM was
0.80. A stability model for SRM could not be determined, because none of the parcels
loaded significantly on the hypothesized factor in the cross-sectional measurement
models in 2011 and 2012. The correlation for the SRM number of correct responses
between 2011 and 2012 was r(72) = 0.30 (p = 0.009).
Stability of executive function tests. The stability model for the SSP could
not be determined, because of the nature of the test. The correlation between the
SSP span length in 2011 and in 2012 was r(72) = 0.37 (p = 0.001). The cross-sectional IRT models for SOC were estimated, and only 5 of the 12 items loaded significantly on the hypothesized factor in 2011 and only 3 of the 12 items in 2012. According to the results of the estimated baseline stability model, there was no significant association between the latent variables measured in 2011 and 2012. The correlation for SOC problems solved in the minimum number of moves between 2011
and 2012 was r(72) = 0.23 (p = 0.046). Because the latent variables measured by the
errors in stages from 3 to 7 and from 8 to 9 of the IED test did not correlate with
each other either in 2011 or in 2012, and the regression coefficient between the latent variables measured in consecutive years was significant only for the latter factor (b = 0.68, SE = 0.08, p < 0.001), the stages from 3 to 7 were discarded from further
analyses. The tetrachoric correlation for stage 8 between 2011 and 2012 was 0.38
(p = 0.047). For stage 9, it was 0.64 (p < 0.001).
48
Stability of attention tests. The estimation results of the stability model for
RTI reaction time and movement time are presented in Figure 4. The goodness-offit statistics of the constrained model for the RTI reaction time and the movement
time were good (χ2 (58) = 78.51 (58) p = 0.04, CFI = 0.96, TLI = 0.95, RMSEA = 0.04,
SRMR = 0.15). The stability coefficient for the RTI movement time was 0.67. For the
RTI reaction time, it was 0.78. The estimation results of the stability model for RVP
A’ is presented in Figure 5. The goodness-of-fit statistics of the constrained model
for RVP A’ were reasonably good (χ2 (10) = 17.94 (10) p = 0.06, CFI = 0.91, TLI =
0.87, RMSEA = 0.06, SRMR = 0.25. The stability coefficient for RVP A’ was 0.62.
Conclusions. Internal consistency was acceptable only in the RTI task. Oneyear stability was moderate-to-good for the PRM, RTI, and RVP. The SSP and IED
showed a moderate correlation between the two measurement points. The SRM and
SOC tasks were not reliable or did not provide stable measurements in this study
population when comparing two measurements that were conducted one year apart.
For research purposes, when using these tests, structural equation modelling is recommended to improve reliability. The results suggest that the reliability and stability of computer-based test batteries should be confirmed in the target population
before using them for clinical or research purposes.
FIGURE 3.
Estimation results of the stability model of the Pattern Recognition Memory
(PRM) test for 2011 and 2012. Standardized parameter estimates and standard errors are presented. Three parcels from 24 patterns (incorrect/correct
response) of the PRM test were constructed and used as indicator variables
in the confirmatory factor analyses (PRM 1, PRM 2, PRM 3). All the factor loadings were constrained to be equal to one.
49
FIGURE 4.
Stability model for the Reaction Time (RTI) test for 2011 and 2012. Standardized parameter estimates and standard errors are presented. For structural
equation modelling, three sub-categories of the reaction time (Reac 1, Reac 2,
Reac 3) and movement time (Move 1, Move 2, Move 3) at both measurement
points were formed from 15 patterns of RTI. All the factor loadings were constrained to be equal to one.
50
FIGURE 5.
Stability model for the Rapid Visual Information Processing (RVP) test for
2011 and 2012. Standardized parameter estimates and standard errors are
presented. The RVP (multiplied by 10) of the three blocks of the test (RVP 1,
RVP 2, RVP 3) were used as indicator variables in structural equation modelling. Factor loadings were constrained to be equal across time points.
51
4.3 Study III: The associations of objectively measured physical
activity and sedentary time with cognitive functions in
school-aged children
Purpose of the study. The main purpose of the Study III was to examine how objectively measured and self-reported physical activity and sedentary behaviour are
associated with performance in cognitive tests, measuring visual memory, executive
functions and attention in school-aged children. It was hypothesized that physical
activity is positively, and sedentary behaviour inversely, associated with cognitive
functions.
Methods. On the basis of the results of Study II, which reported the reliability
and stability of the CANTAB tests, the following five cognitive tests were chosen for
this study: Pattern Recognition Memory (PRM), Spatial Span (SSP), Intra-Extra Dimensional Set Shift (IED), Reaction Time (RTI) and Rapid Visual Information Processing (RVP). The cross-sectional associations of self-reported physical activity and
screen time and objectively measured physical activity and sedentary time with cognitive functions were examined with structural equation modelling.
Results. A high level of objectively measured MVPA was associated with good
performance in the RTI test (Table 6). A high level of objectively measured sedentary time was associated with good performance in the RVP test (Table 6). Objectively measured MVPA and sedentary time were not associated with other measures
of cognitive functions. A high amount of self-reported computer or video game play
was associated with weaker performance in the SSP test (Table 6), whereas a high
amount of computer use was associated with weaker performance in the IED test
(Table 7). Self-reported physical activity, total screen time, and television viewing
were not associated with any measures of cognitive functions.
Conclusions. In this study, objectively measured physical activity and sedentary time were positively associated with attentional processes, but not with other
measured domains of cognitive functions. Self-reported computer and video game
playing was negatively associated with working memory capacity, whereas computer use was negatively associated with shifting and flexibility of attention. Selfreported physical activity and total screen time were not associated with any of the
cognitive tests used to measure visual memory, executive functions or attention in
children. The results of the present study suggest that physical activity may benefit
attentional processes, but excessive video game playing and computer use may have
unfavourable effects on cognitive functions.
52
TABLE 6.
Associations between children’s cognitive processes and objectively measured physical activity, sedentary time and self-reported screen time.
Explanatory variables
Objectively measured MVPAa
Objectively measured sedentary timeb
Objectively measured MVPA
Objectively measured sedentary time
Self-reported viewing of TV
Self-reported playing of computer/video
game
Self-reported use of computer (other than
playing)
Cognitive test
SE
95% CI
Pf
Reaction Time (RTI)c
-0.130
0.062 -0.253, -0.008
0.037
-0.041
0.074 -0.186, 0.104
0.581
Rapid Visual Information Processing (RVP)d
-0.040
0.093 -0.223, 0.143
0.669
0.305
0.078
0.153, 0.457
0.000
e
Spatial Span (SSP)
-0.003
0.067 -0.134, 0.129
0.970
-0.179
0.079 -0.333, -0.024
0.023
B
0.094
0.068
-0.040, 0.227
0.171
Abbreviations: B, estimate; SE, standard error; CI, confidence interval; p, p-value; MVPA, moderate
to vigorous physical activity.
a RTI measures children’s reaction times and speed of response to a visual target in milliseconds,
where faster time indicates better performance.
b MVPA measured with the ActiGraph accelerometer using a cut-off value of 2,296 counts per minute
and expressed as min/day.
c Sedentary time measured by the ActiGraph accelerometer using a cut-off value of 100 counts per
minute and expressed as percentage of daily monitoring time (%/day).
d RVP measures sustained attention. The score of this task is RVP A’, where range is 0.00 to 1.00; bad
to good.
e SSP measures length of working memory span. The score of this task is the maximum number of
items that the child can successfully remember.
f P-values for parameter estimates.
Models have been adjusted by gender (female), the highest level of parental education (tertiary) and
the child’s need for remedial education.
53
TABLE 7.
Associations between children’s working memory capacity and selfreported screen time.
Explanatory variables
Self-reported viewing of TV (h/day)b
Self-reported playing of computer/video games
(h/day)b
Self-reported use of computer (other than playing)
(h/day)b
Cognitive test
Intra-Extra Dimensional Set Shift (IED) a
OR
95% CI
0.868
0.623, 1.210
1.321
0.943, 1.850
0.639
0.421, 0.972
Abbreviations: OR, odds ratio; CI, confidence interval.
a IED measures sifting and flexibility of attention and was categorized as 1) children who completed
the test and 0) children who did not complete the test.
b Self-reported viewing of television, playing of computer/video game and use of computer (other
than playing) are treated as continuous variables and expressed as h/day.
Model has been adjusted by gender (female), the highest level of parental education (tertiary) and
the child’s need for remedial education.
54
5
DISCUSSION
In the present study, the associations of physical activity and sedentary behaviour
with academic achievement and cognitive functions in school-aged children were
examined. Self-reported physical activity an inverse U-shaped curvilinear relationship and total screen time had an inverse linear negative relationship with academic
achievement (teacher-rated GPA), whereas objectively measured physical activity
or sedentary time had no association with academic achievement. High levels of objectively measured physical activity and sedentary time were associated with good
attentional performance, but not with other domains of cognitive functions. Self-reported physical activity or total screen time had no association with assessed cognitive functioning. High levels of self-reported computer/video game play was associated with low visuospatial working memory performance, whereas high levels of
computer use was associated with low shifting and flexibility of attention performance. Self-reported TV viewing had no association with any domains of cognitive
functions.
In addition, the internal consistency and stability of the seven CANTAB tests
(PRM, SRM, SSP, SOC, IED, RTI, RVP) measuring visual memory, executive functions
and attention were examined. Internal consistency was acceptable only in the RTI
test. One-year stability was moderate-to-good for PRM, SSP, IED, RTI and RVP. The
SRM and SOC were not reliable or did not provide stable measurements in the present study sample of 12-year-old healthy children.
5.1 Physical activity, academic achievement and cognitive
functions
The results of the present study are in line with previous studies reporting that selfreported physical activity is associated with high levels of academic performance
(Stevens et al. 2008, Fox et al. 2010, Kantomaa et al. 2010, Kantomaa et al. 2013). In
addition, a few previous intervention studies have reported physical activity benefitting academic performance (Donnelly et al. 2009, Davis et al. 2011, Ardoy et al.
2014). However, in the present study the relationship between self-reported MVPA
and academic achievement was curvilinear. It seems that 5–6 times/week may be
the optimal amount of MVPA for academic achievement. It is possible that some of
the most active children spend time engaged in physical activities at the expense of
time devoted to homework.
According to the results of the present study, objectively measured MVPA was
not associated with academic achievement supporting the study by LeBlanc et al.
(2012). In contrast, Kwak et al. (2009) reported that objectively measured vigorous
physical activity was positively associated with academic achievement in 16-yearsold girls, but not boys. In addition, according to Booth et al. (2014), objectively measured MVPA at the age of 11 predicted increased mother tongue performance at the
age of 11, 13 and 16 for both girls and boys, and increased science performance at
the age of 11 and 16 for girls. The differences between these studies may be due to
slight differences in the age of the study populations and the collection and reduction decisions of objective MVPA data. In addition, in these studies, if children had
55
valid data over a minimum of 2–3 days, they were included in the analysis. Physical
activity varies depending on days, whereupon a measurement period of 2–3 valid
days may not be long enough to fully capture habitual physical activity. This may
partly explain differing results between studies concerning the association with academic achievement. Furthermore, even though Kwak et al. (2009) and Booth et al.
(2014) observed significant associations, the effect sizes and β coefficients were
quite modest. Booth et al. (2014), however, speculated that results must be interpreted in context. Thus, in the Western world, where the levels of MVPA are quite
low, increasing MVPA to reach an average of 60 minutes per day may result in bigger
increases in academic achievement (Booth et al. 2014). Reflecting the discussion
above to the results of self-reported physical activity, it seems that physical activity
is an important factor affecting academic achievement, but it is not the whole story.
There are also other factors affecting academic achievement, and the association between physical activity and academic achievement.
According to the present results, a high level of objectively measured physical
activity was associated with better performance in attention test measuring reaction time and speed of response to unpredictable stimulus. Previous studies have
suggested that physical activity enhances especially inhibitory control of attention
(Castelli et al. 2011, Davis et al. 2011, Fisher et al. 2011, Chaddock-Heyman et al.
2013, Spitzer & Hollmann 2013, Crova et al. 2014). However, Puder et al. (2011)
reported that physical activity intervention had no effect on children’s selective attention. In addition, in the studies of Davis et al. (2011) and Fisher et al. (2011) physical activity had no effect on performance in attention scale of the Cognitive Assessment System, even though physical activity enhanced attentional inhibition performance in the antisaccade task and the Attention Network Test, respectively. Despite
the earlier studies have shown that physical activity enhances inhibitory control of
attention, our results suggest that physical activity may also affect lower-order levels of attention.
The present results also showed that neither objectively measured nor selfreported physical activity was associated with visual memory, spatial working
memory, shifting and flexibility of attention or sustained attention performance.
Earlier studies have also reported that physical activity is not necessary associated
with all domains of cognitive functioning, but may selectively affect executive functions and especially inhibitory control (Davis et al. 2011, Drollette et al. 2012). However, the study designs with varying age of the children as well as, the definitions,
patterns and measurements of cognitive functions and physical activity, which have
varied across different studies, potentially contribute to the divergent results.
In the present study, the lack of association between physical activity and performance in cognitive tests may be partly due to the observation that some of the
cognitive tests were not able to differentiate healthy 12-year-old children. Especially in the tests of visual memory (PRM), shifting and flexibility of attention (IED)
and sustained attention (RVP), on average, children achieved very good performance. Neuropsychological test batteries were originally developed to detect largescale neurocognitive deficits, and thus, the selected tests may have been too easy to
detect subtle differences in health behaviours in healthy children. Stroth et al. (2009)
speculated that one reason behind their result of aerobic fitness not being associated with children’s performance in cognitive control tasks was the ceiling effect in
the selected cognitive tests.
56
5.1.1 Possible mechanisms explaining the associations between physical
activity, academic achievement and cognitive functions
The positive association of physical activity with academic achievement and cognitive functions may be mediated by a few possible mechanisms. Physical activity may
induce functional (Davis et al. 2011, Chaddock-Heyman et al. 2013) and structural
(Chaddock et al. 2010a, Chaddock et al. 2010b) changes in the brain areas subserving executive functions and memory, such as hippocampus and the basal ganglia,
thereby enhancing especially executive functions and memory. Physical activity has
also been reported to increase levels of brain-derived neurotrophic factor (BDNF),
supporting cellular processes important for learning and memory (Hopkins et al.
2012, Gomez-Pinilla & Hillman 2013). Moreover, physical activity has been shown
to enhance cerebrovascular function (Brown et al. 2010).
Motor function has been closely connected to children’s cognitive and academic skills and development (Iverson 2010, Davis, Pitchford & Limback 2011,
Haapala et al. 2014b), and it may be an important driver in the effects of physical
activity on cognitive prerequisites of learning (Kantomaa et al. 2013). In addition,
some physical activities are cognitively challenging and may, therefore, facilitate
cognitive function and academic performance (Best 2010, Crova et al. 2014). Obesity
is another potential mediator: physical inactivity may lead to obesity, and obesity
has been linked to poorer academic (Kantomaa et al. 2013) and cognitive performance (Burkhalter & Hillman 2011). Furthermore, unhealthy diet, especially overconsumption of high-caloric foods may attenuate cognitive functions via diminishing BDNF and interfering energy homeostatis (Vaynman & Gomez-Pinilla 2006,
Gomez-Pinilla 2011).
Participation in physical activities is often a social phenomenon offering opportunities for interaction with other children and adults, and this interaction may
also have a significant impact on children’s cognitive development and learning.
However, social interaction as a mediator between physical activity and cognitive or
academic skills is rarely studied (Hillman, Erickson & Kramer 2008). Finally, different psychosocial factors like school contentment and self-esteem may mediated the
association between physical activity and academic achievement (Kristjansson et al.
2009, Kristjansson, Sigfusdottir & Allegrante 2010).
5.1.2 Differences between objectively measured and self-reported
physical activity in terms of their association with academic
achievement and cognitive functions
In the present study, the associations of self-reported and objectively measured
physical activity with academic and cognitive performance were inconsistent. These
inconsistencies may be due to differences between subjective and objective measurements of physical activity. Self-reported questionnaires have been accepted as
capable of measuring physical activity (Shephard 2014). However, especially when
it comes to children, it may be difficult to estimate one’s overall physical activity. In
the study by Corder et al. (2010), 40% of inactive children aged 10 years old overestimated their physical activity compared to the objective measurement.
57
On the other hand, accelerometers are not capable of assessing all physical activities, such as swimming and cycling or activities that require lifting any kind of
load (Strath et al. 2013). In addition, skill-specific types of physical activities based
on body movements are common among children, but may not be seen in activity
counts. For example, skateboarding is a skill-specific physical activity requiring balance and agility, yet it hardly accumulates activity counts. Thus, accelerometermeasured MVPA mainly illustrates cardiovascular activity with increased heart rate
and respiratory frequency, while self-reported MVPA may represent different constructs and contexts of physical activity. These differences may explain inconsistent
results between self-reported and objectively measured MVPA in association with
academic achievement and cognitive functions.
5.2 Sedentary behaviour, academic achievement and cognitive
functions
The present results, which show a negative association between self-reported
screen time and academic achievement, are consistent with those of previous studies (Sharif & Sargent 2006, Mößle et al. 2010, Sharif, Wills & Sargent 2010). In addition, the present results also support some of the earlier studies (Dworak et al. 2007,
Swing et al. 2010) by showing that excessive video game play and computer use
were associated with weaker performance in cognitive tests measuring working
memory and shifting and flexibility of attention. However, in the present study, TV
viewing had no association with cognitive functions, contrary to earlier studies in
which excessive TV viewing has been connected to attention and learning difficulties
(Johnson et al. 2007, Landhuis et al. 2007, Mizuno et al. 2012). In addition, total
screen time was not associated with cognition, which is in line with other previous
studies reporting no such association (Weis & Cerankosky 2010, Ferguson et al.
2012). However, earlier studies have reported screen time benefitting academic
performance (Borzekowski & Robinson 2005, Jackson et al. 2006, Bittman et al.
2011, Jackson et al. 2011, Haapala et al. 2014a) and cognitive functions (Dye, Green
& Bavelier 2009, Spence & Feng 2010, Boot, Blakely & Simons 2011, Granic, Lobel &
Engels 2013).
In sum, the results of the present study both support and contradict the earlier
studies, showing that associations of screen time with cognitive and academic performance are complicated and still need clarification. These inconsistencies may be
partly due to the varying designs across the studies. Especially, the age of the children is crucial: the role of screen time may be different for children in different developmental stages. For example, in Haapala et al.’s (2014a) study, television viewing had no association with academic skills and high levels of computer use and
video game playing were associated with better academic skills in six to eight years
old children. In contrast, in our study, high levels of screen time were associated
with lower levels of academic achievement in 11–12-year-old children, suggesting
that the effects of screen time on academic achievement may become emphasized in
older children. In addition, the amount of screen time may be an important factor:
in some studies, screen time (such as video game playing) showed benefits in cognitive functions (Dye et al. 2009). In the present study, some children spent excessive
58
amounts of time in front of screens in their free time: one fifth of the children reported having screen time of about five or more hours per day. Excessive amounts
of screen time might partly explain the results suggesting that screen time is harmful
to academic achievement and cognition.
Excessive screen time may attenuate academic performance and cognitive
functions through different mediators. Shin (2004) reported that television viewing
hindered children’s academic achievement through three different pathways: time
displacement, effort-passivity and attention-arousal. The time displacement theory
suggests that time spent in front of a screen takes time away from intellectually demanding activities, such as doing homework and reading books, which may independently affect academic performance. Screen time is more attractive to children
than school-related activities displacing comparable activities that involve learning
opportunities. The effort-passivity theory hypothesizes that television watching
does not require mental effort, which leads to mental laziness and passivity. Thus,
children are more likely to find their way in front of television programmes that are
entertaining and easy to understand, rather than engaging in activities that require
intellectual functions, such as reading, and that this eventually leads to a decrease
in academic achievement. The attention-arousal theory proposes that exposure to
television programmes leads to superficial intellectual processing and impulsive behaviours, increasing attention difficulties and hindering academic achievement. In
sum, Shin (2004) suggests that excessive amounts of screen time may displace activities involving learning opportunities and increase children’s impulsive behaviour, with the result of eventually decreasing academic skills.
In addition, according to Sharif, Wills and Sargent (2010), screen exposure has
an indirect effect on academic performance through increased sensation-seeking.
The sensation-seeking theory touching on the time displacement and attentionarousal theories propose that there may be certain dispositions in media use, especially intense and exciting sensations, which increase desire for these kinds of experiences and are incompatible with concentrated efforts, such as reading and writing.
Furthermore, attention difficulties, frequent failure to do homework, negative attitudes toward school, substance use and behaviour problems have been reported to
mediate the association between television viewing and academic performance
(Johnson et al. 2007, Sharif, Wills & Sargent 2010).
The disadvantages and benefits of screen-based sedentary behaviour on cognitive functions and academic achievement may be explained by content of screen
time, as not all types of screen time have an equal role in benefitting or impairing
children’s cognitive skills and learning (Kirkorian, Wartella & Anderson 2008,
Schmidt & Vandewater 2008). This might also explain the divergent results of the
studies. According to Ennemoser and Schneider (2007), educational programme
viewing was positively correlated with reading speed and comprehension in children, yet entertainment programme viewing was negatively correlated. Feng,
Spence and Pratt (2011) reported that action-game training in young adults improved performance and attenuated gender differences favouring males in spatial
attention tests, while non-action-game playing among control subjects had no effect
on attention performance.
Kühn et al. (2013) reported that video game playing may induce structural
brain plasticity in the areas important to spatial navigation, strategic planning,
59
working memory and motor performance, which may explain the positive association between screen time and cognition. On the other hand, according to Drowak et
al. (2007), interactive computer game play, but not viewing exciting films, resulted
in significant declines in verbal memory performance and slow wave sleep, which is
important for memory consolidation. Finally, it should be kept in mind that computer-based cognitive assessments may require similar cognitive skills as video and
computer games, which would favour children who play a lot of video and computer
games. The skills will develop, which are practised.
To our knowledge, this was the first study that examined associations of objectively measured sedentary time with academic performance and cognitive functions. In the present study, objectively measured sedentary time was not associated
with academic achievement, but had a positive association with performance in sustained attention test: children who spent more time being sedentary had higher
scores in sustained attention test. This might be due to the objective measurement
of sedentary time, which is a summary measure of all kinds of sedentary behaviour
– including a range of various activities, such as screen time, reading, homework,
interaction with friends, et cetera – but is unable to differentiate between types of
sedentary behaviour. It is reasonable to suggest that some of these sedentary activities (e.g. homework and reading) benefit learning, cognition and academic achievement.
5.3 Methodological considerations
5.3.1 General strengths and limitations
To our knowledge, this was the first study to examine the associations of both objectively measured and self-reported overall physical activity and sedentary behaviour on teacher-rated academic achievement and cognitive functions. From the perspective of physical activity, our study sample was quite large and representative,
and showed comparable levels of physical activity in Finnish school-aged children
to those reported in international results (Currie et al. 2012). The study design was
cross-sectional and, therefore, conclusions regarding the causality of the observed
associations cannot be drawn. Furthermore, pubertal timing, motor skills and fitness were not assessed in this study, which limits the interpretation of the results,
especially concerning cognitive functions.
This was also the first study to examine the internal consistency and one-year
stability of CANTAB tests in healthy 12-year-old children, and thus it provided valuable and important information on the psychometric characteristics of CANTAB
tests in a child population. The number of children in the follow-up measurements
in 2012 was limited, which attenuated statistical power. However, there were no
significant differences in the CANTAB tests according to socioeconomic status or
performance between children with complete data and children who did not participate in the follow-up measurements. In addition, the models were estimated with
FIML estimation, which uses all information available and takes missing data into
account.
From the perspective of psychometric characteristics, the age-range of the
children studied was narrow limiting the generalization of the results to different
60
age groups or developmental stages. Furthermore, the study sample was culturally
homogeneous including only Finnish children. It was also not possible to calculate
intra-class correlations for the CANTAB tests, because the performance of the children was not measured again immediately after the first measurement. Several
measurement points during the year would have given more accurate information
on the effects of practice on performance in the tests.
5.3.2 Measurement of physical activity and sedentary behaviour
The questions used in the present study to assess self-reported physical activity and
sedentary behaviour were taken from the WHO HBSC study (Currie et al. 2012).
These questions have been commonly used. Test-retest agreement has been very
good for MVPA (Booth et al. 2001, Liu et al. 2010), substantial for TV viewing and
computer and video game playing (Liu et al. 2010), and moderate for computer use
(Liu et al. 2010).
One of the main weaknesses of self-reports is accuracy due to recollection and
social desirability biases. For example, according to Corder et al. (2010), children
overestimated their physical activity levels compared to objectively measured physical activity. In addition, in the present study, self-reported physical activity was assessed with only one question. The question was worded so that it assesses overall
MVPA during the day. However, children may not include brief spurts or incidental
physical activity in overall MVPA when answering this question. Furthermore, the
detailed content of screen-based sedentary behaviour was not assessed, which limits the interpretation of the results regarding screen-based sedentary behaviour.
Moreover, time spent doing homework, reading, or performing other activities that
may benefit academic achievement and cognition was not investigated, limiting a
more precise examination of total sedentary behaviour.
Children’s physical activity and sedentary time were also measured objectively with an accelerometer, and accelerometers have been considered to provide
more accurate measurement than self-reports (Evenson et al. 2006). However, accelerometers do not measure all kinds of activities, such as swimming, cycling, or
similar activities (Strath et al. 2013). Specifically, accelerometers that are worn on
the hip, do not capture activities where load-lifting is performed (Strath et al. 2013),
and do not differentiate between sitting and standing (Skotte et al. 2014). Furthermore, in the present study, children wore an accelerometer for seven days, which
may not have been long enough to capture their normal physical activity.
5.3.3 Measurement of academic achievement
In this study, teacher-rated academic achievement scores were used to assess children’s academic performance. Grading given by teachers enables more comprehensive evaluations of children’s academic performance, compared to grading that is
based solely on standardized tests. At the same time, however, grading by teachers
may result in discrepancies in grades between students (from different classes or
schools) with the same level of competence. Therefore, a comparison of children’s
academic achievements is not accurate if the objectives of the national curriculum
61
for each grade are not carefully followed and teachers let their biases affect grading.
(Ouakrim-Soivio 2013).
5.3.4 Measurement of cognitive functions – Reliability and stability of
cognitive test battery (CANTAB)
Neurocognitive performance of children was assessed with the Cambridge Neuropsychological Test Automated Battery (CANTAB). There are a lot of advantages in
computerized testing: computer technology has increased the efficiency, ease, and
standardization of administration and saved time and money related to testing. Electronic data capture and automatic results scoring have minimized human errors in
scoring and data entry and increased the accuracy of timing and response latencies.
(Cernich et al. 2007, Parsey & Schmitter-Edgecombe 2013). Other advantages of
computerized technology – particularly for the measurement of attention, motor,
and memory functioning – are the availability of almost unlimited alternate forms
and an increased number of trials. This minimizes practice effects and allows more
assessments at shorter time intervals compared to traditional measures. A large
number of trials and accurate assessment of reaction times results in data that is
normally distributed and on a true interval scale (Betts et al. 2006). This is particularly important when slight changes in performance across time are assessed.
Computer technology also provides test administration conditions that are accommodating for individuals with particular needs (American Educational Research
Association et al. 2014). Touch-screen technology facilitates use by young children
and certain clinical groups, and allows more reliable assessment of motor function
and processing speed compared to traditional measures using an individual administrator wielding a stopwatch. In addition, non-verbal culture-neutral test stimuli
are often used, which allow the application of computerized test batteries (like CANTAB) for individuals from different racial, ethnic, geographic, or sociocultural backgrounds. (Luciana 2003, Henry 2010). CANTAB also has simple standardized test
administration; thus, it is easy to use and no previous IT or scientific training is
needed to set-up and administer the test (Cambridge Cognition Ltd. 2006). However,
there is limited information about the psychometric properties of CANTAB and
other computerized batteries.
This study was one of only a few studies to measure the psychometric properties of CANTAB tests, especially in children. Our results, which show that the internal
consistency of certain CANTAB tests (PRM, SRM, RVP) was quite low and acceptable
only for the RTI test, do not support the study by Luciana et al. (2003), who reported
that the internal consistency of CANTAB tests has been uniformly high in 4–12-yearold children. Internal consistency could not be determined for IED or SSP because of
the hampering nature of these tests. The results of the present study are in line with
previous studies measuring the test-retest stability of CANTAB tests in both children
(Gau & Shang 2010, Fisher et al. 2011) and adults (Lowe & Rabbitt 1998, Henry &
Bettenay 2010). In this study, one-year stability was moderate in certain tests (PRM,
SSP, IED, RTI, RVP). However, earlier studies measured test-retest correlation with
a time-interval of a few weeks, whereas in the present study the time-interval was
approximately one year. In the present study, SRM and SOC were not reliable or stable measures in healthy 12-year-old children over one year period.
62
Low internal consistency might be a result of the ceiling effect, especially in the
case of PRM and RVP. In these tests, children have been reported to reach ceiling
levels by the age of 7 and after 10 years of age, respectively (Halperin et al. 1991,
Luciana & Nelson 2002). In addition, in the present study, 12-year-old healthy children reached ceiling levels also in the IED test, which is in line with earlier studies
(Luciana & Nelson 1998, Anderson 2002, Luciana & Nelson 2002). Thus, when ceiling levels are reached, the errors the children do may be sparse and random, which
may explain why the patterns of the tests do not have a high correlation with each
other. It may be problematic to discriminate children with high ability and internal
consistency may be affected.
Stability could also be affected by the ceiling effect and a long test-retest interval. In this study, stability was measured with a one-year interval. It is to be expected
that the cognitive abilities of 11-year-old children develop over the course of a year.
Therefore, measuring their performance twice – in the beginning with a shorter interval between the measurements – would have enabled calculation of test-retest
reliability, thus ruling out developmental effects.
The SOC test, which measures spatial planning and spatial working memory,
and is identical to the traditional Tower of London task, did not measure the phenomena it was supposed to with satisfying reliability. Previous studies have also
raised questions about the psychometric characteristics of both traditional and
CANTAB versions of this test: previous studies have reported low internal consistency (Humes et al. 1997, Ahonniska et al. 2000) and test-retest reliability (Lowe
& Rabbitt 1998, Bishop et al. 2001). However, temporal stability has also been reported to be acceptable (Gnys & Willis 1991, Ahonniska et al. 2000, Gau & Shang
2010). Both large intra-individual variation due to different rates of learning and
task novelty have been suggested as explanations for low reliability and stability
(Lowe & Rabbitt 1998, Ahonniska et al. 2000). Children’s performance in the SOC
test improves approximately at the age of 11 years due to developmental spurt (Anderson, Anderson & Lajoie 1996). In addition, performance in the tests of executive
function can abruptly improve when an individual discovers an optimal strategy,
but there is less or no chance in performance if a strategy is not found, and it may
even decline if an incorrect strategy is attempted (Lowe & Rabbitt 1998). In the present study, 58% showed improved performance, and 31% showed a decline in performance. These different practice effects may weaken test-retest reliability (Lowe
& Rabbitt 1998).
CANTAB tests as well as other computer-based tests are based on traditional
neuropsychological tests. However, a few studies have shown that the computerized
versions of the tests are not equivalent to traditional ones (Feldstein et al. 1999,
Smith et al. 2013). The reason for these findings is unknown, and it can only be speculated that computerized test sessions are more prone to attentional disruptions
than manual sessions, or they may not offer similar perceptual characteristics as
manual versions.
Despite the potential advantages that computerized technology offers for neuropsychological testing – especially the ease of building ready algorithms for calculating indexes and scores – computer-assisted assessment also produces a risk factor. Due to commercial competitive reasons, the companies providing these tools
may not always publish detailed information about these algorithms or the psychometric properties of the tasks. The general characteristics of scoring algorithms and
63
the accuracy of the algorithms as well as technical evidence should be documented
and reviewed periodically (American Educational Research Association et al. 2014).
According to the Finnish Psychological Test Committee (2013), test batteries (computerized or not) that do not provide a satisfactory level of information about the
psychometric properties of the tasks in the technical manual should not be used in
clinical practice. Likewise, in clinical practice, an expert (a psychologist or an MD)
should always do the interpretation of the test results. There are two reasons for
this. First, to use CANTAB or other computerized test batteries, there needs to be a
person who supervises and paces the introduction of tests and monitors the assessment process (Luciana 2003, American Educational Research Association et al.
2014). Secondly, the interpretation and the clinical conclusions and decisions made
based partly on the test results produce a juridical situation where there needs to
be a responsible decision-maker. Most countries do not allow automated decisionmaking in healthcare.
There will be rapid growth in the usage of computer-assisted test batteries.
However, little is known about the psychometric properties of computerized batteries as well as how performance on computerized batteries correlates with traditional neuropsychological measures. In addition, it is also vital to have more information about the reliability and validity of these batteries in all clinical target populations of interest as well as in samples derived from the normal population.
64
6
CONCLUSIONS
6.1 Summary and main conclusions
The main findings and conclusions of each aim of the study can be summarized as
follows:
1. Self-reported (but not objectively measured) physical activity and screenbased sedentary behaviour were associated with academic achievement in
school-aged children. Self-reported MVPA had an inverse curvilinear relationship with the grade point averages of school subjects, while self-reported
screen time had an inverse linear relationship with grade point averages. Objective and subjective measurements may reflect different constructs and
contexts of physical activity and sedentary behaviour in association with academic outcomes.
2. The internal consistency of most of the seven CANTAB tests used in this study
was below the accepted level of 0.7. The one-year stability of most tests was
moderate-to-good. In addition, in the present study population of 12-yearold healthy children, the ceiling levels were reached in the PRM, IED, and RVP
tests. The psychometric characteristics of traditional neuropsychological
tests may be lost when converted into computer form; this should be confirmed among target populations before using computer-based test batteries
for clinical or research purposes. The results of the present study suggest
that the use of structural equation modelling would improve the reliability of
these tests when using them in research analysis.
3. High objectively measured physical activity and sedentary time were associated with good performance in the test measuring attentional processes, but
not in the tests related to other domains of cognitive functioning. Self-reported physical activity, total screen time or television viewing were not associated with any of the cognitive tests measuring visual memory, executive
functions or attention in children. High self-reported time spent in computer
or video game play and computer use was associated with poor performance
in the tests measuring visuospatial working memory and shifting and flexibility of attention, respectively. The results of the present study suggest that
physical activity may benefit some attentional processes. However, excessive
video game play and computer use may have an unfavourable influence on
some cognitive functions. However, all sedentary time is not harmful to cognition, but may include activities that benefit certain cognitive functions.
65
6.2 Implications and future directions
This doctoral thesis provide important information about the associations of physical activity and sedentary life with cognitive functions and academic performance in
Finnish school-aged children, in order for both practitioners and policy-makers to
better develop learning, education and health in the Finnish school system. The topic
is highly relevant and currently important. The results suggest that in Finland, which
has an educational system of high quality and equality, physical activity may enhance some attentional processes and academic achievement, whereas excessive
screen-based sedentary behaviour may attenuate them.
As physical inactivity among children is increasing worldwide, physical activity that benefits both health and learning is becoming an important part of education.
The enhancement of physical activity in school settings has recently also been the
focus of Finnish Sport policy aimed at improving the health and well-being of young
people. Almost every Finnish child conducts their compulsory education in school,
spending plenty of time there during the week. Thus, schools play an important role
in encouraging children to be more physically active, both at school and outside
school hours. As learning is the centre of action at school, research that shows a positive association between physical activity and learning may also pique the interest
of parents and teachers who are not into physical activity themselves.
A few studies have also shown that both acute exercise and chronic physical
activity enhances cognitive performance, especially in children with ADHD (Verret
et al. 2012, Pontifex et al. 2013) and in children with weaker cognitive performance
(Reynolds & Nicolson 2007, Drollette et al. 2014). This important observation may
significantly contribute to children’s learning and well-being in schools. Providing a
learning environment where physical activity is implemented in alignment with
learning objectives, may establish new opportunities to support learning and individual development.
There are many options when integrating physical activity in the school day.
However, it is important that physical activity is implemented in a manner that supports adoption of a physically active lifestyle. This is especially important, because
physical activity in childhood and adolescence predicts physical activity in adulthood (Telama et al. 2014). Creating positive physical activity patterns that offer
good experiences and support autonomy, competence and relatedness in childhood
enhances physical activity over the course of one’s entire life (Hirvensalo & Lintunen
2011). Promoting a physically active lifestyle may also support lifelong academic
and cognitive performance and learning.
Although, excessive screen time may have unfavourable effect on academic
performance and cognition, a reasonable amount of video game play and computer
use may benefit them (Bittman et al. 2011, Boot, Blakely & Simons 2011, Jackson et
al. 2011, Granic, Lobel & Engels 2013). Today, exergames that combine physical activity and video games are popular, and they are considered to provide one possible
way to decrease children’s excessive sedentary behaviour (Staiano & Calvert 2011).
In addition, exergaming may also enhance cognitive functions, especially executive
functions compared to non-players (Staiano, Abraham & Calvert 2012). These kinds
66
of approaches, which combine physical activity and media use, may make important
contributions to future learning environments. The advance of comprehensive approaches may support children’s physical, psychological and social growth, as well
as development and learning.
Although research examining the association of physical activity and sedentary behaviour with academic and cognitive performance has increased during recent years, the studies, including the current thesis, have mainly been cross-sectional. Thus, studies with longitudinal study designs and randomized controlled trials are needed to clarify the causal relationship of these variables.
In addition, it would be valuable in future studies to specify the mechanisms
mediating and underlying these associations. The few studies to date concerning
these mechanisms have largely focused on physiological and neural mechanisms
like cerebrovascular function, levels of growth factors and neural activity in the
brain, which are very important factors for explaining the relationship between
physical activity and cognition and academic performance. However, in the future,
social interaction and context-related factors should also be considered and taken
into account. The mechanisms and mediators behind the association between sedentary behaviour and cognitive and academic performance may be even more complicated and in need of clarification.
Furthermore, more information is needed not only on the amount but also the
types and contexts of physical activity and sedentary behaviour, which affect academic performance and specific kinds of cognition. It would be important to examine the dose-response relationship of both physical activity and screen-based sedentary behaviour with academic achievement and cognitive functions.
This study provides important insight into inconsistencies between self-reported and objective measurements of physical activity and sedentary time in association with academic and cognitive performance. The results of the present study
recommend that future studies use both subjective and objective measurements to
examine physical activity, sedentary behaviour, and academic achievement. In addition, a longer period of wearing the accelerometer and, preferably, several measurement points during the school year should be considered.
Only a few studies have measured a broad range of cognitive functions. The
associations between physical activity and different dimensions of cognitive functions are somewhat inconsistent, highlighting the need for new studies to clarify the
benefits of physical activity on a wide range of cognitive performance. In addition,
the definitions, patterns and measurements of cognitive functions have varied
across different studies, which makes it difficult to directly compare and summarize
the results of these earlier studies and to determine the specific benefits and disadvantages that physical activity and sedentary behaviour may have on cognitive functions.
The use of computerized test batteries to measure cognitive functions is increasing worldwide. As there are hardly any studies that assess the internal consistency and stability of these test batteries in a child population, and the results of
the present study suggest that the confirmation of psychometric properties of these
test batteries in the target population is highly important, more research is needed
67
to assess the reliability and stability of computerized test batteries. In particular,
research on different age groups and developmental stages is needed.
Technology, which is developing with dizzying pace imposes new challenges
also for research assessing the effects of screen-bases sedentary time. Children today are more familiar with different media devices than previous generations. In
Finland, 95% of 10–12-year-old children are estimated to have access to electronic
media at home (Suoninen 2013). This may have an influence on results concerning
cognitive functions, especially when computerized test batteries are used. In the future, it might be reasonable to use also other possible alternatives, such as everyday
real-world cognitive tasks that could differentiate children’s cognitive performance.
In addition, computers, tablets, and smartphones are always available, which
makes it difficult to assess how much time is spent in front of the screens. Furthermore, the dynamic nature of screen time and media use makes it difficult to predict
the longitudinal effects of screen time. For example, younger and younger children
use these technologies daily, so the effects of screen time may be significantly different for those two-year-old children (who develop with technology) when they are
of school age, than for school-age children now. Even two-year-old children today
have gained different experience from technology than two-year-old children two
years ago. The history of screen time may be one important factor to take into account in future studies assessing the association between screen time and cognition.
The results of this study indicate that physical activity is positively associated
and screen time inversely associated with academic performance and certain cognitive functions in children, supporting the importance of promoting physical activity
in school settings and a physically active lifestyle overall. In the future, research that
focuses on specifying, deepening and applying this information is needed.
68
REFERENCES
Ahamed, Y., MacDonald, H., Reed, K., Naylor, P., Liu-Ambrose, T. & McKay, H. 2007.
School-based physical activity does not compromise children's academic performance. Medicine and Science in Sports and Exercise 39 (2), 371–376.
Ahonniska, J., Ahonen, T., Aro, T., Tolvanen, A. & Lyytinen, H. 2000. Repeated assessment of the Tower of Hanoi Test: Reliability and age effects. Assessment 7 (3),
297–310.
American Educational Research Association, American Psychological Association,
National Council on Measurement in Education 2014. Standards for educational
and psychological testing. Washington DC: American Educational Research Association.
Anderson, D. R. & Collins, P. A. 1988. The impact on children's education: Television's influence on cognitive development. Working Paper No. 2, 1–98.
Anderson, O. R. 1997. A neurocognitive perspective on current learning theory and
science instructional strategies. Science Education 81 (1), 67–89.
Anderson, P. 2002. Assessment and development of executive function (EF) during
childhood. Child Neuropsychology 8 (2), 71–82.
Anderson, P., Anderson, V. & Lajoie, G. 1996. The tower of London test: Validation
and standardization for pediatric populatons. The Clinical Neuropsychologist
10 (1), 54–65.
Ardoy, D., Fernández-Rodríguez, J., Jiménez-Pavón, D., Castillo, R., Ruiz, J. & Ortega,
F. 2014. A physical education trial improves adolescents' cognitive performance
and academic achievement: The EDUFIT study. Scandinavian Journal of Medicine & Science in Sports 24 (1), 52–61.
Armstrong, N., Tomkinson, G. & Ekelund, U. 2011. Aerobic fitness and its relationship to sport, exercise training and habitual physical activity during youth. British Journal of Sports Medicine 45 (11), 849–858.
Ansley, T. 1997. The role of standardized achievement tests in grades K-12. In G. D.
Phye (Ed.), Handbook of classroom assessment: Learning, achievement, and adjustment. San Diego: Academic Press, 265–285.
Baars, B. J. & Gage, N. M. 2010. Cognition, brain, and consciousness: Introduction to
cognitive neuroscience. Academic Press.
Baddeley, A. 2012. Working memory: theories, models, and controversies. Annual
Review of Psychology 63, 1–29.
Baddeley, A. D. & Hitch, G. J. 1974. Working memory. The Psychology of Learning
and Motivation 8, 47–9.
Bandura, A. & McClelland, D. C. 1977. Social learning theory, Englewood Cliffs, NJ:
Prentice-Hall.
Barnes, J., Behrens, T. K., Benden, M. E., Biddle, S., Bond, D., Brassard, P., Brown, H.,
Carr, L., Chaput, J. & Christian, H. 2012. Letter to the Editor: Standardized use of
the terms “sedentary” and “sedentary behaviours”. Applied Physiology Nutrition and Metabolism 37 (3), 540–542.
Beentjes, J. W. & Van der Voort, T.H.A. 1988. Television's impact on children's reading. Reading Research Quarterly 23 (4), 389–413.
69
Best, J. R. 2010. Effects of physical activity on children’s executive function: Contributions of experimental research on aerobic exercise. Developmental Review
30 (4), 331–351.
Best, J. R. 2012. Exergaming immediately enhances children's executive function.
Developmental Psychology 48 (5), 1501–1510.
Best, J. R. & Miller, P. H. 2010. A developmental perspective on executive function.
Child Development 81 (6), 1641–1660.
Best, J. R., Miller, P. H. & Jones, L. L. 2009. Executive functions after age 5: Changes
and correlates. Developmental Review 29 (3), 180–200.
Betts, J., McKay, J., Maruff, P. & Anderson, V. (2006). The development of sustained
attention in children: The effect of age and task load. Child Neuropsychology 12
(3), 205–221.
Bishop, D., Aamodt-Leeper, G., Creswell, C., McGurk, R. & Skuse, D. 2001. Individual
differences in cognitive planning on the Tower of Hanoi task: Neuropsychological maturity or measurement error? Journal of Child Psychology and Psychiatry
42 (4), 551–556.
Bittman, M., Rutherford, L., Brown, J. & Unsworth, L. 2011. Digital natives? New and
old media and children's outcomes. Australian Journal of Education 55 (2), 161–
175.
Blackwell, A. D., Sahakian, B. J., Vesey, R., Semple, J. M., Robbins, T. W. & Hodges, J. R.
2004. Detecting dementia: Novel neuropsychological markers of preclinical Alzheimer's disease. Dementia and Geriatric Cognitive Disorders 17 (1–2), 42–48.
Blom, L., Alvarez, J., Zhang, L. & Kolbo, J. 2011. Associations between health-related
physical fitness, academic achievement and selected academic behaviors of elementary and middle school students in the State of Mississippi. Journal of Research 6 (1), 13–19.
Boot, W. R., Blakely, D. P. & Simons, D. J. 2011. Do action video games improve perception and cognition? Frontiers in Psychology 2.
Booth, J. N., Leary, S. D., Joinson, C., Ness, A. R., Tomporowski, P. D., Boyle, J. M. &
Reilly, J. J. 2014. Associations between objectively measured physical activity
and academic attainment in adolescents from a UK cohort. British Journal of
Sports Medicine 48 (3), 265–270.
Booth, M., Okely, A., Chey, T. & Bauman, A. 2001. The reliability and validity of the
physical activity questions in the WHO health behaviour in schoolchildren
(HBSC) survey: A population study. British Journal of Sports Medicine 35 (4),
263–267.
Borzekowski, D. L. G. & Robinson, T. N. 2005. The remote, the mouse, and the no. 2
pencil: The household media environment and academic achievement among
third grade students. Archives of Pediatrics & Adolescent Medicine 159 (7),
607–613.
Brown, A. D., McMorris, C. A., Longman, R. S., Leigh, R., Hill, M. D., Friedenreich, C. M.
& Poulin, M. J. 2010. Effects of cardiorespiratory fitness and cerebral blood flow
on cognitive outcomes in older women. Neurobiology of Aging 31 (12), 2047–
2057.
Buck, S. M., Hillman, C. H. & Castelli, D. M. 2008. The relation of aerobic fitness to
stroop task performance in preadolescent children. Medicine and Science in
Sports and Exercise 40 (1), 166–172.
70
Budde, H., Voelcker-Rehage, C., Pietraßyk-Kendziorra, S., Ribeiro, P. & Tidow, G.
2008. Acute coordinative exercise improves attentional performance in adolescents. Neuroscience Letters 441 (2), 219–223.
Burkhalter, T. M. & Hillman, C. H. 2011. A narrative review of physical activity, nutrition, and obesity to cognition and scholastic performance across the human
lifespan. Advances in Nutrition 2 (2), 201S–206S.
Caprara, G. V., Vecchione, M., Alessandri, G., Gerbino, M. & Barbaranelli, C. 2011. The
contribution of personality traits and self-efficacy beliefs to academic achievement: A longitudinal study. British Journal of Educational Psychology 81 (1),
78–96.
Carlson, S. A., Fulton, J. E., Lee, S. M., Maynard, L. M., Brown, D. R., Kohl, H. W.,3 rd &
Dietz, W. H. 2008. Physical education and academic achievement in elementary
school: Data from the early childhood longitudinal study. American Journal of
Public Health 98 (4), 721–727.
Caspersen, C. J., Powell, K. E. & Christenson, G. M. 1985. Physical activity, exercise,
and physical fitness: Definitions and distinctions for health-related research.
Public Health Reports 100 (2), 126–131.
Castelli, D. M., Hillman, C. H., Buck, S. M. & Erwin, H. E. 2007. Physical fitness and
academic achievement in third-and fifth-grade students. Journal of Sport & Exercise Psychology 29 (2), 239–252.
Castelli, D.M, Hillman, C.H, Hirsch, J., Hirsch, A. & Drollette, E. 2011. FIT Kids: Time
in target heart zone and cognitive performance. Preventive Medicine 52, S55–
S59.
Catering, M. C. & Polak, E. D. 1999. Effects of two types of activity on the performance
of second-, third-, and fourth-grade students on a test of concentration. Perceptual and Motor Skills 89 (1), 245–248.
Centers for Disease Control and Prevention. 2010. The association between schoolbased physical activity, including physical education, and academic performance. Atlanta, GA: U.S. Department of Health and Human Services.
Cernich, A. N., Brennana, D. M., Barker, L. M. & Bleiberg, J. 2007. Sources of error in
computerized neuropsychological assessment. Archives of Clinical Neuropsychology 22 (Suppl 1), S39–S48.
Chaddock, L., Erickson, K. I., Prakash, R. S., Kim, J. S., Voss, M. W., VanPatter, M., Pontifex, M. B., Raine, L. B., Konkel, A., Hillman, C. H., Cohen, N. J. & Kramer, A. F.
2010a. A neuroimaging investigation of the association between aerobic fitness,
hippocampal volume, and memory performance in preadolescent children.
Brain Research 1358, 172–183.
Chaddock, L., Erickson, K. I., Prakash, R. S., VanPatter, M., Voss, M. W., Pontifex, M. B.,
Raine, L. B., Hillman, C. H. & Kramer, A. F. 2010b. Basal ganglia volume is associated with aerobic fitness in preadolescent children. Developmental Neuroscience 32, 249–256.
Chaddock, L., Erickson, K. I., Prakash, R. S., Voss, M. W., VanPatter, M., Pontifex, M. B.,
Hillman, C. H. & Kramer, A. F. 2012a. A functional MRI investigation of the association between childhood aerobic fitness and neurocognitive control. Biological Psychology 89 (1), 260–268.
Chaddock, L., Hillman, C. H, Buck, S. M. & Cohen, N. J. 2011. Aerobic fitness and executive control of relational memory in preadolescent children. Medicine & Science in Sports & Exercise 43 (2), 344–349.
71
Chaddock, L., Hillman, C. H., Pontifex, M. B., Johnson, C. R., Raine, L. B. & Kramer, A. F.
2012b. Childhood aerobic fitness predicts cognitive performance one year later.
Journal of Sports Sciences 30 (5), 421–430.
Chaddock, L., Neider, M. B., Lutz, A., Hillman, C. H. & Kramer, A. F. 2012c. Role of
childhood aerobic fitness in successful street crossing. Medicine and Science in
Sports and Exercise 44 (4), 749–753.
Chaddock-Heyman, L., Erickson, K. I., Voss, M. W., Knecht, A. M., Pontifex, M. B., Castelli, D. M., Hillman, C. H. & Kramer, A. F. 2013. The effects of physical activity on
functional MRI activation associated with cognitive control in children: a randomized controlled intervention. Frontiers in Human Neuroscience 7.
Chernin, A. R. & Linebarger, D. L. 2005. The relationship between children’s television viewing and academic performance. Archives of Pediatrics & Adolescent
Medicine 159 (7), 687–689.
Chic, C. & Chen, J. 2011. The relationship between physical education performance,
fitness tests and academic achievement in elementary school. The International
Journal of Sport and Society 2 (1), 65–73.
Chomitz, V., Slining, M., McGowan, R., Mitchell, S., Dawson, G. & Hacker, K. 2009. Is
there a relationship between physical fitness and academic achievement? Positive results from public school children in the Northeastern United States. Journal of School Health 79 (1), 30–37.
Christakis, D. A. 2009. The effects of infant media usage: What do we know and what
should we learn? Acta Paediatrica 98 (1), 8–16.
Christakis, D. A., Zimmerman, F. J., DiGiuseppe, D. L. & McCarty, C. A. 2004. Early television exposure and subsequent attentional problems in children. Pediatrics
113 (4), 708–713.
Christopher Westland, J. 2010. Lower bounds on sample size in structural equation
modeling. Electronic Commerce Research and Applications 9 (6), 476–487.
Clarke, A. T. & Kurtz-Costes, B. 1997. Television viewing, educational quality of the
home environment, and school readiness. The Journal of Educational Research
90 (5), 279–285.
Coe, D. P., Pivarnik, J. M., Womack, C. J., Reeves, M. J. & Malina, R. M. 2006. Effect of
physical education and activity levels on academic achievement in children.
Medicine and Science in Sports and Exercise 38 (8), 1515–1519.
Coe, D. P., Pivarnik, J. M., Womack, C. J., Reeves, M. J. & Malina, R. M. 2004. Role of
physical education and activity on academic achievement in middle school children. Medicine & Science in Sports & Exercise 36 (5), S102.
Cooper, H., Valentine, J. C., Nye, B. & Lindsay, J. J. 1999. Relationships between five
after-school activities and academic achievement. Journal of Educational Psychology 91 (2), 369–378.
Corder, K., van Sluijs, E. M. F., McMinn, A. M., Ekelund, U., Cassidy, A. & Griffin, S. J.
2010. Perception versus reality: Awareness of physical activity levels of British
children. American Journal of Preventive Medicine 38 (1), 1–8.
Crova, C., Struzzolino, I., Marchetti, R., Masci, I., Vannozzi, G., Forte, R. & Pesce, C.
2014. Cognitively challenging physical activity benefits executive function in
overweight children. Journal of Sports Sciences 32 (3), 201–211.
72
Currie, C., Zanotti, C., Morgan, A., Currie, D., De Looze, M., Roberts, C., Samdal, O.,
Smith, O. R. F. & Barnekow, V. 2012. Social determinants of health and well-being among young people. Health behaviour in school-aged children (HBSC)
study. International report from the 2009/2010 survey. Health policy for children and adolescents (6).
Daley, A. J. & Ryan, J. 2000. Academic performance and participation in physical activity by secondary school adolescents. Perceptual and Motor Skills 91 (2), 531–
534.
Davis, C. & Cooper, S. 2011. Fitness, fatness, cognition, behavior, and academic
achievement among overweight children: Do cross-sectional associations correspond to exercise trial outcomes? Preventive Medicine 52, S65–S69.
Davis, C. L., Tomporowski, P. D., Boyle, C. A., Waller, J. L., Miller, P. H., Naglieri, J. A. &
Gregoski, M. 2007. Effects of aerobic exercise on overweight children's cognitive
functioning: A randomized controlled trial. Research Quarterly for Exercise and
Sport 78 (5), 510–519.
Davis, C. L., Tomporowski, P. D., McDowell, J., Austin, B., Miller, P. H., Yanasak, N.,
Allison, J. & Naglieri, J. A. 2011. Exercise improves executive function and
achievement and alters brain activation in overweight children: A randomized,
controlled trial. Health Psychology 30 (1), 91–98.
Davis, E. E., Pitchford, N. J. & Limback, E. 2011. The interrelation between cognitive
and motor development in typically developing children aged 4–11 years is underpinned by visual processing and fine manual control. British Journal of Psychology 102 (3), 569–584.
de Jong, P. F. 1999. Hierarchical regression analysis in structural equation modeling.
Structural Equation Modeling: A Multidisciplinary Journal 6 (2), 198–211.
Dexter, T. 1999. Relationships between sport knowledge, sport performance and academic ability: Empirical evidence from GCSE Physical Education. Journal of
Sports Sciences 17 (4), 283–295.
Diamond, A. 2013. Executive functions. Annual Review of Psychology 64, 135–168.
Dollman, J., Boshoff, K. & Dodd, G. 2006. The relationship between curriculum time
for physical education and literacy and numeracy standards in South Australian
primary schools. European Physical Education Review 12 (2), 151–163.
Donnelly, J., Greene, J., Gibson, C., Smith, B., Washburn, R., Sullivan, D., DuBose, K.,
Mayo, M., Schmelzle, K., Ryan, J., Jacobsen, D. & Williams, S. 2009. Physical Activity Across the Curriculum (PAAC): A randomized controlled trial to promote
physical activity and diminish overweight and obesity in elementary school
children. Preventive Medicine 49 (4), 336–341.
Drollette, E. S., Scudder, M. R., Raine, L. B., Moore, R. D., Saliba, B. J., Pontifex, M. B. &
Hillman, C. H. 2014. Acute exercise facilitates brain function and cognition in
children who need it most: An ERP study of individual differences in inhibitory
control capacity. Developmental Cognitive Neuroscience 7, 53–64.
Drollette, E. S., Shishido, T., Pontifex, M. B. & Hillman, C. H. 2012. Maintenance of
cognitive control during and after walking in preadolescent children. Medicine
and Science in Sport and Exercise 44 (10), 2017–2024.
Duncan, M. & Johnson, A. 2014. The effect of differing intensities of acute cycling on
preadolescent academic achievement. European Journal of Sport Science 14 (3),
279–286.
73
Dworak, M., Schierl, T., Bruns, T. & Strüder, H. K. 2007. Impact of singular excessive
computer game and television exposure on sleep patterns and memory performance of school-aged children. Pediatrics 120 (5), 978–985.
Dwyer, T., Sallis, J. F., Blizzard, L., Lazarus, R. & Dean, K. 2001. Relation of academic
performance to physical activity and fitness in children. Pediatric Exercise Science 13 (3), 225–237.
Dye, M. W., Green, C. S. & Bavelier, D. 2009. Increasing speed of processing with action video games. Current Directions in Psychological Science 18 (6), 321–326.
Edwards, J., Mauch, L. & Winkelman, M. 2011. Relationship of nutrition and physical
activity behaviors and fitness measures to academic performance for sixth
graders in a Midwest City school district. Journal of School Health 81 (2), 65–
73.
Eitle, T. M. 2005. Do gender and race matter? Explaining the relationship between
sports participation and achievement. Sociological Spectrum 25 (2), 177–195.
Eitle, T. M. & Eitle, D. J. 2002. Race, cultural capital, and the educational effects of
participation in sports. Sociology of Education 75, 123–146.
Ekelund, U., Luan, J., Sherar, L. B., Esliger, D. W., Griew, P. & Cooper, A. 2012. Moderate to vigorous physical activity and sedentary time and cardiometabolic risk
factors in children and adolescents. JAMA: The Journal of the American Medical
Association 307 (7), 704–712.
Ekelund, U., Tomkinson, G. & Armstrong, N. 2011. What proportion of youth are
physically active? Measurement issues, levels and recent time trends. British
Journal of Sports Medicine 45 (11), 859–865.
Ennemoser, M. & Schneider, W. 2007. Relations of television viewing and reading:
Findings from a 4-year longitudinal study. Journal of Educational Psychology 99
(2), 349–368.
Erickson, K. I., Voss, M. W., Prakash, R. S., Basak, C., Szabo, A., Chaddock, L., Kim, J. S.,
Heo, S., Alves, H., White, S. M., Wojcicki, T. R., Mailey, E., Vieira, V. J., Martin, S. A.,
Pence, B. D., Woods, J. A., McAuley, E. & Kramer, A. F. 2011. Exercise training
increases size of hippocampus and improves memory. Proceedings of the National Academy of Sciences of the United States of America 108 (7), 3017–3022.
Ericsson, I. 2008. Motor skills, attention and academic achievements. An intervention study in school years 1–3. British Educational Research Journal 34 (3),
301–313.
Espinoza, F. 2009. Using project-based data in physics to examine television viewing
in relation to student performance in science. Journal of Science Education and
Technology 18 (5), 458–465.
Evenson, K. R., Catellier, D. J., Gill, K., Ondrak, K. S. & McMurray, R. G. 2006. Calibration of two objective measures of physical activity for children. Journal of Sports
Sciences 24 (14), 1557–1565.
Feldstein, S. N., Keller, F. R., Portman, R. E., Durham, R. L., Klebe, K. J. & Davis, H. P.
1999. A comparison of computerized and standard versions of the Wisconsin
Card Sorting Test. The Clinical Neuropsychologist 13 (3), 303–313.
Feng, J., Spence, I. & Pratt, J. 2007. Playing an action video game reduces gender differences in spatial cognition. Psychological Science 18 (10), 850–855.
74
Ferguson, C. J., Garza, A., Jerabeck, J., Ramos, R. & Galindo, M. 2012. Not worth the
fuss after all? Cross-sectional and prospective data on violent video game influences on aggression, visuospatial cognition and mathematics ability in a sample
of youth. Journal of Youth and Adolescence 42, 109–122.
The Finnish Psychological Test Committee. 2013. Ohjeistus tietokoneavusteisten
testien käyttämisestä psykologisessa tutkimuksessa [Guidelines for using computer-assisted tests in psychological assessment] (In Finnish). Available at
http://www.psyli.fi/files/1445/Tietokoneavusteinen_psykologinen_tutkimus
_18.12.2012.pdf
Fisher, A., Boyle, J., Paton, J., Tomporowski, P., Watson, C., McColl, J. & Reilly, J. 2011.
Effects of a physical education intervention on cognitive function in young children: Randomized controlled pilot study. BMC Pediatrics 11 (97).
Fox, C., Barr-Anderson, D., Neumark-Sztainer, D. & Wall, M. 2010. Physical activity
and sports team participation: Associations with academic outcomes in middle
school and high school students. Journal of School Health 80 (1), 31–37.
Fredericks, C. R., Kokot, S. J. & Krog, S. 2006. Using a developmental movement programme to enhance academic skills in grade 1 learners. South African Journal
for Research in Sport, Physical Education and Recreation 28 (1), 29–42.
Fried, R., Hirshfeld-Becker, D., Petty, C., Batchelder, H. & Biederman, J. 2012. How
informative is the CANTAB to assess executive functioning in children with
ADHD? A Controlled Study. Journal of Attention Disorders.
Gaddy, G. D. 1986. Television's impact on high school achievement. Public Opinion
Quarterly 50 (3), 340–359.
Gallotta, M. C., Guidetti, L., Franciosi, E., Emerenziani, G. P., Bonavolontà, V. & Baldari,
C. 2012. Effects of varying type of exertion on children’s attention capacity.
Medicine and Science in Sports and Exercise 44, 550–555.
Gau, S. S. & Shang, C. 2010. Executive functions as endophenotypes in ADHD: evidence from the Cambridge Neuropsychological Test Battery (CANTAB). Journal
of Child Psychology and Psychiatry 51 (7), 838–849.
Gentile, D. A. & Walsh, D. A. 2002. A normative study of family media habits. Journal
of Applied Developmental Psychology 23 (2), 157–178.
Gnys, J. A. & Willis, W. G. 1991. Validation of executive function tasks with young
children. Developmental Neuropsychology 7 (4), 487–501.
Gomez-Pinilla, F. 2011. The combined effects of exercise and foods in preventing
neurological and cognitive disorders. Preventive Medicine 52, S75–S80.
Gomez-Pinilla, F. & Hillman, C. 2013. The influence of exercise on cognitive abilities.
Comprehensive Physiology 52, S75–S80.
Gortmaker, S. L., Salter, C. A., Walker, D. K. & Dietz, W. H. 1990. The impact of television viewing on mental aptitude and achievement: A longitudinal study. Public
Opinion Quarterly 54 (4), 594–604.
Granic, I., Lobel, A. & Engels, R. C. 2013. The benefits of playing video games. American Psychologist 69(1), 66–78.
Grissom, J. B. 2005. Physical fitness and academic achievement. Journal of Exercise
Physiology Online 8 (1).
Guiney, H. & Machado, L. 2013. Benefits of regular aerobic exercise for executive
functioning in healthy populations. Psychonomic Bulletin & Review 20 (1), 73–
86.
75
Haapala, E. A., Poikkeus, A. M., Kukkonen-Harjula, K., Tompuri, T., Lintu, N., Väistö, J.,
Leppänen, P. H., Laaksonen, D.E., Lindi, V. & Lakka, T. A. 2014a. Associations of
physical activity and sedentary behavior with academic skills. A follow-up study
among primary school children. PlosS one 9(9), e107031.
Haapala, E. A., Poikkeus, A. M., Tompuri, T., Kukkonen-Harjula, K., Leppänen, P. H.,
Lindi, V. & Lakka, T. A. 2014b. Associations of motor and cardiovascular performance with academic skills in children. Medicine and Science in Sports and Exercise 46 (5), 1016–1024.
Halperin, J. M., Sharma, V., Greenblatt, E. & Schwartz, S. T. 1991. Assessment of the
continuous performance test: Reliability and validity in a nonreferred sample.
Psychological Assessment: A Journal of Consulting and Clinical Psychology 3
(4), 603–608.
Hamilton, L. S., Stecher, B. M. & Yuan, K. 2012. Standards-based accountability in the
United States: Lessons learned and future directions. Education Inquiry 3(2),
149–170.
Hancox, R. J., Milne, B. J. & Poulton, R. 2005. Association of television viewing during
childhood with poor educational achievement. Archives of Pediatrics & Adolescent Medicine 159 (7), 614–618.
Hanson, S. L. & Kraus, R. S. 1998. Women, sports, and science: Do female athletes
have an advantage? Sociology of Education 71, 93–110.
Heaton, R. K., Chelune, G., Talley, J. L., Kay, G. & Curtiss, G. 1993. Wisconsin card sorting test manual. Psychological Assessment Resources Odessa, FL.
Henry, L. A. & Bettenay, C. 2010. The assessment of executive functioning in children.
Child and Adolescent Mental Health 15 (2), 110–119.
Herzog, W. & Boomsma, A. 2009. Small-sample robust estimators of noncentralitybased and incremental model fit. Structural Equation Modeling 16 (1), 1–27.
Hill, L., Williams, J. H., Aucott, L., Milne, J., Thomson, J., Greig, J., Munro, V. & MonWilliams, M. 2010. Exercising attention within the classroom. Developmental
Medicine & Child Neurology 52 (10), 929–934.
Hillman, C. H., Buck, S. M., Themanson, J. R., Pontifex, M. B. & Castelli, D. M. 2009.
Aerobic fitness and cognitive development: Event-related brain potential and
task performance indices of executive control in preadolescent children. Developmental Psychology 45 (1), 114–129.
Hillman, C. H., Castelli, D. M. & Buck, S. M. 2005. Aerobic fitness and neurocognitive
function in healthy preadolescent children. Medicine and Science in Sports and
Exercise 37 (11), 1967–1974.
Hillman, C. H., Erickson, K. I. & Kramer, A. F. 2008. Be smart, exercise your heart:
Exercise effects on brain and cognition. Nature Reviews Neuroscience 9 (1), 58–
65.
Hillman, C. H., Kamijo, K. & Scudder, M. 2011. A review of chronic and acute physical
activity participation on neuroelectric measures of brain health and cognition
during childhood. Preventive Medicine 52, S21–S28.
Hillman, C. H., Motl, R. W., Pontifex, M. B., Posthuma, D., Stubbe, J. H., Boomsma, D. I.
& De Geus, E. J. 2006. Physical activity and cognitive function in a cross-section
of younger and older community-dwelling individuals. Health Psychology 25
(6), 678–687.
76
Hillman, C. H., Pontifex, M. B., Raine, L. B., Castelli, D. M., Hall, E. E. & Kramer, A.
F. 2009. The effect of acute treadmill walking on cognitive control and academic
achievement in preadolescent children. Neuroscience 159 (3), 1044–1054.
Hirvensalo, M. & Lintunen, T. 2011. Life-course perspective for physical activity and
sports participation. European Review of Aging and Physical Activity 8 (1), 13–
22.
Hogan, M., Kiefer, M., Kubesch, S., Collins, P., Kilmartin, L. & Brosnan, M. 2013. The
interactive effects of physical fitness and acute aerobic exercise on electrophysiological coherence and cognitive performance in adolescents. Experimental
Brain Research 229 (1), 85–96.
Hopkins, M., Davis, F., Vantieghem, M., Whalen, P. & Bucci, D. 2012. Differential effects of acute and regular physical exercise on cognition and affect. Neuroscience 215, 59–68.
Hu, L. & Bentler, P. M. 1999. Cutoff criteria for fit indexes in covariance structure
analysis: Conventional criteria versus new alternatives. Structural Equation
Modeling: A Multidisciplinary Journal 6 (1), 1–55.
Humes, G. E., Welsh, M. C., Retzlaff, P. & Cookson, N. 1997. Towers of Hanoi and London: Reliability of two executive function tasks. Assessment 4 (3), 249–257.
Huotari, P. R., Nupponen, H., Laakso, L. & Kujala, U. M. 2010. Secular trends in aerobic
fitness performance in 13–18-year-old adolescents from 1976 to 2001. British
Journal of Sports Medicine 44 (13), 968–972.
Iverson, J. M. 2010. Developing language in a developing body: the relationship between motor development and language development. Journal of Child Language 37 (2), 229–261.
Jackson, L. A., Von Eye, A., Biocca, F. A., Barbatsis, G., Zhao, Y. & Fitzgerald, H. E. 2006.
Does home internet use influence the academic performance of low-income
children? Developmental Psychology 42 (3), 429–435.
Jackson, L. A., Von Eye, A., Witt, E. A., Zhao, Y. & Fitzgerald, H. E. 2011. A longitudinal
study of the effects of Internet use and videogame playing on academic performance and the roles of gender, race and income in these relationships. Computers in Human Behavior 27 (1), 228–239.
Jeneson, A. & Squire, L. R. 2011. Working memory, long-term memory, and medial
temporal lobe function. Learning & Memory 19 (1), 15–25.
Johnson, J. G., Cohen, P., Kasen, S. & Brook, J. S. 2007. Extensive television viewing
and the development of attention and learning difficulties during adolescence.
Archives of Pediatrics & Adolescent Medicine 161 (5), 480–486.
Kamijo, K., Pontifex, M., O'Leary, K., Scudder, M., Wu, C., Castelli, D. & Hillman, C.
2011. The effects of an afterschool physical activity program on working
memory in preadolescent children. Developmental Science, 1-13.
Kantomaa, M. T., Stamatakis, E., Kankaanpää, A., Kaakinen, M., Rodriguez, A., Taanila,
A., Ahonen, T., Järvelin, M. & Tammelin, T. 2013. Physical activity and obesity
mediate the association between childhood motor function and adolescents’ academic achievement. Proceedings of the National Academy of Sciences 110 (5),
1917–1922.
Kantomaa, M. T., Tammelin, T. H., Demakakos, P., Ebeling, H. E. & Taanila, A. M. 2010.
Physical activity, emotional and behavioural problems, maternal education and
self-reported educational performance of adolescents. Health Education Research 25 (2), 368–379.
77
Karbach, J., Gottschling, J., Spengler, M., Hegewald, K. & Spinath, F. M. 2013. Parental
involvement and general cognitive ability as predictors of domain-specific academic achievement in early adolescence. Learning and Instruction 23, 43–51.
Kautiainen, S., Rimpela, A., Vikat, A. & Virtanen, S. M. 2002. Secular trends in overweight and obesity among Finnish adolescents in 1977-1999. International
Journal of Obesity and Related Metabolic Disorders: Journal of the International
Association for the Study of Obesity 26 (4), 544–552.
Kohl III, H. W. & Cook, H. D. (Eds.) 2013. Educating the student body: Taking physical
activity and physical education to school. National Academies Press.
Koretz, D. M. & Hamilton, L. S. 2006. Testing for accountability in K-12. In Brennan
R. L. (Ed.) Educational Measurement, 4th ed. Westport, CT: American Council on
Education/Praeger, 531–578.
Kim, H. P., Frongillo, E. A., Han, S., Oh, S., Kim, W., Jang, Y., Won, H., Lee, H. & Kim, S.
2003. Academic performance of Korean children in associated with dietary behaviours and physical status. Asia Pacific Journal of Clinical Nutrition 12 (2),
186–192.
Kim, D. H. & So, W. Y. 2012. The relationship between daily Internet use time and
school performance in Korean adolescents. Central European Journal of Medicine 7 (4), 444–449.
Kirkorian, H. L., Wartella, E. A. & Anderson, D. R. 2008. Media and young children's
learning. The Future of Children 18 (1), 39–61.
Kramer, A. F. & Erickson, K. I. 2007. Capitalizing on cortical plasticity: Influence of
physical activity on cognition and brain function. Trends in Cognitive Sciences
11 (8), 342–348.
Kristjansson, A., Sigfusdottir, I. & Allegrante, J. 2010. Health behavior and academic
achievement among adolescents: The relative contribution of dietary habits,
physical activity, body mass index, and self-esteem. Health Education & Behavior 37 (1), 51–64.
Kristjansson, A., Sigfusdottir, I., Allegrante, J. & Helgason, A. 2009. Adolescent health
behavior, contentment in school, and academic achievement. American Journal
of Health Behavior 33 (1), 69–79.
Kühn, S., Gleich, T., Lorenz, R., Lindenberger, U. & Gallinat, J. 2013. Playing Super
Mario induces structural brain plasticity: Gray matter changes resulting from
training with a commercial video game. Molecular Psychiatry, 1–7.
Kwak, L., Kremers, S., Bergman, P., Ruiz, J. & Rizzo, N. 2009. Associations between
physical activity, fitness, and academic achievement. Journal of Pediatrics 155,
914–918.
Lakshman, R., Elks, C. E. & Ong, K. K. 2012. Childhood obesity. Circulation 126 (14),
1770–1779.
Landhuis, C. E., Poulton, R., Welch, D. & Hancox, R. J. 2007. Does childhood television
viewing lead to attention problems in adolescence? Results from a prospective
longitudinal study. Pediatrics 120 (3), 532–537.
Lautenschlager, N. T., Cox, K. L., Flicker, L., Foster, J. K., van Bockxmeer, F. M., Xiao, J.,
Greenop, K. R. & Almeida, O. P. 2008. Effect of physical activity on cognitive function in older adults at risk for Alzheimer disease: A randomized trial. JAMA: The
Journal of the American Medical Association 300 (9), 1027–1037.
78
LeBlanc, M. M., Martin, C. K., Han, H., Newton Jr, R., Sothern, M., Webber, L. S., Davis,
A. B. & Williamson, D. A. 2012. Adiposity and physical activity are not related to
academic achievement in school-aged children. Journal of Developmental & Behavioral Pediatrics 33 (6), 486–494.
Levaux, M., Potvin, S., Sepehry, A. A., Sablier, J., Mendrek, A. & Stip, E. 2007. Computerized assessment of cognition in schizophrenia: Promises and pitfalls of CANTAB. European Psychiatry 22 (2), 104–115.
Levine, L. E. & Waite, B. M. 2000. Television viewing and attentional abilities in
fourth and fifth grade children. Journal of Applied Developmental Psychology
21 (6), 667–679.
Lindner, K. J. 1999. Sport participation and perceived academic performance of
school children and youth. Pediatric Exercise Science 11, 129–143.
Lindner, K. J. 2002. The physical activity participation-academic performance relationship revisited: Perceived and actual performance and the effect of banding
(academic tracking). Pediatric Exercise Science 14 (2), 155–169.
Linebarger, D. L., Kosanic, A. Z., Greenwood, C. R. & Doku, N. S. 2004. Effects of viewing the television program Between the Lions on the emergent literacy skills of
young children. Journal of Educational Psychology 96 (2), 297–308.
Little, T. D., Cunningham, W. A., Shahar, G. & Widaman, K. F. 2002. To parcel or not
to parcel: Exploring the question, weighing the merits. Structural Equation
Modeling 9 (2), 151–173.
Liu, Y., Wang, M., Tynjälä, J., Lv, Y., Villberg, J., Zhang, Z. & Kannas, L. 2010. Test-retest
reliability of selected items of Health Behaviour in School-aged Children (HBSC)
survey questionnaire in Beijing, China. BMC Medical Research Methodology 10
(1), 73.
London, R. A. & Castrechini, S. 2011. A longitudinal examination of the link between
youth physical fitness and academic achievement. Journal of School Health 81
(7), 400–408.
Low, S. R. M. 1990. Influence of physical activity on concentration among junior highschool students. Perceptual and Motor Skills 70 (1), 67–74.
Lowe, C. & Rabbitt, P. 1998. Test/re-test reliability of the CANTAB and ISPOCD neuropsychological batteries: Theoretical and practical issues. Neuropsychologia
36 (9), 915–923.
Lu, L., Weber, H. S., Spinath, F. M. & Shi, J. 2011. Predicting school achievement from
cognitive and non-cognitive variables in a Chinese sample of elementary school
children. Intelligence 39 (2), 130–140.
Luciana, M. 2003. Practitioner review: Computerized assessment of neuropsychological function in children: Clinical and research applications of the Cambridge
Neuropsychological Testing Automated Battery (CANTAB). Journal of Child Psychology and Psychiatry 44 (5), 649–663.
Luciana, M., Lindeke, L., Georgieff, M., Mills, M. & Nelson, C. A. 1999. Neurobehavioral
evidence for working-memory deficits in school-aged children with histories of
prematurity. Developmental Medicine & Child Neurology 41 (8), 521–533.
Luciana, M. & Nelson, C. A. 2002. Assessment of neuropsychological function
through use of the Cambridge Neuropsychological Testing Automated Battery:
performance in 4- to 12-year-old children. Developmental Neuropsychology 22
(3), 595–624.
79
Luciana, M. & Nelson, C. A. 1998. The functional emergence of prefrontally-guided
working memory systems in four-to eight-year-old children. Neuropsychologia
36 (3), 273–293.
Maccoby, E. E. 1951. Television: Its impact on school children. Public Opinion Quarterly 15 (3), 421–444.
Maeda, J. K. & Randall, L. M. 2003. Can academic success come from five minutes of
physical activity? Brock Education 13 (1), 14–22.
Malina, R. M. 2001. Physical activity and fitness: Pathways from childhood to adulthood. American Journal of Human Biology 13 (2), 162–172.
Martínez-Gómez, D., Veiga, O. L., Gómez-Martínez, S., Zapatera, B., Martínez-Hernández, D., Calle, M. & Marcos, A. 2012. Gender-specific influence of health behaviors on academic performance in Spanish adolescents; The AFINOS study. Nutrición Hospitalaria 27 (3), 724–730.
McClelland, M. M. & Cameron, C. E. 2011. Self-regulation and academic achievement
in elementary school children. New Directions for Child and Adolescent Development 2011 (133), 29–44.
McNaughten, D. & Gabbard, C. 1993. Physical exertion and immediate mental performance of sixth-grade children. Perceptual and motor skills 77 (3f), 1155–
1159.
Miller, K. E., Melnick, M. J., Barnes, G. M., Farrell, M. P. & Sabo, D. 2005. Untangling
the links among athletic involvement, gender, race, and adolescent academic
outcomes. Sociology of Sport Journal 22 (2), 178–193.
Milner, B. 1971. Interhemispheric differences in the localization of psychological
processes in man. British Medical Bulletin 27 (3), 272–277.
Mizuno, K., Tanaka, M., Fukuda, S., Imai-Matsumura, K. & Watanabe, Y. 2012. Divided
attention of adolescents related to lifestyles and academic and family conditions. Brain and Development 35 (5), 435–440.
Monti, J. M., Hillman, C. H. & Cohen, N. J. 2012. Aerobic fitness enhances relational
memory in preadolescent children: The FITKids randomized control trial. Hippocampus 22 (9), 1876–1882.
Moore, R. D., Drollette, E. S., Scudder, M. R., Bharij, A. & Hillman, C. H. 2014. The influence of cardiorespiratory fitness on strategic, behavioral, and electrophysiological indices of arithmetic cognition in preadolescent children. Frontiers in
Human Neuroscience 8, 258.
Mößle, T., Kleimann, M., Rehbein, F. & Pfeiffer, C. 2010. Media use and school
achievement – boys at risk? British Journal of Developmental Psychology 28 (3),
69–725.
Mountjoy, M., Andersen, L. B., Armstrong, N., Biddle, S., Boreham, C., Bedenbeck, H.
P. B., Ekelund, U., Engebretsen, L., Hardman, K. & Hills, A. 2011. International
Olympic Committee consensus statement on the health and fitness of young
people through physical activity and sport. British Journal of Sports Medicine
45 (11), 839–848.
Munasib, A. & Bhattacharya, S. 2010. Is the ‘Idiot's Box’ raising idiocy? Early and
middle childhood television watching and child cognitive outcome. Economics
of Education Review 29 (5), 873-883.
Muthén, L. & Muthén, B. 1998–2012. Mplus User’s Guide. Seventh Edition. Los Angeles: Muthén & Muthén.
80
National core curriculum for basic education 2004. 2004. Helsinki: Finnish National
Board of Education. Available: http://www.oph.fi/english/curricula_and_qualifications/basic_education. Assessed 6 May 2014.
Neisser, U., Boodoo, G., Bouchard Jr, T. J., Boykin, A. W., Brody, N., Ceci, S. J., Halpern,
D. F., Loehlin, J. C., Perloff, R. & Sternberg, R. J. 1996. Intelligence: Knowns and
unknowns. American Psychologist 51 (2), 77–101.
Nelson, M. C., Neumark-Stzainer, D., Hannan, P. J., Sirard, J. R. & Story, M. 2006. Longitudinal and secular trends in physical activity and sedentary behavior during
adolescence. Pediatrics 118 (6), e1627–e1634.
Nisbett, R. E., Aronson, J., Blair, C., Dickens, W., Flynn, J., Halpern, D. F. & Turkheimer,
E. 2012. Intelligence: New findings and theoretical developments. American
Psychologist 67 (2), 130–159.
O'Dea, J. A. & Mugridge, A. C. 2012. Nutritional quality of breakfast and physical activity independently predict the literacy and numeracy scores of children after
adjusting for socioeconomic status. Health Education Research 27 (6), 975–985.
Ouakrim-Soivio, N. 2013. Toimivatko päättöarvioinnin kriteerit?: Oppilaiden saamat
arvosanat ja Opetushallituksen oppimistulosten seuranta-arviointi koulujen välisten osaamiserojen mittareina. (In Finnish, abstract in English.) Raportit ja selvitykset 9. Opetushallitus.
Owen, A. M., Downes, J. J., Sahakian, B. J., Polkey, C. E. & Robbins, T. W. 1990. Planning
and spatial working memory following frontal lobe lesions in man. Neuropsychologia 28 (10), 1021–1034.
Padilla-Moledo, C., Ruiz, J. R., Ortega, F. B., Mora, J. & Castro-Pinero, J. 2012. Associations of muscular fitness with psychological positive health, health complaints,
and health risk behaviors in Spanish children and adolescents. Journal of
Strength and Conditioning Research 26 (1), 167–173.
Pagani, L. S., Fitzpatrick, C., Barnett, T. A. & Dubow, E. 2010. Prospective associations
between early childhood television exposure and academic, psychosocial, and
physical well-being by middle childhood. Archives of Pediatrics & Adolescent
Medicine 164 (5), 425–431.
Parsey, C. M. & Schmitter-Edgecombe, M. 2013. Applications of technology in neuropsychological assessment. The Clinical Neuropsychologist 27 (8), 1328–1361.
Pate, R. R., Mitchell, J. A., Byun, W. & Dowda, M. 2011. Sedentary behaviour in youth.
British Journal of Sports Medicine 45 (11), 906–913.
Pate, R. R., O'Neill, J. R. & Lobelo, F. 2008. The evolving definition of "sedentary". Exercise and Sport Sciences Reviews 36 (4), 173–178.
Pesce, C., Crova, C., Cereatti, L., Casella, R. & Bellucci, M. 2009. Physical activity and
mental performance in preadolescents: Effects of acute exercise on free-recall
memory. Mental Health and Physical Activity 2 (1), 16–22.
Petersen, S. E. & Posner, M. I. 2012. The attention system of the human brain: 20
years after. Annual Review of Neuroscience 35, 73–89.
Pontifex, M. B., Raine, L. B., Johnson, C. R., Chaddock, L., Voss, M. W., Cohen, N. J., Kramer, A. F. & Hillman, C. H. 2011. Cardiorespiratory fitness and the flexible modulation of cognitive control in preadolescent children. Journal of Cognitive Neuroscience 23 (6), 1332–1345.
81
Pontifex, M. B., Saliba, B. J., Raine, L. B., Picchietti, D. L. & Hillman, C. H. 2013. Exercise
improves behavioral, neurocognitive, and scholastic performance in children
with attention-deficit/hyperactivity disorder. The Journal of Pediatrics 162 (3),
543–551.
Pontifex, M. B., Scudder, M. R., Drollette, E. S. & Hillman, C. H. 2012. Fit and vigilant:
The relationship between poorer aerobic fitness and failures in sustained attention during preadolescence. Neuropsychology 26 (4), 407–713.
Posner, M. I. & Rothbart, M. K. 2014. Attention to learning of school subjects. Trends
in Neuroscience and Education 3 (1), 14–17.
Puder, J., Marques-Vidal, P., Schindler, C., Zahner, L., Niederer, I., Bürgi, F., Ebenegger,
V., Nydegger, A. & Kriemler, S. 2011. Effect of multidimensional lifestyle intervention on fitness and adiposity in predominantly migrant preschool children
(Ballabeina): Cluster randomised controlled trial. BMJ: British Medical Journal
343.
Raine, L. B., Lee, H. K., Saliba, B. J., Chaddock-Heyman, L., Hillman, C. H. & Kramer, A.
F. 2013. The influence of childhood aerobic fitness on learning and memory.
PloS One 8 (9), e72666.
Rasmussen, M. & Laumann, K. 2013. The academic and psychological benefits of exercise in healthy children and adolescents. European Journal of Psychology of
Education 28 (3), 945–962.
Razel, M. 2001. The complex model of television viewing and educational achievement. The Journal of Educational Research 94 (6), 371–379.
Reed, J., Einstein, G., Hahn, E., Hooker, S., Gross, V. & Kravitz, J. 2010. Examining the
impact of integrating physical activity on fluid intelligence and academic performance in an elementary school setting: A preliminary investigation. Journal
of Physical Activity & Health 7 (3), 343–351.
Reed, J. A., Maslow, A. L., Long, S. & Hughey, M. 2013. Examining the impact of 45
minutes of daily physical education on cognitive ability, fitness performance,
and body composition of African American youth. Journal of Physical Activity &
Health 10 (2), 185–197.
Reynolds, D. & Nicolson, R. I. 2007. Follow-up of an exercise-based treatment for
children with reading difficulties. Dyslexia 13 (2), 78–96.
Rhodes, S. M., Riby, D. M., Matthews, K. & Coghill, D. R. 2011. Attention-deficit/hyperactivity disorder and Williams syndrome: Shared behavioral and neuropsychological profiles. Journal of Clinical and Experimental Neuropsychology 33
(1), 147–156.
Robbins, T. W., James, M., Owen, A. M., Sahakian, B. J., Lawrence, A. D., McInnes, L. &
Rabbitt, P. M. 1998. A study of performance on tests from the CANTAB battery
sensitive to frontal lobe dysfunction in a large sample of normal volunteers: Implications for theories of executive functioning and cognitive aging. Journal of
the International Neuropsychological Society 4 (5), 474–490.
Roberts, C. K., Freed, B. & McCarthy, W. J. 2010. Low aerobic fitness and obesity are
associated with lower standardized test scores in children. The Journal of Pediatrics 156 (5), 711–718.
Ruiz, J. R., Ortega, F. B., Castillo, R., Martín-Matillas, M., Kwak, L., Vicente-Rodríguez,
G., Noriega, J., Tercedor, P., Sjöström, M. & Moreno, L. A. 2010. Physical activity,
fitness, weight status, and cognitive performance in adolescents. The Journal of
Pediatrics 157 (6), 917–922.
82
Sahakian, B. J., Owen, A. M., Morant, N. J., Eagger, S. A., Boddington, S., Crayton, L.,
Crockford, H. A., Crooks, M., Hill, K. & Levy, R. 1993. Further analysis of the cognitive effects of tetrahydroaminoacridine (THA) in Alzheimer's disease: Assessment of attentional and mnemonic function using CANTAB. Psychopharmacology 110 (4), 395–401.
Sallis, J. F., McKenzie, T. L., Kolody, B., Lewis, M., Marshall, S. & Rosengard, P. 1999.
Effects of health-related physical education on academic achievement: Project
SPARK. Research Quarterly for Exercise and Sport 70 (2), 127–34.
Salmon, J., Tremblay, M. S., Marshall, S. J. & Hume, C. 2011. Health risks, correlates,
and interventions to reduce sedentary behavior in young people. American
Journal of Preventive Medicine 41 (2), 197–206.
Schmidt, M. E. & Vandewater, E. A. 2008. Media and attention, cognition, and school
achievement. The Future of Children 18 (1), 63–85.
Schmidt, M. E., Rich, M., Rifas-Shiman, S. L., Oken, E. & Taveras, E. M. 2009. Television
viewing in infancy and child cognition at 3 years of age in a US cohort. Pediatrics
123 (3), e370–e375.
Schumaker, J. F., Small, L. & Wood, J. 1986. Self-concept, academic achievement, and
athletic participation. Perceptual and Motor Skills 62 (2), 387–390.
Scudder, M. R., Federmeier, K. D., Raine, L. B., Direito, A., Boyd, J. K. & Hillman, C. H.
2014. The association between aerobic fitness and language processing in children: Implications for academic achievement. Brain and Cognition 87, 140–152.
Shallice, T. & Shallice, T. 1982. Specific impairments of planning. Philosophical
Transactions of the Royal Society of London. B, Biological Sciences 298 (1089),
199–209.
Sharif, I. & Sargent, J. D. 2006. Association between television, movie, and video
game exposure and school performance. Pediatrics 118 (4), e1061–e1070.
Sharif, I., Wills, T. A. & Sargent, J. D. 2010. Effect of visual media use on school performance: A prospective study. Journal of Adolescent Health 46 (1), 52–61.
Shephard, R. J. 1997. Curricular physical activity and academic performance. Pediatric Exercise Science 9, 113–126.
Shephard, R. J. 2014. Physical activity of children and academic achievement. Medicine and Science in Sports and Exercise 46 (4), 840.
Shi, X., Tubb, L., Fingers, S. T., Chen, S. & Caffrey, J. L. 2013. Associations of physical
activity and dietary behaviors with children's health and academic problems.
Journal of School Health 83 (1), 1–7.
Shin, N. 2004. Exploring pathways from television viewing to academic achievement
in school age children. The Journal of Genetic Psychology 165 (4), 367–382.
Sibley, B. A. & Etnier, J. L. 2003. The relationship between physical activity and cognition in children: A meta-analysis. Pediatric Exercise Science 15 (3).
Sigfusdottir, I. D., Kristjansson, A. L. & Allegrante, J. P. 2007. Health behaviour and
academic achievement in Icelandic school children. Health Education Research
22 (1), 70–80.
Silliker, S. A. & Quirk, J. T. 1997. The effect of extracurricular activity participation
on the academic performance of male and female high school students. School
Counselor 44 (4), 288–293.
83
Singh, A., Uijtdewilligen, L., Twisk, J. W., van Mechelen, W. & Chinapaw, M. J. 2012.
Physical activity and performance at school: A systematic review of the literature including a methodological quality assessment. Archives of Pediatrics &
Adolescent Medicine 166 (1), 49–55.
Skotte, J., Korshøj, M., Kristiansen, J., Hanisch, C. & Holtermann, A. 2014. Detection of
physical activity types using triaxial accelerometers. Journal of Physical Activity
& Health 11 (1), 76–84.
Smith, P. J., Need, A. C., Cirulli, E. T., Chiba-Falek, O. & Attix, D. K. 2013. A comparison
of the Cambridge Automated Neuropsychological Test Battery (CANTAB) with
“traditional” neuropsychological testing instruments. Journal of Clinical and Experimental Neuropsychology, 35 (3), 319–328.
Smith, T. E. 1992. Time use and change in academic achievement: A longitudinal follow-up. Journal of Youth and Adolescence 21 (6), 725–747.
So, W. 2012. Association between physical activity and academic performance in Korean adolescent students. BMC Public Health 12 (1), 258.
Sollerhed, A. & Ejlertsson, G. 1999. Low physical capacity among adolescents in practical education. Scandinavian Journal of Medicine & Science in Sports 9 (5), 249–
256.
Spence, I. & Feng, J. 2010. Video games and spatial cognition. Review of General Psychology 14 (2), 92–104.
Spitzer, U. S. & Hollmann, W. 2013. Experimental observations of the effects of physical exercise on attention, academic and prosocial performance in school settings. Trends in Neuroscience and Education 2 (1), 1–6.
Staiano, A. E., Abraham, A. A. & Calvert, S. L. 2012. Competitive versus cooperative
exergame play for African American adolescents' executive function skills:
Short-term effects in a long-term training intervention. Developmental Psychology 48 (2), 337–342.
Staiano, A. E. & Calvert, S. L. 2011. Exergames for physical education courses: Physical, social, and cognitive benefits. Child Development Perspectives 5 (2), 93–
98.
Stephens, L. J. & Schaben, L. A. 2002. The effect of interscholastic sports participation
on academic achievement of middle level school students. NASSP: National Association of Secondary School Principals Bulletin 86 (630), 34–41.
Stevens, T., To, Y., Stevenson, S. & Lochbaum, M. 2008. The importance of physical
activity and physical education in the prediction of academic achievement. Journal of Sport Behavior 31 (4), 368–388.
Strath, S. J., Kaminsky, L. A., Ainsworth, B. E., Ekelund, U., Freedson, P. S., Gary, R. A.,
Richardson, C. R., Smith, D. T. & Swartz, A. M. 2013. Guide to the assessment of
physical activity: Clinical and research applications. A scientific statement from
the American Heart Association. Circulation 128 (20), 2259–2279.
Stroth, S., Kubesch, S., Dieterle, K., Ruchsow, M., Heim, R. & Kiefer, M. 2009. Physical
fitness, but not acute exercise modulates event-related potential indices for executive control in healthy adolescents. Brain Research 1269, 114–124.
Subrahmanyam, K., Greenfield, P., Kraut, R. & Gross, E. 2001. The impact of computer
use on children's and adolescents' development. Journal of Applied Developmental Psychology 22 (1), 7–30.
84
Suoninen, A. 2013. Lasten mediabarometri 2012. 10–12-vuotiaiden tyttöjen ja poikien mediankäyttö. (In Finnish) Helsinki: Nuorisotutkimusverkosto/Nuorisotutkimusseura, verkkojulkaisuja 62.
Swing, E. L., Gentile, D. A., Anderson, C. A. & Walsh, D. A. 2010. Television and video
game exposure and the development of attention problems. Pediatrics 126 (2),
214–221.
Tammelin, T., Laine, K., & Turpeinen, S. (Eds.) 2013. Oppilaiden fyysinen aktiivisuus
[Physical Activity of School-aged children] (In Finnish, abstract in English). Research Reports on Sport and Health 272. Jyväskylä: LIKES – Foundation for
Sport and Health Sciences.
Tammelin, T. & Karvinen, J. (Eds.) 2008. Fyysisen aktiivisuuden suositus kouluikäisille 7–18-vuotiaille [Recommendatios for the physical activity of schoolaged children] (In Finnish, abstract in English). Helsinki: Opetusministeriö ja
Nuori Suomi ry.
Telama, R., Yang, X., Leskinen, E., Kankaanpää, A., Hirvensalo, M., Tammelin, T., Viikari, J. S. & Raitakari, O. T. 2014. Tracking of physical activity from early childhood through youth into adulthood. Medicine and Science in Sports and Exercise 46 (5), 955–962.
Telford, R. D., Cunningham, R. B., Telford, R. M. & Abharatna, W. P. 2012. Schools with
fitter children achieve better literacy and numeracy results: Evidence of a
school cultural effect. Pediatric Exercise Science 24 (1), 45–57.
Themane, M., Koppes, L., Kemper, H., Monyeki, K. & Twisk, J. 2006. The relationship
between physical activity, fitness and educational achievement of rural South
African children. Journal of Physical Education and Recreation 12 (1), 48–54.
Tomkinson, G. R. & Olds, T. S. 2007. Secular changes in pediatric aerobic fitness test
performance: The global picture. Medicine and Sport Science 50, 46–66.
Tremarche, P. V., Robinson, E. M. & Graham, L. B. 2007. Physical education and its
effect on elementary testing results. Physical Educator 64 (2), 58–64.
Tremblay, M. S., Inman, J. W. & Willms, J. D. 2000. The relationship between physical
activity, self-esteem, and academic achievement in 12-year-old children. Pediatric Exercise Science 12 (3), 312–323.
Tremblay, M. S., LeBlanc, A. G., Janssen, I., Kho, M. E., Hicks, A., Murumets, K., Colley,
R. C. & Duggan, M. 2011a. Canadian sedentary behaviour guidelines for children
and youth. Applied Physiology, Nutrition, and Metabolism 36 (1), 59–64.
Tremblay, M. S., LeBlanc, A. G., Kho, M. E., Saunders, T. J., Larouche, R., Colley, R. C.,
Goldfield, G. & Gorber, S. C. 2011b. Systematic review of sedentary behaviour
and health indicators in school-aged children and youth. International Journal
of Behavioral Nutrition and Physical Activity 8 (1), 98.
Tremblay, M. S., Warburton, D. E., Janssen, I., Paterson, D. H., Latimer, A. E., Rhodes,
R. E., Kho, M. E., Hicks, A., LeBlanc, A. G. & Zehr, L. 2011c. New Canadian physical
activity guidelines. Applied Physiology, Nutrition, and Metabolism 36 (1), 36–
46.
Troiano, R. P., Berrigan, D., Dodd, K. W., Mâsse, L. C., Tilert, T. & McDowell, M. 2008.
Physical activity in the United States measured by accelerometer. Medicine and
Science in Sports and Exercise 40 (1), 181–188.
Trost, S. G. 2008. Physical education, physical activity, and academic performance in
youth. Chronicle of Kinesiology and Physical Education in Higher Education 19
(3), 33–40.
85
Trudeau, F. & Shephard, R. J. 2010. Relationships of physical activity to brain health
and the academic performance of schoolchildren. American Journal of Lifestyle
Medicine 4 (2), 138–150.
Trudeau, F. & Shephard, R. J. 2008. Physical education, school physical activity,
school sports and academic performance. The International Journal of Behavioral Nutrition and Physical Activity 5, 10.
Tuckman, B. W. & Hinkle, J. S. 1986. An experimental study of the physical and psychological effects of aerobic exercise on schoolchildren. Health Psychology 5
(3), 197–207.
US Department of Health and Human Services & US Department of Health and Human Services 2008. Physical activity guidelines for Americans. Available at:
http://www.health.gov/paguidelines/pdf/paguide.pdf. Assessed 29 April
2014.
Van Dusen, D. P., Kelder, S. H., Kohl III, H. W., Ranjit, N. & Perry, C. L. 2011. Associations of physical fitness and academic performance among schoolchildren. Journal of School Health 81 (12), 733–740.
Vaynman, S., Ying, Z. & Gomez-Pinilla, F. 2004. Hippocampal BDNF mediates the efficacy of exercise on synaptic plasticity and cognition. European Journal of Neuroscience 20 (10), 2580–2590.
Verret, C., Guay, M. C., Berthiaume, C., Gardiner, P. & Beliveau, L. 2012. A physical
activity program improves behavior and cognitive functions in children with
ADHD: An exploratory study. Journal of Attention Disorders 16 (1), 71–80.
Vindfeld, S., Schnohr, C. & Niclasen, B. 2009. Trends in physical activity in Greenlandic schoolchildren, 1994–2006. International Journal of Circumpolar Health
68 (1), 42–52.
Voss, M. W., Chaddock, L., Kim, J. S., VanPatter, M., Pontifex, M. B., Raine, L. B., Cohen,
N. J., Hillman, C. H. & Kramer, A. F. 2011. Aerobic fitness is associated with
greater efficiency of the network underlying cognitive control in preadolescent
children. Neuroscience 199 (29), 166–176.
Wang, M. C., Haertel, G. D. & Walberg, H. J. 1994. What helps students learn? Educational Leadership 51 (4), 74–79.
Weber, H. S., Lu, L., Shi, J. & Spinath, F. M. 2013. The roles of cognitive and motivational predictors in explaining school achievement in elementary school. Learning and Individual Differences 25, 85–92.
Weis, R. & Cerankosky, B. C. 2010. Effects of video-game ownership on young boys’
academic and behavioral functioning: A randomized, controlled study. Psychological Science 21 (4), 463–470.
Welk, G. J., Jackson, A. W., Morrow, J., James, R., Haskell, W. H., Meredith, M. D. &
Cooper, K. H. 2010. The association of health-related fitness with indicators of
academic performance in Texas schools. Research Quarterly for Exercise and
Sport 81 (Supplement 2), 16S–23S.
Wenger, E. 2000. Communities of practice and social learning systems. Organization
7 (2), 225–246.
Wenger, E. 1998. Communities of practice: Learning, meaning, and identity. Cambridge University Press.
Wigfield, A. & Cambria, J. 2010. Students’ achievement values, goal orientations, and
interest: Definitions, development, and relations to achievement outcomes. Developmental Review 30 (1), 1–35.
86
Williams, P. A., Haertel, E. H., Haertel, G. D. & Walberg, H. J. 1982. The impact of leisure-time television on school learning: A research synthesis. American Educational Research Journal 19 (1), 19–50.
Willoughby, T. 2008. A short-term longitudinal study of Internet and computer game
use by adolescent boys and girls: Prevalence, frequency of use, and psychosocial
predictors. Developmental Psychology 44 (1), 195–204.
Wingfield, R. J., Graziano, P. A., McNamara, J. P. H. & Janicke, D. M. 2011. Is there a
relationship between body mass index, fitness, and academic performance?
Mixed results from students in a Southeastern United States elementary school.
Current Issues in Education 14 (2).
Winne, P. H. & Nesbit, J. C. 2010. The psychology of academic achievement. Annual
Review of Psychology 61, 653–678.
Wittberg, R., Cottrell, L. A., Davis, C. L. & Northrup, K. L. 2010. Aerobic fitness thresholds associated with fifth grade academic achievement. American Journal of
Health Education 41 (5), 284–291.
Wittberg, R. A., Northrup, K. L. & Cottrell, L. A. 2012. Children’s aerobic fitness and
academic achievement: A longitudinal examination of students during their fifth
and seventh grade years. American Journal of Public Health 102 (12), 2303–
2307.
World Health Organization 2010. Global recommendations on physical activity for
health. Available: http://whqlibdoc.who.int/publications/2010/97892415
99979_eng.pdf?ua=1. Assessed 29 April 2014.
Wright, J. C., Huston, A. C., Murphy, K. C., St Peters, M., Piñon, M., Scantlin, R. & Kotler,
J. 2001. The relations of early television viewing to school readiness and vocabulary of children from low-income families: The early window project. Child Development 72 (5), 1347–1366.
Wu, C. T. & Hillman, C. H. 2013. Aerobic fitness and the attentional blink in preadolescent children. Neuropsychology 27 (6), 642–653.
Wu, C. T., Pontifex, M. B., Raine, L. B., Chaddock, L., Voss, M. W., Kramer, A. F. & Hillman, C. H. 2011. Aerobic fitness and response variability in preadolescent children performing a cognitive control task. Neuropsychology 25 (3), 333–341.
Yu, C., Chan, S., Cheng, F., Sung, R. & Hau, K. 2006. Are physical activity and academic
performance compatible? Academic achievement, conduct, physical activity
and self-esteem of Hong Kong Chinese primary school children. Educational
Studies 32 (4), 331–341.
Zimmerman, F. J. & Christakis, D. A. 2005. Children’s television viewing and cognitive
outcomes: A longitudinal analysis of national data. Archives of Pediatrics & Adolescent Medicine 159 (7), 619–625.
Zimmerman, F. J. & Christakis, D. A. 2007. Associations between content types of
early media exposure and subsequent attentional problems. Pediatrics 120 (5),
986–992.
Åberg, M. A. I., Pedersen, N. L., Torén, K., Svartengren, M., Bäckstrand, B., Johnsson,
T., Cooper-Kuhn, C. M., Åberg, N. D., Nilsson, M. & Kuhn, H. G. 2009. Cardiovascular fitness is associated with cognition in young adulthood. Proceedings of the
National Academy of Sciences 106 (49), 20906–20911.
87
88
APPENDICES
89
90
APPENDIX 1. Summary of studies examining the association of physical activity with academic performance and cognitive functions published in 2008 and after.
Authors publication year
Age and number of
subjects, design,
year, country (if
mentioned)
Measurement of PA and fitness, academic achievement
and cognitive functions
Main results
Ardoy et al.
2014.
13 y, n=67, a 4month group-RCT:
control group receiving 2 usual PE lessons, experimental
group #1 receiving 4
usual PE lessons and
experimental group
#2 receiving 4 high
intensity PE lessons,
2007, Spain.
Academic achievement with
grades in the core subjects
(Math and Language), average score of others subjects,
average score of all subjects
and average score excluding
PE, cognitive functions with
the M (medium) version of
the Spanish Overall and Factorial Intelligence Test (IGFM).
Experimental group #2 improved significantly in average
academic achievement (except
language achievement), nonverbal and verbal abilities, abstract reasoning, spatial ability,
numerical ability and verbal
reasoning, compared to control
group or experimental group
#1. There were no differences
between experimental group
#1 and control group.
Best et al.
2012.
6─10 y, n=33, a 2 x 2
within-subject experimental design: children’s cognitive
functions were assessed after PA
(physically active
video games versus
sedentary video activities) and cognitive
engagement (challenging and interactive video games versus repetitive video
activities), Georgia.
Inhibitory control with a
modified flanker task: the
Child Attention Network Test
(ANT-C).
Children’s speed to resolve interference from conflicting
visuospatial stimuli was enhanced after PA (exergaming),
compared to sedentary activities. Cognitive engagement had
no effect on task performance.
Blom et al.
2011.
Grades 3–8, n=2992,
cross-sectional,
2007–2008, US.
Physical fitness with FITNESSGRAM® (composite score of
PACER, curl-ups, push-ups,
trunk lifts, sit and reach test,
and skinfold/BMI), academic
achievement with the Mississippi Curriculum Test (MCT2)
for language arts and mathematics.
Positive correlation between
overall physical fitness and language arts and math achievements.
Booth et al.
2014.
11 y at baseline,
n=4755, the Avon
Longitudinal Study of
Parents and Children: 2002–
2003→2004–
2005→2007–2010,
UK.
Objectively measured MVPA
with Actigraph AM 7164 2.2
accelerometer (7 days, at
least 3 days of 10 h valid
data), academic achievement
with nationally administered
school assessments in
mother tongue, math and science.
MVPA predicted increased performance in mother tongue in
both sexes at the ages of 11, 13
and 16. MVPA predicted increased performance in math
in both sexes at the age of 16,
but not at the age of 11 or 13.
For females, the MVPA predicted increased science scores
at 11 and 16, but not for males.
91
APPENDIX 1. Continued.
Buck,
Hillman &
Castelli 2008.
7─12 y, n=74,
cross-sectional, US.
CRF with FITNESSGRAM®
(PACER), inhibitory control
with the Stroop task (word,
colour, colour-word).
Greater CRF was associated
with better performance in
each of the three conditions in
the Stroop task.
Budde et al.
2008.
13─16 y, n=115, children’s attention performance were
measured after a
regular school lesson
(pre-test) and after
10 min. of coordinative exercise (experimental group) or of a
normal sport lesson
(control group),
Germany.
Attention and concentration
with the d2-test.
Both groups had enhanced
attention and concentration
performance with a significantly higher progression in
the experimental group.
Castelli et al.
2011.
8.8 y, n=59, crosssectional: children
participated in a 9month physical activity programme during which their PA
was measured, US.
PA with Polar heart-rate
monitors and time below,
time at, and time above the
target heart rate were recorded, CRF with maximal
treadmill test using a modified Balke protocol, cognitive
functions with the Stroop
Color-Word Test and the
Comprehensive Trail-Making
Test.
CRF has no correlation with
cognitive functions. Mean time
above the target hearth zone
was associated with high executive function demand (Stroop
Color-Word & Trail-Making
part B).
Carlson et al.
2008.
From kindergarten to
5th grade, n=5316,
the Early Childhood
Longitudinal Study,
fall 1998→ spring
2004, US.
Classroom teachers measured the time spent in PE
(minutes per week), academic achievement with
standardized tests for math
and reading.
The higher amount of PE was
positively associated with math
and reading achievement in
girls, but not in boys.
Chaddock et
al. 2010.
9─10 y, n=49, crosssectional, US.
CRF with maximal treadmill
test using a modified Balke
protocol, memory with item
and relational memory paradigm.
CRF had a positive association
with relational memory task
performance, but no association with item memory task
performance.
Chaddock et
al. 2010.
9─10 y, n=55, crosssectional, US.
CRF with maximal treadmill
test using a modified Balke
protocol, inhibitory control
with a modified version of
the Eriksen flanker task.
More fit children had less percent interference compared to
less fit children. CRF fitness had
no association with flanker accuracy or reaction time.
Chaddock et
al. 2011.
9─10 y, n=46, crosssectional, US.
CRF with maximal treadmill
test using a modified Balke
protocol, memory performance with a modified version of a memory task developed by Henke et al.
CRF fitness had a positive association with relational memory
accuracy, but had no association with non-relational
memory accuracy.
92
APPENDIX 1. Continued.
Chaddock et
al. 2012.
9─10 y, n=32, crosssectional, US.
CRF with maximal treadmill
test using a modified Balke
protocol, inhibitory control
with a modified version of
the Eriksen flanker task.
There were no group differences in congruent accuracy.
During incongruent trials, only
more fit children maintained
accuracy across the blocks.
There were no group differences in reaction times.
Chaddock et
al. 2012.
9─10 y, n=32, longitudinal: one year follow-up, US.
CRF with maximal treadmill
test using a modified Balke
protocol, inhibitory control
with a modified version of
the Eriksen flanker task.
More fit children had higher
accuracy than less fit children
across compatibility task conditions and test sessions. More
fit children maintained accuracy across compatible and incompatible task conditions,
whereas less fit children
showed lower accuracy in the
incompatible condition relative
to the compatible condition.
More fit children also had
faster reaction times at followup.
Chaddock et
al. 2012.
8─10 y, n=26, crosssectional, US.
CRF with maximal treadmill
test using a modified Balke
protocol, cognition with Virtual reality street crossing
paradigm.
More fit children maintained
performance in street-crossing
across all 3 conditions,
whereas less fit children
showed decreased performance when on the phone, relative to being undistracted or
listening to music.
ChaddockHeyman et al.
2013.
8–9 y, n=23, a RCT:
60+ minutes of PA 5
days per week for 9
months, US.
Inhibitory control with a
modified flanker task, including three task condition: neutral, incongruent, and NoGo
trials.
Children who participated in
the PA programme improved
their performance in the inhibitory control task at the level of
young adults at post-test, while
the control group still differed
from the young adults.
Chih et al.
2011.
11–12 y, n=476,
cross-sectional,
2006–2010, China.
Physical fitness measured
with sit and reach test, bentknee sit-ups for one minute,
800m run/walk and standing
long jump, academic achievement in math and mother
tongue.
Physical fitness variables were
not associated with academic
achievement. PE performance
was positively associated with
academic achievement.
93
APPENDIX 1. Continued.
Chomitz et al.
2009.
Grades 4,6,7,8 (mean
age 11.7 y), n=1478,
cross-sectional,
2004–2005, US.
Physical fitness with five tests
adapted from the Amateur
Athletic Union (AAU) and FITNESSGRAM® (composite
score of an endurance cardiovascular test, an abdominal
strength test, a flexibility test,
an upper-body strength test,
and an agility test), the Massachusetts Comprehensive
Assessment System (MCAS)
for math and English.
Overall physical fitness was
positively associated with passing the MCAS English test and
the MCAS Mathematics test.
Crova et al.
2014.
9–10 y, n=70, a RCT:
6-month enhanced
PE programme including cognitively
demanding (open
skill) activities or curricular physical education only, Italy.
The random number generation (RNG) task measuring inhibitory control and working
memory.
Overweight children participating in cognitively demanding
activities improved their inhibitory control but not working
memory ability, compared to
lean children and children who
participated in curricular PE.
More fit children had better inhibitory control but not working memory performance,
compared to less fit children.
Davis &
Cooper 2011.
7–11 y, n=170, crosssectional, 2003–
2006, US.
CRF fitness with a graded
treadmill test (Modified
Balke, Protocol for Poorly Fit
Children), academic achievement with the WoodcockJohnson Tests of Achievement III: The Broad Reading
and Broad Mathematics clusters, cognitive functions with
the Cognitive Assessment
System (CAS) consisting of 4
sub-categories: Planning, Attention, Simultaneous, and
Successive.
Peak VO2 and treadmill time
were positively associated with
math and reading test. Peak
VO2 and treadmill time were
positively associated with performance in Planning and Attention categories. Peak VO2
and treadmill time were not associated with performance in
Simultaneous or Successive
categories.
Davis et al.
2011.
7–11 y, n=171, a
RCT: exercise programme adding 20 or
40 minutes of aerobic exercise per day
for 13 weeks, 2003–
2006, US.
Academic achievement with
the Woodcock-Johnson Tests
of Achievement III: The Broad
Reading and Broad Mathematics clusters, cognitive
functions with the Cognitive
Assessment System (CAS)
consisting of 4 sub-categories: Planning, Attention, Simultaneous, and Successive
and Antisaccade task.
There was a dose-response
benefit of PA on mathematics
achievement, planning ability
and inhibition. PA was not associated with reading achievement or attention, simultaneous, and successive performance.
94
APPENDIX 1. Continued.
Donelly. et al.
2009.
7–9 y (at baseline),
n=1527, a threeyear, cluster-RCT: 90
minutes of MVPA
was combined with
learning objectives in
academic lessons
during school week,
2003→2006, US.
Academic achievement with
the Wechsler Individual
Achievement Test (2nd Edition) for reading, writing,
mathematics and oral language skills.
Academic achievement scores
for composite, reading, spelling
and math significantly improved from baseline to three
years in children participating
in intervention, compared to
control group.
Drollette et al.
2012.
9─11 y, n=36, a
within-subjects
counterbalanced design: children’s cognitive performance
were measured before, during or after
walking or seated
rest, US.
Inhibitory control and working memory with a modified
flanker task and a modified
spatial n-back task.
After moderately intense aerobic walking, children’s performance in inhibitory control improved but working memory,
compared to seated rest. There
were no changes in task performance during actively walking
or at seated rest in both tasks.
Drollette et al.
2014.
8─10 y, n=40, children categorized by
higher- and lowertask performance
completed inhibitory
control task before
and after 20 min. of
treadmill walking
and seated rest, US.
Inhibitory control with a
modified flanker task.
Following exercise, higher-performers maintained accuracy
compared to seated rest,
whereas lower-performers
demonstrated improvements
in inhibitory control accuracy
following exercise.
Duncan &
Johnson 2014.
8–11 y, n=18, a repeated measures design: children completed academic
achievement test following rest and two
different intensity
exercises, UK.
20 minutes of rest, 20
minutes on a cycling ergometer at 50% HRR, and 20
minutes on a cycling ergometer at 75% HRR, academic
achievement with the Wide
Range Achievement Test
(WRAT 4).
High and moderate intensity
exercise improved spelling.
Moderate intensity exercise
improved reading. Exercise had
no effect on sentence comprehension, but attenuated arithmetic.
Edwards,
Mauch & Winkelman 2011.
11–13 y, n=800,
cross-sectional,
2005, US.
PA with Youth Risk Behavior
Surveillance Survey, physical
fitness with FITNESSGRAM®
(aerobic capacity with the
mile run, muscle strength
with push-ups and curl-ups),
academic achievement with
measures of Academic Progress (MAP) standardized
tests for math and reading.
Vigorous PA, but not moderated PA, CRF and participation
in sports teams were positively
associated with MAP math
scores. Vigorous PA and moderate PA was positively associated with MAP reading scores.
Increased CRF or participation
in sports teams were not associated with MAP reading
scores. Curl-ups and push-ups
were not associated with MAP
math or reading scores.
95
APPENDIX 1. Continued.
Ericsson 2008.
Grades 1-3, n=251,
controlled intervention: intervention
groups with 5 PE lessons and 1 motortraining lesson per
week, control group
with 2 PE lessons per
week, 1999─2002,
Sweden.
Academic achievement with
the national tests for mother
language and mathematics,
and reading development
test, attention with Conners’
abbreviated questionnaire
filled in by teacher.
Children participating in intervention outperformed control
children in reading development, mother language and
mathematic tests. Intervention
children had better teacher-reported attention (attention/
hyperactivity and impulse control, attention in total) in
school year 2, but the difference were small and did not remain in school year 3.
EvelandSayers et al.
2009.
Grades 3─5 (mean
age 9.7 y), 134,
cross-sectional,
2005, US.
CRF with one-mile run time,
muscular fitness with combination of curl-ups and sitand-reach test, academic
achievement with the TerraNova achievement test for
math and reading/language
arts.
A negative association between one-mile run times and
math scores in girls (also for total group). Negative association
between one-mile run times
and reading scores in girls. A
positive relationship between
muscular fitness and math
scores only in total. No relationship between muscular fitness and reading/language
arts.
Fisher et al.
2011.
6.2 y, n=64, a RCT: an
experiment group
with 2 hours of aerobic exercise lessons
per week for 10
weeks and a control
group with 2 hours
of standard physical
education lessons,
UK.
Cognitive function with the
Cognitive Assessment System
(CAS) consisting of four subcategories: Planning, Attention, Simultaneous, and Successive, the Cambridge Neuropsychological Test Battery
(CANTAB) with tests SSP and
SWM, measuring working
memory, the Attention Network Test (ANT) measuring
inhibition.
Children participating in intervention outperformed control
children in working memory
and inhibition measures (SSP,
SWM, ANT accuracy) at posttest, but did not have better
performance in other cognitive
tests measuring planning, attention, simultaneous and successive.
Fox et al.
2010.
14.9 y, n=4746,
cross-sectional,
1998–1999, US.
PA with self-reported PA and
sport team participation, academic achievement with selfreported GPA.
For high-school girls, PA and
sports team participation were
each independently associated
with higher GPA. For highschool boys, only sports team
participation was independently associated with
higher GPA. For middle-school
girls, PA (not sports team participation) were associated
with higher GPA. For middleschool boys, PA and sports
team participation were associated with higher GPA.
96
APPENDIX 1. Continued.
Gallotta et al.
2012.
8─11 y, n=138, children’s attention abilities were tested before and immediately after school
curricular lesson, traditional PE lesson,
and coordinative PE
lesson.
Attention performance with
the d2 Test.
Each exertion type led to enhanced attention performance.
Coordinative PE lessons led to
a lower improvement in attentional performances, compared
with both traditional physical
education lessons and school
curricular lessons.
Haapala et al.
2014a.
6–8 y, n=186, prospective longitudinal:
The Physical Activity
and Nutrition in Children (PANIC) study
and The First Steps
Study, 2007─2009
and 2006─2011, Finland.
PA with the PANIC Physical
Activity Questionnaire, academic achievement with the
nationally normed reading
achievement battery (ALLU)
for reading comprehension
and fluency, and with a basic
arithmetic test.
Children who had more PA during recess and children who
most often commuted actively
to school had better reading
fluency across grades 1–3. Children who engaged in organized
sports had better arithmetic
skills. Among boys, higher levels total PA and physically active school transportation were
associated with reading fluency
and reading comprehension.
Among girls, total PA was positively associated with reading
fluency and arithmetic skills
only girls, whose parents had
university level education,
while the association was inverse in girls whose parents
were less educated.
Haapala et al.
2014b.
6─8 y, n=167, longitudinal: The Physical
Activity and Nutrition
in Children (PANIC)
study and The First
Steps Study,
2007─2009 and
2006─2011, Finland.
CRF with a maximal cycle ergometer test, academic
achievement with the nationally normed reading achievement battery (ALLU) for reading comprehension and fluency, and with a basic arithmetic test.
CRF was not related to reading
fluency, reading comprehension or arithmetic skills.
Hill et al. 2010.
8─11 y, n=1224, a
randomized crossover design: children
in two groups received 30 minutes of
classroom-based
physical exercise for
one week and no exercise during the
other.
Cognitive performance with
paced serial addition, size ordering, listening span, digitspan backwards, digit-symbol
encoding.
Exercise benefit cognition:
Group B receiving exercise during the second week gained
benefits. However, group A receiving exercise during the
firsts week did not gained benefits from exercise.
97
APPENDIX 1. Continued.
Hillman et al.
2009.
9.4 y, n=38, crosssectional, US.
CRF with FITNESSGRAM®
(PACER), inhibitory control
with the Eriksen flanker task.
CRF has positive association
with flanker task accuracy
across conditions. Fitness has
no association with reaction
time.
Hillman et al.
2009.
9.5 y, n=20, a withinsubjects design: children completed cognitive testing after
rest and exercise, US.
Inhibitory control with a
modified Flanker task, academic achievement with the
Wide Range Achievement
Test - 3rd edition (WRAT3)
for reading, spelling and
arithmetic.
After acute exercise, reading
comprehension test performance increased. Acute exercise did not affect spelling or
arithmetic. Acute treadmill
walking did not affect response
speed in flanker task. Response
accuracy in incongruent flanker
task trials increased after walking. Response accuracy in congruent condition was not affected.
Hogan et al.
2013.
13─14 y, n=30, children classified as fit
or unfit performed
cognitive tasks after
a 20 minutes of moderate intensity biking
exercise and a period
of relaxation, Germany.
Physical fitness with a continuous-graded maximal exercise test, inhibitory control
with Go/NoGo version of the
Erikson flanker task.
Acute PA or fitness level had
no effect on reaction time in
inhibitory control task. However, fit participants had significantly faster reaction times in
the exercise condition in comparison with the rest condition
and unfit participants showed
significantly higher error rates
for NoGo relative to Go trials in
the rest condition, compared
to exercise condition.
Kamijo et al.
2011.
7–9 y, n=43, a RCT:
9-month afterschool
physical activity programme including
two hours per school
day of aerobically demanding physical activities, US.
Working memory with a
modified Sternberg task.
Response accuracy at post-test
was greater than pre-test for
the intervention group, but no
such difference existed the for
control group. There were no
differences between groups in
reaction times.
Kantomaa et
al. 2010.
15–16 y, n=7344,
cross-sectional: The
Northern Finland
Birth Cohort, 2001–
2002, Finland.
PA with self-reported MVPA,
academic achievement with
self-reported GPA.
MVPA was positively associated with GPA.
Kantomaa et
al. 2013.
7–8 y → 15–16 y,
n=8061, longitudinal:
The Northern Finland
Birth Cohort, 1992–
1004 → 2001–2002,
Finland.
Parent-reported motor function, self-reported PA, predicted cardiorespiratory fitness with a submaximal cycle
ergometer test, teacherrated GPA.
PA was associated with a
higher GPA. Compromised motor function in childhood had a
negative indirect effect on adolescents’ academic achievement via physical inactivity and
obesity, not via CRF.
98
APPENDIX 1. Continued.
Kristjánsson et
al. 2009.
14–15 y, n=5810,
cross-sectional:
Youth in Iceland,
2000, Iceland.
PA with self-reported PA, academic achievement with
self-reported grades.
PA was positively and moderately related to academic
achievement.
Kristjánsson,
Sigfúsdóttir &
Allegrante
2010.
14–15 y, n=6346,
cross-sectional:
Youth in Iceland,
2000, Iceland.
PA with self-reported PA, academic achievement with
self-reported grades.
PA had direct positive association with academic achievement. Self-esteem was a weak
mediator of the association of
PA and academic achievement.
Kwak et al.
2009.
16 y, n=232, crosssectional, Sweden.
Objectively measured PA
with an accelerometer
(model WAM 7164) (4 days,
at least 3 days of 10 h valid
data), CRF with a maximal cycle ergometer test, academic
achievement with scores
from schools.
Vigorous PA was positively associated with GPA only in girls.
CRF was positively associated
with GPA only in boys.
LeBlanc et al.
2012.
Grades 4–6 (mean
age 10.4 y), n=261,
cross-sectional, US.
Objectively measured PA
with an ActiGraph GT1M accelerometer (3 days, at least
2 days of 10h valid data), academic achievement with criterion-referenced tests for
English/language arts, math,
science and social studies.
Objectively measured MVPA
was not associated with English, math, science, or social
studies.
London &
Castrechini
2011.
Grades 4–6 at baseline, n=2735, longitudinal: the Youth Data
Archive (YDA), 2002–
2003 → 2007–2008,
US.
Physical fitness with FITNESSGRAM® (composite
score of aerobic capacity,
body composition, abdominal
strength and endurance,
trunk extensor strength and
endurance, upper body
strength and endurance, and
flexibility), academic achievement with the California
standardized test (CST) in
math and English/language
arts.
Overall physical fitness was
positively associated with English and math in total. From
5th- to 7th-grade, overall physical fitness was positively associated with math, but not associated with English. For 7th-to
9th-grade, overall physical fitness was positively associated
with math. For 7th-to 9th-grade,
overall physical fitness was
positively associated with English only in girls.
MartínezGómez et al.
2012.
13–17 y, n=1825,
cross-sectional,
2007–2008, Spain.
PA with the Physician-based
Assessment and Counselling
for Exercise (PACE+) questionnaire, academic achievement with self-reported
grades.
In boys, there was no association between PA and academic
performance. In girls, PA was
associated with good math and
language + math performance,
but not language only.
Monti, Hillman
& Cohen 2012.
9.5 y, n=44, a RCT: a
9-month after-school
aerobic exercise intervention including
at least 70 min of
MVPA every schoolday, US.
Memory performance with a
memory task inspired by
Hannula et al. 2007 containing relational and item
memory conditions.
There were no differences in
memory performance between
children participating in the
aerobic exercise programme
and the control group.
99
APPENDIX 1. Continued.
Moore et al.
2014.
9─10 y, n=40, crosssectional, US.
CRF with maximal treadmill
test using a modified Balke
protocol, mathematics
achievement with the Kaufman Test of Academic and
Educational Achievement 2
(KTEA-2) and with an experimental arithmetic verification
task, including small and
large addition problems).
There were no differences in
mathematics achievement.
More fit children had better
performance in arithmetic verification tasks, including large
addition problems, compared
to less fit children.
O’Dea &
Mugridge
2012.
Grades 3-7, n=824,
cross-sectional,
2008, Australia.
Self-reported PA, the standardized National Assessment
Program for Literacy and Numeracy (NAPLAN).
PA was not associated with literacy scores. PA was positively
associated with math scores in
boys, but not in girls.
Padilla-Moledo et al.
2012.
6─17.9 y, n=690,
cross-sectional,
Spain.
Muscular fitness with standing long jump test and basketball throwing test, self-reported academic performance compared with those
of their classmates.
Low muscular fitness was associated with low academic performance.
Perce et al.
2009.
11─12 y, n=52, children’s cognitive
functions were
measured right after
two physical education lessons (aerobic
circuit training or
team games) and
baseline session, Italy.
Free-recall memory performance with a test involving
free-recall of items from a 20item word list.
The team games (not the circuit training) improved immediate recall scores in both primacy and recency portions,
compared to the baseline session. Both team game and circuit training improved delayed
recall scores in the recency
portion (not in primacy), compared to the baseline session.
Pontifex et al.
2011.
Mean age 10.1 y,
n=48, cross-sectional, US.
CRF with maximal treadmill
test using a modified Balke
protocol, inhibition with a
modified version of the
Eriksen flanker task.
More fit children maintained
accuracy across compatible
and incompatible task conditions, whereas less fit children
showed lower accuracy in the
incompatible condition relative
to the compatible condition.
There were no group differences in reaction times.
Pontifex et al.
2012.
9─11 y, n=62, crosssectional, US.
CRF with maximal treadmill
test using a modified Balke
protocol, inhibition with a
modified version of the
Eriksen flanker task.
Less fit children had poorer
overall accuracy compared to
more fit children, with a
greater number of errors of
omission, as well as longer and
more frequent sequential errors of omission.
100
APPENDIX 1. Continued.
Puder et al.
2011.
Mean age 5.1,
n=652, cluster-randomized controlled
single-blinded trial:
multidimensional
lifestyle intervention
including four 45 minute sessions of
physical activity a
week, 2008─2009,
Switzerland.
Cognitive functions with tests
of attention and spatial working memory.
The intervention had no effect
on cognitive abilities.
Raine et al.
2013.
9─10 y, n=48, crosssectional, US.
CRF with maximal treadmill
test using a modified Balke
protocol, memory and learning ability with a map task in
which children had to learn
the names of specific regions
on a map, under 2 learning
conditions in which they only
studied versus a condition in
which they were tested during study.
In terms of initial learning,
there were no differences in
task performance between
more fit and less fit children.
During the retention session,
more fit children outperformed
less fit children when the
study-only learning strategy
was used.
Reed et al.
2010.
9.5 y, n=155, a RCT:
90 minutes of physical activity was integrated into the core
curricula over four
months, children
were measured only
after the intervention, 2008, US.
Academic achievement with
the Palmetto Achievement
Challenge Tests (PACT) measuring English/language arts,
mathematics, science, and
social studies, cognitive functions with the Standard Progressive Matrices (SPM) Test
of Fluid intelligence (total
score).
Experimental group children
outperformed control children
in social studies mandated academic achievement test. There
were no significant differences
in English/language arts, math
and science achievement tests
between the experimental and
control groups. PA participation was positively associated
with fluid intelligence.
Reed et al.
2013.
Grades 2–8 (mean
age 10.2/11.2 y),
n=470, controlled intervention: sevenmonth intervention
providing 45 minutes
of daily physical education, 2009–2010,
US.
Cognitive functions with the
Standard Progressive Matrices (SPM) fluid intelligence
test (5 sets: A-E) and the Perceptual Speed Test (sections
1–3).
In elementary school, boys (not
girls) in experimental group improved fluid intelligence performance on section D more
than controls. In middle school,
girls in experimental group improved fluid intelligence performance on sections B, C, D
and E more than controls,
whereas boys in experimental
group improved their fluid intelligence performance on section E more than boys in control group. In elementary
school, girls (not) in experimental group improved perceptual speed on sections 2
and 3 more than controls.
101
APPENDIX 1. Continued.
Roberts, Freed
& McCarthy
2010.
Grades 5, 7 and 9,
n=1989, cross-sectional, 2002–2003,
US.
CRF with a one-mile run/walk
test, Academic achievement
with California Achievement
Tests version 6 (CAT6) and
California Standards Tests
(CST) for math and reading
(CAT) or math and language
(CST).
Low CRF was associated with
lower scores in math, reading
and language.
Ruiz et al.
2010.
13─18.5 y, n=1820,
cross-sectional,
2002─2002, Spain.
Self-reported participation in
sports, CRF with 20-minute
shuttle run test, upper-body
muscular strength with handgrip strength test, lower-body
muscular strength with
standing long jump test, cognitive functions with SRA Test
of Educational Ability (TEA).
Participation in sports was positively associated with cognitive performance (verbal, numeric, and reasoning abilities
and an overall score). CRF and
muscular fitness were not associated with cognitive performance.
Scudder et al.
2014.
9─10 y, n=46, crosssectional, US.
CRF with maximal treadmill
test according to a modified
Balke protocol, academic
achievement with the Standard Progressive Matrices
(WRAT3) for reading, spelling,
and arithmetic, sentence processing with Neuroscan
STIM2 software.
More fit children had greater
reading and spelling scores
compared to less fit children.
There were no differences in
arithmetic scores. In sentence
processing tasks, more fit children exhibited overall shorter
response times and performed
more accurately across all sentence types.
Shi et al. 2013.
7–14 y, n=3708,
cross-sectional,
2008–2009, US.
PA with self-reported PA, academic achievement with
self-reported academic problems.
PA was associated with less academic problems.
So 2012.
Grades 7–12,
n=75066, cross-sectional: Korea Youth
Risk Behavior Webbased Survey
(KYRBWS-V), 2009,
Korea.
PA with self-reported frequency of VPA, frequency of
MPA and frequency of
strengthening exercises, selfreported academic performance.
VPA was positively associated
with academic performance in
boys, but not in girls. MPA was
positively associated with academic performance in both
boys and girls. Strengthening
exercises were not associated
with academic performance.
102
APPENDIX 1. Continued.
Spitzer &
Hollmann
2013.
12–13 y, experiment
#1 n=44, experiment
#2 n=88, 2 experimental observations:
3 extra exercise lessons were added to
school week for 4
months, Germany.
Academic achievement with
academic grades in mathematics, German (mother
tongue), and English (foreign
language), the d2 test of attention.
In experiment #1, children participating in extra exercise
slightly improved German
grades, while the control group
children worsened their
grades. There were no changes
in math or English scores. In experiment #2, children participating in extra exercise improved math grades, while the
control group children had
worse math grades. There
were no changes in German or
English scores. In experiment
#2, children who participated
in extra exercise had higher
performance in attention tests
compared to control children,
but not in experiment #1.
Stevens et al.
2008.
From kindergarten to
5th grade, n~3200,
the Early Childhood
Longitudinal Study,
1998–1999→2002,
US.
PA with parent-reported
physical activity of their children, academic achievement
with standardized test scores
in math and reading.
PA was positively associated
with mathematics and reading
achievements in boys and girls.
Stroth et al.
2009.
13─14 y, n=35, a controlled cross-over
study design: children classified as fit
and unfit performed
cognitive task after
20 minutes of cycling
exercise and 20
minutes of a rest period, Germany.
CRF with a continuous graded
maximal exercise test, inhibitory control with a Go/NoGo
version of the Eriksen flanker
task.
Neither CRF nor exercise had
any association with inhibitory
control performance.
Telford et al.
2012.
Grades 2 and 4,
n=757, cross-sectional, Australia.
Objectively measured PA
with pedometers, CRF with
20 minutes multistage run,
academic achievement with
government literacy and
math test scores.
PA and CRF were not associated with reading scores. CRF,
but not PA, was positively associated with numeracy scores.
PA and CRF were positively associated with writing scores.
Van Dusen et
al. 2011.
Grades 3–11,
254743, cross-sectional, 2008–2009,
US.
Physical fitness with FITNESSGRAM® (CRF with the
mile run or PACER test, muscular fitness with curl-ups,
trunk lift and push-ups, and
flexibility with shoulder
stretch or the sit-and-reach
test.), academic achievement
with Texas Assessment of
Knowledge and Skills (TAKS™)
for reading and math.
All physical fitness variables
were positively associated with
math and reading.
103
APPENDIX 1. Continued.
Vindfeld,
Schnohr & Niclasen 2009.
11–17 y, n=1366,
cross-sectional: the
Health Behaviour in
School-Aged Children
(HBSC) study in
Greenland, 2006,
Greenland.
PA with self-reported PA, academic achievement with
self-reported academic
achievement.
PA was positively associated
with overall self-reported academic achievement.
Voss et al.
2011.
9─10 y, n=36, crosssectional, US.
CRF with maximal treadmill
test using a modified Balke
protocol, inhibitory control
with a modified version of
the Eriksen flanker task.
More fit children were more
accurate for the incongruent
condition but not the congruent condition, compared to
less fit children. There were no
differences in reaction times.
Welk et
al.2010.
Grades 3–12, 1770–
6864, cross-sectional, 2007, USA.
CRF with FITNESSGRAM® (the
mile run or the Pacer), academic achievement with
Texas Assessment of
Knowledge and Skills
(TAKS™).
CRF fitness was positively associated with academic performance (overall knowledge and
skills assessment).
Wingfield et
al. 2011.
Grades 4─5, 132,
cross-sectional,
2008─2009, US.
Physical fitness with the President’s Challenge Physical Activity and Fitness Awards Program (composite score of
curl-ups, shuttle run, one
mile run/walk, pull-ups,
flexed-arm hanging), academic achievement with the
Florida Comprehensive Assessment Test (FCAT) for
reading and math.
Overall physical fitness was not
associated with reading and
math.
Wittberg et al.
2010.
Grade 5, n=1740,
cross-sectional,
2006–2008, US.
CRF with FITNESSGRAM® (the
mile run or the Pacer), academic achievement with
West Virginia standardized
academic test scores (WESTEST) for reading/ language
arts, math, science and social
studies.
CRF was positively associated
with academic performance.
Wittberg,
Northrup &
Cottrell 2012.
Grade 5 at baseline,
n=1725, longitudinal
study, 2005–2006 →
2007–2008, 2006–
2007 → 2008–2009,
2007–2008 → 2009–
2010, US.
CRF with FITNESSGRAM® (the
one-mile run or the PACER),
academic achievement with
West Virginia standardized
academic test scores (WESTEST) for reading/ language
arts, math, science and social
studies.
Students whose CRF stayed in
the “healthy” fitness zone had
significantly higher academic
scores than did students whose
CRF stayed in the “needs improvement” zone.
Wu et al.
2011.
8─11 y, n=48, crosssectional, US.
CRF with maximal treadmill
test using a modified Balke
protocol, inhibitory control
with a modified version of
the Eriksen flanker task.
More fit children had better response accuracy across task
conditions than lower fit children. There were no differences in reaction times.
104
APPENDIX 1. Continued.
Wu & Hillman
2013.
9─10 y, n=39, crosssectional, US.
CRF with maximal treadmill
test using a modified Balke
protocol, attention performance with a modified attentional blink paradigm with
the same experimental settings and methodology as
those used by Slagter et al.
(2007).
Higher-fit children had better
attentional task performance
than lower fit children.
Åberg et al.
2009.
15→18, 1221727,
longitudinal: Swedish men born 1950
through 1976 and
who were enlisted
for military service
between 1968 and
1994, Sweden.
CRF with a cycle ergometer
test. Isometric muscle
strength with knee extension,
elbow flexion, and hand grip,
intelligence with 4 cognitive
tests (logical performance
test, verbal test of synonyms
and opposites, test of
visuospatial/geometric perception, and technical/mechanical skills including mathematical/physics problems).
CRF (not muscular strength)
was positively associated with
intelligence. Changes in CRF
between age 15 and 18 years
predicted cognitive performance at the age of 18.
Abbreviations: CRF, cardiorespiratory fitness; GPA, grade point average; HRR, heart rate reserve;
MPA, moderate physical activity; MVPA, moderate to vigorous physical activity; PA, physical activity;
PACER, Progressive Aerobic Cardiovascular Endurance Run; PE, physical education; RCT, randomized controlled trial; VPA, vigorous physical activity.
105
APPENDIX 2. Summary of the studies examining the association of screen time with
academic performance and cognitive functions.
Authors and
publication
year
Age and number of
subjects, design,
year, country (if
mentioned)
Measurements of screen
time, academic achievement and cognitive functions
Main results
Bittman et
al. 2011.
Younger cohort:
0−1 y and older cohort 4−5 y at the
baseline, n=5107
and n=4983, longitudinal: the Longitudinal Study of
Australian Children
(LSAC): children
were assessed at
four time points
during two years,
2004−2007,
Australia.
TV viewing, computer use
and game console ownership with parent-reported
24 h diary kept during one
weekday and one weekend day, language ability
with the Peabody Picture
Vocabulary Test (3rd edition) (PPVT-III) and with
the Language and Literacy
Academic Rating Scale
(ARS).
TV viewing was not associated
with language skills. Computer
use was positively associated
with development of language
skills. The ownership of game
consoles was negatively associated with literature achievements in the older cohort.
Borzekowski
& Robinson
2005.
Grade 3, n=348,
cross-sectional,
1999−2000, US.
Media environment with
self-reported questionnaire, academic achievement with the Stanford
Achievement Test for
math, reading, and language arts.
Having TV in the children’s bedroom was negatively associated
with academic achievement.
Computer access and use were
positively associated with academic achievement.
Drowak et al.
2007.
13.5 y, n=11, children were exposed
to computer game
or video film between 6 pm – 7
pm, German.
Visual and verbal memory
with Swets Test Services 4
to 5 hours before bedtime
on each experimental day.
Excessive video game playing (but
not television viewing) resulted
decreased verbal memory performance (but not visuospatial
memory performance), compared to basal condition.
Dye &
Bavelier
2009.
7−22 y, n=131,
cross-sectional, US.
Video game play with selfreported questionnaire,
attention abilities (including inhibitory control) with
the Attentional Network
Test (ANT).
Action-game playing was associated with enhanced attention
skills.
106
APPENDIX 2. Continued.
Ennemoser
&
Schneider
2008.
6.4 y and 8.6 y,
n1=165 and n2=167,
longitudinal: children’s TV viewing
and reading performance were assessed at five time
points during four
years, 1998→2001,
German.
Screen time with parentreported diaries over 7
days, reading comprehension with a reading comprehension test developed
by Näslund (1990) (grades
1−2), a subtest of the
Knuspel Reading Test
(grades 3−4), a subtest of
the General School
Achievement Test (grades
2−3), and subtests of the
General German Language
Test and the Zurich Reading Comprehension Test
(grade 5), decoding speed
with the Wϋrzburg Silent
Reading Test.
TV viewing had a negative association with tests of reading speed
and comprehension. Children
classified as heavy TV viewers, especially having high amounts of
entertainment programme viewing, showed lower progress in
reading performance compared
to medium and light viewers in
both age-groups.
Espinoza
2009.
High school juniors,
cross-sectional, US.
TV viewing with determining the number of appliances in the house and the
time of operation of each
appliance, academic
achievement with physics
performance.
The number of television sets at
home and the number of hours
that the televisions are on were
negatively associated with student performance in physics.
Ferguson et
al. 2013.
10−17,
n=333/n=143,
cross-sectional/prospective
1-year longitudinal,
US.
Videogame playing with
self-reported questionnaire, academic achievement with Wide Range
Achievement Test-IV
(WRAT) for math,
visuospatial cognition with
the Kaufman Brief Intelligence Test-II.
Violent video game exposure was
not associated with math
achievement or visuospatial cognition in short-term or in longterm.
Gentile &
Walsh 2002.
2−17 y, n=527,
cross-sectional,
1998, US.
Family media habits and
academic achievement
with parent-reported
questionnaire.
Amount of TV viewing and TV in
children’s bedroom were negatively associated with school performance.
107
APPENDIX 2. Continued.
Haapala et
al. 2014a.
6–8 y, n=186, prospective longitudinal: The Physical
Activity and Nutrition in Children
(PANIC) study and
The First Steps
Study, 2007─2009
and 2006─2011,
Finland.
Sedentary behaviour with
the PANIC Physical Activity
Questionnaire, academic
achievement with the nationally normed reading
achievement battery
(ALLU) for reading comprehension and fluency,
and with a basic arithmetic
test.
Sedentary behaviour related to
academic skills in 1st grade were
positively associated with reading
fluency in grades 1–3. Among
boys (not among girls), higher
levels of sedentary behaviour related to academic skills and
higher computer use and video
game play were associated with
better reading fluency and arithmetic skills, respectively. TV viewing had no association with academic skills. Among girls, high
levels of total sedentary behaviour (including sedentary behaviours related to screen time, music, academic skills, arts, crafts,
games, and sitting and lying for a
rest) and sedentary behaviour related to music and arts, crafts
and games was negatively associated with arithmetic skills.
Hancox,
Milne &
Poulton
2005.
5→26 y, n=1037,
longitudinal: children were followed
from the birth to
age of 26, children
were born 1972
and 1973, New
Zealand.
TV viewing with parent- or
self-reported questionnaires at the age of 5, 7, 9,
11, 13 and 15, the highest
level of educational attainment with four-point
scale.
Television viewing in childhood
(ages 5–11 years) and adolescence (ages 13 and 15 years) had
negative associations with later
educational achievement (at the
age of 26).
Jackson et al.
2006.
10−18 y, n=140,
longitudinal: children’s Internet use
was continuously
recorded and academic performance
many time measured during 16
months,
2000−2002, US.
Internet use with automatic recordings, academic achievement with
GPAs and the Michigan Educational Assessment Program (MEAP) tests for
reading and mathematics.
Frequent Internet use was associated with higher reading (but not
math) test scores and higher
GPAs 6, 12 and 16 months later.
Jackson et al.
2011.
12 y, n=482, longitudinal: children’s
Internet use and
video game playing
were assessed at
baseline and one
year later, US.
Internet use and video
game play with self-reported questionnaire, academic achievement with
self-reported GPAs and
the Wide Range Achievement Test (WRAT-3) for
reading and math, visuospatial skills with the Wide
Range Assessment of Visual Motor Abilities Section
2, Matching.
Video game playing was associated with lower GPAs. Internet
use was associated with better
reading skills (for children with initially low or average reading
skills) and GPAs, but not math
skills. Video game playing was
positively associated with
visuospatial skills.
108
APPENDIX 2. Continued.
Johnson et
al. 2007.
14→16→22 y,
n=678, longitudinal: participants’
TV viewing and attention and learning difficulties were
assessed at four
time points,
1983→1985−1986
→1991−1993
TV viewing with the Disorganizing Poverty Interview, attention and learning difficulties with the Diagnostic Interview Schedule for Children at the age
of 14 and 16, and age-appropriate version of the
same test for 22 yearsolds.
Frequent TV viewing at the age of
14 predicted poor academic
grades, failure to complete high
school, negative attitudes towards school and poor homework completion, as well as longterm academic failure. Children
who watched television 3 or
more hours per day at the age of
14, had higher prevalence of frequent attention difficulties at the
age of 16, compared to children
who watched less television.
→2001−2004, US.
Kim & So
2012.
13−18 y, n=75066,
cross-sectional,
2009, Korea.
Academic achievement
and Internet use with selfreported questionnaire.
Children who used Internet three
hours a day or less had higher
school performance than children
who never used the Internet,
while children who used the Internet over three hours a day had
weaker performance.
Landhuis et
al. 2007.
3 y at baseline,
1037, longitudinal:
children’s TV viewing was assessed at
the age of 5, 7, 9,
11 and attention
problems at the
age of 13 and 15,
children were born
1972 and 1973,
New Zealand.
TV viewing with parentand self-reported questionnaire, attention problems with self-, parentand teacher-rated questionnaires (the age-appropriate Diagnostic Interview
Schedule for Children, the
Quay and Peterson Revised Problem Behavior
Checklist and the Rutter
Child Scale (Scale B for
teachers)).
Both childhood and adolescent
television viewing were independently associated with attention problems in adolescence.
Mizuno et al.
2013.
Grades 7−9, n=158,
cross-sectional, Japan.
TV viewing with self-reported questionnaire, cognitive function with the
kana pick-out test.
The high amounts of television
viewing were associated with a
weaker ability to divide attention.
Munasib &
Bhattacharya
2010.
5−10 y, cross-sectional: data from
the National Longitudinal Survey of
Youth (NLSY), 1990,
2002, US.
TV viewing with motherreported questionnaire,
academic achievement
with the Peabody Individual Achievement Test
(PIAT) for math and reading.
There were no association between television viewing and academic achievement after adjusting for socioeconomic determinants, parents’ TV viewing behaviours and parents’ role in monitoring children’s viewing.
109
APPENDIX 2. Continued.
Mößle et al.
2010.
Study 1. Grade 4,
n=5529, cross-sectional, 2005, German.
Media use and academic
achievement with self-reported questionnaires.
Study 1: The time spent playing
computer or video games and
watching TV, DVDs or videos was
negatively associated with school
achievement, including grades in
mother tongue, science and
math. Study 2: In terms of crosssectional associations, media use
– especially playing computer
games – was negatively associated with marks in mother
tongue, foreign language and science, but not math scores at all
measurement occasions in 3rd,
4th and 5th grades. In longitudinal analysis, daily computer game
playing was negatively associated
with academic achievement, but
TV usage had only few negative
associations with academic
achievements. Study 3: The decline in school grades was smaller
in intervention groups, compared
to control group.
Study 2. Grade 3,
n=1157, longitudinal: children’s media use and academic achievement
were assessed in
four times,
2005→2006→2007
→2008, German.
Study 3. Grade 3 at
baseline, N=1020, a
RCT: school-based
media intervention
to affect children’s
media habits,
2006–2008, Germany.
Ruiz et al.
2010.
13─18.5 y, n=1820,
cross-sectional,
2002─2002, Spain.
Self-reported time spent
in TV viewing and playing
video games, cognitive
functions with SRA Test of
Educational Ability (TEA)
(verbal, numeric, and reasoning abilities and an
overall score).
TV viewing or playing video
games were not associated with
cognitive functions.
Sharif & Sargent 2006.
Grades 5−8,
n=4508, cross-sectional, US.
TV viewing and video
game playing and academic achievement with
self-reported questionnaires.
Weekday television viewing was
negatively associated with school
performance. Videogame play
was not associated with school
performance.
Sharif, Wills
& Sargent
2010.
10−14 y, n=6486,
longitudinal: children’s media exposure and academic
achievement were
assessed at baseline, 8,16 and 24
months later,
2003→2005, US.
Screen time and academic
achievement with telephone interview.
Screen exposure was negatively
associated with change in school
achievement.
110
APPENDIX 2. Continued.
Shin 2004.
6−13 y, n=1203,
cross-sectional,
1997, US.
TV viewing with parentreported 24 h diary kept
during one weekday and
one weekend day, academic achievement with
the Woodcock–Johnson
Revised Tests of Achievement for reading and
math.
Children who watched more television had weaker math and
reading achievements.
Swing et al.
2010.
Younger: 6−12 y,
n=1323, older:
18−32, n=210,
cross-sectional, US.
TV and video game exposure with self- and parent
reported questionnaires,
attention problems with
teacher-reported questionnaire in childhood and
with a composite of three
self-report measures: the
Adult ADHD Self-Report
Scale (ASRS), the Brief SelfControl Scale (BSCS), and
the Barratt Impulsiveness
Scale (BIS-11) in the late
adolescence/early adulthood.
High amounts of TV viewing and
video game playing was associated with attention problems.
Weis &
Cerankosky
2010.
6−9 y, n=64, a RCT:
experimental group
receiving a video
game system at
baseline and the
control group receiving a videogame system after
four months intervention.
Academic achievement
with The Woodcock–Johnson—III: Tests of Achievement (WJ–III) for reading,
mathematics and written
language, school and
home behaviour (including
attention and learning difficulties) with The Parent
Rating Scale (PRS) and
Teacher Rating Scale (TRS).
At the post-test, children in the
experimental group, who had
higher amounts of video game
play, got lower reading and writing scores, but not math scores,
compared to control children.
The ownership of a video game
system or video game playing did
not affect attention problems.
Willoughby
2008.
Grades 9−10 at
baseline, n=1591,
longitudinal: children’s Internet use,
computer use and
academic performance were assessed at baseline
and 21 months
later, Canada.
Internet and computer use
with self-reported questionnaire, academic performance with standardized scores for ratings of
typical school grades.
There were no association between computer game play and
academic performance. The moderate use of Internet was associated with more positive academic
performance, compared to nonuse or high use.
Abbreviations: ADHD, attention deficit hyperactivity disorder; GPA, grade point average; RCT,
randomized controlled trial.
111
ORIGINAL PUBLICATIONS
I
PHYSICAL ACTIVITY, SEDENTARY BEHAVIOR, AND
ACADEMIC PERFORMANCE IN FINNISH CHILDREN
by
Heidi J. Syväoja, Marko T. Kantomaa, Timo Ahonen, Harto Hakonen,
Anna Kankaanpää & Tuija H. Tammelin. 2013.
Medicine and Science in Sports and Exercise 45(11), 2098–2104.
Reproduced with kind permission by
Wolters Kluwer Health Lippincott & Wilkins.
Physical Activity, Sedentary Behavior, and
Academic Performance in Finnish Children
¨ OJA1,2, MARKO T. KANTOMAA1,3, TIMO AHONEN2, HARTO HAKONEN1, ANNA KANKAANPA
¨A
¨ 1,
HEIDI J. SYVA
1
and TUIJA H. TAMMELIN
1
Research Center for Sport and Health Sciences, LIKES—Research Center for Sport and Health Sciences, Jyva¨skyla¨,
FINLAND; 2University of Jyva¨skyla¨, Jyva¨skyla¨, FINLAND; and 3Department of Epidemiology and Biostatistics,
MRC-HPA Centre for Environment and Health, Imperial College London, London, UNITED KINGDOM
ABSTRACT
EPIDEMIOLOGY
¨ OJA, H. J., M. T. KANTOMAA, T. AHONEN, H. HAKONEN, A. KANKAANPA
¨A
¨ , and T. H. TAMMELIN. Physical Activity,
SYVA
Sedentary Behavior, and Academic Performance in Finnish Children. Med. Sci. Sports Exerc., Vol. 45, No. 11, pp. 2098–2104, 2013.
Purpose: This study aimed to determine the relationships between objectively measured and self-reported physical activity, sedentary
behavior, and academic performance in Finnish children. Methods: Two hundred and seventy-seven children from five schools in the
Jyva¨skyla¨ school district in Finland (58% of the 475 eligible students, mean age = 12.2 yr, 56% girls) participated in the study in the
spring of 2011. Self-reported physical activity and screen time were evaluated with questions used in the WHO Health Behavior in
School-Aged Children study. Children_s physical activity and sedentary time were measured objectively by using an ActiGraph GT1M/
GT3X accelerometer for seven consecutive days. A cutoff value of 2296 counts per minute was used for moderate-to-vigorous physical
activity (MVPA) and 100 counts per minute for sedentary time. Grade point averages were provided by the education services of the city
of Jyva¨skyla¨. ANOVA and linear regression analysis were used to analyze the relationships among physical activity, sedentary behavior,
and academic performance. RESULTS: Objectively measured MVPA (P = 0.955) and sedentary time (P = 0.285) were not associated
with grade point average. However, self-reported MVPA had an inverse U-shaped curvilinear association with grade point average
(P = 0.001), and screen time had a linear negative association with grade point average (P = 0.002), after adjusting for sex, children_s
learning difficulties, highest level of parental education, and amount of sleep. Conclusions: In this study, self-reported physical activity
was directly, and screen time inversely, associated with academic achievement. Objectively measured physical activity and sedentary
time were not associated with academic achievement. Objective and subjective measures may reflect different constructs and contexts
of physical activity and sedentary behavior in association with academic outcomes. Key Words: ACADEMIC ACHIEVEMENT,
MODERATE-TO-VIGOROUS PHYSICAL ACTIVITY, SCREEN TIME, SCHOOL AGE, LEARNING
I
and youth (8,3,13,17,30). However, diverging results have
also been reported (20,26,31), indicating a somewhat weak
and inconsistent association between young people_s physical
activity and academic performance. Most of the previous
studies used self-reported measures of physical activity and
academic performance, with only a few reporting objectively
measured physical activity in association with teacher-rated
educational outcomes. In addition, previous studies were conducted in various countries with varying educational systems,
which makes comparing the results difficult.
According to previous studies, media use (22,27), especially
time spent viewing TV (10,11,15,29), playing videogames (14),
and using the Internet (18), has a negative association with
academic achievement in childhood. However, Borzekowski
and Robinson (1), and Jackson et al. (14) reported a positive
relationship between Internet/computer use and academic
performance, and Munasib and Bhattacharya (24) reported
no association between television viewing and academic
achievement. Objectively measured sedentary time is a current
topic of interest in physiology but has not been extensively
studied from the psychological point of view. To our knowledge, no one has studied the association between objectively
measured sedentary time and academic performance.
t has been proposed that only 30%–40% of youth are
sufficiently active according to current public health recommendations (9). In contrast, sedentary behavior, especially screen-based sedentary behavior, has increased during
the last few decades, and today children spend 4–8 hIdj1
sedentary (25). Physical inactivity has been shown to be associated with higher levels of obesity, metabolic, and cardiovascular risk factors, depression symptoms, and lower physical
fitness in children, whereas adequate physical activity may
benefit them (23).
In addition to these health benefits, physical activity may
have a beneficial effect on academic performance in children
Address for correspondence: Heidi Syva¨oja, M.Sc., Viitaniementie 15a
40720, Jyva¨skyla¨, Finland; E-mail: [email protected].
Submitted for publication November 2012.
Accepted for publication April 2013.
0195-9131/13/4511-2098/0
MEDICINE & SCIENCE IN SPORTS & EXERCISEÒ
Copyright Ó 2013 by the American College of Sports Medicine
DOI: 10.1249/MSS.0b013e318296d7b8
2098
Copyright © 2013 by the American College of Sports Medicine. Unauthorized reproduction of this article is prohibited.
The aim of this study was to examine the associations between objectively measured and self-reported physical activity,
sedentary behavior, and teacher-rated academic achievement
in children. We hypothesized that physical activity is directly,
and sedentary behavior inversely, associated with academic
achievement in childhood.
STUDY POPULATION AND METHODS
PHYSICAL ACTIVITY AND ACADEMIC PERFORMANCE
Medicine & Science in Sports & Exercised
Copyright © 2013 by the American College of Sports Medicine. Unauthorized reproduction of this article is prohibited.
2099
EPIDEMIOLOGY
Participants. During spring 2011, 475 fifth and sixth
graders from five schools in the Jyva¨skyla¨ school district in
Finland were invited to participate in the study. Fifty-eight
percent (N = 277) of 475 eligible children participated in
the study. The children were given an information pack
containing a leaflet for themselves, a letter for their parents/
guardians, and a consent form. Participation in the study was
voluntary, and all participants and their parents were informed
about their right to drop out of the study any time without a
specific reason. Only children with a fully completed consent
form (certificate of consent signed by a parent/guardian and
the child) on the day of the first measurements were included
in the study. The study was performed according to the principles of the Declaration of Helsinki and the Finnish legislation
and was approved by the Ethics Committee of the University
of Jyva¨skyla¨.
Academic achievement. Academic achievement scores
(grades in individual school subjects and grade point averages
[GPA]) were provided by the education services of the city of
Jyva¨skyla¨. Individual grades were assessed in the following
school subjects: native language (in most cases Finnish or
Swedish), first foreign language (started in grade 3), mathematics, physics/chemistry, biology, history, geography, religion or ethics, visual arts, music, and physical education. The
grades refer to numerical assessment on a scale of 4–10, where
4 denotes a failure (US grade: F) and 10 denotes excellent
knowledge and skills (US grade: A). The GPA were calculated as means of the individual grades and were used as a
measure of academic achievement in the analysis. A Finnish
GPA of 5.0–5.9 equals 1.0 in US GPA, 6.0–6.9 equals 2.0,
7.0–8.9 equals 3.0, and 9.0–10.0 equals 4.0.
Self-reported physical activity and screen time.
Children filled in a questionnaire concerning demographics,
habits, amount of sleep, and so on. Self-reported physical activity and screen time were evaluated with questions used in
the WHO Health Behavior in School-Aged Children study
(6). Self-reported moderate-to-vigorous physical activity
(MVPA) was measured with the following question: ‘‘Over
the past 7 days, on how many days were you physically active
for a total of at least 60 minutes per day?’’ The response
categories were as follows: 0, 1, 2, I, 7 d. Before this
question, the following short description about what kind of
physical activity should be taken into count was found: ‘‘In the
next question, physical activity is defined as any activity that
increases your heart rate and makes you get out of breath some
of the time.’’ Examples of MVPA were running, walking
quickly, rollerblading, biking, dancing, skateboarding, swim-
ming, snowboarding, cross-country skiing, soccer, basketball,
and Finnish baseball. Test–retest agreement for self-reported
MVPA has been very good (ICC = 0.82) (21). Self-reported
screen time was measured with the following question:
‘‘About how many hours a day do you usually a) watch
television (including videos), b) play computer or video
games, or c) use a computer (for purposes other than playing
games, for example, e-mailing, chatting, or surfing the Internet or doing homework) in your free time?’’ There were response options for weekdays and weekends. The test–retest
agreement for watching television (ICC = 0.72–0.74) and
for playing computer or video games (ICC = 0.54–0.69) has
been substantial and for using a computer (ICC = 0.33–0.50)
fair to moderate (21). Daily screen time averages were calculated by adding these three questions including weekdays
and weekends together.
Objectively measured physical activity and sedentary time. Children_s physical activity was measured
objectively by using the ActiGraph GT1M/GT3X accelerometer with one vertical axel. Children wore the accelerometer on the right hip with an elastic waistband during waking
hours for seven consecutive days. Bathing, swimming, and
other water activity periods were excluded. To collect data,
the ActiLife accelerometer software (ActiLife version 5;
http://support.theactigraph.com/dl/ActiLife-software) was used.
Epoch length was 10 s, and nonwearing time was 30 min. For
data reduction and analysis, a customized software was used.
A cutoff value of 2296 counts per minute was used for MVPA
(12) and 100 counts per minute for sedentary time. Children
were included in the analysis if they had valid data for at least
500 minIdj1 on two weekdays and on one weekend day.
Objectively measured sedentary time was standardized with
daily monitoring time, which allowed the children, who had
worn the accelerometers for different amounts of time per
day, to be compared.
Potential confounders. The parent or the child_s main
caregiver filled in a questionnaire concerning family background. The mother_s and father_s education, family income,
marital status, and children_s learning difficulties were investigated. The highest level of parental education, which was
calculated from the mother_s and father_s education, was
categorized as 1 = tertiary level education and 0 = basic or
upper secondary education. The marital status of the main
carer was categorized as 1 = married or cohabiting and 0 =
divorced or single/widow. Children_s learning difficulties
were evaluated with the following question: ‘‘Does your child
have any diagnosed learning difficulties?’’ (categorization,
1 = yes and 0 = no or do not know).
Statistical analyses. The Statistical Package for the
Social Sciences was used for the statistical analyses (SPSS,
2010, IBM SPSS Statistics 19 Core System User_s Guide;
SPSS Inc., Chicago, IL). Logarithmic transformations were
used for variables with skewed distributions. Because the
distribution of self-reported MVPA was negatively skewed,
the distribution was reflected and logarithmically transformed
and then reflected again to restore the original order of the
TABLE 1. Sample characteristics according to sex and all participants.
Boys
Age (yr)
GPA (4–10)b
Objectively measured MVPA (minIdj1)c
Objectively measured sedentary time (%Idj1)d
Self-reported screen time (hIdj1)
Girls
All
Mean
SD
n
Mean
SD
n
Mean
SD
n
Pa
12.2
8.07
59.9
39.6
3.82
0.7
0.72
22.3
3.5
1.96
123
122
95
95
121
12.2
8.37
56.3
40.8
3.49
0.6
0.57
17.1
3.1
1.86
154
153
125
125
154
12.2
8.24
57.9
40.3
3.63
0.6
0.66
19.5
3.3
1.91
277
275
220
220
275
0.765
G0.001
0.623
0.006
0.095
a
P values for sex differences (t-test).
The GPA (scale 4–10, where 10 is the highest GPA one can earn) was calculated from the grades in the following individual school subjects: native language (in most cases Finnish or
Swedish), first foreign language (started in grade 3), mathematics, physics/chemistry, biology, history, geography, religion or ethics, visual arts, music, and physical education.
c
MVPA measured with the ActiGraph accelerometer using a cutoff value 2296 counts per minute.
d
Sedentary time measured by the ActiGraph accelerometer using a cutoff value 100 counts per minute and expressed as percentage of daily monitoring time (%Idj1).
EPIDEMIOLOGY
b
variable (jln((max + 1) j y)). The distributions of selfreported screen time and objectively measured MVPA were
positively skewed. To measure sex differences, the independent samples t-test was used. The cross-sectional associations
among physical activity, sedentary behavior, and academic
achievement were examined with ANOVA and linear regression analysis. For the ANOVA, children were divided into
tertile groups (33% each) according to the amount of objectively measured MVPA (1, tertile e47.0 min; 2, tertile 47.1–
65.0 min; 3, tertile Q65.1 min) and sedentary time (1, tertile
e38.4%; 2, tertile 38.5%–41.4%; 3, tertile Q41.5%). In addition,
children were classified into groups according to the selfreported MVPA (1 = 0–2 dIwkj1, 2 = 3–4 dIwkj1, 3 = 5–
6 dIwkj1, 4 = 7 dIwkj1) and screen time (1 = 0.00–1.99 hIdj1,
2 = 2.00–2.99 hIdj1, 3 = 3.00–3.99 hIdj1, 4 = 4.00–4.99 hIdj1,
5 = Q5.00 hIdj1).
Before the multiple regression, the Pearson_s correlation
coefficients for continuous variables were calculated to estimate associations between single variables and GPA. To investigate whether the associations between self-reported or
objectively measured MVPA and GPA are quadratic, quadratic
terms were calculated using an equation x2 = ((x j mean(x)) (x j mean(x)), where x is the logarithmically transformed
self-reported MVPA or logarithmically transformed objectively measured MVPA. After that we used enter approach
for the multiple regression. To calculate change in R2, the
variables of interest were added to the second block one by
one, and all other variables of the model (potential confounders and other variables of interest) were added to the
first block. The change in R2 for all variables of interest was
calculated and tested for significance. To study whether the
assumptions of the regression analysis were fulfilled, we
examined the distribution of model residuals. Sample characteristics were summarized descriptively, using mean and
SD values for continuous data and frequencies and percentages for categorical data. The level for statistical significance
was determined as P G 0.05. The star symbols are used to
illustrate statistical significance in the figures and tables
(***P G 0.001, **P G 0.01, *P G 0.05).
Seventy-six percent of parents were married or cohabiting.
Seven percent of children had a diagnosed learning difficulty.
On the basis of the teacher ratings, girls had higher GPA
compared with boys (t228 = 6.26, P G 0.001) (Table 1). Boys
reported MVPA for at least 60 minIdj1 more often than girls
(t239 = 8.10, P = 0.049) (Table 2). On the basis of objective
measurements, children had, on average, 58 min of MVPA
per day, with no statistically significant difference between
boys and girls (t162 = 5.34, P = 0.623) (Table 1). However,
girls spent more of their waking hours sedentary than boys
(t218 = 2.71, P = 0.006). On average, children reported 3.6 h
of screen time per day, with no statistically significant difference between boys and girls (t273 = 1.11, P = 0.095) (Table 1).
According to the ANOVA, a high level of self-reported
MVPA was associated with a high GPA (F3, 268 = 6.56, P G
0.001) (Fig. 1a). Children who were physically active at least
60 minIdj1 for 5–6 dIwkj1 had the highest GPA (8.41),
whereas children who were physically active 0–2 dIwkj1 had
the lowest GPA (7.83). Screen time was inversely associated
with GPA (F4, 268 = 7.08, P G 0.001) (Fig. 1b). Children who
had less than 2 hIdj1 of screen time had the highest GPA
(8.5), whereas children who had more than 5 hIdj1 of screen
time had the lowest GPA (8.0). Objectively measured MVPA
(F2, 216 = 0.17, P = 0.843) and sedentary time (F2, 216 = 0.46,
P = 0.635) were not associated with GPA (Figs. 1b and 1c).
According to Pearson_s correlation coefficients, self-reported
screen time was negatively associated with GPA (P G 0.001)
(Table 3), whereas objectively measured MVPA (P = 0.955)
or sedentary time (P = 0.285) had no significant association
with GPA. The quadratic term for self-reported MVPA was
associated with GPA (P G 0.001) (Table 3), whereas the
quadratic term for objectively measured MVPA was not
TABLE 2. Self-reported MVPA.
Self-Reported MVPA
(Active Days per Week)a
0–1
2
3
4
5
6
7
n
Pb
RESULTS
The mean age of the children was 12.2 yr, and 56% of the
children were girls (Table 1). In 79% of families, the highest
level of parental education was tertiary level education.
2100
Official Journal of the American College of Sports Medicine
Boys (%)
Girls (%)
All (%)
5.0
1.7
7.4
19.8
19.0
13.2
33.9
123
1.3
7.2
13.1
15.0
22.2
22.9
18.3
154
2.9
4.7
10.6
17.2
20.8
18.6
25.2
277
0.049
The percentages of children who were physically active for at least 60 minIdj1 during
0–1, 2, 3, 4, 5, 6, or 7 dIwkj1 according to self-reports.
b
P values for the sex differences (t-test).
a
http://www.acsm-msse.org
Copyright © 2013 by the American College of Sports Medicine. Unauthorized reproduction of this article is prohibited.
FIGURE 1—GPA with self-reported MVPA (A), self-reported screen time (B), objectively measured MVPA (C), and objectively measured sedentary
time (D). Results from ANOVA.
(P = 0.123). According to multiple regression analysis, selfreported MVPA had an inverse U-shaped curvilinear association with GPA (Fig. 2a, Table 3), and screen time had a
linear negative association with schools_ grade average, after
adjusting for sex, learning difficulties, the highest level of
parental education, and amount of sleep (Fig. 2b, Table 3).
The adjusted R2 for the model was 0.305. The regression
model residuals were normally distributed.
Summary of results. In this study, self-reported physical activity was directly, and screen time inversely, associated
with academic achievement in children. Objectively measured
physical activity and sedentary time were not associated with
academic achievement.
TABLE 3. Regression analysis of GPA.
Regression Model
b
Children_s learning difficulties
The highest level of parental educationc
Amount of sleep (hIdj1)
Sex (female)
Self-reported MVPAd
Quadratic self-reported MVPAe
Self-reported screen time (hIdj1)f
R2
Adjusted R2
N
Pearson_s Correlations
B (SE)
Beta (SE)
$R 2a
j0.368***
0.247***
0.211***
0.223***
0.003
j0.247***
j0.276***
j0.697*** (0.139)
0.307** (0.087)
0.114* (0.052)
0.176* (0.072)
0.065 (0.061)
j0.337** (0.104)
j0.198** (0.062)
j0.297*** (0.139)
0.207** (0.087)
0.129* (0.052)
0.144* (0.072)
0.067 (0.061)
j0.199** (0.104)
j0.193** (0.062)
0.004
0.035**
0.033**
0.328
0.305
212
The level of statistical significance: ***P G 0.001, **P G 0.01, *P G 0.05.
a
The change in R2 , self-reported MVPA, quadratic self-reported MVPA, and screen time were added to the model one by one.
b
Parental report of child_s diagnosed learning difficulties categorized as 1 = yes and 0 = no or do not know.
c
The highest level of parental education categorized as 1 = tertiary level education and 0 = basic or upper secondary education.
d
The distribution of self-reported MVPA was reflected and transformed logarithmically and reflect again to restore the original order of the variable (jln((max + 1)y)).
e
To measure quadratic association between self-reported physical activity and GPA, quadratic term was formed with the following equation: quadratic self-reported
MVPA = ((x j mean(x)) (x j mean(x)), where x is the logarithmically transformed self-reported MVPA (jln((max + 1) j y)).
f
Distribution of self-reported screen time was transformed logarithmically (ln(y)).
B, unstandardized coefficient; Beta, standardized coefficient; $R2, change in R2 .
PHYSICAL ACTIVITY AND ACADEMIC PERFORMANCE
Medicine & Science in Sports & Exercised
Copyright © 2013 by the American College of Sports Medicine. Unauthorized reproduction of this article is prohibited.
2101
EPIDEMIOLOGY
DISCUSSION
Self-reported physical activity and academic
achievement. Our finding of a positive association between self-reported physical activity and academic achievement is consistent with previous studies that reported MVPA
is associated with high levels of academic performance
(13,17,30). In addition, Donelly et al. (8) reported that adding
90 min of MVPA to children_s school week resulted in improvements in academic achievement during the 3-yr intervention time. However, in our study, the relationship between
self-reported MVPA and academic achievement was curvilinear. It seems that five to six times per week may be the
optimal amount of MVPA from the perspective of academic
achievement. It may be that some of the most active children
spend time in physical activities at the expense of time devoted
to homework. A positive association between physical activity
and academic achievement may be due to effects of physical
EPIDEMIOLOGY
FIGURE 2—GPA with self-reported MVPA (A), self-reported screen time (B), objectively measured MVPA (C), and objectively measured sedentary
time (D). Results from the regression analysis.
activity on children_s cognitive function. Davis et al. (7) and
Chaddock et al. (4) suggested that regular physical activity
enhances executive functions. Likewise, Castelli et al. (2) and
Kamijo et al. (16) in their intervention studies observed
that increased physical activity had a positive influence on
children_s executive functions and working memory.
Objectively measured physical activity and academic achievement. In this study, objectively measured
MVPA was not associated with children_s academic achievement. Our results support those of LeBlanc et al. (20), who
reported that objectively measured MVPA was not associated
with academic performance in children. In contrast, Kwak
et al. (19) found that objectively measured vigorous physical
activity was associated with academic achievement in girls,
but not in boys. However, Kwak et al. (19) studied adolescents
(15–16 yr), whereas we and LeBlanc et al. (20) studied children age 10–12 yr. Furthermore, in the present study, physical
activity was measured during seven consecutive days, whereas
LeBlanc et al. (20) and Kwak et al. (19) measured physical
activity for 3 and 4 d, respectively.
Explanations for the inconsistencies between selfreported and objectively measured MVPA in association with academic achievement. The inconsistency
between the subjective and the objective measures of physical
activity in association with academic achievement may be
due to the difficulty estimating one_s overall physical activity. According to Corder et al. (5), 40% of inactive children age
10 yr old overestimated their physical activity compared with
the objective measure. However, nowadays, skill-specific
types of physical activities based on body movements are
common among children but may not be seen in activity counts.
For example, skateboarding is a skill-specific physical activity, which requires balance and agility, but hardly accumulates
2102
Official Journal of the American College of Sports Medicine
activity counts. Therefore, self-reported MVPA may better
illustrate different types of activity, including skill-specific
activity, whereas accelerometer-measured MVPA mainly illustrates cardiovascular activity. Objective and subjective measures may reflect different constructs and contexts of physical
activity in association with academic outcomes.
Sedentary behavior and academic achievement.
According to this study, self-reported screen time was inversely associated with academic performance. This finding
is in line with previous studies (22,27), supporting the hypothesis of time displacement (28). Time displacement theory
suggests that the time spent in front of the screen may simply
displace time spent in other activities such as doing homework, reading books, or sleeping, which may independently
affect academic performance. There may be certain dispositions in media use, especially intense and exciting sensations,
which increase the desire for these kinds of experiences and
are incompatible with concentrated effort reading and writing
(28). In addition, attention difficulties, frequent failure to do
homework, and negative attitude toward school have been
reported to mediate the association between television viewing at the age of 14 yr and academic failure at the age of 22 yr
(15). In the present study, objectively measured sedentary
time was not associated with academic achievement. This
might be because objective measures of sedentary time do not
specify the elements of sedentary behavior. It is reasonable to
suggest that some of the sedentary activities performed (e.g.,
doing homework and reading) benefit learning and academic
achievement.
Strengths and limitations. To our knowledge, this is
the first study to examine the associations of objectively measured and self-reported physical activity on teacher-rated
academic achievement. Our study sample is representative
http://www.acsm-msse.org
Copyright © 2013 by the American College of Sports Medicine. Unauthorized reproduction of this article is prohibited.
regarding physical activity, showing that the level of physical
activity of Finnish school-age children is comparable with
that reported in international results (6). Because of the crosssectional design, conclusions regarding causality of the observed relationships cannot be drawn. In addition, the time
spent doing homework, reading, or performing other activities that may benefit academic achievement was not investigated, limiting more precise examination of sedentary behavior.
Moreover, the detailed content of screen-based sedentary
behavior was not assessed, limiting the interpretation of the
results regarding screen-based sedentary behavior. Inconsistency in physical activity results may be due to the accelerometer method itself. The accelerometer does not measure
swimming, cycling, or similar activities. Furthermore, 1 wk or
less of objective measurement may not be long enough to
depict children_s usual physical activity.
Future research. More research, especially more randomized controlled trials and longitudinal studies, is needed
to clarify the relationship between physical activity and academic achievement. Besides, more information about the factors that may explain the association between physical activity
and academic performance is needed. In future studies, longer
accelerometer wearing times and, preferably, several measurement periods during the school year should be considered.
Moreover, the inconsistency between the subjective and objective measurements related to educational outcomes observed
in this study offers an interesting viewpoint for future studies to
consider. We recommend that future studies use subjective and
objective measurements to examine physical activity, sedentary
behavior, and academic achievement. Furthermore, methods
should assess not only the amount but also different types of
physical activity and sedentary behavior more precisely.
CONCLUSIONS
In conclusion, self-reported, but not objectively measured,
physical activity and sedentary behavior were associated with
academic achievement in children. Self-reported MVPA had
an inverse U-shaped curvilinear relationship with GPA, whereas
self-reported screen time had a linear negative relationship
with GPA.
This study was funded by Finnish Ministry of Education and Culture.
The authors are grateful to Professor Asko Tolvanen for his advice
in statistical analysis.
There are no relationships, conditions, or circumstances that
present potential conflict of interest.
The results of this study do not constitute endorsement by the
American College of Sports Medicine.
REFERENCES
PHYSICAL ACTIVITY AND ACADEMIC PERFORMANCE
11. Espinoza F. Using project-based data in physics to examine television viewing in relation to student performance in science. J Sci
Educ Technol. 2009;18(5):458–65.
12. Evenson KR, Catellier DJ, Gill K, et al. Calibration of two objective measures of physical activity for children. J Sports Sci.
2008;24(14):1557–65.
13. Fox CK, Barr-Anderson D, Neumark-Sztainer D, et al. Physical
activity and sports team participation: associations with academic
outcomes in middle school and high school students. J School
Health. 2010;80(1):31–7.
14. Jackson LA, Von Eye A, Witt EA, et al. A longitudinal study of the
effects of Internet use and videogame playing on academic performance and the roles of gender, race and income in these relationships. Comput Hum Behav. 2011;27(1):228–39.
15. Johnson JG, Cohen P, Kasen S, et al. Extensive television viewing
and the development of attention and learning difficulties during
adolescence. Arch Pediatr Adolesc Med. 2007;161(5):480.
16. Kamijo K, Pontifex MB, O’Leary KC, et al. The effects of an
afterschool physical activity program on working memory in preadolescent children. Dev Sci. 2011;14(5):1046–58.
17. Kantomaa MT, Tammelin TH, Demakakos P, et al. Physical activity, emotional and behavioural problems, maternal education
and self-reported educational performance of adolescents. Health
Educ Res. 2010;25(2):368–79.
18. Kim DH, So WY. The relationship between daily Internet use time
and school performance in Korean adolescents. Cent Eur J Med.
2012;7(4):444–9.
19. Kwak L, Kremers SPJ, Bergman P, et al. Associations between physical
activity, fitness, and academic achievement. J Pediatr. 2009;155:914–8.
20. LeBlanc MM, Martin CK, Han H, et al. Adiposity and physical
activity are not related to academic achievement in school-aged
children. J Dev Behav Pediatr. 2012;33(6):486–94.
21. Liu Y, Wang M, Tynja¨la¨ J, et al. Test–retest reliability of selected items
of Health Behaviour in School-aged Children (HBSC) survey questionnaire in Beijing, China. BMC Med Res Methodol. 2010;10(1):73.
Medicine & Science in Sports & Exercised
Copyright © 2013 by the American College of Sports Medicine. Unauthorized reproduction of this article is prohibited.
2103
EPIDEMIOLOGY
1. Borzekowski DLG, Robinson TN. The remote, the mouse, and the
no. 2 pencil: the household media environment and academic
achievement among third grade students. Arch Pediatr Adolesc
Med. 2005;159(7):607.
2. Castelli DM, Hillman CH, Hirsch J, et al. FIT kids: time in target
heart zone and cognitive performance. Prev Med. 2011;52:S55–9.
3. Centers for Disease Control and Prevention. The Association Between
School-Based Physical Activity, Including Physical Education, and
Academic Performance. Atlanta (GA): U.S. Department of Health and
Human Services; 2010. p. 84.
4. Chaddock L, Hillman CH, Buck SM, et al. Aerobic fitness and
executive control of relational memory in preadolescent children.
Med Sci Sports Exerc. 2011;43(2):344–9.
5. Corder K, van Sluijs EMF, McMinn AM, et al. Perception versus
reality: awareness of physical activity levels of British children.
Am J Prev Med. 2010;38(1):1–8.
6. Currie C, Zanotti C, Morgan A, Currie D, De Looze M, Roberts C,
Samdal O, Smith ORF, Barnekow V. Social Determinants of
Health and Well-being among Young People. Health Behaviour in
School-aged Children (HBSC) Study. International Report from
the 2009/2010 Survey:129–138, 237–238.
7. Davis CL, Tomporowski PD, McDowell JE, et al. Exercise improves executive function and achievement and alters brain activation in overweight children: a randomized, controlled trial. Health
Psychol. 2011;30(1):91–8.
8. Donnelly JE, Greene JL, Gibson CA, et al. Physical Activity
Across the Curriculum (PAAC): a randomized controlled trial to
promote physical activity and diminish overweight and obesity in
elementary school children. Prev Med. 2009;49(4):336–41.
9. Ekelund U, Tomkinson G, Armstrong N. What proportion of youth
are physically active? Measurement issues, levels and recent time
trends. Br J Sports Med. 2011;45(11):859–65.
10. Ennemoser M, Schneider W. Relations of television viewing and
reading: findings from a 4-year longitudinal study. J Educ Psychol.
2007;99(2):349.
27. Sharif I, Sargent JD. Association between television, movie, and
video game exposure and school performance. Pediatrics. 2006;
118(4):e1061–70.
28. Sharif I, Wills TA, Sargent JD. Effect of visual media use on
school performance: a prospective study. J Adolescent Health.
2010;46(1):52–61.
29. Shin N. Exploring pathways from television viewing to academic
achievement in school age children. J Genet Psychol. 2004;165(4):
367–82.
30. Stevens TA, To Y, Stevenson SJ, et al. The importance of physical
activity and physical education in the prediction of academic
achievement. J Sport Behav. 2008;31(4):368–88.
31. Stroth S, Kubesch S, Dieterle K, et al. Physical fitness, but not
acute exercise modulates event-related potential indices for executive control in healthy adolescents. Brain Res. 2009;1269:114.
EPIDEMIOLOGY
22. Mo¨Qle T, Kleimann M, Rehbein F, et al. Media use and school
achievement–boys at risk? Brit J Dev Psychol. 2010;28(3):699–725.
23. Mountjoy M, Andersen LB, Armstrong N, et al. International
Olympic Committee consensus statement on the health and fitness
of young people through physical activity and sport. Br J Sports
Med. 2011;45(11):839–48.
24. Munasib A, Bhattacharya S. Is the Fidiot’s box_ raising idiocy?
Early and middle childhood television watching and child cognitive outcome. Econ Educ Rev. 2010;29(5):873–83.
25. Pate RR, Mitchell JA, Byun W, et al. Sedentary behaviour in
youth. Br J Sports Med. 2011;45(11):906–13.
26. Reed JA, Einstein G, Hahn E, et al. Examining the impact of integrating physical activity on fluid intelligence and academic performance in an elementary school setting: a preliminary investigation.
JPAH. 2010;7(3):343.
2104
Official Journal of the American College of Sports Medicine
http://www.acsm-msse.org
Copyright © 2013 by the American College of Sports Medicine. Unauthorized reproduction of this article is prohibited.
II
INTERNAL CONSISTENCY AND STABILITY OF THE CANTAB
NEUROPSYCHOLOGICAL TEST BATTERY IN CHILDREN
by
Heidi J. Syväoja, Tuija H. Tammelin, Timo Ahonen, Pekka Räsänen,
Asko Tolvanen, Anna Kankaanpää & Marko T. Kantomaa.
Submitted manuscript.
Submitted manuscript.
Internal consistency and stability of the CANTAB
neuropsychological test battery in children
Heidi J Syväoja1,2, Tuija H Tammelin1, Timo Ahonen2, Pekka Räsänen3, Asko Tolvanen2,
Anna Kankaanpää1 & Marko T Kantomaa1,4.
1
LIKES – Research Center for Sport and Health Sciences, Jyväskylä, Finland, 2 University of
Jyväskylä, Finland, 3 Niilo Mäki Institute, Jyväskylä, Finland, 4 Imperial College London, U.K.
Abstract
The Cambridge Neuropsychological Test Automated Battery (CANTAB) is a computer-assessed
test battery widely use in different populations. The internal consistency and one-year stability of
CANTAB tests were examined in school-aged children. Two hundred-thirty children (57% girls)
from 5 schools in the Jyväskylä school district in Finland participated in the study in spring 2011.
The children completed the following CANTAB tests: a) visual memory (Pattern Recognition
Memory [PRM] and Spatial Recognition Memory [SRM]), b) executive function (Spatial Span
[SSP], Stockings of Cambridge [SOC], and Intra-Extra Dimensional Set Shift [IED]), and c)
attention (Reaction Time [RTI] and Rapid Visual Information Processing [RVP]). Seventy-four
children participated in the follow-up measurements (64% girls) in spring 2012. Cronbach’s alpha
reliability coefficient was used to estimate the internal consistency of the nonhampering test, and
structural equation models were applied to examine the stability of these tests. The reliability and
the stability could not be determined for IED or SSP because of the nature of these tests. The
internal consistency was acceptable only in the RTI task. The one-year stability was moderate-togood for the PRM, RTI, and RVP. The SSP and IED showed a moderate correlation between the
two measurement points. The SRM and the SOC tasks were not reliable or stable measures in this
study population. For research purposes, we recommend using structural equation modeling to
improve reliability. The results suggest that the reliability and the stability of computer-based test
batteries should be confirmed in the target population before using them for clinical or research
purposes.
Keywords: CANTAB, internal consistency, reliability, stability, children
INTRODUCTION
Computer technology can make valuable
contributions
to
neuropsychological
assessments (Cernich, Brennana, Barker, &
Bleiberg, 2007; Parsey & SchmitterEdgecombe, 2013). Neuropsychological test
batteries have been used for one-off
psychological assessments, for evaluating
changes over time, and for evaluating the
effects of interventions (Lowe & Rabbitt,
1998).
The Cambridge Neuropsychological Test
Automated Battery (CANTAB) is one of the
oldest computer-based test batteries used to
evaluate
neurocognitive
functioning,
particularly in clinical trials research.
CANTAB is a Windows-based program
administered via a touch screen computer.
CANTAB tests are mainly nonverbal and
allow investigation of visual and spatial
memory, executive function, working
memory, planning, different aspects of
attention, and other areas of cognition
(Cambridge Cognition Ltd., 2006).
Previous research suggests that CANTAB is
a suitable method to measure cognitive
functions in 4- to 90-year-old individuals,
particularly in people with Alzheimer’s,
Parkinson’s disease, schizophrenia, and
autism (Lowe & Rabbitt, 1998; Luciana,
2003). Studies have also demonstrated that it
is sensitive to deficits due to several
neuropsychological
and
psychiatric
conditions, especially in the elderly (e.g.,
Blackwell et al., 2003; Levaux et al., 2007;
Robbins et al., 1998; Sahakian & Owen,
1992), but also in children (e.g., Gau &
Shang, 2010; Fried, Hirshfeld-Becker, Petty,
Batchelder, & Biederman, 2012; Luciana,
Lindeke, Georgieff, Mills, & Nelson, 1999;
Rhodes, Riby, Matthews, & Coghill, 2011).
Although studies have shown that CANTAB
tests can discriminate clinical populations
from normal controls, little is known about
the validity of these tests compared to
traditional neuropsychological tests in the
general population (Smith, Need, Cirulli,
Chiba-Falek, & Attix, 2013).
CANTAB tests are mainly based on
traditional
neuropsychological
tests
(Cambridge Cognition Ltd., 2006). These
traditional tests have been highly used and
their validity and reliability has been
carefully assessed (Ahonniska, Ahonen, Aro,
Tolvanen& Lyytinen, 2000; Gnys & Willis,
1991; Mammarella, Pazzaglia, & Cornoldi,
2008; Halperin, Sharma, Greenblatt, &
Schwartz, 1991). However, the reliability of
the CANTAB tests has been inadequately
described in earlier studies (Luciana &
Nelson, 2002). According to Luciana (2003),
internal consistency coefficients were high
(.73 – .95) in 4–12-year-old children.
However, to our knowledge, there are no
other studies establishing the internal
consistency agreement of CANTAB tests in a
child population.
Furthermore, studies measuring the testretest reliability of CANTAB have been
sparse. According to Lowe and Rabbit
(1998), the test-retest agreement for the
CANTAB tests in an elderly adult population
was either moderate, ranging from .70 to .86,
or low, ranging from .09 to .68 for four week
time interval. Fisher et al. (2011) observed
quite low intra-class correlations for
CANTAB subtests, Spatial Span length, and
Spatial Working Memory errors (ICC = .51 –
.59) for a three-week interval in healthy
children. However, according to Gau and
Shang (2010), intra-class correlations for
CANTAB tests (Intra-Extra Dimensional Set
Shift, Spatial Span, Spatial Working
Memory, Stockings of Cambridge) ranged
from .55 to .94 for time interval of 14–42
INTERNAL CONSISTENCY AND STABILITY OF THE CANTAB
days in a group of 10 children with Attention
deficit hyperactivity disorder (ADHD). To
our knowledge, there are no other studies
establishing the test-retest agreement for
CANTAB tests in a child population (Henry
& Bettenay, 2010; Luciana, 2003), and the
results of existing studies are, to some extent,
inconsistent.
It is important to examine the reliability and
the stability of the tests because low
reliability limits both the sensitivity to
diagnose clinical conditions and the
sensitivity to detect changes in cognition over
time (Lowe & Rabbitt, 1998). In addition,
low reliability and stability limit the
usefulness of the test as a research and
clinical tool. Moreover, the use of CANTAB
and
similar
computer-based
neuropsychological
test
batteries
is
increasing worldwide and that is why it is
important to determine the psychometric
properties of these kinds of test batteries. The
purpose of this study was to evaluate the
internal consistency and the one-year
stability of seven CANTAB tests measuring
visual memory, executive function, and
attention in elementary school-aged children.
3
letter for their parents/guardians, and a
consent form. Participation in the study was
voluntary, and all the participants and their
parents were informed about their right to
drop out of the study at any time without a
specific reason. Only children with a fully
completed consent form (signed by a
parent/guardian and the child) on the day of
the first measurements were included in the
study. In 46% of families, the highest level of
parental education was tertiary level
education. Seventy-seven percent of the
parents were married or cohabiting. Six
percent of the children had a diagnosed
learning difficulty. The children had normal
or corrected-to-normal vision. They
participated in normal curriculum-based
instruction, and the language of instruction
was Finnish. During spring 2012, students
who were fifth graders in spring 2011 were
invited to participate in the follow-up
measurements.
Seventy-four
children
participated in these follow-up measurements
(49% of 151 eligible, 64% girls, Mage2011 =
11.73, SD = .37, Mage2012 = 12.82, SD = .04).
The study was performed according to the
principles of the Declaration of Helsinki and
the Finnish legislation and was approved by
the Ethics Committee of the University of
Jyväskylä.
METHOD
Participants
The data of the present study is part of a
larger research project, which aims to
determine the associations of physical
activity, sedentary behavior, cognitive
functions and academic achievement in
elementary school-aged children. In spring
2011, 230 fifth and sixth graders (48% of 475
eligible, 57% girls, Mage = 12.19, SD = .63)
from five schools in the Jyväskylä school
district in Finland participated in the study.
When the children were invited to participate
in the study, they were given an information
pack containing a leaflet for themselves, a
Procedures
CANTAB (a PaceBlade Slimbook P110
tablet PC with a 12-inch touch-screen
monitor and Windows XP Professional
operating system, CANTABeclipse version
3) was used to assess a broad range of
cognitive functions: a) visual memory
(Pattern Recognition Memory [PRM] and
Spatial Recognition Memory [SRM]), b)
executive function (Spatial Span [SSP],
Stockings of Cambridge [SOC], Intra-Extra
Dimensional Set Shift [IED]), and c)
attention (Reaction Time [RTI] and Rapid
Visual Information Processing [RVP]) (Table
1). The tests were run individually with the
INTERNAL CONSISTENCY AND STABILITY OF THE CANTAB
help of a trained research assistant and
according to the standard protocol. The
standard instructions for the tests were
provided in the CANTAB manual and were
translated into Finnish. The execution of the
tasks required about 45 minutes. The test
battery was administered in a silent room
without distractions. A Motor Screening Task
measuring simple psychomotor speed and
accuracy was used as a training procedure at
the beginning of a test session.
Measures
Visual
memory.
Visual
memory
performance was assessed with PRM and
SRM. PRM measures recognition memory
for visual patterns in a two-choice forced
discrimination paradigm. In the presentation
phase, the children were presented with 12
different geometric patterns one after the
other in the center of the screen. Beforehand,
they were asked to remember the patterns. In
the recognition phase, the children were
presented with 12 trials of two patterns: a
pattern they had already seen and a novel
pattern. They were asked to choose a pattern
they remembered having seen. The target
patterns were presented in the same order as
in the first time. This subtest was repeated
with a new set of the 12 patterns to be
remembered. The score in this task is based
on the number of correct responses
(maximum 24).
SRM measures recognition memory for
spatial locations in a forced-choice paradigm.
In the presentation phase, the children were
presented with a white square on the screen
in five different locations and asked to
remember the locations where they had seen
the square. In the recognition phase, the
children were shown two squares in different
locations: one in the same location as before
and the other in a new location. The children
were instructed to choose the location where
they remembered seeing the square. The
4
target locations were presented in the same
order as in the first time. The block of five
trials was repeated four times in total. The
score in this task is based on the number of
correct responses (maximum 20).
Executive function. Children’s executive
functions were assessed with SSP, SOC and
IED tests. The SSP is based on the Corsi
Blocks task (Milner, 1971), which measures
the length of the visuospatial memory span.
In each trial, there are 10 white boxes on the
screen, and the color of a specified number of
boxes changes one by one. The children were
directed to reproduce the sequence by
touching the same boxes in the same order
that the boxes changed their color. If the child
reproduced the correct sequence, he/she
passed to the next difficulty level, where one
more box was added to the sequence. The
child has three attempts at each level. If the
third attempt was unsuccessful, the task was
terminated. The task starts with a two-box
sequence and ends with a nine-box sequence,
which is the highest possible level to proceed.
The score in the task is based on the length of
the maximum sequence that the child can
reproduce.
The SOC is a computerized version of the
Tower of London task (Owen, Downes,
Sahakian, Polkey, & Robbins, 1990; Shallice
& Shallice, 1982) measuring spatial planning
and spatial working memory. At the
beginning of each problem, the children were
presented with a computer screen split into
two parts. In both parts of the screen, there
were three vertical stockings and three
colored balls in predetermined order. The
children were required to move the colored
balls in the lower part of the screen to the
same position in the stockings as they are in
the upper part of the screen. They were asked
to use only a specific number of moves (two,
three, four, or five) to fulfill the goal. The
balls can be moved one at time by touching
INTERNAL CONSISTENCY AND STABILITY OF THE CANTAB
first the required ball and then the target
location. The balls cannot be moved outside
the stockings, and the lower balls cannot be
moved before the upper balls. If the child
took more than double the number of moves
required to fulfill the goal, the task was
terminated. If three consecutive problems
were terminated, the entire test ended. The
score in this task is based on the number of
problems the child solves with the minimum
number of moves.
IED is a computerized analogue of the
Wisconsin Card Sorting test and measures
rule acquisition and reversal in a set-sifting
condition. Specifically, it measures the
ability to focus attention on different stimuli
within a relevant dimension and shift
attention to a previously irrelevant
dimension. There are nine stages, with
increasing difficulty in this task. The children
were instructed to choose one of the two
different dimensions: one is correct, and the
other is incorrect. According to immediate
feedback given from the computer, they were
expected to choose the correct pattern and
learn the rule. The children progressed
through the task by satisfying a
predetermined criterion of learning the rule at
each stage (six consecutive correct choices).
If the children failed to learn the rule during
50 trials at any stage, the test was terminated.
The first two stages of the task measured
simple discrimination (stage 1) and simple
reversal (stage 2), and the children had to
choose between two purple patterns. In stages
3 and 4, compound stimuli (a purple pattern
and a white lined drawing) were presented. In
these stages, the children had to continue to
respond to the previously relevant dimension
(the purple pattern) and ignore the presence
of the new irrelevant dimension (the white
lined drawing) (nonoverlapping compound
discrimination [stage 3] and compound
overlapping discrimination [stage 4]). These
5
stages were followed by compound reversal
(stage 5). In stage 6, the first attentional shift
is required (the intradimensional shift). The
children were presented with new compound
stimuli: novel shapes of each of the two
dimensions (the purple pattern and the white
line drawing). They had to continue to
respond to the relevant dimension (the purple
pattern). This stage was followed by the
intradimensional reversal (stage 7). In stage
8, the compound stimuli changed again, but
this time the children had to shift their
attention (the extradimensional shift) and
respond to the previously irrelevant
dimension (the white lined drawing). Stage 9
involves extradimensional reversal. The
score in this task is based on the number of
stages completed.
Attention. The children’s attention abilities
were assessed with RTI and RVP. RTI
measures the children’s speed of response to
an unpredictable visual target.
In the
unpredictable condition, the yellow spot
appears in any of five circles on the screen.
The children were instructed to hold down
the press pad button until they saw the yellow
spot and then touch the middle of the correct
circle as quickly as possible. The children
took part in rehearsal trials and 15 task trials.
The scores in this task are based on reaction
time (ms) and movement time (ms).
The RVP measures the sustained attention
and is similar to the Continuous Performance
Task. There is a white box on the screen
where digits from 2 to 9 appear in a pseudorandom order at the rate of 100 digits per
minute. The children were directed to touch
the press pad button every time they saw the
following target sequence: digits 3, 5, and 7
(the 357 mode). During the practice stage, the
children received hints and feedback from the
computer, which declined gradually. In the
assessment stage, the children received no
hints or feedback. This stage took 3 minutes.
INTERNAL CONSISTENCY AND STABILITY OF THE CANTAB
The score in this task is based on RVP A’,
which measures how good the child is at
detecting the target sequences (range: .00 to
1.00; bad to good).
Statistical analysis
For the statistical analyses, the SPSS 19.0 for
Windows statistical package (SPSS (2010)
IBM SPSS Statistics 19 Core System User’s
Guide (SPSS Inc., Chicago, IL) and the
Mplus statistical package (Version 7; Muthèn
& Muthèn, 1998–2012) were used.
Logarithmic transformations were applied to
variables with skewed distributions, and
gender differences were tested using the
independent samples t-test. The differences
between the subjects with complete data and
the subjects who did not participate in the
follow-up measurement were tested using the
independent samples t-test for continuous
variables and Pearson’s Chi-Square test for
dichotomously scored variables. Pearson’s
correlation coefficients were calculated for
continuous variables between the different
sections of each test. Effect sizes (Cohen’s d,
standardized mean
difference) were
calculated for repeated measures. The
reliability of each nonhampering test was
estimated with Cronbach’s alpha reliability
coefficient (α). As preliminary analysis of
stability, Pearson’s correlation for continuous
variables and tetrachoric correlations for
dichotomously scored variables were
calculated between the assessments.
To examine the stability of the CANTAB
tests, structural equation models were
applied. To combine a very large number of
measured variables for each latent factor,
item parcels were constructed by summing
every third pattern to same parcel (Little,
Cunningham, Shahar, & Widaman, 2002).
Item parcels were used in order to achieve
continuous indicators and not to end up with
too large model in terms of the ratio of sample
size to number of free parameters (Herzog &
6
Boomsma,
2009;
Westland,
2010).
Underlying latent traits were assumed to be
unidimensional. The constructed parcels
were then used as indicator variables in the
confirmatory factor analyses.
The measurement models were first specified
at both measurement times to test the
association between the observed variables
and the underlying factors. After
demonstrating the fit of the measurement
models, longitudinal confirmatory factor
analyses were performed. The baseline
stability model, in which the factor (factors)
in the second assessment (2012) was
predicted by the factor (factors) in the
previous measurement point (2011), was
estimated. To detect time invariance in the
latent constructs, equality constraints were
imposed on the corresponding factor loadings
across two time points. Furthermore, if the
invariance assumption of a stability model
was supported, a more parsimonious model
in which all the factor loadings were fixed to
be one was estimated.
Full information maximum likelihood
(FIML) estimation with robust standard
errors (MLR) was used under the assumption
of data missing at random. Item response
theory (IRT) modeling using FIML
estimation was applied to the CANTAB tests
with hampering nature.
The goodness-of-fit of the cross-sectional
and longitudinal models was evaluated by the
Satorra–Bentler
scaled
χ2-test,
the
comparative fit index (CFI), the Tucker–
Lewis Index (TLI), the root mean square
error of approximation (RMSEA), and the
standardized root-mean-square residual
(SRMR). The model fits the data well if the
p-value for the χ2-test is non-significant. CFI
and TLI values close to 0.95, an RMSEA
value below 0.06, and an SRMR value below
0.08 indicate good fit between the model and
INTERNAL CONSISTENCY AND STABILITY OF THE CANTAB
the observed data (Hu & Bentler, 1999). A
Satorra–Bentler scaled χ2 difference test was
conducted for the nested models. If the χ2-test
produces a non-significant loss of fit for the
constrained model as compared to the
baseline stability model, the equality
constraints are supported.
RESULTS
In this study, Cronbach’s alpha reliability
coefficients were calculated for crosssectional data in 2011 to estimate the internal
consistency of the CANTAB tests. Structural
equation modeling was used to estimate the
one-year stability of the CANTAB tests in
longitudinal data setting.
The mean values, standard deviations, and
gender differences for the cross-sectional
sample at the first measurement point are
presented in Table 2. The performance of the
boys and girls did not differ in the CANTAB
test, except in the RTI, where the boys’ fivechoice movement time (2011: t(228) = 3.30,
p = .001, 2012: t(86) = 2.81, p = .006) and
reaction time (2011: t(228) = 4.07, p < .001,
2012: t(86) = 2.39, p = .020) were shorter
than that of the girls. The mean values and the
standard deviations for the follow-up sample
and the effects sizes (Cohen’s d) for the
repeated measures are presented in Table 3.
The subjects with complete data (n = 74) did
not differ from the subjects who did not
participate in the follow-up measurements (n
= 156) with respect to the highest level of
parental education, family structure, family
income, or diagnosed learning difficulties.
These groups also did not differ in their
performance in the CANTAB tests.
Reliability
Cronbach’s alpha reliability coefficients were
.65 for the PRM number of correct responses,
.21 for the SRM number of correct responses,
7
.87 for the RTI five-choice movement time,
.66 for the RTI five-choice reaction time and
.49 for the RVP A’. For hampering tests
(SSP, SOC and IED), Cronbach’s alpha could
not be determined.
Stability
Visual memory. The distribution of the PRM
number of correct responses was negatively
skewed, and 50% of children made two
mistakes or less. For the PRM number of
correct responses, Pearson’s correlation
between the assessments was r(74) = .53 (p <
.001 ). Three parcels from 24 patterns
(incorrect/correct response) of PRM were
constructed by summing eight items into the
same parcel. These subscales were then used
as the indicator variables in the confirmatory
factor analyses. The baseline stability model
fitted the data well. Invariance assumption
was supported, with an insignificant scaled
difference in the χ2 value (χ2 (2) = .89, p =
.64). In addition, the model in which all the
loadings were fixed to be one was confirmed
(χ2 (4) = 4.67, p = .32). The goodness-of-fit
statistics of the more constrained model for
the PRM number of correct responses were
good (χ2 (12) = 17.30, p = .14, CFI = .96, TLI
= .95, RMSEA = .04, SRMR = .13). The
estimation results of the model are presented
in Figure 1. The stability for the PRM was
.80. The factor loadings and the measurement
error variances were significant.
Three
parcels
from
20
patterns
(incorrect/correct response) were formed also
for the SRM. The estimation results of the
cross-sectional measurement models in 2011
and 2012 revealed that none of the parcels
loaded significantly on the hypothesized
factor. Therefore, a stability model for SRM
could not be determined. Correlations among
20 trials of SRM were calculated, and only 25
correlations of 190 were statistically
significant. The correlations were modest and
ranged from -.14 to .37, with one exception:
INTERNAL CONSISTENCY AND STABILITY OF THE CANTAB
The second and fifth trials in the third block
correlated with each other (r(229) = .77, p <
.001). The correlation for the SRM number of
correct responses between 2011 and 2012
was r(72) = .30 (p = .009). The level of
performance remained the same in 20% of
the children, it improved in 43%, and it
declined in 37%.
Executive function. The stability model for
the SSP could not be determined, because of
the nature of the test. The distribution of
children’s span lengths are presented in Table
4. The correlation between the SSP span
length in 2011 and in 2012 was r(72) = .37 (p
= .001). The span length stayed the same in
34% of children, improved in 53%, and
declined in 14%.
The cross-sectional IRT models for SOC
were estimated for dichotomously scored
items (problem solved/not solved in
minimum moves). Only 5 of the 12 items
loaded significantly on the hypothesized
factor in 2011 and 3 of the 12 items in 2012.
According to the results of the estimated
baseline stability model, there was no
significant association between the latent
variables measured in 2011 and 2012. The
correlation for SOC problems solved in the
minimum number of moves between 2011
and 2012 was r(72) = .23 (p = .046). The level
of performance stayed the same in 11% of
children, improved in 58%, and declined in
31%.
As the numbers of errors in stages 3 to 7 and
8 to 9 of the IED test were highly correlated
with each other, a cross-sectional two-factor
model of the number of errors was estimated.
All the items loaded on the hypothesized
factors, except for the errors in stage 7 in
2012. There was no significant correlation
between the factors either in 2011 or in 2012.
In addition, the results of the estimated
baseline stability model revealed that the
8
regression coefficient between the latent
variables measured in consecutive years was
significant only for the latent variable
measured by the errors in stages 8 and 9 (b =
.68, SE = .08, p < .001). Therefore, the stages
from 3 to 7 were discarded from further
analyses. For the dichotomous variables,
which indicated whether the child completed
the stage, tetrachoric correlations were
calculated. The tetrachoric correlations
between stages 8 and 9 were .99 (p < .001) in
2011 and .96 (p < .001) in 2012. The
tetrachoric correlation for stage 8 between
2011 and 2012 was .38 (p = .047). For stage
9, it was .64 (p < .001). The level of
performance remained the same in 69% of
the children, it improved in 19%, and it
declined in 12%. In 2011, 66% of the children
passed the test, and 72% passed the test in
2012.
Attention. For the RTI five-choice reaction
time, Pearson’s correlation between the
assessments was r(74) = .63 (p < .001). For
the RTI five-choice movement time, it was
r(74) = .50 (p < .001). For structural equation
modeling, three subscales of reaction time
and movement time at both measurement
points were formed from 15 patterns in the
RTI (and each subscale was divided by 10).
The results of the estimated cross-sectional
two-factor model confirmed that the
subscales of reaction time and movement
time loaded on their hypothesized factors.
The baseline stability model fitted the data
reasonably well. The scaled χ2-difference test
produced a non-significant loss of fit for the
constrained stability model compared with
the baseline model (χ2 (4) = 6.59, p = .16). In
addition, a more constrained model, in which
the loadings were fixed to be one, was
supported, with an insignificant difference in
the χ2 value (χ2 (8) = 6.91, p = .55). The more
constrained stability model for the RTI
reaction time and the movement time is
presented in Figure 2. The goodness-of-fit
INTERNAL CONSISTENCY AND STABILITY OF THE CANTAB
statistics of the more constrained model for
the RTI reaction time and the movement time
were good (χ2 (58) = 78.51 (58) p = .04, CFI
= .96, TLI = .95, RMSEA = .04, SRMR =
.15). The stability coefficient for the RTI
movement time was .67. For the RTI reaction
time, it was .78. All the factor loadings and
the measurement error variances were
significant.
For the RVPA’, Pearson’s correlation
between the assessments was r(74) = .39 (p =
.001). The RVP A’ (multiplied by 10) scores
of the three blocks of the test were used as
indicator variables in the structural equation
modeling. The distribution of the RVP A’
number of correct responses was highly
negatively skewed. The baseline stability
model fitted the data reasonably well. The
invariance assumption was supported, with
an insignificant difference in the χ2 value (χ2
(2) = 4.41, p = .11). When all the factor
loadings were constrained to be one, a scaled
χ2 difference test produced a significant loss
of fit (χ2 (4) = 10.96, p = .03). A constrained
stability model for RVP A’ is presented in
Figure 3. The goodness-of-fit statistics of the
constrained model for RVP A’ were
reasonable good (χ2 (10) = 17.94 (10) p = .06,
CFI = .91, TLI = .87, RMSEA = .06, SRMR
= .25. The stability coefficient for RVP A’
was .62. All the factor loadings and the
measurement
error
variances
were
significant.
DISCUSSION
In this study, the internal consistency and the
one-year stability of seven CANTAB tests
were examined in elementary school-aged
children. According to Cronbach’s alpha
reliability coefficients, only the RTI fivechoice movement time increased above a
typically accepted level of .7 (Nunnally &
Bernstein, 1994). According to the structural
9
equation modeling, the PRM number of
correct responses and the RTI reaction time
had high levels of stability. In addition, the
RTI movement time and the RVP A’ had a
moderate level of stability. Furthermore, the
SSP span length and the IED number of
children who completed at least stage 8
seemed to have a moderate correlation
between the two measurement points. The
SRM and the SOC tasks were not reliable or
stable measures in this study population.
Visual memory. Cronbach’s alpha reliability
coefficients for the PRM and the SRM were
below the accepted level of .7 (Nunnally &
Bernstein, 1994), indicating that the total
scores of the tests should be used with
caution. In addition, the patterns in the SMR
did not correlate with each other, and those
patterns that did showed only a modest
correlation, fluctuating around zero. This
finding does not support that of Luciana
(2003) who reported that the internal
consistency coefficients for CANTAB tests
ranged from .73 to .95 in 4–12-year-old
children. To increase the reliability of the
PRM, we recommend estimating the
measurement errors away by using structural
equation modeling in the analyses.
One possible explanation for the low internal
consistency of the PRM may be the ceiling
effect. According to Luciana and Nelson
(2002), children reach an adult level of
performance in the PRM by the age of 7
years, after which ceiling levels are reached.
Thus, it may be problematic to discriminate
9- to 12-year-old children with high ability.
In our study, the children were about 12
years. Generally, their performance was high
in the PRM test. Fifty percent of the children
made two errors or less in the test. It seems
that the errors the children made were sparse
and random, which may explain why the
patterns of the tests do not have a high
correlation with each other. However, this
INTERNAL CONSISTENCY AND STABILITY OF THE CANTAB
was not the case with the SRM because the
children’s performance did not reach the
level of ceiling.
The stability was good for the PRM number
of correct responses (.80). However, a
stability model for SRM could not be
determined because none of the parcels of
SRM
loaded
significantly on
the
hypothesized factor. The finding regarding
PRM’s stability is consistent with that of
Lowe and Rabbitt (1998) who reported that
the test-retest correlation for PRM was .84 in
a healthy adult population (ages 60–82
years).
In summary, according to the results of this
study, the PRM task of CANTAB proved to
be a stable measure for 12-year-olds. To
increase the reliability of the PRM, we
recommend using structural equation
modeling in research analyses. The SRM task
was not a reliable measure.
Executive function. The traditional version
of Corsi Blocks test has been shown to be a
reliable test for young adults (α = .85)
(Miyake, Friedman, Rettinger, Shah, &
Hegarty, 2001) and children (α = .79)
(Mammarella et al., 2008). In this study, the
CANTAB version of the Corsi blocks task,
SSP, seemed to be an adequate tool for
measuring visuospatial memory capacity in
the children aged 12 years. There was
variance in the results of the SSP among the
children. In addition, most of the children
improved their performance one year later,
which is line with a previous study that found
that children approximates functional
maturity in the SSP task at the age of 12 years
(Luciana & Nelson, 2002). Nevertheless, we
cannot draw advanced conclusions about the
reliability of the SSP because its internal
consistency could not be determined. Thus,
we cannot say how much is real variance and
how much is measurement error.
10
In the case of the SSP, either stability model
could be determined. However, the
correlation for the SSP span length between
2011 and 2012 was .37. According to
previous studies, the test-retest reliability for
SSP was .51 for a three-week interval (Fisher
et al., 2011), .55 for 14–42 days interval (Gau
& Shang, 2010) in children and .64 for a fourweek interval in the elderly (Lowe & Rabbitt,
1998).
The CANTAB test, SOC is identical to the
traditional Tower of London (TOL) task
(Owen et al., 1990; Shallice & Shallice,
1982). According to the results of this study,
it seems that the patterns in the SOC are not
informative. Other studies had also raised
questions
about
the
psychometric
characteristics of traditional TOL tasks
(Bishop, Aamodt-Leeper, Creswell, McGurk,
& Skuse, 2001). Humes, Welsh, Retzlaff, and
Cookson (1997) reported low internal
consistency for the TOL (split-half reliability
of .19 and Cronbach alpha of .25). In
addition, according to Ahonniska et al.
(2000), a similar task, the Tower of Hanoi
(TOH) did not have satisfying reliability
(simplex estimator) in the first two
assessments, but improved with repetition,
when children aged 8 and 12 years
participated in nine repeated assessments of
the task during 18 months. The test-retest
reliability of the traditional TOL task has
been reported to be quite low: .5 for 30–40
day time interval (Bishop et al., 2001), but
also acceptable: .72 for 25 min time interval
in preschool children (Gnys & Willis, 1991).
However, Ahonniska et al. (2000) reported
relatively high stability for TOH (Beta= .82–
1.00, depending on the performance index)
after the second assessments. The temporal
stability of the CANTAB version, SOC, has
been reported to quite low: 26–.60 for four
week time interval (depending on the
performance index) (Lowe & Rabbitt, 1998),
but also acceptable: .72 for 14–42 day time
INTERNAL CONSISTENCY AND STABILITY OF THE CANTAB
interval in children with ADHD (Gau &
Shang, 2010).
Ahonniska et al. (2000) proposed that large
intraindividual variation due to different rates
of learning may explain the low reliability
(simplex estimator) in the first few
assessments. Also, Lowe and Rabbitt (1998)
suggested that one possible explanation for
the low temporal stability of SOC might be
the novelty of the task. Performance in the
tests of executive function can abruptly
improve when an individual discovers an
optimal strategy, but the performance
improves less or not at all if a strategy is not
found. The performance may even decline if
an incorrect strategy is attempted. Different
practice effects will weaken the test-retest
reliability (Lowe & Rabbitt, 1998).
According to Anderson, Anderson, and
Lajoie (1996), performance in the TOL
improves approximately at the age of 11
years due to a developmental spurt. In our
study, 58% showed improved performance,
and 31% showed a decline in performance.
However, Bishop et al. (2001) reported that
average scores in the retest and the initial test
were nearly the same in 7–15-year-old
children indicating that task novelty cannot
account for the low test-retest reliability.
Bishop et al. (2001) suggested that any
variation due to individual differences in
neurology in executive function performance
may be overwhelmed by powerful factors
other than brain development influencing the
performance in executive function tasks.
In addition, it has been reported that a simpler
TOL (two, three, four, or five moves) gives
ceiling effects in older children (Anderson et
al., 1996; Krikorian, Bartok, & Gay, 1994).
However, according to Luciana, Collins,
Olson, and Schissel (2009) and Luciana and
Nelson (2002), 11–12-year-old children do
not reach adult levels of performance. In our
study, the children did not reach the ceiling
11
levels, which suggests that the ceiling effect
does not explain the low reliability in this
case.
IED task is based on traditional the
Wisconsin Card Sorting test. In this study, the
analysis showed that only stages 8 and 9 were
informative, and around 70% of the children
passed the whole test. According to previous
studies, shifting ability improves with age
and reaches ceiling levels by age 12 years
(Anderson, 2002; Luciana & Nelson, 2002).
According to Luciana and Nelson (1998), it
is typical for normal adults to make
significantly
more
errors
in
the
extradimensional shift stage (at stage 8) than
in earlier stages. This phenomenon was
repeated in the 8-year-olds but not in the
younger children (Luciana & Nelson, 1998).
Substantial amount of errors in the
extradimensional shift stage was also
observed in the current study with 12-yearolds, and it seems that only stages 8 and 9
discriminate
children
with
weaker
performance from children with general
performance.
In this study, according to the tetrachoric
correlations, the minimum stability for IED
stage 8 completed was 0.38. For IED stage 9
completed, it was .64. In previous studies, the
temporal stability for the CANTAB IED task
was reported to be .78 for 14–42 day time
interval (Gau & Shang, 2010) in children,
.40–.75 (depending on the performance
index) in adults (Henry & Bettenay, 2010)
and .09–0.70 (depending on the performance
index) for four week time interval in the
elderly (Lowe & Rabbitt, 1998).
In summary, it seems that only the SSP of
these executive function tests could work
well in healthy 12-year-old children. The IED
was quite stable, but it seemed to be too easy
for the 12-year-olds and did not discriminate
between children with higher abilities. In this
INTERNAL CONSISTENCY AND STABILITY OF THE CANTAB
study, the SOC was not a reliable or stable
measure.
Attention. In this study, the internal
consistency coefficient for the RTI fivechoice movement time reached the accepted
level of .7 (Nunnally & Bernstein, 1994),
whereas internal consistency was below this
accepted level for the RTI five-choice and
RVPA’. The stability was good for the
reaction time and moderate for the RTI
movement time and the RVP A’. Sustained
attention has been assessed with the
Continuous Performance Task before, which
is similar to the CANTAB RVP task. The
split-half reliability for the computerized
Continuous Performance Task was reported
to be .38–.95 (depending on the performance
index) (Conners, Epstein, Angold, & Klaric,
2003; Halperin et al., 1991). According to
previous studies, the test-retest reliability
ranged from .55–84 (depending on the
performance index) for 4.8 month interval
(Conners et al., 2003) and 0.55–.84
(depending on the performance index) for
three month interval (Halperin et al., 1991).
In this study, the RVP A’ performance of the
children was very high. According to
Halperin et al. (1991), there were no
difficulties related to ceiling or floor effects
in the Continuous Performance Test in 7–10year-old boys, but they assumed that ceiling
effects would occur in older children.
According to the results of this study, the
ceiling effect was observed in the RVP task,
which may explain the low internal
consistency. In addition, the low stability
may also be the result of the easiness of the
test. Due to high level of performance, a
single random mistake may induce the effect
of varying performance between the
assessments, and affect stability.
In summary, according to the results of this
study, the RTI task of CANTAB is a reliable
12
and stable measure for 12-year-olds. When
using this test in research analysis, we
recommend estimating the measurement
errors away by using structural equation
modeling to improve the reliability of the
RTI. The RVP 357 mode was easy for the 12year-olds in this study. It might be useful to
utilize a more difficult version of the test with
a greater number of target sequences in this
age group.
Taken together, the internal consistency of
most of the CANTAB tests used in this study
was low, and two of the tests did not measure
the phenomena they were supposed to
measure with satisfying reliability. Some
previous studies reported that computerized
versions of traditional neuropsychological
tests are not equivalent to traditional manual
tests. For example, Feldstein et al. (1999)
reported that computerized versions of the
Wisconsin Card Sorting test were not similar
to the manual version. In addition, according
to Smith et al. (2013), CANTAB subtests
measuring executive function, speed of
processing, visual memory, and working
memory correlate only modestly with
traditional subtests. The reason for these
findings is unknown. Perhaps, computerized
test sessions are more sensitive to attentional
disruptions than manual sessions, or they
may
not
offer
similar
perceptual
characteristics to manual versions.
In the present study, stability of the measured
CANTAB tests was moderate supporting the
previous studies (Fisher et al., 2011; Gau &
Shang, 2010; Lowe & Rabbitt, 1998).
However, in these previous studies the testretest interval has been shorter, only few
weeks, whereas, in the present study, stability
was measured with one year interval. This
longer time interval may affect the stability,
because it is expected that the cognitive
abilities of 11-year-old children develop
INTERNAL CONSISTENCY AND STABILITY OF THE CANTAB
during one year. Therefore, measuring their
performance twice in the beginning with a
shorter interval between the measures would
have enabled calculation of the test-retest
reliability, and ruling out the developmental
effects.
Lastly, there are a lot of advantages in
computerized testing: computer technology
has increased the efficiency, ease, and
standardization of administration and saved
time and money related to testing. Electronic
data capture and automatic results scoring
have minimized human errors in scoring and
data entry and increased the accuracy of
timing and response latencies. (Cernich et al.,
2007; Parsey & Schmitter-Edgecombe,
2013). Other advantages of computerized
technology
–
particularly
for
the
measurement of attention, motor, and
memory functioning – are the availability of
almost unlimited alternate forms and an
increased number of trials. This minimizes
practice effects and allows more assessments
at shorter time intervals compared to
traditional measures. A large number of trials
and accurate assessment of reaction times
results in data that is normally distributed and
on a true interval scale (Betts, Mckay,
Maruff, & Anderson, 2006). This is
particularly important when slight changes in
performance across time are assessed.
Computer technology also provides test
administration
conditions
that
are
accommodating for individuals with
particular needs (American Educational
Research Association [AERA], American
Psychological Association [APA] & National
Council on Measurement in Education
[NCME], 2014). Touch-screen technology
facilitates use by young children and certain
clinical groups, and allows more reliable
assessment of motor function and processing
speed compared to traditional measures using
an individual administrator wielding a
13
stopwatch. In addition, non-verbal cultureneutral test stimuli are often used, which
allow the application of computerized test
batteries (like CANTAB) for individuals
from different racial, ethnic, geographic, or
sociocultural backgrounds. (Luciana, 2003;
Henry, 2010). CANTAB also has simple
standardized test administration; thus, it is
easy to use and no previous IT or scientific
training is needed to set-up and administer
the test (Cambridge Cognition Ltd., 2006).
Despite the potential advantages that
computerized
technology
offers
for
neuropsychological testing – especially the
ease of building ready algorithms for
calculating indexes and scores – computerassisted assessment also produces a risk
factor. Due to commercial competitive
reasons, the companies providing these tools
may not always publish detailed information
about these algorithms or the psychometric
properties of the tasks. The general
characteristics of scoring algorithms and the
accuracy of the algorithms as well as
technical evidence should be documented
and reviewed periodically (AERA, APA &
NCME, 2014). According to The Finnish
Psychological Test Committee (2013), test
batteries (computerized or not) that do not
provide a satisfactory level of information
about the psychometric properties of the tasks
in the technical manual should not be used in
clinical practice. Likewise, in clinical
practice, an expert (a psychologist or an MD)
should always do the interpretation of the test
results. There are two reasons for this. First,
to use CANTAB or other computerized test
batteries, there needs to be a person who
supervises and paces the introduction of tests
and monitors the assessment process
(Luciana, 2003; AERA, APA & NCME,
2014). Secondly, the interpretation and the
clinical conclusions and decisions made
based partly on the test results produce a
juridical situation where there needs to be a
INTERNAL CONSISTENCY AND STABILITY OF THE CANTAB
responsible decision-maker. Most countries
do not allow automated decision-making in
healthcare.
There will be rapid growth in the usage of
computer-assisted test batteries. However,
little is known about the psychometric
properties of computerized batteries as well
as how performance on computerized
batteries
correlates
with
traditional
neuropsychological measures. In addition, it
is also vital to have more information about
the reliability and validity of these batteries
in all clinical target populations of interest as
well as in samples derived from the normal
population.
Strengths and limitations
To our knowledge, this is the first study
examining the internal consistency and oneyear stability of the CANTAB tests in healthy
12-year-old children. This study provides
valuable and important information on the
psychometric characteristics of CANTAB
tests in a child population. The study sample
in this study in 2011 was quite large and
representative of Finnish children at the age
of 12. On the other hand, the number of
children in the follow-up measurements in
2012 was limited, which attenuated the
statistical power. However, subjects with
complete data did not differ from the subjects
who did not participate to follow-up
measurements in socioeconomic positions or
performance in the CANTAB tests. In
addition, the models were estimated with
FIML estimation, which uses all information
available and takes missing data into account.
The age-range of the children studied was
narrow, which limits the application of the
results to different age groups or
developmental stages. In addition, the study
sample was culturally homogeneous
including children only from Finland. Also,
we did not measure the performance of the
children again immediately after the first
14
measurement. Thus, we could not calculate
intra-class correlations for the CANTAB
tests. Furthermore, several measurement
points during the year would give more
accurate information on the effects of
practice on the performance in the tests.
Summary and conclusion
In this study, psychometric characteristics of
seven CANTAB tests were determined.
According to the results, the internal
consistency was acceptable only in the RTI
task. The one-year stability was moderate-togood for the PRM, SSP, IED, RTI, and RVP.
The SRM and SOC tasks were not reliable or
stable measures in this study. In addition, the
PRM, IED, and RVP had ceiling effects in the
present study population of 12-year-old
healthy children. The results of this study also
suggest that psychometric characteristics of
traditional neuropsychological tests may not
remain when transplanted into computer
form. Thus, the reliability and the stability of
CANTAB and other computer-based test
batteries among the target population should
be confirmed before using them for clinical
or research purposes.
Acknowledgments
This study was funded by Finnish Ministry of
Education and Culture and the Academy of
Finland (grant 273971).
REFERENCES
Ahonniska, J., Ahonen, T., Aro, T.,
Tolvanen, A., & Lyytinen, H. (2000).
Repeated assessment of the Tower of
Hanoi test: Reliability and age effects.
Assessment, 7(3), 297–310. doi:
10.1177/107319110000700308
American Educational Research
Association, American Psychological
Association, National Council on
Measurement in Education. (2014).
INTERNAL CONSISTENCY AND STABILITY OF THE CANTAB
Standards for educational and
psychological testing. Washington DC:
American Educational Research
Association.
Anderson, P. (2002). Assessment and
development of executive function (EF)
during childhood. Child
Neuropsychology, 8(2), 71–82. doi:
10.1076/chin.8.2.71.8724
Anderson, P., Anderson, V., & Lajoie, G.
(1996). The Tower of London test:
Validation and standardization for
pediatric populatons. The Clinical
Neuropsychologist, 10(1), 54–65. doi:
10.1080/13854049608406663
Betts, J., Mckay, J., Maruff, P., & Anderson,
V. (2006). The development of
sustained attention in children: The
effect of age and task load. Child
Neuropsychology, 12(3), 205-221. doi:
10.1080/09297040500488522
Blackwell, A. D., Sahakian, B. J., Vesey, R.,
Semple, J. M., Robbins, T. W., &
Hodges, J. R. (2003). Detecting
dementia: novel neuropsychological
markers of preclinical Alzheimer’s
disease. Dementia and geriatric
cognitive disorders, 17(1-2), 42–48.
doi: 10.1159/000074081
Bishop, D., Aamodt‐Leeper, G., Creswell,
C., McGurk, R., & Skuse, D. (2001).
Individual differences in cognitive
planning on the Tower of Hanoi task:
Neuropsychological maturity or
measurement error? Journal of Child
Psychology and Psychiatry, 42(4), 551–
556. doi: 10.1111/1469-7610.00749
Cambridge Cognition Ltd. (2006).
CANTABeclipsetm: Software User
Guide. Manual version 3. Cambridge:
Cambridge Cognition Ltd. (2006).
Cernich, A. N., Brennana, D. M., Barker, L.
M., & Bleiberg, J. (2007). Sources of
error in computerized
neuropsychological assessment.
Archives of Clinical Neuropsychology,
15
22(Suppl 1), S39–S48. doi:
10.1016/j.acn.2006.10.004
Conners, C. K., Epstein, J. N., Angold, A.,
& Klaric, J. (2003). Continuous
performance test performance in a
normative epidemiological sample.
Journal of Abnormal Child Psychology,
31(5), 555–562. doi:
10.1023/A:1025457300409
Feldstein, S. N., Keller, F. R., Portman, R.
E., Durham, R. L., Klebe, K. J., &
Davis, H. P. (1999). A comparison of
computerized and standard versions of
the Wisconsin card sorting test. The
Clinical Neuropsychologist, 13(3), 303–
313. doi: 10.1076/clin.13.3.303.1744
The Finnish Psychological Test Committee
(2013). Guidelines for using computerassisted tests in psychological
assessment. [in Finnish]. Available at
http://www.psyli.fi/files/1445/Tietokon
eavusteinen_psykologinen_tutkimus_18
.12.2012.pdf
Fisher, A., Boyle, J., Paton, J.,
Tomporowski, P., Watson, C., McColl,
J., & Reilly, J. (2011).
Effects of a physical education
intervention on cognitive function in
young children: Randomized controlled
pilot study. BMC Pediatrics, 11(97).
doi:10.1186/1471-2431-11-97
Fried, R., Hirshfeld-Becker, D., Petty, C.,
Batchelder, H., & Biederman, J. (2012).
How informative is the CANTAB to
assess executive functioning in children
with ADHD? A controlled study.
Journal of Attention Disorders. doi:
10.1177/1087054712457038
Gau, S. S., & Shang, C. (2010). Executive
functions as endophenotypes in ADHD:
Evidence from the cambridge
neuropsychological test battery
(CANTAB). Journal of Child
Psychology and Psychiatry, 51(7), 838–
849. doi: 10.1111/j.14697610.2010.02215.x
INTERNAL CONSISTENCY AND STABILITY OF THE CANTAB
Gnys, J. A., & Willis, W. G. (1991).
Validation of executive function tasks
with young children. Developmental
Neuropsychology, 7(4), 487–501. doi:
10.1080/87565649109540507
Halperin, J. M., Sharma, V., Greenblatt, E.,
& Schwartz, S. T. (1991). Assessment
of the continuous performance test:
Reliability and validity in a nonreferred
sample. Psychological Assessment: A
Journal of Consulting and Clinical
Psychology, 3(4), 603–608. doi:
10.1037/1040-3590.3.4.603
Henry, L. A., & Bettenay, C. (2010). The
assessment of executive functioning in
children. Child and Adolescent Mental
Health, 15(2), 110–119. doi:
10.1111/j.1475-3588.2010.00557.x
Herzog, W., & Boomsma, A. (2009). Smallsample robust estimators of
noncentrality-based and incremental
model fit. Structural Equation
Modeling, 16(1), 1-27.
doi:10.1080/10705510802561279
Hu, L., & Bentler, P.M. (1999). Cutoff
criteria for fit indexes in covariance
structure analysis; Conventional criteria
versus new alternatives. Structural
Equation Modeling: A Multidisciplinary
Journal, 6(1), 1–55.
doi:10.1080/10705519909540118
Humes, G. E., Welsh, M. C., Retzlaff, P., &
Cookson, N. (1997). Towers of Hanoi
and London: Reliability of two
executive function tasks. Assessment,
4(3), 249–257.
Krikorian, R., Bartok, J., & Gay, N. (1994).
Tower of London procedure: A
standard method and developmental
data. Journal of Clinical and
Experimental Neuropsychology, 16(6),
840–850. doi:
10.1080/01688639408402697
Levaux, M. N., Potvin, S., Sepehry, A. A.,
Sablier, J., Mendrek, A., & Stip, E.
(2007). Computerized assessment of
16
cognition in schizophrenia: promises
and pitfalls of CANTAB. European
Psychiatry, 22(2), 104–115. Retrieved
from
http://dx.doi.org/10.1016/j.eurpsy.2006.
11.004
Little, T. D., Cunningham, W. A., Shahar,
G., & Widaman, K. F. (2002). To parcel
or not to parcel: Exploring the question,
weighing the merits. Structural
Equation Modeling, 9(2), 151–173. doi
:10.1207/S15328007SEM0902_1
Lowe, C., & Rabbitt, P. (1998). Test/re-test
reliability of the CANTAB and
ISPOCD neuropsychological batteries:
Theoretical and practical issues.
Neuropsychologia, 36(9), 915–923. doi:
10.1016/S0028-3932(98)00036-0
Luciana, M. (2003). Practitioner review:
Computerized assessment of
neuropsychological function in
children: Clinical and research
applications of the cambridge
neuropsychological testing automated
battery (CANTAB). Journal of Child
Psychology and Psychiatry, 44(5), 649663. doi: 10.1111/1469-7610.00152
Luciana, M., Collins, P. F., Olson, E. A., &
Schissel, A. M. (2009). Tower of
London performance in healthy
adolescents: The development of
planning skills and associations with
self-reported inattention and
impulsivity. Developmental
Neuropsychology, 34(4), 461–475.
doi:10.1080/87565640902964540
Luciana, M., Lindeke, L., Georgieff, M.,
Mills, M., & Nelson, C. A. (1999).
Neurobehavioral evidence for working‐
memory deficits in school‐aged
children with histories of prematurity.
Developmental Medicine & Child
Neurology, 41(8), 521–533. doi:
10.1111/j.1469-8749.1999.tb00652.x
Luciana, M., & Nelson, C. A. (1998). The
functional emergence of prefrontally-
INTERNAL CONSISTENCY AND STABILITY OF THE CANTAB
guided working memory systems in
four-to eight-year-old children.
Neuropsychologia, 36(3), 273–293. doi:
10.1016/S0028-3932(97)00109-7
Luciana, M., & Nelson, C. A. (2002).
Assessment of neuropsychological
function through use of the cambridge
neuropsychological testing automated
battery: Performance in 4-to 12-yearold children. Developmental
Neuropsychology, 22(3), 595–624. doi
:10.1207/S15326942DN2203_3
Mammarella, I. C., Pazzaglia, F., &
Cornoldi, C. (2008). Evidence for
different components in children's
visuospatial working memory. British
Journal of Developmental Psychology,
26(3), 337–355. doi:
10.1348/026151007X236061
Milner, B. (1971). Interhemispheric
differences in the localization of
psychological processes in man. British
Medical Bulletin; British Medical
Bulletin; British Medical Bulletin,
27(3), 272–277.
Miyake, A., Friedman, N.P., Rettinger, D.
A., Shah, P, & Hegarty, M. (2001).
How are visuospatial working memory,
executive functioning, and spatial
abilities related? A latent-variable
analysis. Journal of Experimental
Psychology: General, 130(4), 621–540.
doi: 10.1037/0096-3445.130.4.621
Nunnally, J.C. & Bernstein, I.H. (1994).
Psychometric Theory. (3rd ed.). New
York: McGraw-Hill.
Owen, A. M., Downes, J. J., Sahakian, B. J.,
Polkey, C. E., & Robbins, T. W. (1990).
Planning and spatial working memory
following frontal lobe lesions in man.
Neuropsychologia, 28(10), 1021–1034.
Retrieved from
http://www.cambridgebrainsciences.co
m/assets/default/files/pdf/Owen1990.pd
f
17
Parsey, C. M., & Schmitter-Edgecombe, M.
(2013). Applications of Technology in
Neuropsychological Assessment. The
Clinical neuropsychologist, (ahead-ofprint), 1–34.
10.1080/13854046.2013.834971
Rhodes, S. M., Riby, D. M., Matthews, K.,
& Coghill, D. R. (2011). Attentiondeficit/hyperactivity disorder and
Williams syndrome: Shared behavioral
and neuropsychological profiles.
Journal of Clinical and Experimental
Neuropsychology, 33(1), 147–156. doi:
10.1080/13803395.2010.495057
Robbins, T. W., James, M., Owen, A. M.,
Sahakian, B. J., Lawrence, A. D.,
McInnes, L., & Rabbitt, P. M. (1998).
A study of performance on tests from
the CANTAB battery sensitive to
frontal lobe dysfunction in a large
sample of normal volunteers:
Implications for theories of executive
functioning and cognitive aging.
Journal of the International
Neuropsychological Society, 4(5), 474–
490. Retrieved from
http://journals.cambridge.org/article_S1
355617798455073
Sahakian, B., & Owen, A. (1992).
Computerized assessment in
neuropsychiatry using CANTAB:
Discussion paper. Journal of the Royal
Society of Medicine, 85(7), 399–402.
Retrieved from
http://www.ncbi.nlm.nih.gov/pmc/articl
es/PMC1293547/pdf/jrsocmed001090031.pdf
Shallice, T., & Shallice, T. (1982). Specific
impairments of planning. Philosophical
Transactions of the Royal Society of
London.B, Biological Sciences,
298(1089), 199–209. doi:
10.1098/rstb.1982.0082
Smith, P. J., Need, A. C., Cirulli, E. T.,
Chiba-Falek, O., & Attix, D. K. (2013).
A comparison of the Cambridge
INTERNAL CONSISTENCY AND STABILITY OF THE CANTAB
automated neuropsychological test
battery (CANTAB) with “traditional”
neuropsychological testing instruments.
Journal of Clinical and Experimental
Neuropsychology, (ahead-of-print), 1–
10. doi:10.1080/13803395.2013.771618
Westland, C.J. (2010). Lower bounds on
sample size in structural equation
18
modeling. Electronic Commerce
Research and Applications, 9(6), 476487. doi:10.1016/j.elerap.2010.07.003
Table 1
CANTAB tests measuring different dimensions of cognitive functions.
Dimension of
cognitive
function
Visual
memory
Executive
function
Attention
Test
Abbreviation
Description
Score
1. Pattern Recognition Memory
PMR
2. Spatial Recognition Memory
SRM
No. of correct
responses (max 24)
No. of correct
responses (max 20)
3. Spatial Span
SSP
4. Stockings of Cambridge
SOC
5. Intra-Extra Dimensional Set
Shift
IED
6. Reaction Time
RTI
7. Rapid Visual Information
Processing
RVP
Children had to remember the presented geometric
patterns and discriminate them from the novel patterns.
Children had to remember the location of white squares
and discriminate these locations from the novel
locations.
Specified number of white boxes changed their color
one by one and children had to reproduce the same
sequence by touching the boxes in the same order the
boxes changed their color.
Children had to move the colored balls in the lower part
of the screen to the same position in the stockings as
they were in the upper part of the screen. They had
specified number of moves to use.
The children had to choose one of the two different
dimensions: one is correct, and the other is incorrect.
According to immediate feedback, they had to choose
the correct pattern and learn the rule.
Children had to hold down the press pad button until
they saw the yellow spot flashing on one of the five
circles, and then touch the middle of the circle as quickly
as possible.
Children had to touch the press pad button every time
they discriminate the target sequence (digits 3, 5, and 7)
from the digits appearing in a pseudo-random order at
the rate of 100 digits per minute.
Span length (max 9)
No. of problems
solved in minimum
moves (max 12)
No. of stages
completed
5-choice reaction
time (ms), 5-choice
movement time (ms)
A’ (range: .00 to 1.00;
bad to good) = how
well child detect the
target sequences
Table 2
Mean values, standard deviations (SD), and gender differences for CANTAB tests in the first
assessment in 2011
Measurements in 2011
PRM no. of correct
responses (max 24)
SRM no. of correct
responses (max 20)
SSP span length (max 9)
SOC no. of problems
solved in minimum moves
(max 12)
RTI five-choice movement
time (ms)
RTI five-choice reaction
time (ms)
RVP A’ (range 0–1)
IED % of children who
completed at least stage 8
Boys (n=99)
Mean
SD
20.88
Girls (n=131)
%
Mean
SD
2.80
20.84
16.49
1.61
6.53
Mean
SD
2.29
20.86
2.52
.478
16.81
1.67
16.67
1.65
.152
1.27
6.68
1.37
6.61
1.33
.385
7.69
1.81
7.61
1.71
7.64
1.75
.746
329
74
364
87
349
83
.001
300
36
318
32
310
35
<.001
0.97
0.02
0.97
0.03
0.97
0.02
.973
76
%
pa
All (n=230)
73
%
74
.154
Note. Abbreviations: PRM, Pattern Recognition Memory; SRM, Spatial Recognition Memory;
SSP, Spatial Span; SOC, Stockings of Cambridge; RTI, Reaction Time; RVP, Rapid Visual
Information Processing; IED, Intra-Extra Dimensional Set Shift.
a
p-value for gender differences.
INTERNAL CONSISTENCY AND STABILITY OF THE CANTAB
21
Table 3
Mean values and standard deviations (SD) for all variables for children who participated in
measurements in 2011 and 2012 and effects sizes (Cohen’s d) for the repeated measures
Boys (n=27)
Measurements
Girls (n=47)
All (n=74)
Mean
SD
d
Mean
SD
d
Mean
SD
d
20.96
3.39
.22
20.68
2.30
.10
20.78
2.73
.14
16.63
1.45
.02
16.70
1.79
.14
16.68
1.66
.10
6.52
1.19
.32
6.28
1.35
.55
6.36
1.29
.46
SOC no. of problems solved
in minimum moves (max 12)
7.52
1.76
.43
7.38
1.69
.60
7.43
1.71
.54
RTI five-choice movement
time (ms)
321
53
.05
370
83
.16
352
76
.12
RTI five-choice reaction time
(ms)
304
43
-.15
319
30
.05
314
36
-.02
RVP A’ (range 0–1)
.97
.02
.35
.96
.03
.40
.96
.03
.38
2011
PRM no. of correct
responses (max 24)
SRM no. of correct
responses (max20)
SSP span length (max 9)
IED % of children who
completed at least stage 8
2012
PRM no. of correct
responses (max 24)
SRM no. of correct
responses (max20)
SSP span length (max 9)
SOC no. of problems solved
in minimum moves (max 12)
RTI five-choice movement
time (ms)
RTI five-choice reaction time
(ms)
RVP A’ (range 0–1)
IED % of children who
completed at least stage 8
75.8
73.3
74.3
Boys (n=27)
Girls (n=47)
All (n=74)
21.56
1.65
20.96
2.80
21.18
2.45
16.67
1.52
16.94
1.51
16.84
1.51
6.93
1.07
6.98
1.00
6.96
1.00
8.26
1.72
8.40
1.39
8.35
1.51
325
65
382
75
361
76
298
34
321
36
313
37
.98
.02
.98
.03
.98
.03
88.2
75.9
80.7
Note. Abbreviations: PRM, Pattern Recognition Memory; SRM, Spatial Recognition Memory;
SSP, Spatial Span; SOC, Stockings of Cambridge; RTI, Reaction Time; RVP, Rapid Visual
Information Processing; IED, Intra-Extra Dimensional Set Shift; d, Cohen’s d.
INTERNAL CONSISTENCY AND STABILITY OF THE CANTAB
22
Table 4
Proportion (%) of children in 2011 and 2012 with different Spatial Span (SSP) lengths (2–9)
Measurement year
SSP span length
3
4
5
6
7
8
9
In 2011
1.3
1.3
22.6
20.4
23.9
24.8
5.7
In 2012
0
0
11.4
17.0
39.8
27.3
4.5
INTERNAL CONSISTENCY AND STABILITY OF THE CANTAB
23
Figure 1. The estimation results of the stability model of the Pattern Recognition Memory
(PRM) test for 2011 and 2012. Standardized parameter estimates and standard errors are
presented. Three parcels from 24 patterns (incorrect/correct response) of the PRM test were
constructed and used as the indicator variables in the confirmatory factor analyses (PRM 1, PRM
2, PRM 3). All the factor loadings were constrained to be equal to one.
INTERNAL CONSISTENCY AND STABILITY OF THE CANTAB
24
Figure 2. The stability model for the Reaction Time (RTI) test for 2011 and 2012. Standardized
parameter estimates and standard errors are presented. For structural equation modeling, three
subscales of the reaction time (Reac 1, Reac 2, Reac 3) and movement time (Move 1, Move 2,
Move 3) at both measurement points were formed from 15 patterns of RTI. All the factor
loadings were constrained to be equal to one.
INTERNAL CONSISTENCY AND STABILITY OF THE CANTAB
25
Figure 3. The stability model for the Rapid Visual Information Processing (RVP) test for 2011
and 2012. Standardized parameter estimates and standard errors are presented. The RVP
(multiplied by 10) of the three blocks of the test (RVP 1, RVP 2, RVP 3) were used as indicator
variables in the structural equation modeling. Factor loadings were constrained to be equal across
the time points.
III
THE ASSOCIATIONS OF OBJECTIVELY MEASURED PHYSICAL ACTIVITY
AND SEDENTARY TIME WITH COGNITIVE FUNCTIONS
IN SCHOOL-AGED CHILDREN
by
Heidi J. Syväoja, Tuija H. Tammelin, Timo Ahonen,
Anna Kankaanpää & Marko T. Kantomaa. 2014.
PloS one 9(7): e103559.
Reproduced with kind permission by Public Library Of Science
The Associations of Objectively Measured Physical
Activity and Sedentary Time with Cognitive Functions in
School-Aged Children
Heidi J. Syva¨oja1,2*, Tuija H. Tammelin1, Timo Ahonen2, Anna Kankaanpa¨a¨1, Marko T. Kantomaa1,3
1 LIKES – Research Center for Sport and Health Sciences, Jyva¨skyla¨, Finland, 2 Department of Psychology, University of Jyva¨skyla¨, Jyva¨skyla¨, Finland, 3 Department of
Epidemiology and Biostatistics, MRC–HPA Centre for Environment and Health, Imperial College London, London, United Kingdom
Abstract
Low levels of physical activity among children have raised concerns over the effects of a physically inactive lifestyle, not only
on physical health but also on cognitive prerequisites of learning. This study examined how objectively measured and selfreported physical activity and sedentary behavior are associated with cognitive functions in school-aged children. The study
population consisted of 224 children from five schools in the Jyva¨skyla¨ school district in Finland (mean age 12.2 years; 56%
girls), who participated in the study in the spring of 2011. Physical activity and sedentary time were measured objectively for
seven consecutive days using the ActiGraph GT1M/GT3X accelerometer. Self-reported moderate to vigorous physical
activity (MVPA) and screen time were evaluated with the questions used in the ‘‘WHO Health Behavior in School-aged
Children’’ study. Cognitive functions including visual memory, executive functions and attention were evaluated with a
computerized Cambridge Neuropsychological Test Automated Battery by using five different tests. Structural equation
modeling was applied to examine how objectively measured and self-reported MVPA and sedentary behavior were
associated with cognitive functions. High levels of objectively measured MVPA were associated with good performance in
the reaction time test. High levels of objectively measured sedentary time were associated with good performance in the
sustained attention test. Objectively measured MVPA and sedentary time were not associated with other measures of
cognitive functions. High amount of self-reported computer/video game play was associated with weaker performance in
working memory test, whereas high amount of computer use was associated with weaker performance in test measuring
shifting and flexibility of attention. Self-reported physical activity and total screen time were not associated with any
measures of cognitive functions. The results of the present study propose that physical activity may benefit attentional
processes. However, excessive video game play and computer use may have unfavorable influence on cognitive functions.
Citation: Syva¨oja HJ, Tammelin TH, Ahonen T, Kankaanpa¨a¨ A, Kantomaa MT (2014) The Associations of Objectively Measured Physical Activity and Sedentary
Time with Cognitive Functions in School-Aged Children. PLoS ONE 9(7): e103559. doi:10.1371/journal.pone.0103559
Editor: Yoko Hoshi, Tokyo Metropolitan Institute of Medical Science, Japan
Received January 15, 2014; Accepted July 2, 2014; Published July 25, 2014
Copyright: ß 2014 Syva¨oja et al. This is an open-access article distributed under the terms of the Creative Commons Attribution License, which permits
unrestricted use, distribution, and reproduction in any medium, provided the original author and source are credited.
Funding: This study was funded by Finnish Ministry of Education and Culture (101/627/2010, http://www.minedu.fi/OPM/?lang = en) and the Academy of Finland
(grant 273971). The funders had no role in study design, data collection and analysis, decision to publish, or preparation of the manuscript.
Competing Interests: The authors have declared that no competing interests exist.
* Email: [email protected]
improved their cognitive performance compared to control
children.
Regular physical activity has been especially linked to executive
functions [10]. Executive functions (also called executive control/
cognitive control) are the collection of higher-order cognitive
processes controlling goal-directed actions. Core executive functions are inhibitory control (including selective attention and the
inhibition of inappropriate or interfering responses), working
memory and mental flexibility [11]. School-based interventions
has shown that increased physical activity may improve children’s
inhibitory control [12], planning ability [13] and working memory
performance [14,15]. In addition, in recent studies, children with
high aerobic fitness have demonstrated better inhibitory control
[16–18] as well as better working memory performance [19] than
less-fit children.
However, evidence of the favorable effects of physical activity
on cognitive functions in healthy children and adolescents is still
somewhat inconsistent [20–22] and based on scarce research data
[10]. Significantly, physical fitness has often been used as a proxy
indicator of regular physical activity, without direct measurement
Introduction
In past decades, our lifestyles have become increasingly inactive
[1]; only one-third of children are sufficiently active according to
current physical activity recommendations [2]. Low levels of
physical activity have raised concerns over the effects of a
physically inactive lifestyle on children’s physical health and,
recently, also on children’s learning, especially on cognitive
prerequisites of learning [3].
Previous studies have shown that physical activity enhances
neurocognitive function and protects against neurodegenerative
diseases in elderly [4–6]. During past few years, physical activity
has been linked to enhanced cognition also in children. The metaanalytic study of Sibley & Etnier [7], showed the significant overall
positive association between physical activity and cognition in
children. In addition, in the study of Ruiz et al. [8] leisure time
physical activity was associated with better cognitive performance
in adolescents. Moreover, Ardoy et al. [9] reported that children
participating in high intensity physical education intervention
PLOS ONE | www.plosone.org
1
July 2014 | Volume 9 | Issue 7 | e103559
Physical Activity, Sedentary Time and Cognitive Functions
Table 1. Summary of the CANTAB tests used to measure different dimensions of cognitive function.
Dimension of cognitive function
Test
Abbreviation
Visual memory
1. Pattern Recognition Memory
PRM
Executive function
2. Spatial Span
SSP
3. Intra-Extra Dimensional Set Shift
IED
Attention
4. Reaction Time
RTI
5. Rapid Visual Information Processing
RVP
doi:10.1371/journal.pone.0103559.t001
participate in cognitive tests according to successful objective
measurement of physical activity. If a child’s measurement did not
succeed because of technical problems or the child did not
remember to wear the accelerometer, they were not invited to the
cognitive tests. Seven children (3 boys, 4 girls) were excluded from
analysis because, according to their parents’ survey, they had
physical disabilities, chronic diseases or severe learning disabilities.
The final sample size used in the analyses was 224.
of physical activity levels. This is particularly important, because in
childhood, habitual physical activity is rarely intensive and lengthy
enough to enhance aerobic fitness, and therefore, the relationship
between physical activity and fitness may not be meaningful [23].
Moreover, few studies have measured a broad range of cognitive
functions, highlighting the need for new studies to clarify the
benefits of physical activity on different dimensions of cognitive
functions.
Besides physical activity, sedentary behavior and excessive
media use may be associated with cognitive function in children
and youth. Extensive screen time has been linked to elevated risk
of attention and learning difficulties [24–27] and decreased verbal
memory performance [28]. However, in other recent studies,
screen time had no association with visuospatial cognition [29],
and even had a positive association with enhanced attentional skills
[30] and higher-developed language skills [31] in children and
adolescents. Diverging research results indicates that the association of sedentary behavior and cognition is more complicated than
previously believed and needs clarification.
To our knowledge, no previous studies have examined the
associations of objectively measured overall physical activity and
sedentary time on cognitive functions in children. However, as the
rates of childhood physical inactivity are increasing worldwide, it is
important to better understand the potential effects of lack of
physical activity and excessive sedentary time on cognitive
prerequisites of learning. The purpose of this study was to
examine how objectively measured and self-reported physical
activity are associated with cognitive functions in school-aged
children. In addition, this study aimed to determine how
objectively measured sedentary time and self-reported screen time
are associated with children’s cognitive functions. We hypothesized that physical activity is positively, and both sedentary time
and screen time are inversely, associated with cognitive functions.
Cognitive functions
Cognitive functions (Table 1) were assessed using the Neuropsychological Test Automated Battery (CANTAB) (a PaceBlade
Slimbook P110 tablet PC with a 12-inch touch-screen monitor and
Windows XP Professional operating system, CANTABeclipse
version 3). The test battery was run individually in a silent location
with the guidance of trained research assistants and in accordance
with the standard instructions. The execution required about 45
minutes for each individual.
Visual memory was assessed with a Pattern Recognition
Memory (PRM) test. PRM measures recognition memory of
visual patterns in a two-choice forced discrimination paradigm. In
this test, children had to remember the presented geometric
patterns and discriminate them from the novel patterns. The score
of the task is the number of correct responses.
Executive functions were assessed with Spatial Span (SSP) and
Intra-Extra Dimensional Set Shift (IED) tests. SSP measures the
length of the visuospatial working memory span based on the
Corsi blocks task [32]. In this test, specified number of white boxes
changed their color one by one and children had to reproduce the
same sequence by touching the boxes in the same order the boxes
changed their color. The score of the task is the maximum number
of items that the child can successfully remember in the correct
order. IED is based on the Wisconsin Card Sorting test [33] and
measures sifting and flexibility of attention. Specifically, it
measures the ability to maintain attention to different stimuli
within a relevant dimension, and shift attention to a previously
irrelevant dimension. There are nine stages with increasing
difficulty in this task. The children were instructed to choose one
of the two different dimensions: one is correct, and the other is
incorrect. According to immediate feedback, they were expected
to choose the correct pattern and learn the rule. The score in this
task is based on the number of stages completed.
The tests assessing attention were Reaction Time (RTI) and
Rapid Visual Information Processing (RVP). RTI measures
children’s reaction time and speed of response to a visual target.
In the unpredictable five-choice condition, a yellow spot appeared
randomly in one of the five circles on the screen. Children were
instructed to hold down the press pad button until they saw the
yellow spot and then touch the middle of the correct circle as
quickly as possible. The total score of this task is the sum of
reaction time (ms) and movement time (ms). RVP is similar to the
Method
Ethics Statement
The study was approved by the Ethics Committee of the
University of Jyva¨skyla¨, and followed the principles of the
Declaration of Helsinki and the Finnish legislation. Participation
in the study was voluntary, and all participants had the right to
drop out of the study at any time without a specific reason. Only
children with a fully completed consent form (Certificate of
Consent signed by a parent/guardian and the child) on the day of
the first measurements were included in the study.
Participants
During spring 2011, 475 fifth and sixth graders were invited to
participate in the study. 277 children (participation rate 58%) from
five schools in the Jyva¨skyla¨ school district in Central Finland
participated in the study. 230 of the 277 children were selected to
PLOS ONE | www.plosone.org
2
July 2014 | Volume 9 | Issue 7 | e103559
Physical Activity, Sedentary Time and Cognitive Functions
Continuous Performance Task measuring sustained attention. In
this test, children had to touch the press pad button every time
they discriminate the target sequence (digits 3, 5, and 7) from the
digits appearing in a pseudo-random order at the rate of 100 digits
per minute. The score of this task is RVP A’, which measures the
child’s skill at detecting target sequences (3, 5, 7) from a pseudorandom sequence of numbers (range 0.00 to 1.00; bad to good).
Internal reliability, assessed with Cronbach’s alpha reliability
coefficients, was 0.49 for the RVP A’, 0.65 for the PRM number of
correct responses, 0.66 for the RTI five-choice reaction time and
0.87 for the RTI five-choice movement time. For hampering tests
(SSP and IED), Cronbach’s alpha could not be determined.
Potential confounders
Objectively measured physical activity and sedentary
time
Statistical analysis
The parent or the child’s main caregiver filled in a
questionnaire including the mother and father’s education,
family income, marital status, and children’s learning difficulties
and need for remedial education. The highest level of parental
education, which was calculated from the mother’s and father’s
education, was categorized as tertiary level education (1) and
basic or upper secondary education (0). Marital status of the
main caregiver was categorized as married or cohabiting (1) and
divorced or single/widow (0). Children’s learning difficulties and
need for remedial education were categorizes as yes (1) and no
or don’t know (0).
The SPSS 19.0 for Windows statistical package (SPSS (2010)
IBM SPSS Statistics 19 Core System User’s Guide (SPSS Inc.,
Chicago, IL)) and the Mplus statistical package (Version 7;
Muthe`n & Muthe`n, 1998–2012) [38] were used for the statistical
analyses. Pearson’s correlation coefficients were calculated to
estimate preliminary associations between objectively and subjectively measured physical activity, sedentary behavior, cognitive
tests and potential confounders. Structural equation modeling was
applied to examine physical activity and sedentary time in
association with cognitive function. Structural equation modeling
was used because it enables to estimate the measurement errors
away and, therefore, increases the reliability of cognitive tests.
Single scores of every problem or level of the tests were applied
instead of the total score. Item parcels [39] were constructed to
combine the large number of these single scores for each latent
factor. These parcels were then used as indicators for latent
variables. Multiple logistic regression was used to examine physical
activity and sedentary time in association with cognitive function,
when the outcome was dichotomous. Full information maximum
likelihood (FIML) estimation with robust standard errors (MLR)
was used under the assumption of data missing at random.
Gender, the highest level of parental education and child’s need
for remedial education were chosen to represent different aspects
of potential confounders and were added to the main analysis. In
order to avoid multicollinearity, highly correlated objectively
measured MVPA and sedentary time were added to the model
using a Cholesky factoring of the predictors [40]. The Satorra–
Bentler scaled x2-test, the comparative fit index (CFI), the
Tucker–Lewis Index (TLI), the root mean square error of
approximation (RMSEA) and the standardized root-mean-square
residual (SRMR) were used to evaluate the goodness-of-fit of the
models. The model fits the data well if the p-value for the x2-test is
non-significant, CFI and TLI values are close to 0.95, the RMSEA
value is below 0.06 and the SRMR value is below 0.08 [41].
The ActiGraph GT1M/GT3X accelerometers with vertical
axel were used to measure children’s moderate to vigorous
physical activity (MVPA) and sedentary time. The accelerometer
was worn on the right hip with an elastic waistband during waking
hours for seven consecutive days. During bathing, swimming, and
other water activities, the monitor was requested to be removed
because it was not water-resistant. The ActiLife accelerometer
software (ActiLife version 5; http://support.theactigraph.com/dl/
ActiLife-software) was used to collect the data. Epoch length was
10 seconds and non-wearing time 30 minutes. Customized
software was used for data reduction and analysis. A cut-off value
of 2,296 counts per minute was used for MVPA [34], and 100
counts per minute for sedentary time. Children were included in
the analysis if they had valid data for at least 500 minutes per day
on two weekdays and on one weekend day. In order to compare
children, who had worn the accelerometers for different amounts
of time per day, objectively measured sedentary time was
expressed as percentage of daily registration time.
Self-reported physical activity and screen time
Physical activity and screen time were assessed with a selfreported questionnaire used earlier in the WHO Health Behavior
in School-aged Children (HBSC) study [35]. Self-reported MVPA
was measured with the following question: ‘‘Over the past 7 days,
on how many days were you physically active for a total of at least
60 minutes per day?’’ The response categories were as follows: 0
days, 1 day, 2 days, … 7 days. There was a short description about
what kind of physical activity should be taken into account when
answering the question: ‘‘In the next question, physical activity is
defined as any activity that increases your heart rate and makes
you get out of breath some of the time.’’ Examples included
running, walking quickly, rollerblading, biking, dancing, skateboarding, swimming, snowboarding, cross-country skiing, soccer,
basketball, and Finnish baseball. Test-retest agreement for selfreported MVPA has been very good (ICC = 0.82) [36,37]. Selfreported screen time was evaluated with the question: ‘‘About how
many hours a day do you usually a) watch television (including
videos), b) play computer or video games, or c) use a computer (for
purposes other than playing games, for example, emailing,
chatting, or surfing the Internet or doing homework) in your free
time?’’ The response options were as follows: not at all, about half
an hour per day, about an hour a day, about two hours per day, …
about five hours per day or more. Children responded separately
for both weekdays and weekends. Test-retest agreement for
watching television (ICC = 0.72–0.74) and for playing computer
or video games (ICC = 0.54–0.69) has been substantial, and fair to
moderate (ICC = 0.33–0.50) for using the computer [37]. Total
daily screen time averages were calculated by adding these three
questions, including weekdays and weekends, together.
PLOS ONE | www.plosone.org
Results
The mean age of the children was 12.2 years and 56% of the
children were girls (Table 2). 71% of children’s mothers and 56%
of children’s fathers had tertiary level education, and 76% of
parents were married or cohabiting. 5% of children had a
diagnosed learning difficulty and 13% of children needed remedial
education, according to their parent’s reports.
Based on objective physical activity measurements, children
had, on average, 58 minutes of MVPA per day, with no
statistically significant gender difference (Table 2). However, girls
spent more of their waking hours sedentary than boys (Table 2).
Based on self-reports, children reported at least 60 minutes of
MVPA a day for 5 days per week on average, with no significant
difference between boys and girls (Table 2). Boys reported more
3
July 2014 | Volume 9 | Issue 7 | e103559
PLOS ONE | www.plosone.org
623
0.97
RTI five-choice (ms)
RVP A’ (scale 0.00–1.00)b
4
1.0
Computer use (other than playing)
2.8
0.8
0.9
1.0
2.0
1.8
5.9
22.4
0.02
78
1.3
97
96
95
96
95
95
89
89
97
97
97
97
1.1
0.7
1.6
3.4
5.0
67.9
56.9
66
0.97
680
6.7
20.9
0.8
0.8
0.9
1.8
1.5
5.1
16.9
0.03
98
1.4
2.2
0.6
SD
127
127
127
127
127
127
118
127
127
127
127
127
127
N
1.0
1.0
1.6
3.7
5.0
67.2
58.4
67
0.97
655
6.6
20.9
12.2
Mean
All
0.8
0.9
0.9
1.9
1.6
5.5
19.5
0.02
94
1.3
2.5
0.6
SD
223
222
223
222
222
207
207
224
224
224
224
224
224
N
0.244
,0.001
0.982
0.015
0.923
0.013
0.231
0.891
0.946
,0.001
0.561
0.981
0.984
pa
Abbreviations: SD, standard deviation; MVPA, moderate to vigorous physical activity; PRM, Pattern Recognition Memory; SSP, Spatial Span; RTI, Reaction Time; RVP, Rapid Visual Information Processing; IED, Intra-Extra Dimensional
Set Shift.
a
P-values for the gender differences (T-test).
b
A’ indicates the result in RVP test. The scale is 0.00–1.00, whereas 0.00 indicates a poor result and 1.00 a good result.
c
MVPA measured with the ActiGraph accelerometer using a cut-off value of 2,296 counts per minute.
d
Sedentary time measured by the ActiGraph accelerometer using a cut-off value 100 counts per minute and expressed as percentage of daily monitoring time (%/day).
doi:10.1371/journal.pone.0103559.t002
1.4
4.0
Self-reported total screen time (h/day)
Computer/video games
5.0
Self-reported MVPA (d/week with $60 min MVPA)
1.6
66.1
Objectively measured sedentary time (%/day)d
TV
60.3
Objectively measured MVPA (min/day)c
Measurements of physical activity and sedentary behavior
67
6.6
IED no. of children who completed the test (%)
20.9
SSP span length (scale 0–9)
12.2
0.6
12.2
97
Mean
SD
Mean
N
Girls
Boys
PRM no. of correct
Measurements of cognitive function
Age (years)
Table 2. Sample characteristics according to gender and overall participants.
Physical Activity, Sedentary Time and Cognitive Functions
July 2014 | Volume 9 | Issue 7 | e103559
Physical Activity, Sedentary Time and Cognitive Functions
goodness-of-fit statistics of the model were good (x2 (10) = 9.45
p = 0.490,
CFI = 1.000,
TLI = 1.010,
RMSEA = 0.000,
SRMR = 0.028). Objectively measured sedentary time was positively associated with RVPA’, whereas objectively measured
MVPA was not associated with RVPA’ after adjusting for gender,
the highest level of parental education and child’s need for
remedial education (Table 3).
Self-reported playing of computer/video games was negatively
associated with SSP span length after adjusting for gender, the
highest level of parental education and child’s need for remedial
education (Table 3). The model was fully saturated. Self-reported
use of computer for other purposes than playing was negatively
associated with IED number of children who completed the test
(Table 4).
total screen time than girls, especially they spent more time playing
computer or videogames than girls (Table 2). In cognitive tests,
boys were faster than girls in the RTI test, but no significant
gender differences were observed in performance in the PRM,
SSP, RVP or IED tests.
For structural equation modeling, three subscales of RTI were
formed from 15 individual patterns of the RTI, and each subscale
divided by 10. Each subscale loaded on the hypothesized factor.
The model for the associations of objectively measured MVPA,
sedentary time (SED) and performance in the Reaction Time
(RTI) test is presented in Figure 1. The goodness-of-fit statistics of
the model were good (x2 (10) = 14.52 p = 0.763, CFI = 0.979,
TLI = 0.948, RMSEA = 0.045, SRMR = 0.018). Objectively measured MVPA was negatively associated with the RTI five-choice
test score (ms), whereas objectively measured sedentary time was
not associated with the RTI five-choice test score after adjusting
for gender, the highest level of parental education and child’s need
for remedial education (Table 3).
The RVP A’ (multiplied by 10) scores of the three blocks of the
test were used as indicator variables in the structural equation
modeling. Each block loaded on the hypothesized factor. The
model for the associations of objectively measured MVPA,
sedentary time (SED) and performance in the Rapid Visual
Information Processing (RVP) test is presented in Figure 2. The
Discussion
According to the results of this study, a high level of objectively
measured MVPA was associated with good performance in the
reaction time test (RTI), which measures children’s reaction time
and the speed of response to a visual target. In addition, a high
level of objectively measured sedentary time was associated with
good performance in the sustained attention test (RVP). However,
objectively measured physical activity or sedentary time were not
Figure 1. Objectively measured physical activity and performance in attentional reaction time test. This figure presents the estimation
results of the model for the associations of objectively measured moderate to vigorous physical activity (MVPA), sedentary time (SED) and the
Reaction Time (RTI) test. Standardized parameter estimates and standard errors are presented. For structural equation modeling, three subscales of
the RTI (RTI 1, RTI 2, RTI 3) (divided by 10) were formed from 15 patterns of RTI. The RTI test result is in milliseconds, where faster time indicates better
performance. Confounding factors, gender (female), the highest level of parental education (tertiary level) and child’s need for remedial education
(yes) were taken into account. Highly correlated objectively measured MVPA and sedentary time were added to the model as latent variables.
doi:10.1371/journal.pone.0103559.g001
PLOS ONE | www.plosone.org
5
July 2014 | Volume 9 | Issue 7 | e103559
Physical Activity, Sedentary Time and Cognitive Functions
Table 3. The associations between children’s cognitive processes and objectively measured physical activity, sedentary time and
self-reported screen time.
B
SE
95% CI
Pg
20.130
0.062
20.253, 20.008
0.037
20.041
0.074
20.186, 0.104
0.581
Reaction Time (RTI)a
Objectively measured MVPAb
Objectively measured sedentary time
c
Rapid Visual Information Processing (RVP)d
Objectively measured MVPA
20.040
0.093
20.223, 0.143
0.669
Objectively measured sedentary time
0.305
0.078
0.153, 0.457
0.000
Self-reported viewing of TVf
20.003
0.067
20.134, 0.129
0.970
Self-reported playing of computer/video gamef
20.179
0.079
20.333, 20.024
0.023
Self-reported use of computer (other than playing)f
0.094
0.068
20.040, 0.227
0.171
Spatial Span (SSP)e
Abbreviations: B, estimate; SE, standard error; CI, confidence interval; p, P-value; MVPA, moderate to vigorous physical activity.
a
RTI measures children’s reaction time and speed of response to a visual target in milliseconds, where faster time indicates better performance.
b
MVPA measured with the ActiGraph accelerometer using a cut-off value of 2,296 counts per minute and expressed as min/day.
c
Sedentary time measured by the ActiGraph accelerometer using a cut-off value of 100 counts per minute and expressed as percentage of daily monitoring time (%/
day).
d
RVP measures the sustained attention. The score of this task is RVP A’, where range is 0.00 to 1.00; bad to good.
e
SSP measures length of the visuospatial working memory span. The score of this task is the maximum number of items that the child can successfully reproduce.
f
Self-reported viewing of television, playing of computer/video games and use of computer (other than playing) are expresses as h/day.
g
P-values for parameter estimates.
Models have been adjusted with gender (female), the highest level of parental education (tertiary level) and child’s need for remedial education.
doi:10.1371/journal.pone.0103559.t003
levels of brain-derived neurotrophic factor (BDNF) [47,48] and
enhance cerebrovascular function [49]; all of which may mediate
the effects of physical activity on cognition. In addition, motor
function has shown to be closely connected to children’s cognitive
and academic skills and development [50,51], and may be an
important factor driving the effects of physical inactivity on
cognitive prerequisites of learning [52]. Furthermore, obesity has
been related to poorer academic [52] and cognitive performance
[53] and may, thereby, be one factor mediating the association of
physical activity and cognition. Moreover, participation in physical
activities is often a social phenomenon offering opportunities for
interaction with other children and adults, and this interaction
may also have a significant impact on children’s cognitive
development and learning. However, this has rarely been taken
into account in research [54]. Finally, physical activity may
facilitate cognitive function through the cognitive demands
inherent in the structure of goal-directed and engaging exercise
[55].
In the present study, neither objectively measured nor selfreported physical activity was associated with visual memory,
working memory, sifting and flexibility of attention or sustained
attention performance. These results are in line with studies
showing that physical activity is not necessary associated with all
domains of cognitive functions [13–15,20,21]. These diverging
results indicate the importance of future studies to define these
associations. Some of the cognitive tests used in the present study
were not able to differentiate healthy 12-year-old children.
Neuropsychological test batteries have originally been developed
to detect neurocognitive deficits, and due to that, the tests may be
too easy for healthy children. In the present study, particularly in
the tests of visual memory (PRM), sifting and flexibility of attention
(IED) and sustained attention (RVP), children, on average,
achieved very high results, which may partly explain the lack of
association between physical activity and cognitive test results.
Additionally, Stroth et al. [22] speculated that one reason behind
associated with any other assessments of cognitive functions. High
amount of self-reported playing of computer or video games was
associated with weaker performance in Spatial Span (SSP) test
measuring visuospatial working memory. Moreover, self-reported
use of computer for other purposes than playing was negatively
associated with performance in Intra-Extra Dimensional Set Shift
(IED) test, which measures sifting and flexibility of attention. Selfreported physical activity, total screen time or television viewing
had no association with any of the cognitive tests measuring visual
memory, executive functions or attention.
Physical activity and cognitive functions
In our study, a high level of objectively measured physical
activity was associated with better performance in attentional
reaction time test. Recent study of Spitzer and Hollmann [42]
supports our finding by reporting that implementation of physical
activity had positive effects on children’s attention. In addition,
recent intervention study of Chaddock-Heyman et al. [12] showed
that physical activity enhances children’s performance in inhibitory control task requiring selective attention and inhibition of
interfering responses (e.g. the Eriksen flanker task; [43]). Similarly,
according to Castelli et al. [44] engagement in vigorous physical
activity was positively associated with performance in inhibitory
control task. However, in the studies of Fisher et al. [14], Davis
et al. [13] and Puder et al. [20] physical activity intervention had
no effect on children’s attentional processes. Previous studies have
also reported that physically fit children outperform their less fit
peers inhibitory control task [17,18,45], but also no differences in
inhibitory control performance between physically fit and less fit
children [22,44].
Physical activity may enhance attentional processes and other
cognitive functions through different mechanisms. It has been
suggested that physical activity may improve brain volume in
regions supporting executive functions [19,46]; produce specific
changes in the activity patterns in the brains [12,13]; increase the
PLOS ONE | www.plosone.org
6
July 2014 | Volume 9 | Issue 7 | e103559
Physical Activity, Sedentary Time and Cognitive Functions
Figure 2. Objectively measured sedentary time and performance in sustained attention test. This figure presents the estimation results
of the model for the associations of objectively measured MVPA, sedentary time (SED) and the Rapid Visual Information Processing (RVP) test.
Standardized parameter estimates and standard errors are presented. The RVP (multiplied by 10) of the three blocks of the test (RVP 1, RVP 2, RVP 3)
were used as indicator variables in the structural equation modeling. The scale for the RVP test result (A’) is 0.00–1.00, where 0.00 indicates a poor
result and 1.00 a good result. Confounding factors, gender (female), the highest level of parental education (tertiary level) and child’s need for
remedial education (yes) were taken into account. Highly correlated objectively measured MVPA and sedentary time were added to the model as
latent variables.
doi:10.1371/journal.pone.0103559.g002
the result of aerobic fitness not being associated with children’s
performance in cognitive control tasks may be the ceiling effect.
In previous studies, aerobic fitness has often been used as a
proxy measure of regular physical activity, which might contribute
to diverging results: physical activity is behavior, which increases
energy expenditure and occurs within a cultural context, while
physical fitness is an adaptive state of the human body, affected by
heritable and environmental factors and physical activity. Espe-
cially in childhood, both the levels of physical activity and physical
fitness may vary independently of each other due to growth,
maturation and aging [23,56]. In addition, aerobic fitness
measures are often confounded by adiposity and obesity in
childhood [57], which are also potential factors attenuating
cognitive and academic performance [53]. Moreover, the definitions, patterns and measurements of cognitive functions and
physical activity have varied across different studies. Therefore, it
Table 4. The associations between children’s working memory capacity and self-reported screen time.
OR
95% CI
Self-reported viewing of TVb
0.868
0.623, 1.210
Self-reported playing of computer/video gameb
1.321
0.943, 1.850
0.639
0.421, 0.972
Intra-Extra Dimensional Set Shift (IED)
a
b
Self-reported use of computer (other than playing)
Abbreviations: OR, odds ratio; CI, confidence interval.
a
IED measures sifting and flexibility of attention and was categorized as 1 children who completed the test and 0 children who did not completed the test.
b
Self-reported viewing of television, playing of computer/video games and use of computer (other than playing) are expresses as h/day.
Model has been adjusted with gender (female), the highest level of parental education (tertiary level) and child’s need for remedial education.
doi:10.1371/journal.pone.0103559.t004
PLOS ONE | www.plosone.org
7
July 2014 | Volume 9 | Issue 7 | e103559
Physical Activity, Sedentary Time and Cognitive Functions
Most of the previous studies have used self-reported methods
assessing sedentary behavior. In the present study, objectively
measured sedentary time was positively associated with sustained
attention; children who spent more time being sedentary achieved
higher scores in sustained attention test. Objectively measured
sedentary time is a summary measure of all kinds of sedentary
behaviors, including various activities such as screen time, reading,
doing homework, interaction with friends, et cetera. During some
sedentary activities, such as reading and doing homework,
sustained attention and distraction exclusion are needed, which
may explain objectively measured sedentary time being associated
with good performance in sustained attention test.
In the present study, however, objectively measured sedentary
time was not associated with visual memory, working memory, setsifting/mental flexibility or attentional reaction time. In addition,
total screen time or television viewing were not associated with
cognition. Neither did Ferguson et al. [29] observe any association
between video game playing and visuospatial cognition. Moreover,
in two recent studies [31,68], television viewing was not associated
with cognitive and language skills after adjusting for the parent’s
role in monitoring and involvement in the child’s media use.
is difficult to directly compare and summarize the results of earlier
studies and determine the specific benefits regular physical activity
may have on cognitive functions.
Our finding that only objectively measured physical activity was
associated with attentional reaction time may reflect the difference
between objective and subjective measurements of physical
activity. Accelerometer-measured MVPA mainly illustrates cardiovascular activity with increased heart rate and respiratory
frequency, while self-reported physical activity may represent
different constructs and contexts. Self-reported physical activity
may include skill-specific types of physical activities, which require
balance and agility but hardly accumulate activity counts [58].
Our results may indicate that moderate to vigorous intensity
exercise that increases cardiovascular function has benefits on
attentional processes.
Sedentary behavior and cognitive functions
Previous studies have largely suggested that screen-based
sedentary behaviors have an unfavorable effect on children’s
cognition, especially on attention and learning difficulties [24–27].
The results of the present study supports the previous results by
showing a negative association between self-reported computer/
video game playing and visuospatial working memory as well as
negative association between self-reported use computer and
shifting and flexibility of attention. Drowak et al. [28], reported
also declines in verbal memory performance after computer game
exposure. However, some previous studies have reported that
screen-based sedentary behavior, especially videogames, is linked
to enhanced cognitive skills [59–61]. According to Dye and
Matthew [30], children who used to play video games had faster
reaction times in attention control tests (ANT) without a notable
loss in accuracy compared to non-players, indicating that action
game players made faster correct responses to targets and had
more resources to process distractions. Bittman et al. [31] reported
that computer use was associated with higher-developed language
skills.
In the present study, some children spent excessive amounts of
time in front of the screens on their free time: one fifth of the
children reported having screen time about 5 or more hours per
day. Excessive amounts of screen time may displace activities
involving learning opportunities and increase children’s impulsive
behavior, and eventually decrease academic skills [62].
Disadvantages, but also benefits of screen-based sedentary
behavior on cognitive functions may be explained by the content
of the screen time: not all screen time has an equal role in
benefitting or impairing children’s cognitive skills and learning
[63,64]. For example, Ennemoser & Schneider [65] reported that
educational program viewing was positively, but entertainment
program viewing negatively, correlated with reading speed and
comprehension in children. In the study of Feng et al. [66], action
game training in young adults improved performance and
attenuated the gender differences favoring males in spatial
attention test, while control subjects who played a non-action
game showed no improvements. According to Kuhn et al. [67],
video game playing may induce structural brain plasticity in the
areas important to spatial navigation, strategic planning, working
memory and motor performance. On the other hand, in the study
of Drowak et al. [28], interactive computer game play resulted
significant declines in verbal memory performance and slow wave
sleep, which is important for memory consolidation, whereas
viewing exciting films had no effects. Finally, it should be kept in
mind that computer-based cognitive assessments may require
similar cognitive skills as video and computer games, which would
favor children who play a lot of video and computer games.
PLOS ONE | www.plosone.org
Strength and limitations of the study
To our knowledge, this was the first study examining the
association of objectively measured overall physical activity and
sedentary time with cognitive functions in children. Conclusions
regarding causality of the observed associations cannot be drawn
due to the cross-sectional design. In addition, the content of
sedentary time and screen-based sedentary behavior was not
assessed, which limits the interpretation of the results concerning
sedentary behavior. Moreover, some cognitive tests used in the
present study may have been too easy for 12-year-old healthy
children, and did not optimally discriminate children’s performance. Furthermore, pubertal timing, motor skills and fitness were
not assessed, which limits the interpretation of the results.
Future direction
Studies with longitudinal designs or randomized controlled trials
are needed to clarify the effects of total physical activity and
sedentary behavior on cognitive prerequisites of learning. Future
studies should assess what kind of physical activity or sedentary
behavior affects specific kinds of cognition, as well as the
mechanisms behind these associations. In the future, social
interaction and context-related factors should be considered to
be taken into account. In addition, the cognitive tests should be
chosen so as to measure a wide range of cognitive performance.
Conclusion
In this study, objectively measured physical activity and
sedentary time were positively associated with attentional processes, but not with other domains of cognitive functions. Self-reported
computer/video game play was negatively associated with
visuospatial working memory, whereas computer use was negatively associated with shifting and flexibility of attention. Selfreported physical activity and total screen time were not associated
with any of the cognitive tests measuring visual memory, executive
functions or attention in children. The results of the present study
propose that physical activity may benefit attentional processes.
However, excessive video game play and computer use may have
unfavorable influence on cognitive functions.
8
July 2014 | Volume 9 | Issue 7 | e103559
Physical Activity, Sedentary Time and Cognitive Functions
MTK. Wrote the paper: HJS. Gave critical input on all versions of the
manuscript: HJS THT TA AK MTK. Approved the final version of the
manuscript: HJS THT TA AK MTK.
Author Contributions
Conceived and designed the experiments: HJS THT TA MTK. Performed
the experiments: HJS THT MTK. Analyzed the data: HJS THT AK
MTK. Contributed reagents/materials/analysis tools: HJS THT TA AK
References
23. Armstrong N, Tomkinson G, Ekelund U (2011) Aerobic fitness and its
relationship to sport, exercise training and habitual physical activity during
youth. Br J Sports Med 45: 849–858. doi: 10.1136/bjsports-2011-090200.
24. Johnson JG, Cohen P, Kasen S, Brook JS (2007) Extensive television viewing
and the development of attention and learning difficulties during adolescence.
Arch Pediatr Adolesc Med 161: 480–486.
25. Landhuis CE, Poulton R, Welch D, Hancox RJ (2007) Does childhood television
viewing lead to attention problems in adolescence? Results from a prospective
longitudinal study. Pediatrics 120: 532–537. doi: 10.1542/peds.2007-0978.
26. Swing EL, Gentile DA, Anderson CA, Walsh DA (2010) Television and video
game exposure and the development of attention problems. Pediatrics 126: 214–
221. doi: 10.1542/peds.2009-1508.
27. Weis R, Cerankosky BC (2010) Effects of video-game ownership on young boys’
academic and behavioral functioning: A randomized, controlled study. Psychol
Sci 21: 463–470. doi: 10.1177/0956797610362670.
28. Dworak M, Schierl T, Bruns T, Stru¨der HK (2007) Impact of singular excessive
computer game and television exposure on sleep patterns and memory
performance of school-aged children. Pediatrics 120: 978–985. doi: 10.1542/
peds.2007-0476.
29. Ferguson CJ, Garza A, Jerabeck J, Ramos R, Galindo M (2012) Not worth the
fuss after all? Cross-sectional and prospective data on violent video game
influences on aggression, visuospatial cognition and mathematics ability in a
sample of youth. J Youth Adolesc: 42: 109–122. doi: 10.1007/s10964-012-98036.
30. Dye MW, Green CS, Bavelier D (2009) Increasing speed of processing with
action video games. Curr Dir Psychol Sci 18: 321–326. doi: 10.1016/
j.neuropsychologia.2009.02.002.
31. Bittman M, Rutherford L, Brown J, Unsworth L (2011) Digital natives? New and
old media and children’s outcomes. AJE 55: 161–175.
32. Milner B (1971) Interhemispheric differences in the localization of psychological
processes in man. Br Med Bull 27: 272–277.
33. Mishkin M, Appenzeller T (1987) The anatomy of memory. Sci Am 256: 80–89.
doi: 10.1038/scientificamerican0687-80.
34. Evenson KR, Catellier DJ, Gill K, Ondrak KS, McMurray RG (2006)
Calibration of two objective measures of physical activity for children. J Sports
Sci 24: 1557–1565. doi: 10.1080/02640410802334196.
35. Currie C, Zanotti C, Morgan A, Currie D, De Looze M, et al. (2012) Social
determinants of health and well-being among young people. Health behaviour in
school-aged children (HBSC) study. International report from the 2009/2010
survey. Health policy for children and adolescents. Available: http://www.euro.
who.int/__data/assets/pdf_file/0003/163857/Social-determinants-of-healthand-well-being-among-young-people.pdf. Assessed 2014 May 6.
36. Booth M, Okely A, Chey T, Bauman A (2001) The reliability and validity of the
physical activity questions in the WHO health behaviour in schoolchildren
(HBSC) survey: A population study. Br J Sports Med 35: 263–267. doi:
10.1136/bjsm.35.4.263.
37. Liu Y, Wang M, Tynja¨la¨ J, Lv Y, Villberg J, et al. (2010) Test-retest reliability of
selected items of health behaviour in school-aged children (HBSC) survey
questionnaire in Beijing, china. BMC Med Res Methodol 10: 73. doi: 10.1186/
1471-2288-10-73.
38. Muthe´n L, Muthe´n B, editors (1998–2012) Mplus User’s guide. Seventh edition.
Los Angeles: CA: Muthe´n & Muthe´n.
39. Little TD, Cunningham WA, Shahar G, Widaman KF (2002) To parcel or not
to parcel: Exploring the question, weighing the merits. Struct Equ Modeling 9:
151–173. doi:10.1207/S15328007SEM0902_1.
40. de Jong PF (1999) Hierarchical regression analysis in structural equation
modeling. Struct Equ Modeling 6: 198–211. doi: 10.1080/10705519909540128.
41. Hu L, Bentler PM (1999) Cutoff criteria for fit indexes in covariance structure
analysis: Conventional criteria versus new alternatives. Struct Equ Modeling 6:
1–55. doi: 10.1080/10705519909540118.
42. Spitzer US, Hollmann W (2013) Experimental observations of the effects of
physical exercise on attention, academic and prosocial performance in school
settings. Trends Neurosci Educ 2: 1–6. doi: 10.1016/j.tine.2013.03.002.
43. Eriksen BA, Eriksen CW (1974) Effects of noise letters upon the identification of
a target letter in a nonsearch task. Percept Psychophys 16: 143–149.
44. Castelli D, Hillman C, Hirsch J, Hirsch A, Drollette E (2011) FIT kids: Time in
target heart zone and cognitive performance. Prev Med 52: S55–S59. doi:
10.1016/j.ypmed.2011.01.019.
45. Hillman CH, Buck SM, Themanson JR, Pontifex MB, Castelli DM (2009)
Aerobic fitness and cognitive development: Event-related brain potential and
task performance indices of executive control in preadolescent children. Dev
Psychol 45: 114–129. doi: 10.1037/a0014437.
46. Chaddock L, Erickson K, Prakash R, VanPatter M, Voss M, et al. (2010) Basal
ganglia volume is associated with aerobic fitness in preadolescent children. Dev
Neurosci 32: 249–256. doi: 10.1159/000316648.
1. Pate RR, Mitchell JA, Byun W, Dowda M (2011) Sedentary behaviour in youth.
Br J Sports Med 45: 906–913. doi: 10.1136/906 bjsports-2011-090192.
2. Ekelund U, Tomkinson G, Armstrong N (2011) What proportion of youth are
physically active? Measurement issues, levels and recent time trends. Br J Sports
Med 45: 859–865. doi: 10.1136/bjsports-2011-090190.
3. Hillman CH, Kamijo K, Scudder M (2011) A review of chronic and acute
physical activity participation on neuroelectric measures of brain health and
cognition during childhood. Prev Med 52: S21–S28. doi: 10.1016/
j.ypmed.2011.01.024.
4. Erickson KI, Voss MW, Prakash RS, Basak C, Szabo A, et al. (2011) Exercise
training increases size of hippocampus and improves memory. Proc Natl Acad
Sci U S A 108: 3017–3022. doi: 10.1073/pnas.1015950108.
5. Lautenschlager NT, Cox KL, Flicker L, Foster JK, van Bockxmeer FM, et al.
(2008) Effect of physical activity on cognitive function in older adults at risk for
alzheimer disease: A randomized trial. JAMA 300: 1027–1037. doi: 10.1001/
jama.300.9.1027.
6. Kramer AF, Erickson KI (2007) Effects of physical activity on cognition, wellbeing, and brain: Human interventions. Alzheimers Dement 3: S45–S51. doi:
10.1016/j.jalz.2007.01.008.
7. Sibley BA, Etnier JL (2003) The relationship between physical activity and
cognition in children: A meta-analysis. Pediatr Exerc Sci 15: 243–256.
8. Ruiz JR, Ortega FB, Castillo R, Martı´n-Matillas M, Kwak L, et al. (2010)
Physical activity, fitness, weight status, and cognitive performance in adolescents.
J Pediatr 157: 917–922. doi: 10.1016/j.jpeds.2010.06.026.
9. Ardoy D, Ferna´ndez-Rodrı´guez J, Jime´nez-Pavo´n D, Castillo R, Ruiz J, et al.
(2014) A physical education trial improves adolescents’ cognitive performance
and academic achievement: The EDUFIT study. Scand J Med Sci Sports 24:
e52–e61. doi: 10.1111/sms.12093.
10. Guiney H, Machado L (2013) Benefits of regular aerobic exercise for executive
functioning in healthy populations. Psychon Bull Rev 20: 73–86. doi: 10.3758/
s13423-012-0345-4.
11. Diamond A (2013) Executive functions. Annu Rev Psychol 64: 135–168. doi:
10.1146/annurev-psych-113011-143750.
12. Chaddock-Heyman L, Erickson KI, Voss MW, Knecht AM, Pontifex MB, et al.
(2013) The effects of physical activity on functional MRI activation associated
with cognitive control in children: A randomized controlled intervention. Front
Hum Neurosci 7. doi: 10.3389/fnhum.2013.00072.
13. Davis C, Tomporowski P, McDowell J, Austin B, Miller P, et al. (2011) Exercise
improves executive function and achievement and alters brain activation in
overweight children: A randomized, controlled trial. Health Psychol 30: 91–98.
doi: 10.1037/a0021766.
14. Fisher A, Boyle J, Paton J, Tomporowski P, Watson C, et al. (2011) Effects of a
physical education intervention on cognitive function in young children:
Randomized controlled pilot study. BMC Pediatr 11: 97. doi: 10.1186/14712431-1-97.
15. Kamijo K, Pontifex M, O’Leary K, Scudder M, Wu C, et al. (2011) The effects
of an afterschool physical activity program on working memory in preadolescent
children. Dev Sci: 1–13. doi: 10.1111/j.1467-7687.2011.01054.x.
16. Chaddock L, Hillman CH, Pontifex MB, Johnson CR, Raine LB, et al. (2012)
Childhood aerobic fitness predicts cognitive performance one year later. J Sports
Sci 30: 421–430. doi: 10.1080/02640414.2011.647706.
17. Chaddock L, Erickson KI, Prakash RS, Voss MW, VanPatter M, et al. (2012) A
functional MRI investigation of the association between childhood aerobic
fitness and neurocognitive control. Biol Psychol 89: 260–268. doi: 10.1016/
j.biopsycho.2011.10.017.
18. Pontifex MB, Raine LB, Johnson CR, Chaddock L, Voss MW, et al. (2011)
Cardiorespiratory fitness and the flexible modulation of cognitive control in
preadolescent children. J Cogn Neurosci 23: 1332–1345. doi: 10.1162/
jocn.2010.21528.
19. Chaddock L, Erickson K, Prakash R, Kim J, Voss M, et al. (2010) A
neuroimaging investigation of the association between aerobic fitness, hippocampal volume, and memory performance in preadolescent children. Brain Res
1358: 172–183. doi: 10.1016/j.brainres.2010.08.049.
20. Puder J, Marques-Vidal P, Schindler C, Zahner L, Niederer I, et al. (2011) Effect
of multidimensional lifestyle intervention on fitness and adiposity in predominantly migrant preschool children (ballabeina): Cluster randomised controlled
trial. BMJ 343: d6195. doi: 10.1136/bmj.d6195.
21. Reed JA, Maslow AL, Long S, Hughey M (2012) Examining the impact of 45
minutes of daily physical education on cognitive ability, fitness performance, and
body composition of African American youth. J Phys Act Health 10: 185–197.
22. Stroth S, Kubesch S, Dieterle K, Ruchsow M, Heim R, et al. (2009) Physical
fitness, but not acute exercise modulates event-related potential indices for
executive control in healthy adolescents. Brain Res 1269: 114–124. doi:10.1016/
j.brainres.2009.02.073.
PLOS ONE | www.plosone.org
9
July 2014 | Volume 9 | Issue 7 | e103559
Physical Activity, Sedentary Time and Cognitive Functions
57. Rowland T (2013) Oxygen uptake and endurance fitness in children, revisited.
Pediatr Exerc Sci 25: 508–514.
58. Syva¨oja HJ, Kantomaa MT, Ahonen T, Hakonen H, Kankaanpa¨a¨ A, et al.
(2013) Physical activity, sedentary behavior, and academic performance in
Finnish children. Med Sci Sports Exerc 45: 2098–2104. doi: 10.1249/
MSS.0b013e318296d7b8.
59. Boot WR, Blakely DP, Simons DJ (2011) Do action video games improve
perception and cognition? Frontiers in Psychology 2. doi: 10.3389/
fpsyg.2011.00226.
60. Spence I, Feng J (2010) Video games and spatial cognition. Rev Gen Psychol 14:
92–104. doi: 10.1037/a0019491.
61. Granic I, Lobel A, Engels RC (2013) The benefits of playing video games. Am
Psychol 69: 66–78. doi: 10.1037/a0034857.
62. Shin N (2004) Exploring pathways from television viewing to academic
achievement in school age children. J Genet Psychol 165: 367–381. doi:
10.3200/GNTP.165.4.367-382.
63. Kirkorian HL, Wartella EA, Anderson DR (2008) Media and young children’s
learning. Future Child 18: 39–61. doi: 10.1353/foc.0.0002.
64. Schmidt ME, Vandewater EA (2008) Media and attention, cognition, and school
achievement. Future Child18: 63–85. doi: 10.1353/foc.0.0004.
65. Ennemoser M, Schneider W (2007) Relations of television viewing and reading:
Findings from a 4-year longitudinal study. J Educ Psychol 99: 349–368. doi:
10.1037/0022-0663.99.2.349.
66. Feng J, Spence I, Pratt J (2007) Playing an action video game reduces gender
differences in spatial cognition. Psychol Sci 18: 850–855. doi: 10.1111/j.14679280.2007.01990.x.
67. Ku¨hn S, Gleich T, Lorenz R, Lindenberger U, Gallinat J (2013) Playing super
mario induces structural brain plasticity: Gray matter changes resulting from
training with a commercial video game. Mol Psychiatry 19: 265–271. doi:
10.1038/mp.2013.120.
68. Munasib A, Bhattacharya S (2010) Is the ‘Idiot’s Box’raising idiocy? Early and
middle childhood television watching and child cognitive outcome. Econ Educ
Rev 29: 873–883. doi: 10.1016/j.econedurev.2010.03.005.
47. Gomez-Pinilla F, Hillman C (2013) The influence of exercise on cognitive
abilities. Compr Physiol 3: 403–428. doi: 10.1002/cphy.c110063.
48. Hopkins M, Davis F, Vantieghem M, Whalen P, Bucci D (2012) Differential
effects of acute and regular physical exercise on cognition and affect.
Neuroscience 215: 59–68. doi: 10.1016/j.neuroscience.2012.04.056.
49. Brown AD, McMorris CA, Longman RS, Leigh R, Hill MD, et al. (2010) Effects
of cardiorespiratory fitness and cerebral blood flow on cognitive outcomes in
older women. Neurobiol Aging 31: 2047–2057. doi:10.1016/j.neurobiolaging.2008.11.002.
50. Haapala EA, Poikkeus A, Tompuri T, Kukkonen-Harjula K, Leppa¨nen P, et al.
(2013) Associations of motor and cardiovascular performance with academic
skills in children. Med Sci Sports Exerc: In press. doi: 10.1249/
MSS.0000000000000186.
51. Iverson JM (2010) Developing language in a developing body: The relationship
between motor development and language development*. J Child Lang 37: 229.
doi: 10.1017/S0305000909990432.
52. Kantomaa MT, Stamatakis E, Kankaanpa¨a¨ A, Kaakinen M, Rodriguez A, et al.
(2013) Physical activity and obesity mediate the association between childhood
motor function and adolescents’ academic achievement. PNAS 110: 1917–1922.
doi:10.1073/pnas.1214574110/2/DCSupplemental.
53. Burkhalter TM, Hillman CH (2011) A narrative review of physical activity,
nutrition, and obesity to cognition and scholastic performance across the human
lifespan. Adv Nutr 2: 201S–206S. doi: 10.3945/an.111.000331.
54. Hillman CH, Erickson KI, Kramer AF (2008) Be smart, exercise your heart:
Exercise effects on brain and cognition. Nat Rev Neurosci 9: 58–65.
doi:10.1038/nrn2298.
55. Best JR (2010) Effects of physical activity on children’s executive function:
Contributions of experimental research on aerobic exercise. Dev Rev 30: 331–
351. doi: 10.1016/j.dr.2010.08.001.
56. Malina RM (1996) Tracking of physical activity and physical fitness across the
lifespan. Res Q Exerc Sport 67: S48–S57. doi 10.1080/
02701367.1996.10608853.
PLOS ONE | www.plosone.org
10
July 2014 | Volume 9 | Issue 7 | e103559


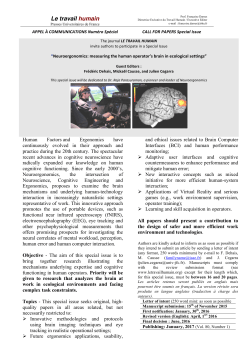
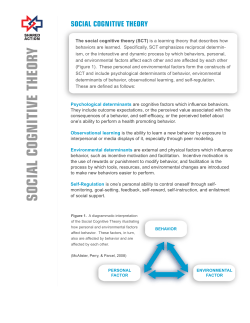
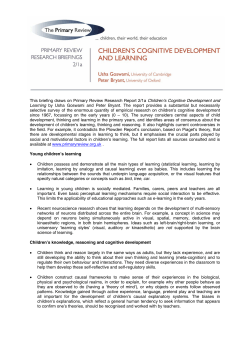


© Copyright 2026