
Gas diffusion and alveolar heart failure – Clinical research
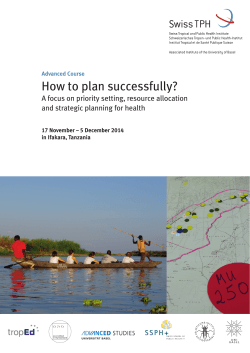
European Heart Journal (2006) 27, 2538–2543
doi:10.1093/eurheartj/ehl302
Clinical research
Heart failure/cardiomyopathy
Gas diffusion and alveolar–capillary unit in chronic
heart failure
Piergiuseppe Agostoni1,2*, Maurizio Bussotti1, Gaia Cattadori1, Eliana Margutti3, Mauro Contini1,
Manuela Muratori1, Giancarlo Marenzi1, and Cesare Fiorentini1
1
` di Milano, via Parea 4, 20138 Milan, Italy; 2 Division
Centro Cardiologico Monzino, IRCCS, Istituto di Cardiologia, Universita
of Respiratory and Critical Care Medicine, Department of Medicine, University of Washington, Seattle, WA 98185, USA; and
3
Istituto di Medicina Interna, University of Milan, Milan, Italy
Received 3 May 2006; revised 14 September 2006; accepted 21 September 2006; online publish-ahead-of-print 6 October 2006
KEYWORDS
Heart failure;
Exercise;
Lung;
Oedema;
Ventilation
Introduction
It has been known for several years that lung mechanics are
impaired in patients with chronic heart failure (CHF).1,2
Differently, attention has been focused on abnormalities of
gas diffusion across the alveolar–capillary membrane only
in the last 10 years, mainly because oxygen haemoglobin
desaturation is rare in CHF.3,4 Hence, the correlation
between lung diffusion abnormalities and CHF severity was
considered meaningless. In the last decade, it became
evident that lung diffusion abnormalities not only strongly
correlate with exercise performance and CHF severity,5–7
but, most importantly, with CHF prognosis.8 Furthermore,
it has been shown that improvement of lung diffusion correlates with the efficacy of some antifailure treatments.9–11
Lung diffusion is routinely measured as lung diffusion for
carbon monoxide (DLCO). DLCO depends upon alveolar–
capillary membrane diffusive capacity (DM) and the
amount of blood, the ‘so-called’ capillary volume (VC),
which flows through the ventilated alveolar–capillary units
over the period of time, a few seconds, needed by the
* Corresponding author. Tel: þ39 02 58002299; fax: þ39 02 58011039.
E-mail address: [email protected]
measuring technique to be carried out. Therefore, the
amount of capillary blood in the lung which, for any possible
reason, does not participate in gas exchange is excluded
from VC measurement. In CHF, DLCO can change transiently.
Indeed, an acute increase of pulmonary wedge pressure, as
it happens during heavy exercise or haemodynamic instabilization, is associated with a reduction in DLCO, due to a
lowering in DM, which is partially counterbalanced by an
increase in VC.12,13 DLCO can also transiently increase, as
happens during mild exercise, through an increase in VC.14
Data on DLCO subcomponents at rest in CHF patients with
stable clinical condition are less clear. Indeed, a first
report on a very limited number of subjects showed a VC
increase in patients with severe heart failure;7 however,
this finding was not confirmed in other studies.8,14,15
Furthermore, several lines of evidence suggest it is unlikely
that in CHF patients with optimized treatment VC is
increased: (i) DLCO abnormalities persist after heart transplant,16,17 (ii) ultrafiltration reduces lung fluid content but
does not affect DLCO or its subcomponents DM and VC,17
and (iii) at Computer Tomography, lung fluids are not
increased in stable maximally treated CHF patients.18 On
the contrary, there are a few reasons to hypothesize that
VC is reduced in CHF; among these, the increased
& The European Society of Cardiology 2006. All rights reserved. For Permissions, please e-mail: [email protected]
Downloaded from by guest on October 21, 2014
Aims Alveolar gas diffusion (DLCO) is impaired in chronic heart failure (CHF). Diffusion depends on
membrane diffusion (DM) and the amount of blood participating in gas exchange (VC). How DM, VC,
and the alveolar–capillary unit behave in relationship to CHF severity is unknown.
Methods and results We measured pulmonary function, including DLCO, DM, VC, and alveolar volume
(VA), in 191 CHF patients in NYHA class I–III. CHF patients were grouped accordingly to peak exercise
oxygen uptake (pVO2): group ,12 mL/min/kg (n ¼ 24), group 12–16 (n ¼ 76), group 16–20 (n ¼ 64),
and group .20 (n ¼ 27). DLCO, DM, VC, and VA were lowest in severe CHF and were linearly related
˙ O2 (DLCO, r ¼ 0.577, P , 0.001; DM, r ¼ 0.490, P , 0.001; VC, r ¼ 0.216, P , 0.01; VA,
to pV
r ¼ 0.565, P , 0.01). DM/VC ratio, an index of the alveolar–capillary unit efficiency, was higher
in group ,12 (0.49 + 0.39 mL/min/mmHg/mL) and .20 (0.46 + 0.29), compared with 12–16
(0.34 + 0.19) and 16–20 (0.35 + 0.17).
Conclusion DLCO progressively worsens as CHF severity increases due to reduction in lung tissue
participating to gas exchange (low VC and VA). In severe CHF, the few working alveolar–capillary
units are the most efficient as shown by the high DM/VC. This is useful for maintaining gas exchange
efficiency in severe CHF.
Alveolar—capillary function in heart failure
ventilation/perfusion mismatch which leads to ventilated
area with low or no flow and to an increase of intrapulmonary shunt.19,20
The present study was carried out to define DLCO, DM, and VC
behaviours and the efficiency of the alveolar–capillary units in a
large cohort of CHF patients in stable clinical conditions and
different CHF severity, as defined by exercise capacity.
Methods
Study population
All patients underwent echocardiographic and Doppler
evaluations. The presence of a restrictive pattern was evaluated
by analysing, whenever possible, mitral E/A relationship, E wave
slope, and pulmonary venous flow.
Statistical analysis
Data reported are mean + SD. Peak exercise and anaerobic
˙ O2 measurements are mean over 20 s. Differences
threshold V
among CHF groups were evaluated by multivariable analysis
(ANCOVA adjusting for gender and age). Post hoc comparison
between single pairs of groups were performed by t-test and resulting probabilities corrected for multiple testing by the Tukey–Cramer
method. Correlations were analysed by best fit analysis, which was a
linear regression analysis except were specifically stated. A
P-value , 0.05 was considered as statistically significant. A sample
size of 190 patients was calculated in order to assess as statistically
˙O2 and VC,
significant a correlation coefficient of 0.2 between peak V
with an alpha value of 0.05 and a power of 80%.
Results
All subjects performed the entire heart failure evaluation
˙O2 ,12 mL/min/
process. Twenty-four subjects had a peak V
˙O2 between 12 and 16 mL/
kg (group , 12), 76 had peak V
˙O2 between 16 and
min/kg (group 12–16), 64 had peak V
˙O2 . 20 mL/
20 mL/min/kg (group 16–20), and 27 had peak V
min/kg (group .20).21 Patients’ characteristics are reported
in Table 1. Aetiology of CHF was dilated cardiomyopathy due
to coronary artery disease (CAD) or idiopathic cardiomyopathy
(ICM): group , 12, 12/12 CAD/ICM; group 12–16, 30/46; group
16–2, 17/47; group .20, 7/20, respectively. CPET results
support the finding of a progressively greater severity of the
˙O2 at anaerodisease from group .20 to group ,12. Indeed, V
˙O2/work slope were lower when the
bic threshold and the V
˙E/V
˙CO2 slope was the highest
CHF severity was greater. The V
in most compromised patients.
Pulmonary function test results are reported in Table 1.
Patients with severe CHF had a moderate restrictive lung
disease. In the entire CHF population, FEV1 (r ¼ 0.632,
P , 0.0001) and FVC (r ¼ 0.632, P , 0.001) were correlated
˙ O2 (Table 1). DLCO, DM, VA, and VC were prowith peak V
gressively decreased as the exercise capacity reduced
(Figure 1). DLCO, as % of predicted, was 64.4 + 17.8% in
group ,12, 75.2 + 21.7*† in group 12–16, 80.3 + 14.7*
in group 16–20, and 90.0 + 21.2* in group .20 (*P , 0.01
vs. group ,12, †P , 0.05 vs. group .20). VC was lowest in
group ,12 (82.1 + 49.8 mL vs. 105 + 41 considering
together all other CHF patients, P , 0.02). Absolute values
for DM and VC were 27.9 + 12.1 mL/mmHg/min and
82.1 + 49.8 mL in group ,12, 29.1 + 9.8 mL/mmHg/
min and 97.6 + 43.5 mL in group 12–16, 31.1 + 9.5 mL/
mmHg/min and 103.5 + 37.3 mL in group 16–20,
42.2 + 11.4*†‡ mL/mmHg/min and 111.0 + 42.1 mL in
group .20, respectively (*P , 0.01 vs. , 12, †P , 0.01 vs.
12–16, ‡P , 0.01 vs. 16–20). DM/VC ratio, as shown in
Figure 2 (upper panel), was higher in group ,12
(0.49 + 0.39 mL/min/mmHg/mL) compared with group
12–16 (0.34 + 0.19*) and group 16–20 (0.35 + 0.17*)
(*P , 0.05 vs. 12). DM/VC ratio in group .20 was
0.46 + 0.29. DLCO, DM, and VA were linearly related to
˙ O2 (Figure 3). VC was linearly related to peak V
˙ O2
peak V
with a weak relationship (Figure 3), whereas DM/VC was
˙ O2, but the best fit analysis
not linearly related to peak V
Downloaded from by guest on October 21, 2014
A total of 191 CHF subjects in stable clinical conditions fulfilled the
inclusion criteria and participated in the study. Patients belong to a
cohort of consecutive CHF subjects regularly followed at our heart
failure unit, who were evaluated during a routine heart failure
follow-up. According to the New York Heart Association (NYHA) classification 11, 91, and 89 patients were in class I, II, and III, respectively.
Treatment was constant for at least 2 months, and included diuretics
in 161 cases, angiotensin-converting-enzyme inhibitors in 160 cases,
angiotensin receptors blockers in 26 cases, beta-blocker in 74
cases, digitalis in 83 cases, amiodarone in 71 cases, antialdosteronic
agents in 44 cases, antiplatelet therapy in 45 cases, anticoagulant
therapy in 44 cases, and nitrates in 30 cases. At rest, 146 patients
were in sinus rhythm, and 45 in atrial fibrillation.
Study inclusion criterion was CHF in NYHA class I–III, stable
clinical conditions for at least 2 months, capability of performing
standard pulmonary function and DLCO manoeuvres, maximal or
near-maximal cardiopulmonary exercise test (CPET), previous
experience with CPET in our laboratory, absence of history and/or
clinical documentation of pulmonary embolism, primary valvular
heart disease, pericardial disease, severe obstructive lung disease,
significant peripheral vascular disease, exercise-induced angina,
ST-segment changes, or severe arrhythmias. The study was
approved by the local Ethics Committee. All patients who fulfilled
the study inclusion criteria were asked to participate in the study;
all accepted and provided written informed consent to the study.
CHF severity was evaluated by means of CPET. Patients were
grouped according to the exercise capacity as inferred by peak
˙ O2.21 CPETs were done on a cyclo-ergometer (Ergo 800S Sensor
V
Medics, Yorba Linda, CA, USA), using a personalized ramp protocol
aimed at achieving peak exercise in 10 min with breath-by-breath
expiratory gases and ventilation analysis (V-Max, Sensor Medics,
Yorba Linda, CA, USA). The test was self-ended by the patients;
however, all patients declared that they had performed what they
felt to be maximal effort. Anaerobic threshold was measured with
˙CO2 vs. V
˙O22
the V-slope analysis from the plot of V
2 on equal
scales. The anaerobic threshold value was confirmed by ventilatory
˙ O2/work
equivalents and end-tidal pressures of CO2 and O2. The V
rate relationship was evaluated throughout the entire exercise;
˙E)/V
˙ CO2 slope was calculated as the slope of the
the ventilation (V
˙E and V
˙CO2 from 1 min after the beginlinear relationship between V
ning of loaded exercise to the end of the isocapnic buffering period.
Two experts read each test independently.
Standard pulmonary tests were performed according to the
American Thoracic Society criteria.23 Forced expiratory volume in
1 s (FEV1) and forced vital capacity (FVC) normal predicted values
were those reported by Quajer et al.24
DLCO was measured in the standard sitting position with the
single breath constant expiratory flow technique (Sensor Medics
2200, Yorba Linda, CA, USA).25 Diffusion subcomponents, VC and
DM, were also measured by applying the Roughton and Forster
method.26 For this purpose, subjects inhaled gas mixtures containing 0.3% CH4, 0.3% CO, with three different oxygen fractions equal
to 20, 40 and 60%, respectively, and balanced with nitrogen.
Alveolar volume was measured by CH4 decay slope during single
breath constant expiratory flow measurements.27
2539
2540
P. Agostoni et al.
Table 1 Clinical and functional characteristics of the study population
Group
,12 (n ¼ 24)
12–16 (n ¼ 76)
16–20 (n ¼ 64)
.20 (n ¼ 27)
Correlation vs. peak VO2 (mL/min)
Age (years)
Sex (M/F)
Smoke (C/F/N)
NYHA
LVEF (%)
End-diastolic volume (mL)
Restrictive pattern
SR/AF
FEV1 (mL/min)
FEV1 as % of predicted (%)
FVC (mL/min)
FVC as % of predicted (%)
FEV1/VC
Peak VO2 (mL/min)
Peak VO2 as % of predicted
VO2 AT (mL/min)
VE/VCO2
VO2/Work (mL/min/watt)
64 + 8
18/6
6/7/11
2.7 + 0.5
28.3 + 8.4
215 + 77
10/16
15/9
1.9 + 0.2
75 + 13
2.3 + 0.4
67 + 16
90 + 15
726 + 145
39 + 12
553 + 120
49 + 11
8.0 + 2.6
62 + 7
57/19
10/35/31
2.7 + 0.5
31.8 + 10.1}
191 + 65
23/53
63/13
2.4 + 0.6}
81 + 18
3.0 + 0.7*
75 + 14*
84 + 17
981 + 198*
51 + 10*
694 + 183*
40 + 10*
8.7 + 1.5}
59 + 9
52/12
10/32/22
2.3 + 0.7*†
34.5 + 8.5*
197 + 67
18/49
45/19
2.7 + 0.6*
90 + 15*
3.3 + 0.8*
85 + 16*
89 + 19
1332 + 219*‡
65 + 9*‡
836 + 192*
32 + 6*‡
9.1 + 1.0*
56 + 10
26/1
7/8/12
2.0 + 0.5*‡
35.4 + 9.1}
213 + 80
7/18
23/4
3.0 + 0.4*‡
98 + 16*‡
3.7 + 0.4*
87 + 18*
88 + 15
1678 + 207*‡k
76 + 16*‡k
998 + 191*‡k
30 + 5*‡
10.0 + 1.2*‡§
R ¼ 20.398, P , 0.001
R ¼ 20.333, P , 0.001
R ¼ 0.245, P , 0.01
R ¼ 0.173, P , 0.05
R ¼ 0.632, P , 0.001
R ¼ 0.251, P , 0.01
R ¼ 0.632, P , 0.001
R ¼ 0.242, P , 0.01
R ¼ 20.032, P ¼ NS
R ¼ 20.536, P , 0.001
R ¼ 0.309, P , 0.001
C, current smoker; F, former smoker; n, non-smoker; LVEF, left ventricular ejection fraction; SR, sinus rhythm; AF, atrial fibrillation; AT, anaerobic
threshold; VE, ventilation; VCO2, carbon dioxide production. *P , 0.01 vs. group ,12; †P , 0.05 vs. group 12–16, ‡P , 0.01 vs. group 12–16, }P , 0.05
vs. group ,12; §P , 0.05 vs. group 16–20, kP , 0.01 vs. group 16–20. A reliable evaluation of the restrictive pattern was possible in 136/191 patients.
Downloaded from by guest on October 21, 2014
˙ O2 ,12 mL/min/kg, peak V
˙ O2 12–16 mL/min/kg, peak V
˙ O2 16–20 mL/min/kg, peak
Figure 1 DLCO, DM, VC, and VA in the four groups of CHF patients: peak V
˙O2 . 20 mL/min/kg. Patients characteristics are reported in Table 1. *P , 0.01 vs. ,12, †P , 0.05 vs. 12–16, ‡P , 0.01 vs. 12–16, }P , 0.01 vs. 16–20, §P , 0.02
V
vs. , 12,kP , 0.02 vs. groups 12–16, 16–20 and .20 combined.
Alveolar—capillary function in heart failure
showed a polynomial function as the best (Figure 2, lower
panel). In no case were differences age- and/or sex-related.
Discussion
The most important new information coming from this study
is that patients with stable CHF have a decreased VC, in
addition to a decreased DLCO and DM. Moreover, as
inferrable from the DM/VC ratio, the efficiency of the
working alveolar–capillary units seems highest in the most
and least compromised CHF patients, and lowest in patients
with intermediate CHF severity.
As in previous series of CHF patients,2,7,21 we have
observed impairment of lung mechanics and gas diffusion.
Mechanics impairment was due to a restrictive lung
disease. This is shown by a preserved FEV1/FVC ratio with
progressively lower FEV1, FVC, and VA as CHF severity
increases. The severity of mechanical impairment correlates
with exercise capacity.
The greater the severity of CHF, the lower are DLCO and
˙ O2 is
DM. The correlation between DLCO or DM, and peak V
well known.6,14 Our data confirm these findings but show,
for the first time, that VC decreases in parallel with DLCO
and DM reduction. This finding is opposite of that reported
by Puri et al.7 in a small number of NYHA class III patients.
Two reasons may account for this difference. First, our
patients were in stable clinical condition; in fact, the
present clinical assessment was done as part of a routine
CHF patients follow-up, and no patient of our series was in
acute decompensation or had been decompensated
recently. Indeed, it is well known that acute haemodynamic
decompensation, as simple as the one generated by mild
exercise, is associated to an increase in pulmonary wedge
pressure and VC.12,13,28 Secondly, CHF severity was classified
in the Puri et al.7 report by means of the NYHA classification. This classification is based on the personal feeling
of the patients so that CHF severity was not objectively
assessed. Notably, several subjects in our series were in
NYHA class III, but were, from the point of view of exercise
capacity, in group 12–16 or 16–20, showing only a moderate
or moderate-to-severe exercise capacity reduction
(Table 1). Several reasons may account for the reduced VC
we observed in patients with severe CHF. First, an increase
in arteriolar vascular resistance and in ventilation/perfusion
mismatch is known in CHF29 with extended lung areas poorly
perfused but ventilated or poorly ventilated but perfused.
Secondly, local thrombosis of the capillary vascular bed
and pulmonary micro-embolisms are likely in patients with
severe CHF.30 Third, cardiac output is reduced so that the
volume of blood which flows through the functioning
alveolar–capillary unit is low. Finally, it is also possible
that, in some patients, a reduced circulatory volume, due
to chronic high-dose diuretic therapy, causes a low VC.
The DM/VC relationship deserves some discussion. It
should be acknowledged, at first, that although group ,12
and group .20 have a statistically higher value of DM/VC
ratio if compared with group 12–16 and group 16–20, a relevant overlap of the data exists (Figure 2). So interpretation
of data of a single subject should be done carefully. DM/VC is
an index of alveolar–capillary membrane function, and its
acute changes are related to alveolar oedema formation/
resolution.12 Our data show that, in severe CHF in stable
clinical condition, there are few alveolar–capillary units at
work (low VA and VC), but those working are the most
efficient. The schema reported in Figure 4 helps to describe
this concept. In patients with less advanced CHF (group
.20), there are several efficient alveolar–capillary units
at work and, in the single alveolus lung model (right side
of the schema), the lung is big with almost no diffusion
limitation. As the disease progresses, in group 12–16 and
group 16–20, the number of alveolar–capillary units at
work reduces, and the average diffusion worsens (reduced
dimensions of the single alveolus model with thickening of
the alveolar–capillary membrane). Finally, in patients with
severe CHF (group ,12), very few alveolar–capillary
membrane units are at work (reached by both ventilation
and perfusion), but those at work are the most efficient
(higher DM/VC). Several reasons may explain why this
happens. The geometrical shape of the alveoli is characterized by corners with different degrees.31,32 Indeed, when,
during ventilation, a force on the alveolar wall is applied,
the presence of the surfactant layer generates a pressure
gradient between the flat alveolar surface and the alveolar
corners.31 This pressure gradient allows fluid to flow from
the surface of the alveoli to their corners, preserving the
gas exchange function.31,33 For a given force applied, this
pressure gradient is the biggest, the smaller the degree of
the corners, making the alveoli with the smallest corners
those freer of fluids along the gas exchange surface.
Indeed, if the pressure at the alveolar corner is reduced,
Downloaded from by guest on October 21, 2014
Figure 2 DM/VC in the four groups of CHF patients (upper panel) and as a
˙ O2 (lower panel). *P , 0.05 vs. ,12.
function of peak V
2541
2542
P. Agostoni et al.
˙O2) relationship in the entire study population.
DLCO, DM, VC, and VA vs. peak oxygen consumption (pV
Figure 4 Schema of the alveolar–capillary function in patients with CHF of
different severity. From top to bottom, the model is for group .12, 16–20,
16–12, and ,12, respectively. Alveolar–capillary units with impaired gas diffusion are marked with the thick line. As the severity of CHF increases, the
number of alveolar–capillary unit at work reduces (left). Single alveolar
model (right). The alveolar volume progressively reduces and in group ,12
also the capillary volume is smaller compared with group 12–16, 16–20,
˙O2 s , 12 mL/min/kg, group 12–16: peak V
˙ O2
and .20. Group ,12: peak V
˙ O2 between 16 and
between 12 and 16 mL/min/kg, group 16–20: peak V
˙ O2 .20 mL/min/kg.
20 mL/min/kg, group .20: peak V
the pressure in the interstitial space between corners of a
few alveoli is also further reduced, allowing accumulation
of fluids in the interstitial space. Differently, if the force
allowing fluid movement from the gas exchange surface to
the alveoli corners is low, as happens in the presence of
alveoli with flat or large corners, fluids is accumulated in
the corners, at the beginning, but does not move fast
enough to the interstitial space, transforming the alveoli
from a complex geometrical structure with several
corners, to a more spherical one, which is more likely to
be fluid-filled and, therefore, totally inefficient.31–33
Ventilation dishomogeneity with air trapping might also
account for a portion of lung which is protected from
liquid filling as it happens with mechanical ventilation.34,35
Indeed, air trapping, which might happen at rest in patients
with severe CHF,29 might further increase the geometrical
alveolar interdependence described earlier. Finally, it
should be noticed that data at pathology are in line with
this interpretation, showing that alveolar oedema is
patchy with a progressive increase in the number of
alveoli filled with fluid and with few alveoli preserved
keeping a normal shape.31
In conclusion, the present study shows that DLCO, DM, VC,
and VA are reduced in patients with severe CHF in stable
clinical condition. The reduction of VC is a novel finding
and is likely related to pulmonary vascular resistance
increase, local thrombosis, microembolism, increased
intrapulmonary shunt, low blood flow, and, possibly, low
intravascular blood volume. The DM/VC behaviour, an
index of the efficiency of the alveolar–capillary units,
suggests that in severe CHF, the few alveolar–capillary
units at work are those that are most efficient. This is
likely the last safety mechanism to protect gas exchange
Downloaded from by guest on October 21, 2014
Figure 3
Alveolar—capillary function in heart failure
in CHF, similar to what happens with the hyperefficient
nephron unit in the failing kidney.36,37
Acknowledgements
The authors acknowledge the precious help of Prof Richard
K. Albert, (Denver Health Medical Center, University of Colorado
Health Sciences Center, Denver, CO 80204-4507, USA) who discussed
the data and revised the manuscript carefully, and the statistical
analysis performed by Dr Fabrizio Veglia (Centro Cardiologico
Monzino, IRCCS).
Conflict of interest: none declared.
References
15. Agostoni PG, Guazzi M, Bussotti M, Grazi M, Palermo P, Marenzi G. Lack of
improvement of lung diffusing capacity following fluid withdrawal by
ultrafiltration in chronic heart failure. J Am Coll Cardiol
2000;36:1600–1604.
16. Mettauer B, Lampert E, Charloux A, Zhao QM, Epailly E, Oswald M,
Frans A, Piquard F, Lonsdorfer J. Lung membrane diffusing capacity,
heart failure, and heart transplantation. Am J Cardiol 1999;83:62–67.
17. Ravenscraft SA, Gross CR, Kubo SH, Olivari MT, Shumway SJ,
Bolman RM III, Hertz MI. Pulmonary function after successful heart transplantation. One year follow-up. Chest 1993;103:54–58.
18. O’Dochartaigh CS, Kelly B, Riley MS, Nicholls DP. Lung water content is
not increased in chronic cardiac failure. Heart 2005;91:1473–1474.
19. Agostoni P, Cattadori G, Apostolo A, Contini M, Palermo P, Marenzi GC,
Wasserman K. Non-invasive measurement of cardiac output during exercise by inert gas rebreathing technique: a new tool for heart failure
evaluation. J Am Coll Cardiol 2005;46:1779–1781.
20. Agostoni PG, Doria E, Bortone F, Antona C, Moruzzi P. Systemic to pulmonary bronchial blood flow in heart failure. Chest 1995;107:1247–1252.
21. Wasserman K, Zhang YY, Gitt A, Belardinelli R, Koike A, Lubarsky L,
Agostoni PG. Lung function and exercise gas exchange in chronic heart
failure. Circulation 1997;96:2221–2227.
22. Beaver WL, Wasserman K, Whipp BJ. Bicarbonate buffering of lactic acid
generated during exercise. J Appl Physiol 1986;60:472–478.
23. American Thoracic Society. Lung function testing: selection of reference
values and interpretative strategies. Am Rev Respir Dis 1991;
144:1202–1218.
24. Quanjer PH, Tammeling GJ, Cotes JE, Pedersen OF, Peslin R, Yernault JC.
Standardized lung function testing. Eur Respir J 1993;6:1–99.
25. American Thoracic Society. Single-breath carbon monoxide diffusing
capacity: recommendation for a standard technique; 1995 update.
Am J Respir Crit Care Med 1995;152:2185–2198.
26. Roughton FJ, Forster RE. Relative importance of diffusion and chemical
reaction rates in determining rate of exchange of gases in the human
lung, with special reference to true diffusing capacity of pulmonary
membrane and volume of blood in the lung capillaries. J Appl Physiol
1957;11:290–302.
27. Ramage JE, Coleman RE, MacIntyre NR. Rest and exercise output and diffusive capacity assessed by a single slow exhalation of methane,
acetylene, and carbon monoxide. Chest 1987;92:44–50.
28. McHugh TJ, Forrester JS, Adler L, Zion D, Swan HJC. Pulmonary vascular
congestion in acute myocardial infarction: hemodynamic and radiologic
correlations. Ann Intern Med 1972;76:29–33.
29. Chua TP, Coats AJS. The lungs in chronic heart failure. Eur Heart J
1995;16:882–887.
30. Gehlbach BK, Geppert E. The pulmonary manifestation of left heart
failure. Chest 2004;125:669–682.
31. Albert RK. Sites of leakage in pulmonary edema. In: Said SI, ed. The
pulmonary circulation and acute lung injury. Mount Kisco NY: Futura
Publishing Co.; 1985. p189–207.
32. Staub NC, Nagano H, Pearce ML. Pulmonary edema in dogs, especially the
sequence of fluid accumulation in lungs. J Appl Physiol 1967;22:227–240.
33. Gee MH, Williams DO. Effect of lung inflation on perivascular cuff fluid
volume in isolated dog lung lobes. Microvasc Res 1979;17:192–201.
34. Pepe PE, Marini JJ. Occult positive end-expiratory pressure in mechanically ventilated patients with airflow obstruction: the auto-PEEP
effect. Am Rev Respir Dis 1982;126:166–170.
35. Wada O, Asanoi H, Miyagi K, Ishizaka S, Kameyama T, Seto H, Sasayama S.
Importance of abnormal lung perfusion in excessive exercise ventilation
in chronic heart failure. Am Heart J 1993;125:790–798.
36. Brenner BM, Meyer TW, Hostetter TH. Dietary protein intake and the progressive nature of kidney disease: the role of hemodynamically mediated
glomerular injury in the pathogenesis of progressive glomerular sclerosis
in aging, renal ablation, and intrinsic renal disease. N Engl J Med
1982;307:652–659.
37. Schieppati A, Remuzzi G. The future of renoprotection: frustration and
promises. Kidney Int 2003;64:1947–1955.
Downloaded from by guest on October 21, 2014
1. Snashall PD, Chung KF. Airway obstruction and bronchial hyperresponsiveness in left ventricular failure and mitral stenosis. Am Rev Respir Dis
1991;144:945–956.
2. Hosenpud JD, Stilbolt TA, Atwal K, Shelley D. Abnormal pulmonary
function specifically related to congestive heart failure: comparison of
patients before and after cardiac transplantation. Am J Med 1990;
88:493–496.
3. Rubin SA, Brown HV, Swan HJ. Arterial oxygenation and arterial oxygen
transport in chronic myocardial failure at rest, during exercise, and
after hydralazine treatment. Circulation 1982;66:143–148.
4. Perego GB, Marenzi GC, Guazzi M, Sganzerla P, Assanelli E, Palermo P,
Conconi B, Lauri G, Agostoni PG. Contribution of pO2, P50, and Hb
changes in arteriovenous O2 content during exercise in heart failure.
J Appl Physiol 1996;80:623–631.
5. Kraemer MD, Kubo SH, Rector TS, Brunsvold N, Bank AJ. Pulmonary and
peripheral vascular factors are important determinants of peak exercise
oxygen uptake in patients with heart failure. J Am Coll Cardiol
1993;21:641–648.
6. Sue DY, Oren A, Hansen JE, Wasserman Kl. Diffusing capacity for carbon
monoxide as a predictor of gas exchange during exercise. N Engl J Med
1987;316:1301–1306.
7. Puri S, Baker BL, Dutka DP, Oakley CM, Hughes JM, Cleland JG. Reduced
alveolar–capillary membrane diffusing capacity in chronic heart failure.
Its pathophysiological relevance and relationship to exercise performance. Circulation 1995;91:2769–2774.
8. Guazzi M, Pontone G, Brambilla R, Agostoni P, Reina G. Alveolar–capillary
membrane gas conductance: a novel prognostic indicator in chronic heart
failure. Eur Heart J 2002;23:467–476.
9. Guazzi M, Marenzi G, Alimento M, Contini M, Agostoni PG. Improvement
of alveolar–capillary membrane diffusing capacity with enalapril in
chronic heart failure and counteracting effect of aspirin. Circulation
1997;95:1930–1936.
10. Guazzi M, Tumminello G, Di Marco F, Fiorentini C, Guazzi MD. The effects
of phosphodiesterase-5 inhibition with sildenafil on pulmonary hemodynamics and diffusion capacity, exercise ventilatory efficiency, and
oxygen uptake kinetics in chronic heart failure. J Am Coll Cardiol
2004;44:2339–2348.
11. Agostoni P, Magini A, Andreini D, Contini M, Apostolo A, Bussotti M,
Cattadori G, Palermo P. Spironolactone improves lung diffusion in
chronic heart failure. Eur Heart J 2005;26:159–164.
12. Agostoni P, Cattadori G, Bianchi M, Wasserman K. Exercise-induced
pulmonary edema in heart failure. Circulation 2003;108:2666–2671.
13. Brasileiro FC, Vargas FS, Kavakama JI, Leite JJ, Cukier A, Prefaut C.
High-resolution CT scan in the evaluation of exercise-induced interstitial
pulmonary edema in cardiac patients. Chest 1997;111:1577–1582.
14. Agostoni PG, Bussotti M, Palermo P, Guazzi M. Does lung diffusion impairment affect exercise capacity in patients with heart failure? Heart
2002;88:453–459.
2543


© Copyright 2026