
Homework 7
EECS 70
Discrete Mathematics and Probability Theory
Fall 2014
Anant Sahai
Homework 7
This homework is due October 20, 2014, at 12:00 noon.
1. Section rollcall!
In your self-grading for this question, give yourself a 10, and write down what you wrote for parts (a) and
(b) below as a comment. You can optionally put the answers in your written homework as well.
(a) What discussion did you attend on Monday last week? If you did not attend section on that day, please
tell us why.
(b) What discussion did you attend on Wednesday last week? If you did not attend section on that day,
please tell us why.
2. Polynomials Lab
In this week’s Virtual Lab, we will dive deeper into Polynomials and their applications. We will start by
generalizing our implementation of degree 2 polynomial’s Lagrange Interpolation for any degree d polynomial in a finite field. We will then implement two simple Secret Sharing and Erasure Error clients using
Lagrange Interpolation and Polynomial properties studied in lecture.
Finally, to wrap up our brief Matplotlib tutorial series, we will learn how to plot histograms (in addition to
curves and bar charts from previous labs).
You will find in the skeleton a sample implementation of a Polynomial class. You don’t need to understand the details of the implementation, but please read the docstring of each function carefully.
Starting from this Virtual Lab, we will ask you to write down something for every part in your written
homework. This is done to reduce self-grading confusion, where students often are not sure which parts
require written answers and which do not. For questions that involve plotting something, you will need to
embed your plot(s) in your written homework. You can save your plots using plt.savefig() or Right
Click > Save Image As. If you normally handwrite your homework, we recommend that you type up the lab
report (similar in style to an EE/Physical Science one) to make inserting plots easier.
Please download the IPython starter code from Piazza or the course webpage, and answer the following
questions.
(a) Warm up: Run the code cells in the skeleton to have a better idea of how our implementation of
Polynomial works. For example, to create a polynomial f (x) = 2x + 1 (mod 7), we write: f =
Polynomial([1, 2], 7). Notice that the coefficients go from lower power of x to higher power
of x.
Make sure you understand the basics of the Polynomial class and play around with the given examples in the skeleton before moving on. For this part, please write down the result of (4x3 + 3x2 +
2x + 1)/7 mod 5.
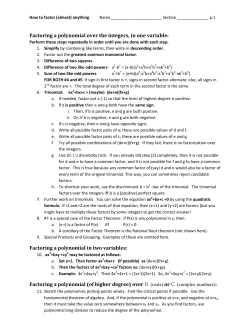
(b) Create and plot the polynomials p(x) = 2x + 3 and q(x) = 3x − 2 with all numbers reduced mod 5.
Make sure you use the correct symbol (’o’ or ’x’) to represent the points so that your result looks
similar to the figure on page 5 of Note 7 (there’s no need to display the legend on the side). Your plot
should look very similar to the figure below.
EECS 70, Fall 2014, Homework 7
1
(c)
(d)
(e)
(f)
(g)
(h)
Save your plot, give it a title (to make it different from ours), and put it inside your written homework.
Please do the same for other plotting questions from now on.
Plot x3 (mod 5) for x ∈ [0, 5] in the reals. For example, 2.3 ≡ 7.3 (mod 5). On the same graph, plot
x3 (mod 5) for integer values of x = 0, 1, . . . , 5.
Now repeat (c) for x ∈ [0, 10] and x = 0, 1, . . . , 10. What do you observe? What happens to each plot
as x gets larger? Why do you think this is happening?
Last week, we implemented Lagrange Interpolation for a degree 2 polynomial. This week, we will do
so again for any degree d polynomial in a finite field. Implement the function interpolate, which
takes a list of points and a prime modulus n, and returns a polynomial that passes through the points in
GF(n).
In the skeleton, we have given you most of the code you need for this function, except for three blanks.
In your written homework, tell us what you fill in for these blanks and why.
In the skeleton, you will find an incomplete implementation of a simple Secret Sharing class. First,
implement the method add_share, which simply adds a share to the list of shares.
After adding enough shares, you can then reconstruct the polynomial with Lagrange Interpolation (part
(b)), and evaluate it at 0 to find the secret. Implement the method find_secret, which basically
conveys the idea described above.
Test your implementation by carrying out the example on page 7/8 of Note 7. Use the same shares in
the example (assuming officials 3, 4, and 5 get together to recover the secret).
Now, choose a different set of 3 shares and recover the secret. What do you get? Is it consistent with
the above part? Why is that the case?
In the skeleton, you will find a simple implementation of an Erasure Error client. It has the ability to
add/send packets and drop deterministic or random packet(s).
Your task is to carry out the example between Alice and Bob on page 2 and 3 of Note 8 from scratch
using ErasureError. You will need to add the packets, find the polynomial constructed by interpolating the packets, and drop two packets mentioned in the note. Finally, construct another polynomial
using the remaining packets, and make sure that the two polynomials match.
Now, add the packets that were dropped back, and drop two random packets. Can you still recover the
original message like the first case? In one sentence, explain why. How about if we drop one random
packet? Three or more random packets?
In the last couple of labs, we learned how to plot a simple curve and a bar chart. To wrap up our intro
to Matplotlib series, we will learn another important plot today: the histogram.
What we will use for our data is 1000 random numbers, drawn from a Gaussian distribution. This
is the common "normal" distribution, or the "bell curve" that occurs so frequently in nature. We
will use a Gaussian centered about zero, with a standard deviation of 1.0 (this is the default for
np.random.normal).
EECS 70, Fall 2014, Homework 7
2
Listing 1: Gaussian Histogram Code
gaussian_numbers = np.random.normal(size=1000)
plt.hist(gaussian_numbers)
plt.title("Gaussian Histogram")
plt.xlabel("Value")
plt.ylabel("Frequency")
First, we want to plot a probability distribution instead of just frequency counts. In other words, we
want to scale the values appropriately so that rather than showing how many numbers in each bin, we
instead have a probability of finding a number in that bin.
We also want to increase the number of bins. plt.hist defaults to 10 bins, and since we have 1000
points, that seems a bit too small. Change the number of bins to 20.
You need to look into the documentation of plt.hist and find the argument(s) that help you accomplish the tasks above.
Your final plot should look very similar to the figure below.
In your written homework, insert your plot and state which arguments you use.
(i) Add a histogram of 1000 uniformly distributed random numbers from -3 to 3 in red with 50% transparency over top the blue Gaussian from the first task.
Also, give each of your histogram a label. Then, at the very end, you can call plt.legend(), which
will display the legends nicely.
Your final plot should look very similar to the figure below.
EECS 70, Fall 2014, Homework 7
3
In your written homework, insert your plot and state which arguments you use.
(j) This last question is meant to warm you up for next week’s lab on randomness. Imagine you are
tossing a fair coin k times, and you would like to count the numer of heads. Implement the function
count_heads, which takes in k, the number of tosses, and returns the number of heads in k tosses.
Do 1000 coin tosses. Plot a bar chart of how many heads you got v.s. how many tails. What do you
observe? Does it match your expectation?
Hint: In Python, random.randint(a, b) returns a random integer x such that a ≤ x ≤ b. Can
you think of a way to use this function to simulate the fair coin tosses? You don’t necessarily have to
use randint, but you will definitely need a function from the random module.
Next week, we will begin our journey into the world of randomness and probability. Please make sure to
review the plotting questions on the Virtual Labs, as well as the Matplotlib tutorial that was posted on Piazza.
Reminder: When you finish, don’t forget to convert the notebook to pdf and merge it with your written
homework. Please also zip the ipynb file and submit it as hw7.zip.
3. Polynomials in finite fields
Show your work clearly and use the same notations as in Lecture Note 7.
(a) Find a polynomial h(x) = ax2 + bx + c of degree at most 2 such that h(0) ≡ 3 (mod 7), h(1) ≡ 6
(mod 7), and h(2) ≡ 6 (mod 7).
(b) Find a polynomial h(x) = ax2 + bx + c of degree at most 2 such that h(0) ≡ 2 (mod 7), h(1) ≡ 5
(mod 7), and h(2) ≡ 1 (mod 7).
4. Properties of GF(p)
(a) Show that, if p(x) and q(x) are polynomials over the reals (or complex, or rationals) and p(x) · q(x) = 0
for all x, then either p(x) = 0 for all x or q(x) = 0 for all x or both (Hint: You may want to prove first
this lemma, true in all fields: The roots of p(x) · q(x) is the union of the roots of p(x) and q(x).)
(b) Show that the claim in part (a) is false for finite fields GF(p).
5. GCD of Polynomials
Let A(x) and B(x) be polynomials (with coefficients in R). We say that gcd(A(x), B(x)) = D(x) if D(x)
divides A(x) and B(x), and if every polynomial C(x) that divides both A(x) and B(x) also divides D(x). For
example, gcd((x − 1)(x + 1), (x − 1)(x + 2)) = x − 1. Notice this is the exact same as the normal definition
of GCD, just extended to polynomials.
EECS 70, Fall 2014, Homework 7
4
Incidentally, gcd(A(x), B(x)) is the highest degree polynomial that divides both A(x) and B(x). In the subproblems below, you may assume you already have a subroutine divide(P(x), S(x)) for dividing two
polynomials, which returns a tuple (Q(x), R(x)) of the quotient and the remainder, respectively, of dividing
P(x) by S(x).
(a) Write a recursive program to compute gcd(A(x), B(x)).
(b) Write a recursive program to compute extended-gcd(A(x), B(x)).
6. How many packets?
(a) The error-correcting code for erasure errors protects against up to k lost packets by sending a total of
n + k packets (where n is the number of packets in the original message). Often the number of packets
lost is not some fixed number k, but rather a fraction of the number of packets sent. Suppose we wish
to protect against a fraction α of lost packets (where 0 < α < 1). How many packets do we need to
send in total (as a function of n and α)?
(b) How many packets do we need to send in total (as a function of n and α) in the case of general errors?
7. Alice wants to talk
Alice has a message of length n = 3 for Bob. She also has another message of length n = 3 for Charles. Her
message for Bob is a0 = 4, a1 = 3, and a2 = 2. And her message for Charles is a0 = 1, a1 = 2, and a2 = 2.
(a) If Alice accounts for k = 1 general errors, then what are Alice’s augmented messages to Bob and
Charles (each modulo 5)?
(b) Alice now transmits the augmented message intended for Bob over an erasure channel. Bob receives
only P(0), P(2), and P(4). The rest are erased. How does Bob recover Alice’s message? Show your
work in detail.
(c) Alice then transmits the augmented message intended for Charles over a noisy channel. Charles receives the entire message but now P(2) is corrupted to P(2) + 2( mod 5). Charles doesn’t know where
the error is but he does know that at most one error has occured. How will Charles recover Alice’s
message?
8. Trust No One
Gandalf has assembled a fellowship of eight people to transport the One Ring to the fires of Mount Doom:
four hobbits, two men, one elf, and one dwarf. The ring has great power that may be of use to the fellowship
during their long and dangerous journey. Unfortunately, the use of its immense power will eventually corrupt
the user, so it must not be used except in the most dire of circumstances. To safeguard against this possibility,
Gandalf wishes to keep the instructions a secret from members of the fellowship. The secret must only be
revealed if enough members of the fellowship are present and agree to use it.
Requiring all eight members to agree is certainly a sufficient condition to know the instructions, but it seems
excessive. However, we also know that the separate races (hobbits, men, elf, and dwarf) do not completely
trust each other so instead we decide to require members from at least two races in order to use the ring.
In particular, we will require a unanimous decision by all members of one race in addition to at least one
member of a different race. That is, if only the four hobbits want to use the ring, then they alone should not
have sufficient information to figure out the instructions. Same goes for the two men, the elf, and the dwarf.
More explicitly, some examples: only four hobbits agreeing to use the ring is not enough to know the
instructions. Only two men agreeing is not enough. Only the elf agreeing is not enough. Only the dwarf
EECS 70, Fall 2014, Homework 7
5
agreeing is not enough. All four hobbits and a man agreeing is enough. Both men and a dwarf agreeing is
enough. Both the elf and the dwarf agreeing is enough.
Gandalf has hired your services to help him come up with a secret sharing scheme that accomplishes this
task, summarized by the following points:
• There is a party of four hobbits, two men, an elf, and a dwarf.
• There is a secret message that needs to be known if enough members of the party agree.
• The message must remain unknown to everyone (except Gandalf) if not enough members of the party
agree.
• If only the members of one race agree, the message remains a secret.
• If all the members of one race agree plus at least one additional person, the message can be determined.
• Other combinations of members (e.g. two hobbits and a man) can either determine the message or
keep it a secret (it is up to your discretion).
9. Write Your Own Problem
Write your own problem related to this week’s material and solve it. You may still work in groups to
brainstorm problems, but each student should submit a unique problem. What is the problem? How to
formulate it? How to solve it? What is the solution?
EECS 70, Fall 2014, Homework 7
6


© Copyright 2026