
Health effects of air pollution in Iceland
Health effects of air pollution in Iceland Respiratory health in volcanic environments Hanne Krage Carlsen Thesis for the degree of Philosophiae Doctor Supervisor: Thorarinn Gíslason Advisor: Anna Oudin Doctoral committee: Anna-Carin Olin Bertil Forsberg Unnur Valdimarsdóttir October 2014 Heilbrigðisáhrif loftmengunnar á Íslandi Öndunarfæraheilsu í eldgosaumhverfi Hanne Krage Carlsen Ritgerð til doktorsgráðu Umsjónarkennari: Þórarinn Gíslason Leiðbeinandi: Anna Oudin Doktorsnefnd: Anna-Carin Olin Bertil Forsberg Unnur Valdimarsdóttir Október 2014 ‚ Thesis for a doctoral degree at the University of Iceland. All right reserved. No part of this publication may be reproduced in any form without the prior permission of the copyright holder. © Hanne Krage Carlsen 2014 ISBN 978-91-7601-082-2 Printing by Háskólaprent Reykjavik, Iceland 2014 Statement of collaboration This thesis and the work in it have been produced in collaboration between University of Iceland and Umeå University. The thesis will be defended and issued at both institutions. Ágrip Loftmengun hefur slæm áhrif á heilsu manna. Öndunarfærin eru mest útsett og skammtímabreyting í styrk loftmengunnar hefur verið tengd við versnun á teppusjúkdómum í lungum og aukningu á tíðni hjartaáfalla og heilablóðfalla. Loftmengun í borgum vegna bílaumferðar er áhyggjumál þar sem mikið af fólki er útsett. Á hinn boginn geta einnig náttúrulegar mengunaruppsprettur eins og ryk, sandfok og aska frá eldgosum ógnað heilsu manna. Útsetning fyrir náttúruhamförum á borð við eldgos getur einnig hótað geðheilbrigði. Ekki hefur verið gert mikið af rannsóknum á Íslandi þrátt fyrir tilvist fleiri náttúrulegra mengunaruppspretta og talsverðs magns bíla á götum höfuðborgarsvæðis Íslands. Markmið ritgerðar þessarar var að rannsaka hvort loftmengun hafi mælanleg áhrif á heilsu íbúa Íslands. Rannsóknarnálgunin var tvíþætt. Annars vegar voru notuð gögn úr heilbrigðisskrám sem voru skoðuð með tímaraðagreiningaraðferð til að rannsaka skammtímaáhrif daglegra sveifla loftmengunar og breytileika í daglegum fjölda fólks sem tók út lyfseðilsskyld astmalyf eða leituðu sér hjálpar á bráðamóttöku vegna hjarta-, lungnasjúkdóma eða heilablóðfalls. Hins vegar var litið á heilsuáhrif eldossins árið 2010 í Eyjafjallajökli. Í grein I var tímaraðagreining notuð til að rannsaka samband daglegs fjölda fólks sem leysti út lyfseðilsskyld lyf gegn astma og magns loftmengunar; svifryksagna minna en 10 μm (PM10), níturdíoxíðs (NO2), ósóns (O3) og brennisteinsvetnis (H2S). Rannsóknartímabilið var frá árinu 2006 fram til 2009 og reyndist marktækt samband dagsgilda PM 10 og H2S og fjölda þeirra sem leystu út lyf 3-5 dögum síðar. Þegar litið var á útsetningu sem hæsta klukkutímagildi hvers dags var sambandið sterkara. Grein II hafði fjöldi einstaklinga sem leitaði til bráðamóttöku Landspítala Háskólasjúkrahúss vegna hjarta-, lungnasjúkdóma eða heilablóðfalla 20032009 sem meginrannsókarútkomu. Tímaraðagreiningu var beitt til að finna bestu forspárþættina meðal PM10, NO2, og O3. Marktækt samband var á milli styrks O3 og fjölda koma á bráðamóttöku og innlagna sama dag, sem og einum og tveimur dögum síðar. Sambandið fannst bæði fyrir karla og konur og meðal einstaklinga eldri en 70 ára. Einungis fannst samband á milli NO 2 og koma á bráðamóttöku og innlagna meðal eldri einstaklinga. Hins vegar reyndist PM10 ekki marktækur forspárþáttur. i Í grein III var markmiðið að rannsaka hvort heilbrigðisáhrif PM 10 breyttust eftir að aska frá gosunum í Eyjafjallajökli og Grímsvötnum bættust við PM 10 á höfuðborgarsvæðinu. Rannsóknartímabilið var 2007-2012 og sama útkoma var notuð og í grein II þ.e. komur á bráðamóttöku og innlagnir vegna hjarta-, lungnasjúkdóma og blóðfalla. Tímaraðagreining sýndi að áhrif PM 10 höfðu tilhneigingu til þess að vera meiri eftir gos en niðurstöður voru ekki tölfræðilega marktækar. Þegar tvíþættir vísar fyrir uppsprettu PM 10 í eldgosaösku voru bornir saman við aðrar uppsprettur sást að þegar styrkur PM10 var hár einn dag vegna eldgosaösku var marktæk aukning á fjölda koma á bráðamóttöku og bráðainnlagna. Aftur á móti var hár styrkur PM 10 ekki einn og sér tengdur aukningu. Í grein IV var heilsa þeirra sem bjó á svæðinu sem var mest útsett fyrir gosinu í Eyjafjallajökli árið 2010 könnuð þegar gosinu var að ljúka. Notast var við blástursmælingar til að rannsaka áhrif á lungnastarfsemi, auk læknisskoðunar og spurningalista. Lungnastarfsemi hópsins reyndist vera svipuð og hjá samanburðarhóp frá Reykjavík en reykingar voru algengari hjá samanburðarhópnum. Margir þjáðust af einkennum frá skynfærum, streitu og slæmri andlegri líðan. Einstaklingar með undirliggjandi sjúkdóma höfðu mesta aukningu á einkennum. Grein V er spurningarannsókn gerð sex mánuðum eftir að gosi í Eyjafjallajökli lauk. Rannsóknarhópurinn samanstóð af Sunnlendingum sem bjuggu mislangt frá eldfjallinu ásamt samanburðarhópi frá norðurhluta Íslands. Einkenni frá öndunarfærum og augum voru algengari hjá Sunnlendingum eftir leiðréttingu fyrir aldri, kyni, menntun og reykingum. Andleg vanlíðan var enn há hjá þeim sem voru mest útsettir en hafði minnkað talsvert miðað við fyrri niðurstöður greinar IV. Í ritgerð þessari hefur verið sýnt fram á skammtímaáhrif bæði mengunar í bæjum og náttúrulegra agna á úttekt á astmalyfjum og koma á bráðamótttöku og innlagna. Svifryksagnir frá eldgosum voru sérstaklega tengdar auknum öndunarfæraeinkennum í útsettu þýði.Niðurstöður bentu til þess að samband finnist á milli eldgosa-agna og fjölda koma á bráðamótttöku eftirfylgjanda daga. Lykilorð: Öndunarfæraheilsu, loftmengun, eldfjallaösku, faraldsfræði, brennisteinsvetni. ii Abstract Air pollution has adverse effects on human health. The respiratory system is the most exposed and short-term changes in air pollution levels have been associated with worsening of asthma symptoms and increased rates of heart attacks and stroke. Air pollution in cities due to traffic is the major concern, as many people are exposed. However, natural sources of air pollution such as natural dust storms and ash from volcanic eruptions can also compromise human health. Exposure to volcanic eruptions and other natural hazards can also threaten mental health. Air pollution has not been extensively studied in Iceland, in spite of the presence of several natural pollution sources and a sizeable car fleet in the capital area. The aim of this thesis was to determine if there was a measurable effect on health which could be attributed to air pollution in Iceland. This aim was pursued along two paths; time series studies using register data aimed to determine the short-term association between daily variation in air pollution and on one hand daily dispensing of anti-asthma medication or the daily number of emergency room visits and emergency admissions for cardiopulmonary causes and stroke. The other method was to investigate if exposure to the Eyjafjallajökull volcanic eruption was associated with adverse health outcomes, either at the end of the eruption, or 6 months later. In paper I time series regression was used to investigate the association between the daily number of individuals who were dispensed anti-asthma medication and levels of the air pollutants particle matter with an aerodynamic diameter less than 10 μm (PM10), nitrogen dioxide (NO2), ozone (O3), and hydrogen sulfide (H2S) during the preceding days. For the study period 2006-9, there were significant associations between the daily mean of PM10 and H2S and the sales of anti-asthma medication 3 to 5 days later. Giving the exposure as the highest daily one-hour mean gave more significant results. Air pollution negatively affected the respiratory health of asthma medication users, prompting them to refill their prescriptions before they had originally intended to. In paper II the main outcome was the number of individuals seeking help at Landspitali University Hospital emergency room for cardiopulmonary disease or stroke. Time series regression was used to identify the lag that gave the best predictive power, and models were run for data for 2003-9 iii pollutants PM10, NO2, and O3. O3 was significantly associated with the number of emergency hospital visits the same day and two days later in all models, and both for men, women and the elderly. Only emergency hospital visits of the elderly were associated with NO 2, and there were no associations with PM10. In paper III the aim was to investigate if the health effects of PM10 were affected by the addition of volcanic ash from the 2010 eruption of Eyjafjallajökull and 2011 eruption of Grímsvötn to PM10 in the capital area. Time series regression of emergency hospital visits and PM 10 before and after the Eyjafjallajökull eruption showed that the effect tended to be higher after the eruption, but the results were not significant. Analysis with a binary indicator for high levels of PM10 from volcanic ash and other sources showed that volcanic ash was associated with increased emergency hospital visits. There were no associations with high levels of PM10 from other sources. In paper IV, the health of the population exposed to the ongoing eruption of Eyjafjallajökull in 2010 was investigated thoroughly. Lung function in adults was similar to that in a reference group from the capital area, but smoking was more common in the reference group. Many from the exposed group reported sensory organ irritation symptoms and symptoms of stress and psychological morbidity, especially those with underlying diseases. Paper V report the results from a questionnaire study which was carried out six months after the Eyjafjallajökull eruption. The study population comprised a cohort of South Icelanders exposed to the eruption to varying degrees and a reference group from North Iceland. Respiratory and eye symptoms were more common in South Icelanders than in the reference group, after adjusting for demographic characteristics. Psychological morbidity rates had declined considerably. In the studies, we found that urban air pollution and natural particles have short-term effects on anti-asthma medication dispensing and emergency room visits and hospital admissions. Exposure to natural particles in the form of volcanic dust was associated with increased respiratory symptoms in a very exposed population. There were indications that volcanic ash particles were associated with increased emergency hospital visits in the following days. Keywords: Respiratory health, air pollution, volcanic ash, epidemiology, hydrogen sulfide. iv Acknowledgements Many people have contributed to this work, and I would like to thank them all. First of all the people of South Iceland and Skagafjörður who took the time to answer the questionnaires and participate in the studies. I want to thank my main supervisor Þórarinn Gislason for his encouragement and scientific mentorship for this thesis and tireless effort in finding support for it. I thank my advisor Anna Oudin for her support and the effort she has put into this thesis. Thank you also to Unnur Valdimarsdóttir who always thought I would make a good PhD candidate. I am very grateful to my advisors and collaborators in Sweden; Anna-Carin Olin, Kadri Meister and Bertil Forsberg for expert advice and much support. A big thank you to my co-authors, Arna Hauksdóttir, Bryndís Benediktsdóttir, Þórir Björn Kolbeinsson, Þröstur Þorsteinsson, Gunnlaug Einarsdóttir, Halldór Runólfsson, Sigurður Guðmundsson & Þorsteinn Jóhansson. Paper I would not have been publishable without the tireless efforts of Helga Zoëga and Birgir Hrafnkelsson, who helped guided me through decades of evolution in time trend adjustment methods. The collaboration around the Eyjafjallajökull studies taught me a lot, especially Gudrún Pétursdóttir and Haraldur Briem deserve much thanks for their help with publishing the results. Dóra Ólafsdóttir at the Centre of Public Health at University of Iceland has been most helpful with my long-distance navigation of University of Iceland administration. My fellow PhD student Ragnhildur Finnbjörnsdóttir has been a good collaborator and friend during this period, and I thank her, as well as my other colleagues at the Centre of Public Health at the University of Iceland, Umeå University, and AMM in Gothenburg. The following have kindly helped me gather the data used in this thesis: Ingibjörg Richter, Anna Rósa Böðvarsdóttir, Hildur Friðriksdóttir, Kristinn Jónsson, Margrét Hallsdóttir and Lára Guðmundsdóttir. The following institutions supported this project: The University of Iceland Centre of Public Health and Umeå University Department of Occupational and Environmental Medicine, Occupational and Environmental Medicine at Sahlgrenska School of Public Health and v Community Medicine, the latter has been my work place for the last two years, both the colleagues and the professional environment has been a big encouragement and inspiration. Also the Sæmundur Fróði Institute for Sustainability Studies and The Swedish Environmental Research Institute in Gothenburg (IVL). I thank my family for their support and encouragement, and my husband, Steinn, my rock. Finally, I want to thank my friends; especially Aysha Hussain, Gunnar Thorarensen & Virgile Collin-Lange who all contributed to this thesis with valuable input. This thesis was funded through Rannis - The Icelandic Centre for Research PhD, the Department for Occupational and Environmental Medicine, Umeå University, and the Icelandic Ministry of Welfare (Eyjafjallajökull health studies). Additional funding have been provided by the University of Iceland travel grant, The Swedish Society of Medicine Section for Occupational and Environmental health travel grant, and the Icelandic Association of Academics re-education grant. vi Contents Ágrip .............................................................................................................. i Abstract ....................................................................................................... iii Acknowledgements ..................................................................................... v Contents ..................................................................................................... vii List of abbreviations .................................................................................. ix List of figures............................................................................................... x List of tables .............................................................................................. xii List of original papers .............................................................................. xiii Declaration of contribution...................................................................... xiv 1 Introduction ............................................................................................ 1 1.1 Air pollution ....................................................................................... 2 1.1.1 Traffic pollution .......................................................................... 2 1.1.2 Dust and sand storms ............................................................... 5 1.1.3 Geothermal areas and hydrogen sulfide ................................... 5 1.1.4 Volcanic eruptions ..................................................................... 5 1.1.5 Other sources............................................................................ 6 1.2 Air pollution effects on health ............................................................ 7 1.2.1 Pathways .................................................................................. 7 1.2.2 Evidence from epidemiological studies .................................... 11 1.3 Respiratory health and air pollution in Iceland ................................ 17 1.3.1 Mineral dust sources ............................................................... 19 1.3.2 Hydrogen sulfide ..................................................................... 19 1.3.3 Icelandic volcanoes ................................................................. 20 2 Aims ...................................................................................................... 23 3 Materials and methods ........................................................................ 25 3.1 Data sources .................................................................................. 25 3.1.1 Exposure ................................................................................. 25 3.1.1 Health outcomes ..................................................................... 27 3.1.1 Covariates ............................................................................... 29 3.1.2 Ethics approval........................................................................ 32 3.2 Methods .......................................................................................... 32 3.2.1 Short-term effect studies ......................................................... 32 3.2.2 Long-term effect studies .......................................................... 35 4 Results .................................................................................................. 39 vii 4.1 4.2 4.3 4.4 4.5 Paper I ............................................................................................ 39 Paper II ........................................................................................... 44 Paper III .......................................................................................... 44 Paper IV .......................................................................................... 45 Paper V ........................................................................................... 46 5 Discussion ............................................................................................ 49 5.1 Key results ...................................................................................... 49 5.2 Limitations and methodological considerations............................... 50 5.2.1 Exposure ................................................................................. 50 5.2.2 Outcomes ................................................................................ 52 5.2.3 Statistical methods .................................................................. 54 5.3 Interpretation................................................................................... 54 5.4 External validity............................................................................... 55 6 Conclusions .......................................................................................... 57 6.1 Limitations of the current study and future perspectives ................. 58 References ................................................................................................. 59 Original publications ........................................ Error! Bookmark not defined. Paper 1 .............................................................. Error! Bookmark not defined. Paper 2 .............................................................. Error! Bookmark not defined. Paper 3 .............................................................. Error! Bookmark not defined. Paper 4 .............................................................. Error! Bookmark not defined. Paper 5 .............................................................. Error! Bookmark not defined. Appendix .................................................................................................. 153 viii List of abbreviations ATC Anatomical therapeutic classification system BC Black carbon BS Black smoke CO2 Carbon dioxide COPD Chronic obstructive pulmonary disease ER Emergency room FEV1 Forced expiratory volume in 1 second FVC Forced vital capacity GAM Generalized additive model GHQ General health questionnaire GLM Generalized linear model GP General practitioner ICD International classification of diseases H2S Hydrogen sulfide Lowess Locally weighted scatterplot smoothing NO2 Nitrogen dioxide O3 Ozone PAH Poly-aromatic hydrocarbons PEF Peak expiratory flow PM2.5 Particle matter with an aerodynamic diameter less than 2.5 µm PM10 Particle matter with an aerodynamic diameter less than 10 µm (micrometer) PTSD Post traumatic stress syndrome SO2 Sulfur dioxide UFP Ultrafine particle matter with an aerodynamic diameter less than 1 µm VOC Volatile organic compounds WHO World health organization ix List of figures Figure 1 Concentrations of NO2 and O3 at an urban roadside measuring station, Reykjavík, over 4 days starting January 21, 2006. ......................................................................................... 3 Figure 2 Reykjavík seen from the north on a day with high levels of PM due to a dust storm (top) and on a day with clear skies (below) (image: Hanne Krage Carlsen). .......................................... 4 Figure 3 The ash plume of Eyjafjallajökull May 7 2010. The ash contained as much as 20% PM10 (image: Hanne Krage Carlsen)........................................................................................... 6 Figure 4 Overview of the respiratory system and particle deposition (image: Hanne Krage Carlsen/Creative Commons). ....................... 7 Figure 5 Suggested biological pathways for health effects of air pollution to different parts of the circulatory system (image: Hanne Krage Carlsen/Creative commonts). .................................... 9 Figure 6 The emissions from a geothermal power plant contain H2S (image: Hanne Krage Carlsen)...................................................... 13 Figure 7 Ash from the Eyjafjallajökull eruption causes bad visibility mid-day May 7, 2010 (image: Hanne Krage Carlsen). .................. 16 Figure 8 Hellisheidi geothermal powerplant seen from the north (image: Hanne Krage Carlsen)...................................................... 20 Figure 9 The Eyjafjallajökull volcano 2008 (left) and 2010 (right) (image: Hanne Krage Carlsen)...................................................... 21 Figure 10 Composition of ambient PM10 in Reykjavík 2003 and 2013 (Image: Hanne Krage Carlsen based on Skúladóttir et al., 2003 & Vegagerðin, 2013). ........................................................... 22 Figure 11 Reykjavík and surrounding area with main pollution sources and measuring stations (Adapted from paper II) .............. 25 Figure 12 Ash dispersion around Eyjafjallajökull (left) and the exposure areas based on it (right) (Image: Thorsteinsson, from Paper IV and V). ................................................................... 26 Figure 13 Example of missing data in a multi-pollutant time series. The shaded areas will be excluded from regression analysis as values of one or more pollutants are missing. .......................... 35 x Figure 14 Time series of cardiovascular, stroke, and respiratory infectious admissions and ER visits 2003-2012 ............................ 40 Figure 15 Daily means of air pollutants (μg/m3) measured in Reykjavik 2003-2012..................................................................... 41 Figure 16 Overview of Reykjavík postcodes and measuring stations. Circled postcodes are re-analysed in figure 16 and table 5. ......... 42 Figure 17 The association between anti-asthma drug dispensing in east Reykjavik and H2S. ................................................................ 43 Figure 18 Proportion of cohort reporting “some” or “a lot” of exposure to volcanic phenomena at their residence during the eruption in Eyjafjallajökull 2010. .................................................... 46 xi List of tables Table 1 Air pollution health limits in Iceland (µg/m3). .................................... 19 Table 2 Schematic overview of data used in each study .............................. 30 Table 3 Ethics approval sought for each study ............................................. 31 Table 4 Schematic overview of the methods used in each study ................. 37 Table 5 H2S and anti-asthma medication dispensing in areas within Reykjavík lags 0-15. Adjusted for other pollutants, weather and time trend. .............................................................................. 43 Table 6 Reply rates for Eyjafjallajökull cohort study – web and online ......... 47 xii List of original papers This thesis is based on the following original publications, which are referred to in the text by their Roman numerals: I. Carlsen, H. K., Zoëga, H., Valdimarsdóttir, U., Gíslason, T., & Hrafnkelsson, B. (2012). Hydrogen sulfide and particle matter levels associated with increased dispensing of anti-asthma drugs in Iceland’s capital. Environmental Research, 113, 33–39. II. Carlsen, H. K., Forsberg, B., Meister, K., Gíslason, T., & Oudin, A. (2013). Ozone is associated with cardiopulmonary and stroke emergency hospital visits in Reykjavík, Iceland 2003–2009. Environmental Health, 12(1), 28. III. [manuscript] Carlsen, H. K., Gislason, T., Forsberg, B., Meister, K., Thorsteinsson, T., Jóhansson, T., Finnbjornsdottir, R. G., Oudin, A., Effects of PM10 from volcanic ash, natural dust, and other sources on emergency hospital visits in Reykjavík, Iceland. IV. Carlsen, H. K., Gislason, T., Benediktsdottir, B., Kolbeinsson, T. B., Hauksdottir, A., Thorsteinsson, T., & Briem, H. (2012). A survey of early health effects of the Eyjafjallajökull 2010 Eruption in Iceland: A population-based study. BMJ Open, 2(2), e000343. V. Carlsen, H. K. & Hauksdottir, A., Valdimarsdottir, U. A., Gíslason, T., Einarsdottir, G., Runolfsson, H., Briem, H., Finnbjornsdottir, R.G., Gudmundsson, S., Thorsteinsson, T., Pétursdóttir, G. (2012). Health effects following the Eyjafjallajökull volcanic eruption: A cohort study. BMJ Open, 2(6), e001851. All papers are reprinted by kind permission of the publishers. xiii Declaration of contribution In paper I, the candidate wrote the ethics application and obtained the data from the authorities, including ethics permissions. The candidate analyzed the data, wrote the paper in collaboration with the supervisors and reanalyzed in accordance with reviewer comments in the publication process. For paper II, the candidate gathered the exposure data and analyzed them, and wrote the paper in collaboration with the co-authors. For paper III, the candidate obtained the exposure data, treated and analyzed all data, and wrote the paper in collaboration with the supervisors. For paper IV, the candidate participated in the preparation of the questionnaire, and the collection of the data. The candidate then digitized and analyzed the data. The manuscript was written by the candidate in collaboration with the co-authors and the corresponding author, who ultimately handled the manuscript reviewing and the publication process. For paper V, the candidate participated in the preparation of the questionnaire and the collection of the data. The candidate digitized and analyzed the data. The manuscript was written in collaboration with the coauthors and the corresponding author, who ultimately handled the manuscript submission and reviewing process. xiv 1 Introduction Air pollution is defined as undesired gases and particles in ambient air, commonly known as aerosols, because of smell, nuisance or adverse health effects (WHO, 2000, p1). Since the early days of industrialization, air pollution has been recognized as a hazard to human health (WHO, 2000, p16). The earliest reports of health effects of airborne particles date back to the 15 th and 16th centuries; the women of the Carpathian mountains (mostly in present-day Romania) went through as many as seven husbands in their lifetime - the men who worked in the granite mines died early from disease (silico-tuberculosis) caused by exposure to the silica dust (Donaldson and Seaton, 2012). Falun, Sweden, was home to the largest copper mine in Europe in the early 18 th century. Visitors described that “Intense, black copper smoke lies dense over the town. [The smoke] causes intense sneezing, and lung disease was more common in this area” (Dunér, 2012, pp. 79-83). Modern studies of air pollution and health began in the 20 th century following the Meuse Valley disaster in Belgium 1930 (Nemery et al., 2001) and the London fog (Logan, 1956), both events where short-term increases in pollution levels caused increased morbidity and mortality. Results from The Six Cities Study showed that chronic exposure to high levels of air pollution were associated with increased morbidity and mortality rates (Dockery and Pope, 1993). Today, the studies of health effects of air pollution remain focused on anthropogenic traffic pollution which affects many people who live in cities and urban areas. In later years, increased focus has been pointed at air pollution from natural sources such as desert dust (Morman and Plumlee, 2013), gas emitted from geothermal areas (Hansell and Oppenheimer, 2004) or ash from volcanic eruptions (Horwell and Baxter, 2006). Air pollution is responsible for a substantial part of respiratory mortality and morbidity (Künzli et al., 2000). In the introduction, I first describe types of pollution; secondly, the health effects, and briefly review the epidemiological studies of health effects for different types of pollution; and finally, describe the Icelandic situation and studies of respiratory health and air pollution in Iceland. 1 1.1 Air pollution 1.1.1 Traffic pollution In later years, abandoning of coal for space heating and the removal of lead from gasoline has improved air quality in urban areas (Brunekreef and Holgate, 2002). Motor traffic exhaust is the most prominent pollution source, though local conditions, weather, building types, and topography also affect the local pollution levels (WHO, 2013). Gaseous pollutants from fuel combustion, mainly from traffic, contribute greatly to air pollution in cities, for example the yellow smog clouds over megacities like Athens and Los Angeles. These yellow clouds are acid aerosols formed in heat-catalyzed reactions of automobile exhaust and sulfur dioxide (SO2). SO2 is released from burning coal and other poor quality fossil fuels. The burning of coal has been banned in many cities, other fuels are cleaner, and SO2 has currently become less of a problem in the Western world (Fenger, 2002; WHO 2005). Traffic exhaust contains a large number of gases and particles which have known health effects (Fenger, 2002, WHO, 2005). Nitrogen dioxide (NO2) is used as an indicator for traffic pollution as it correlates well with traffic counts when measured at the roadside. In some studies other measures of pollution such as black carbon (BC) or black smoke (BS) are used as proxies for traffic proximity as they also correlate well with traffic counts (WHO, 2013). NO2 is a precursor for ozone (O3) which forms when automobile exhaust gases, including NO2, react with the atmosphere, consuming the NO 2 to form O3. This reaction is catalyzed by heat and sun radiation (Jenkins and Clemitshaw, 2002). O3 levels are often lower in the presence of traffic during the day (see Figure 1). Volatile organic compounds (VOC) and polyaromatic hydrocarbons (PAHs) are also formed when hydrocarbon fuels are combusted. The availability of NOx and VOC determine how high the O 3 concentration can become as described by Jenkins and Clemitshaw (2002). In the presence of daylight (solar ultra-violet radiation, hv), the reactions occur on a time scale of seconds according to NO2 + hv → NO + O Atmospheric oxygen, O2, will quickly react with the leftover O molecule (Sillman, 2002). 2 Even though O3 tends to decrease in the presence of traffic, background levels of O3 have largely followed the trends in fossil fuel emissions since systematic measuring began in the 20 th century (Derwent et al., 2007; Solberg et al., 2005). NO2 and O3 four days NO2 0 20 microg/m3 µg/m3 40 60 80 100 O3 1AM 1PM 1AM 1PM 1AM 1PM 1AM 1PM 1AM Figure 1 Concentrations of NO2 and O3 at an urban roadside measuring station, Reykjavík, over 4 days starting January 21, 2006. Particulate matter Particulate matter (PM) is in essence small particles that are suspended in the air. Traffic-related PM contains a mix of materials from combustion processes: carbon and sulfates, but also particles from soils, or mechanical wear, mineral components and traces of heavy metals (WHO, 2005; Bérubé et al., 2006; Donaldson et al., 2006). PM is denoted by the aerodynamic diameter of the particles; the coarse fraction is PM10-2.5 (PM with an aerodynamic diameter between 2.5 and 10 µm), the fine fraction is PM 0.1-2.5 (aerodynamic diameter between 0.1 and 2.5 µm), and the ultrafine fraction; PM0.1 (aerodynamic diameter less than 0.1 µm) (Bérubé et al., 2006; Skúladóttir et al., 2003; Akselsson et al., 1994, p 78). In some studies, there is a distinction between primary particles or aerosols directly emitted from the source, and secondary particles or aerosols which are formed when primary pollutants react with the atmosphere, or each other to form other components or larger particles. The size fraction indicates the origin of the particle. The ultrafine fraction is formed in anthropogenic processes, like engine combustion, whereas the fine and coarse fraction particles are made up of primary natural aerosols or formed in 3 mechanical processes, for example from the wear of car tires on asphalt paving (Akselsson et al., 1994; WHO, 2013). Cocktail effects Figure 2 Reykjavík seen from the north on a day with high levels of PM due to a dust storm (top) and on a day with clear skies (below) (image: Hanne Krage Carlsen). Most research has focused on identifying the health effects of single pollutants, while adjusting for the effects of other pollutants. However, cocktail effects are known from research in other areas of toxicology and are beginning to appear within the field of air pollution studies. Recent research methodology moves in the direction of a more holistic approach using interaction models to appreciate these effects (Dominici et al., 2010), but only a few studies have applied these methods so far, and with conflicting results (Bobb et al., 2011; Yu et al., 2013; Anderson et al., 2012). 4 1.1.2 Dust and sand storms Desert regions or areas with little vegetation are prone to erosion from both wind and precipitation. Dust particles are lifted from the surface by the wind. The size, weight and physical properties of the particles determine how easily they are uplifted. Spores from fungi or bacteria have been found on the surface of natural particles. These may affect ecosystems far from their home regions, or work as allergens (Kellogg and Griffin, 2006). There are examples of Asian dust storms that drift around the globe with the wind (Uno et al., 2009). Globally, the major dust contributors are the Sahara and Gobi Deserts (Kellogg and Griffin, 2006). In recent years dust from Iceland´s glacial outwash plains has been recognized as a significant contributor to dust in the North Atlantic region (Prospero et al., 2012; Bullard, 2013). 1.1.3 Geothermal areas and hydrogen sulfide Hydrogen sulfide (H2S) is a clear gas with the characteristic smell of rotten eggs. H2S is abundant in geothermal areas. Geothermal areas with hot springs, mud volcanoes and geysers are the surface manifestation of an underlying cooling magma chamber. H2S is released from the harnessing of geothermal energy (figure 6). H2S is also found as a biproduct of drilling and refining of oil and gas and of some industrial processes like paper production (Campagna et al., 2004). 1.1.4 Volcanic eruptions Volcanoes are the surface manifestations of Earth’s inner thermal processes. Solid, liquid or gaseous products, magma, from the molten part of the core break through the earths crust and disperse as either lava, tephra, or ash. The world's most active volcanoes are distributed along continental plate margins (e.g. Japan, the Andes, and Indonesia in the Ring of Fire) or over hot spots or mantle plumes that rise up from the underlying mantle (e.g. Hawaii, Réunion). Iceland represents a mixture of the two forms of volcanism as it is located on the oceanic plate boundary between the North American and Eurasian plates above a mantle plume. Volcanic ash refers to the small particles (<2mm in diameter; particles larger than 2 mm are called tephra) emitted from volcanic eruptions. Volcanic ash forms in eruptions of a certain magnitude as explosive energy is necessary to produce and emit the small particles. In particular when water is present, explosive energy is released from the molten rock to the water, and the rock explodes into small fractions. Ash particles can have very different 5 characteristics depending on the chemical properties of the magma and the mode of eruption (Francis and Oppenheimer, 2004). During a volcanic eruption, fine ash remains suspended in the air and is dispersed via the eruption column. Volcanic ash can be characterized as PM (see figure 3). Fresh, unweathered ash particles can carry other corrosive chemicals on the surface and are likely to have a larger surface area than dust particles from other sources (Gíslason et al., 2011). Figure 3 The ash plume of Eyjafjallajökull May 7 2010. The ash contained as much as 20% PM10 (image: Hanne Krage Carlsen). 1.1.5 Other sources The study of indoor air pollution is a field in its own right. In the Western world, the main indoor air quality concerns include smoking, mold and spores, particles produced during cooking, and chemical exposures e.g. from paint. Burning biomass fuel (coal, wood, peat and dried manure) inside for heat or cooking has been largely abandoned in the Western world, but remain a major concern in the developing world where indoor combustion particles constitute the second largest environmental risk factor after smoking (Lim et al., 2012). Wild fires in nature are also a significant source of particles, both locally and regionally (Emmanuel, 2000; Naeher et al., 2007; Künzli et al., 2006). 6 1.2 Air pollution effects on health 1.2.1 Pathways The main effects of air pollution on the body are found in the cardiopulmonary system. The respiratory system is most exposed as humans breathe circa 20 m3 of air per day. The inhaled air enters the nose or mouth, goes into the bronchi, the bronchioles and the alveoli, where inhaled oxygen (O 2) is exchanged through the epithelium of the alveolar wall. From there O 2 goes into the bloodstream, which delivers it to the cells in the body. Carbon dioxide (CO2) from the cells is exchanged in the opposite direction, to the exhaled air (WHO, 2000 p 16). Figure 4 Overview of the respiratory system and particle deposition (image: Hanne Krage Carlsen/Creative Commons). The nose works as a barrier for larger particles which impact inside the nose or get caught by the nasal hairs (Eccles, 2006) but particles smaller than 10 µm can enter the respiratory system along with air and gases. Further into the airways, particle deposition depends on the respiration rate, particle sizes and chemical and physical properties of the particles, but only the smallest particles (PM<1 µm) can reach the alveoli and become deposited there (figure 4) (Akselsson et al., 1994). Once in the respiratory system, the air pollution affects first the lungs, and in turn, the cardiovascular 7 system (see figure 5). Research in animals indicates that the smallest particles also reach other organs (Kreyling et al., 2010). Adverse effects from exposure to air pollution can be more severe in susceptible individuals. These are often considered to be the very old and very young, or individuals with a pre-existing condition which makes them more sensitive to exposure to air pollution, such as obstructive lung disease, which is described below. Obstructive lung disease Asthma affects a substantial proportion of the world’s population; the rates are highest in the Western world, especially among Europeans (To et al., 2012). Asthma is an inflammatory disorder where the airway walls react with bronchial hyperresponsivity (BHR), restricting the diameter of the airways, and patients experience difficulty exhaling, called obstruction (Holgate et al., 2010). Wheezing, dyspnea, chest tightness and cough are common symptoms (D’Amato et al., 2005), but asthma has a number of clinical expressions (Janson et al., 2008). In allergic asthma, BHR occurs as a reaction to stimuli such as allergens. Asthma management revolves around quick-relief medications such as short acting β-agonists and longer acting medications like corticosteroids. Asthma is a heterogeneous disease which can be exacerbated by infectious disease epidemics, climate, and exercise, but more importantly, exposure to allergens and air pollution (von Mutius and Braun-Fahrländer, 2002). In asthma, some air pollution types can act directly as irritants to the airways, but another possible mechanism suggests that air pollution damages the cells in the epithelial wall of the alveoli, inducing an inflammatory response, which increases the penetrability so that PM and harmful gases can pass through into the blood serum (von Mutius and BraunFahrländer, 2002; Holgate et al., 2010). Asthma and chronic obstructive pulmonary disease (COPD) share a number of risk factors such as a family history of asthma, but COPD primarily develops in adults with a history of smoking (de Marco et al., 2007). COPD can have a wide range of clinical expressions, but in general the alveolar tissue breaks down, and in patients with COPD increased levels of several inflammation markers were associated with worse lung function after adjusting for other risk factors (Thorleifsson et al., 2009); other studies in healthy individuals found stronger effects in men than in women (Ólafsdóttir et al., 2007; Ólafsdóttir et al., 2011). The COPD diagnosis is based on results from lung function tests, specifically the ratio between the Forced Expiratory Volume in 1 second 8 (FEV1) and Forced Vital Capacity, FVC (FEV1/FVC). Staging of COPD is based on how low the FEV1 is. COPD is a rather common disease in older smokers. A wide variation in prevalence was found in an international study by Buist and colleagues (2007) and poverty and socioeconomic status also play an important role (Burney et al., 2013). Many COPD patients experience exacerbation with irritation symptoms when exposed to irritants, such as high air pollution levels (Yang et al., 2005; Halonen et al., 2008). Figure 5 Suggested biological pathways for health effects of air pollution to different parts of the circulatory system (image: Hanne Krage Carlsen/Creative commonts). 9 Cardiovascular disease Both long-term and short-term exposure to air pollution has been associated with cardiovascular health effects of air pollution (Pope and Dockery, 2006). The processes leading to a cardiovascular event like a cardiac infarction, such as building up of plaque in the blood vessels, can take decades. However, the mechanisms that trigger cardiovascular events in a susceptible population may work in a matter of days or hours. The risk factors for the two processes may not be the same (Künzli and Tager, 2005; Künzli et al., 2011). Several pathways and mechanisms have been suggested for these health effects (Sun et al., 2010). First, the immune system responds to the air pollutants in the respiratory system. Inflammation biomarkers are increased after exposure to air pollution (Delfino et al., 2009). Inflammation is associated with accelerated formation of atherosclerotic plaque (Künzli et al., 2011), and increased blood viscosity, causing thrombosis (Pope and Dockery, 2006; Gold and Mittleman, 2013). A destabilized atherosclerotic plaque can disrupt in the cardiac artery wall and start the formation of a clot which obstructs the blood flow to the heart’s muscles and cause a cardiac infarction. Other suggested pathways for effects of air pollution include disturbance in the cardiac autonomic function which controls the heart rate, and in the vasomotor function that controls the widening and narrowing of blood vessels (Sun et al., 2010). Nearly all cardiovascular risk factors also increase the long-term risk of developing stroke. On a shorter time scale, increases in blood viscosity and clotting factors, along with disturbances in the heart’s autonomic function, also increase the risk of ischemic stroke (Gold and Mittleman, 2013). Disturbances in vasomotor function and damage to the blood vessels may increase the risk of hemorrhagic stroke after short-term increases in air pollution exposure levels (Yorifuji et al., 2011). Other health outcomes Exposure to natural hazards like volcanic eruptions is associated with increased risk of stress, depression and fatigue (Shore et al., 1986), some factors probably related to the loss or damage to property or livestock, crop failure and general insecurity imposed by living near an active volcano (Tobin et al., 2012). However, exposure to natural disasters is generally less likely to result in post traumatic stress disorder (PTSD) than exposure to acts of terrorism or war (Bracha, 2006). 10 In recent years more associations between chronic exposure to air pollution and health effects outside the cardiovascular system have been found, such as the development of dementia (Forsberg et al., 2013), and giving birth to a child with autism spectrum disorders (Volk et al., 2014). However, these findings are novel and it is uncertain whether they represent correlation rather than causation. 1.2.2 Evidence from epidemiological studies Traffic-related pollution Short-term changes in levels of traffic-related air pollutants like PM10 are associated with increased mortality rates (Meister et al., 2012) and respiratory disease hospital admissions (Peng et al., 2008). Short-term exposure to increased levels of fine particles, PM2.5, is associated with increased hospital admissions for cardiovascular events (Pope et al., 2006; Pope et al., 2008). Long-term exposure, or living in an area with higher levels of total PM and fine PM, is associated with higher mortality rates and reduced life expectancy (Dockery et al., 1993; Pope et al., 2009), and higher risk of a cardiac infarction attack in women (Miller et al., 2007). Exposure to air pollution from traffic is associated with stunted lung growth in children (Gaudermann et al., 2007). Exposure to short-term increases in traffic pollution, PM10, O3, SO2, NO2, exacerbates already existing asthma in adults and children (Antó et al., 2012; Samoli et al., 2011) and is associated with increased emergency room visits and hospital admissions for asthma (Villeneuve et al., 2007; D´Amato et al., 2005), and COPD (Sunyer et al., 2000; Yang et al., 2005). Long-term exposure to traffic pollution in urban areas is associated with increased risks of developing asthma in children (Gaudermann et al., 2007; Bråbäck and Forsberg, 2009; McConnell et al., 2010), but whether adults are also at increased risk is debated (Anderson et al., 2013; Jacquemin et al., 2012). Short-term increases in air pollution levels are associated with increased mortality risk in COPD patients (Sunyer et al., 2000) and an increased risk of being admitted to hospital (Yang et al., 2005). Long-term exposure to trafficrelated air pollution is associated with increased risk of hospitalization for COPD (Andersen et al., 2011) and development of COPD in women (Schikowski et al., 2014). 11 A short-term increase in PM2.5 exposure is associated with increased risk of cardiovascular events and cardiovascular mortality (Brook et al., 2010; Sun et al., 2010; Gold and Mittleman, 2013). Short-term exposure to gaseous pollutants is associated with adverse changes in heart rate, arrhythmia indicators (Devlin et al, 2003) and inflammatory markers (Sun et al., 2010; Gold and Mittleman, 2013; Chuang et al., 2007). Long-term exposure to higher PM2.5 levels at the residence is associated with increased risk of developing hypertension which is associated with other adverse cardiac outcomes (Chen et al., 2013). Short-term exposure to PM2.5 and NO2 is associated with increased risk of stroke (Yorifuji et al., 2011; Gold and Mittleman, 2013). Studies of exposure to short-term changes in O3 show only associations with ischemic stroke in men (Henrotin et al., 2007; Henrotin et al., 2010). Long-term exposure to PM10 also increases the risk of stroke (Oudin et al., 2010), whereas results regarding exposure to background NO 2 are not in agreement (Oudin et al., 2009; Andersen et al., 2012). Mineral dust and sand storms Dust storms are considered a natural source of pollution, though erosion, the main cause of dust storms, is facilitated by human activities (Morman and Plumlee, 2013). As the health effects of the particles are highly dependent on the origin, these studies are presented by region. In Anchorage, Alaska, US, high levels of PM from geological sources, some from a volcanic eruption, have been associated with increases in bronchitis, upper respiratory infection and asthma medical visits (Choudhury et al., 1997; Gordian et al., 1996). People under 20 had increased risk of outpatient asthma visits and anti-asthma medication (beta-agonists) and same day, and weekly median exposure to PM pollution (Chimonas and Gessner, 2007). School nurse anti-asthma medication dispensing was associated with PM levels in the preceding days (Gordian and Choudhury, 2003). Studies of dust storms in the desert regions of the US in the 1930s have shown that there was an association between dust events and hospitalizations for respiratory illness (Morman and Plumlee, 2013; Hefflin and Jalaludin, 1994). Dust storms in Sydney, Australia were associated with a 15% increase in mortality (Johnston et al., 2011). Asian dust storms have their origin in the desert regions of China and Mongolia and contribute to pollution in the Asian mega-cities (Chan and Yao, 2008); the dust is carried across the Pacific Ocean and has been measured 12 in the northern US (Duce et al., 1980). Associations have been found between Asian dust storms and increased mortality in Taipei and Korean cities (Chan and Ng, 2011; Lee et al, 2013) and increased risk of emergency hospital admissions for COPD (Tam et al., 2012). Saharan dust particles have been associated with increased risk of pediatric asthma admissions, hospital admissions for meningococcal meningitis, adverse birth outcomes, and cardiopulmonary disease mortality in large cities in southern Europe (Karanasiou et al., 2012). Most notably, Pérez and colleagues (2012) found that the increase in mortality was higher when Saharan dust was present in the PM pollution, than when the PM had a traffic-related origin (Pérez et al., 2012). Hydrogen sulphide The toxic effects of H2S in occupational settings are well known (WHO, 2000). H2S works as a signalling molecule in the human body and is involved in several organ systems, notably the respiratory system (Olson, 2011), but the mechanisms are not yet known. Figure 6 The emissions from a geothermal power plant contain H2S (image: Hanne Krage Carlsen). Industrial sources A high H2S level from a wastewater treatment facility was associated with increased risk of asthma hospital visits the following day (Campagna et al., 2004). Long-term exposure to H2S emitted from mostly industrial sources (oil refinery, cheese plant, natural oil and gas wells, and a sewage plant) was associated with adverse neuropsychological effects in residents around the 13 plants (Kilburn and Warshaw, 1995; Kilburn et al., 2010). Living in areas exposed to H2S from pulp- and sawmills is associated with increased sensory organ irritation symptoms and headaches (Jaakkola et al., 1996; ParttiPellinen et al., 1996; McGavran, 2001). A 2003 report (Roth and Goodwin, 2003) called for better reporting of exposure and more studies of chronic, low-level exposure and studies on asthmatics. Geothermal sources The epidemiological studies of respiratory effects from exposure to H 2S from geothermal sources have conflicting results (McGavran, 2001). Exposure to volcanic gases, H2S among them, from geothermal areas and volcanoes that are not erupting is associated with incidences of respiratory cancers and respiratory illness, and respiratory mortality but not childhood asthma or decreased lung function. Furthermore, most studies have a moderate or high risk of bias because of the study design or methods of surveying; e.g. self-reporting can be very biased by beliefs about the health risks of exposure. Also, many studies lack information about important confounders (Hansell and Oppenheimer, 2004) Short-term exposure to increased H2S levels is not associated with dispensing of medication for angina pectoris the following 7 days (Finnbjornsdottir et al., 2013). In a trial where healthy volunteers were exposed to H2S, only minor sensory and cognitive effects were found (Fiedler et al., 2008). Studies of long-term effects of exposure to background sulphur gases from geothermal sources in Hawaii, New Zealand and the Azores, H 2S among them, indicated that long-term exposure is associated with adverse cardiopulmonary effects, both measured and self-reported (Durand and Wilson, 2006; Longo et al., 2008; Longo and Yang, 2008; and Longo, 2009) and increased rates of bronchitis (Amaral and Rodrigues, 2007; Longo et al., 2008). No association was found between chronic exposure to H 2S in residents in a geothermal field and self-reported asthma symptoms (Bates et al., 2013). In the same cohort, no neuropsychological effects were found (Bates, 2013). Volcanic eruptions Human dwellings are clustered around volcanoes in many parts of the world, since volcanic soils can be very fertile and humans also utilize the warm water and geothermal heat. Worldwide, 500 million people live within 100 km 14 of an active volcano (Small and Naumann, 2001). In Iceland, the corresponding number makes up 95% of the population. During the 20th century nearly 100,000 people were killed directly by volcanic eruptions and more than 4.5 million people were affected or displaced (Doocy et al., 2013). Volcanic eruptions pose immediate dangers to human health when pyroclastic flows and lahars (mud flows) reach inhabitated areas (Hansell et al., 2006; Heggie, 2009). Active volcanoes emit various sulfur compounds like SO2 and H2S, CO2, and acid aerosols. Exposure to volcanic aerosols from African, and West Indian volcanoes was associated with asthma and COPD exacerbations in studies from before 2004 (Hansell and Oppenheimer, 2004). Gases from volcanic eruptions The residents of the village Miyake, Japan, were forced to evacuate from their homes when Mt. Oyama erupted in 2000 because of the dangerous or lethal levels of gases (Iwasawa et al., 2009). The residents began to return in 2005, and groups of volunteers came with them to help them re-establish the community even though the volcano still emitted large amounts of SO 2. The adult residents (n=823) were surveyed in 2004 before they began to return to their homes and again after their return to the island in 2006. After returning, the adults had no deterioration in lung function, but the prevalence of cough and phlegm was higher. Those in the areas with higher levels of SO 2 had more symptoms (Iwasawa et al., 2009). The self-reported incidence of cough, other throat symptoms and breathlessness showed a dose-response association with SO2 exposure in healthy volunteers working in the areas. Women were generally more susceptible (Ishigami et al., 2008). In a followup 6 years later, those living in the areas with higher levels of SO 2 were associated with lower than expected lung function in adults (Kochi et al., 2013) and irritation symptoms in children (Iwasawa et al., 2013). There are few studies of short-term exposure. A 2009 increase in volcanic activity lasting 14 weeks in Hawaii’s Kilauea volcano provided the frame for a natural experiment, following the increase in emissions, which were as high as three-fold; there was an increase in respiratory complaints and headaches, especially in the elderly and native Hawaiians (Longo et al., 2010). In a review article summarizing results from previous studies, Longo et al., (2009) also report that some 35% of 335 people surveyed in a questionnaire study found their health to be affected by the eruption. Current and former smokers and people with chronic respiratory disease were most 15 affected. In a follow-up in 2012, exposed individuals reported a more than 15fold increase in irritation symptoms while being outdoors (Longo et al., 2013). Volcanic ash Volcanic ash (figure 7) can damage vegetation and cause buildings to collapse and injure or kill people (e.g. due to bad visibility, figure 7). Inhalation of ash, skin abrasion and eye irritation are the main long-term concerns to human health. Though fine volcanic ash can be considered a form of PM10, it is not certain if the dose-response functions which have been developed from traffic-related PM apply to volcanic ash (Oudin et al., 2013). Both the physical and chemical characteristics of volcanic ash vary greatly between volcanoes and eruptions (Horwell and Baxter, 2006). Figure 7 Ash from the Eyjafjallajökull eruption causes bad visibility mid-day May 7, 2010 (image: Hanne Krage Carlsen). The short-term health effects of exposure to volcanic ash range from none to region-wide epidemics of asthma and respiratory symptoms. A similar range was found in the clinical and toxicological studies. The major effects seem to be short-lived and depend very much on the properties of the ash (Horwell and Baxter, 2006). After a 28-day long eruption of Guagur Pichincha in Ecuador in 2000, Naumova et al. (2007) studied the pediatric hospital emergency room (ER) 16 visits in the city of Quito. In the weeks following the April eruption there was a significant increase in diagnosed primary respiratory conditions. The risk of lower respiratory infection was doubled and for upper respiratory infection, the risk was increased 70%. The effect was larger in small children and the rate of asthma diagnoses doubled. Following a large eruption of Mt. Ruapehu in New Zealand in 1996, ash was detected in the air near large cities 200-300 km from the volcano. Hospital records were later examined and researchers found the highest rates of respiratory mortality for the 1990's for these cities during one month following the eruption. Researchers concluded that the ash was responsible for the excess respiratory mortality (Newnham et al., 2010). Shimizu et al. (2007) surveyed 236 adult asthma patients from an area exposed to ash from an eruption of Mt. Asama in Japan. In the most exposed region, where more than 100g/m2 ash fell, about half of the patients with asthma reported worsening, their spirometry (lung function) measurements were lower and they used more medication. Mental health The natural forces unleashed during a volcanic eruption mean that experiencing a volcanic eruption can be a traumatic event as individuals fear for their own lives and the lives of their neighbors. The mental health effect following the eruption of Mount St. Helens included increased ER visit rates, increased use of mental health services and domestic violence, also increased self-reported stress and mental health problems in those who had lost a friend or relative in the disaster; and up to ten-fold increases in levels of anxiety, stress and major depression in people who had experienced damage to property (Shore et al., 1986) Studies of survivors of a deadly eruption of Mt. Unzen, Japan, had very high rates of adverse mental health which subsided with time (Ohta et al., 2003). Societies near volcanoes with catastrophic eruptions who are exposed over many generations incorporate stories of the disasters into their myths and cosmology which help future generations understand and recover in case of disaster (Cashman and Cronin, 2008). 1.3 Respiratory health and air pollution in Iceland Historically, asthma and allergic disease prevalence have been low in Iceland (Gislason et al., 2002), but both asthma symptom prevalence and use of asthma medication increased in adult Icelanders between 1990 and 2007. However, it is unclear if this increase has been due to changes in diet, 17 smoking, higher diagnosis rates, or other factors (Sigurkarlsson et al., 2011). The prevalence of COPD in Iceland was found to be 18% in individuals over 40 years of age (Benediktsdóttir et al., 2007), Only a few studies have addressed the association between air pollution and human health in Iceland. First, The European Community Respiratory Health Study (ECRHS; Burney et al., 1994), which Iceland has participated in for a number of years (Gíslason et al., 2002), showed that chronic bronchitis and phlegm increased in participants exposed to high levels of NO 2 at their residence and who lived close to major roads (Sunyer et al., 2006). A study using pharmaco-epidemiological methods found associations between dispensing of angina–pectoris relief medication and levels of O 3 and NO2 (Finnbjornsdottir et al., 2013). Iceland's capital area has a reputation for being among the cleanest capitals in the world. There is little industrial pollution and geothermal energy has replaced the use of fossil fuels for space heating. There is considerable traffic-related air pollution (Jóhansson, 2007; UHR, 2007). The capital area of Iceland covers around 700 km2 (National Land Survey of Iceland, 2012) and most of the city is characterized by low houses usually two to three stories high. As of 2011, there were nearly 200 000 inhabitants of which 150,000 were old enough to have a driving license (18 years of age, Statistics Iceland, 2013a). The air pollution regulation is based on health limits in the EU (Table 1; Althingi, 2002; Altingi, 2003), except for H2S. H2S Health Limit Regulations were implemented in Iceland in 2010 (Althingi, 2010) and were based on regulation from other locations with occurrence of H 2S, such as Hawaii (Department of Health, Hawaii, 2001). In the capital area, there were 134,000 passenger cars in 2006 (newest available, Statistics Iceland, 2013b), which makes 9 cars per 10 adults, one of the highest car to people ratios in the world (Laych et al., 2009). Car use is an ingrained part of Icelandic culture (Collin-Lange, 2013), and the infrastructure of the capital area is very car-oriented. The levels of NO2, a traffic indicator pollutant, are significant around major roads (Sunyer et al., 2006). O3 levels in Iceland tend to be higher in early spring, which is believed to be related to atmospheric conditions in the Arctic (Solberg et al., 2005). PM10 levels in Iceland’s capital area are mainly trafficrelated, so particles are resuspended during drier periods (UHR, 2007; Johansson, 2007). Another contributor to PM is vehicles which are driven 18 with studded tires during winter. The tire studs wear the asphalt into small particles which mix with the salt and sand which is spread on roads and pavements during winter to prevent skidding. Table 1 Air pollution health limits in Iceland (µg/m3). Act no./Year 24-hour µg/m3 H2S 514/2010 50 NO2 251/2002 75 O3 745/2003 120 PM10 251/2002 50 a 1-hour µg/m3 Allowed exceedencesb 5 110 a 175 25 7 a Maximum 8 hour mean. b Allowed exceedences is a target for the number of times the health limit may be surpassed, 2010 is given as an example. 1.3.1 Mineral dust sources During the warmer season, dust storms originating in South Iceland areas with scarce vegetation are a more common source of PM 10 than urban sources. Twenty-two % of Iceland has little or no vegetation and is characterized as an arctic desert. Dust storms are frequent in the highlands (Dagsson-Waldhauserowa et al., 2013). Dust storms in Iceland originate in the sand plains of the south and affect the air quality of the capital area to the west (see figure 2; Thorsteinsson et al., 2011). The dust is mainly basaltic glass (Arnalds, 2010) and dust storms from the east/south-east now include a substantial contribution of ash from the Eyjafjallajökull eruption (Arnalds et al., 2011; Arnalds et al., 2013; Thorsteinsson et al., 2011). 1.3.2 Hydrogen sulfide H2S is emitted naturally, but with the opening of the geothermal harnessing sites at Hellisheiði and Nesjavellir, 25 and 35 kilometres from the capital, the levels have risen substantially (Ólafsdóttir and Garðarsson, 2013; Ólafsdóttir et al., 2014). H2S levels measured in the city have not been found in levels which are known to be toxic from studies of occupational exposure, but they routinely surpass the WHO nuisance guideline value of 7µg/m3 (WHO, 2000) and Iceland’s own H2S regulation. 19 Figure 8 Hellisheidi geothermal powerplant seen from the north (image: Hanne Krage Carlsen). 1.3.3 Icelandic volcanoes Iceland experiences a volcanic eruption every 5 years on average. Most are small and have little impact beyond the very local environment (Thordarson and Höskuldsson, 2002). Iceland is thankfully rather sparsely populated, so in most cases, there is no danger to human life or health, but there are a few exceptions which will be discussed here. Laki/Skaftáreldar 1783-1784 The 1783-4 eruption of the Laki fissure was the most fatal in historical times in Europe and produced the largest lave flow on Earth in historical times. First, the acid gas and aerosol fog from the eruption and subsequently degassing lava led to an atmospheric haze that persisted into 1786 (Lacy, 1998) and caused an increase in respiratory mortality, first and foremost in Iceland and northern Europe. The sulfur haze lay over Europe and even Asia and North America as well, where the gases reduced the sun-light and caused crop failure. In Iceland, at least half of the livestock died off, and onefifth of the population died (Hansell and Oppenheimer, 2004; Tweed, 2012). In Europe and Alaska famine disasters were described, caused by colder climate and acid rain (Jacoby et al., 1999; Durand and Grattan, 2001; Hansell and Oppenheimer, 2004). In England, 20,000 were estimated to have died from the indirect effects of the Laki eruption (Witham and Oppenheimer, 20 2004). If a similar eruption happened today, it is estimated that it would cause hundreds of thousands of deaths (Schmidt et al., 2011). The 2010 Eyjafjallajökull eruption The Eyjafjallajökull stratovolcano in South Iceland had been dormant since an eruption in 1821-23 (Figure 9). After years of increasing seismic unrest, the Eyfjafjallajökull volcano erupted on March 20, 2010 in a flank eruption with basaltic effusive lava fountains. A magma intrusion triggered the April 14 explosive eruption of the summit crater which produced large amounts of fine ash (Sigmundsson et al., 2010). In the first hours, the main concern was flood risks, as the glacier melted quickly and the water came down the volcano into the Markarfljót River. Inhabitants of low-lying areas were evacuated. Figure 9 The Eyjafjallajökull volcano 2008 (left) and 2010 (right) (image: Hanne Krage Carlsen). The ash dispersed over a wide area with prevailing westerly winds. The ash was fine during the first eruption phase, with about 20% 10 µm or less in aerodynamic diameter (Institute of Earth Science, 2010; Thorsteinsson et al., 2011; Stohl et al, 2011; Gislason et al., 2011; Gudmundsson et al., 2012). The ash particles from Eyjafjallajökull had a large surface area, and had a potential to increase inflammation markers (Horwell et al., 2013). The ash had a high iron (Fe) content, and was found in cytotoxicological studies to have effects on alveolar macrophage function which led to increased bacterial growth in vitro (Monick et al., 2013). Ash from other Icelandic volcanoes also has high iron content (Dagsson-Waldhauserowa et al., 2013). 21 In the period after the eruption some of the most extreme wind erosion events on earth were recorded in South Iceland (Arnalds et al., 2013). PM dust levels were higher in the area surrounding the volcano and in the capital Figure 10 Composition of ambient PM10 in Reykjavík 2003 and 2013 (Image: Hanne Krage Carlsen adapted from Skúladóttir et al., 2003 & Vegagerðin, 2013). area more than 100 km from the volcano (Thorsteinsson et al., 2011; Thorsteinsson et al., 2012). Volcanic ash is now a significant contributor to PM10 in the capital area (Vegagerðin, 2013, Figure 10). As we have seen, the population of Iceland is exposed to significant air pollution both from traffic-related air pollution and pollution from natural sources such as geothermal harnessing and volcanic eruptions. The health effects of these remain un-investigated. 22 2 Aims The aim of this project was to determine if, and to what extent, residents in Iceland experience adverse health effects from air pollution. The target populations are the residents of the Icelandic capital area, who are mainly exposed to traffic-related air pollution, and the residents of South Iceland, who were exposed to volcanic ash from the 2010 Eyjafjallajökull eruption.The overarching research question of the articles is: do the residents of the capital area or South Iceland experience adverse health effects due to air pollution from traffic or urban sources, or the volcanic sources of ash or H 2S? Specific aims for each paper: I. Were the daily number of individuals obtaining prescribed antiasthma medication in Reykjavík associated with changes in daily air pollution levels the previous 14 days during the period 2006-2009? II. Were 2003-2009 emergency room visits and acute hospital admissions (emergency hospital visits) for cardiopulmonary disease and stroke, associated with daily air pollution levels in Iceland's capital area. Were any subgroups (elderly, women) more vulnerable than others to the exposure? III. Were the association between emergency hospital visits and PM 10 modified by the source of PM10 pollution (natural dust, volcanic ash or other), or the introduction of volcanic ash from Eyjafjallajökull or Grímsvötn? Also, was there an association with H2S levels? IV. Was the health of 207 individuals exposed to the Eyjafjallajökull volcanic eruption surveyed with lung function measurements, questionnaires and physician's evaluation associated with adverse health effects? V. Was exposure to the eruption of Eyjafjallajökull associated with increased rates of respiratory- and mental health symptoms six months after the eruption in the population of South Iceland compared to a demographically matched reference group in North Iceland? Did the reported symptom rate correspond to the level of exposure within South Iceland? 23 3 Materials and methods The studies in this thesis fall into two categories, on one hand studies of short-term effects where time series methods and register-data are used to study associations between pollution levels and a health outcome. On the other hand, there are studies of chronic exposure in South Icelanders exposed to the Eyjafjallajökull volcanic eruption; these use survey or questionnaire data and employ logistic regression and descriptive statistics to analyze the data. The following section first lists the data sources used and types (see table 2), followed by presentation of the methods used in the two types of studies (see table 4). 3.1 Data sources 3.1.1 Exposure Air pollution in Reykjavík The air pollution exposure variables used in papers I, II, and III were routinely measured air pollution levels in Reykjavík. The data were measured at one site in the geographical centre of the town (Figure 11). Data from other measuring stations were not of sufficient quality and were not used. Figure 11 Reykjavík and surrounding area with main pollution sources and measuring stations (Adapted from paper II). 25 The data were collected, validated and corrected and provided as 30 minute or 60 minute means by the Environmental Branch of the City of Reykjavík (data for 2003-2008) and the Environmental Agency of Iceland (data from 2009 and later). We chose four pollutants which have known health effects and which are indicative of the pollution mix in Reykjavík; PM10, NO2, O3 and H2S. H2S measurements only began in February 2006 and ozone measurements were incorrect from 2010 and onwards (see Figure 15). As covariates, we included weather and pollen counts. In addition, we obtained information about sources of PM 10 from the Reykjavík Municipality Environmental Branch and Dr. Thorsteinsson and Rebekka Kienle, both University of Iceland (personal communication, Thröstur Thorsteinsson, 29 oktober, 2012). Eyjafjallajökull Exposure to the Eyjafjallajökull volcanic eruption (papers IV and V) was multifaceted as the population was exposed first to hazards in the form of flood risk, and after the immediate flood risk subsided the ash fall became the major concern. At the same time noise from the explosion of the eruption column could be heard hundreds of kilometers away in some directions. Earthquakes were frequent during the eruption, as is to be expected. The degree of exposure to the ash was estimated from knowledge of the ash plume thickness and wind direction during the eruption (Figure 12). Figure 12 Ash dispersion around Eyjafjallajökull (left) and the exposure areas based on it (right) (Image: Thorsteinsson, from Paper IV and V). 26 3.1.1 Health outcomes To measure health in a population it is most useful to use an outcome measure which is both a good indicator of the outcome of interest and which is sensitive, meaning that it has considerable variation and correlation with the exposure. It is necessary to have both a reliable end point and a meaningful number of events so that the study will have sufficient statistical power. Papers I, II, and III are register-based studies meaning that they make use of data which are collected routinely in registers (Wallgren and Wallgren, 2007). This method is useful in studies when large amounts of data are needed as the data are already collected, so that the data can be gathered quickly and cheaply. A caveat is that the data were not originally intended for research purposes; usually there are only limited possibilities of adding variables of interest to research. An overview of the data used in each study can be found in table 2. Hospital admissions Hospital admissions are rather rare events, and this outcome is also governed by factors which are not related to the actual morbidity, such as the availability of hospital beds, socio-economic and geographic factors like age, or whether the patient lives far from the hospital or has relatives living nearby. Emergency room visits are less influenced by availability, but are rather unspecific. The differences between hospital admissions and ER visits for asthma and other respiratory causes and in different age groups have been investigated by Winquist et al. (2012). The data on ER visits and admissions used in papers I and II were collected in the Landspitali University Hospital patient data base. The data are registered to each individual using the personal identification number in the database. When the data were extracted from the database, the identification number was coded into a number in such a way that an individual could be recognized only within the data. The data for acute ER visits and admissions for the relevant diagnoses were extracted along with information about gender, age, day of admission/visit, duration of admission (if admitted), and the primary and secondary diagnoses. The address was indicated by a postal code. The ICD codes (letter and first two digits) that were extracted were: pulmonary outcomes: J20-J22, J40-J46 and J96; cardiac: I20-I27, I46, I48, I50; stroke: G45-G46, I61-I69. 27 Pharmaceutical dispensing Pharmaceutical dispensing, used in paper I, of relief medication for asthma (R03 in the anatomical therapeutic classification (ATC) is considered an indirect indicator for respiratory health in a population. In an American study emergency room visits for asthma were found to be well-correlated with dispensing of asthma medication (Naureckas et al., 2005), but this may not be true for other populations with better access to primary care. Other papers (Hallas, 2005) and a recent review (Menichini and Mudu, 2010) have treated the subject in detail. A caveat of using anti-asthma medication dispensings as an indicator is that they are given as relief for a wide range of respiratory illnesses, so there is little specificity to asthma. Also, these medications are often dispensed in volumes deemed to last approximately 3 months (Gíslason et al., 1997). In a time series study looking at short-term effects, at any given day, only a small part of the population will actually be at risk of having to refill their prescriptions. Databases of prescription medicine dispensing are kept in many countries, so data are available retrospectively. As these register the sale of the drugs in the pharmacy, rather than when the medication is actually taken, they are less reliable than other outcomes. The Icelandic prescription drug database goes back to 2003 and was established for surveillance purposes (Icelandic Directorate of Health, 2012). It has since then been used in several research papers. From these data, a time line of the daily number of individuals who received anti-asthma drugs was created. Spirometry Spirometry is a measure of lung health, where the flow and volume of exhaled air is measured. Some of the important measures are forced vital capacity (FVC), which is the maximum amount of air exhaled after filling the lungs as much as possible. Forced expiratory volume in 1 second, FEV 1, is the amount of air exhaled in the first second (GOLD, 2010), which is a measure of airway obstruction. Spirometry values depend highly on gender, age, and height, so most often the results are reported as percent of a predicted value (usually the average found in a general population sample, e.g. NHANES, Hankinson et al., 1999). Low spirometry values are indicative of lung disease, but can also be due to respiratory infections. Spirometry was used in paper IV. 28 Self-reported health Self-reported health outcomes were used in paper IV and V. In questionnaires, study participants were asked to rate their own health. Most often these include questions if the subject has experienced easily recognizable symptoms and to what degree. In the studies in this thesis we have used questionnaires or questionnaire items which have already been used in other studies, which facilitates comparisons of the results with the results from other studies. Questions about respiratory health were drawn from the European Community Health Survey (ECRHS, Burney et al., 1994). The General Health Questionnaire-12 question version (GHQ-12) measures psychological morbidity which has been validated in several populations and has been used in other studies (Goldberg et al., 1988; Goldberg et al., 1997). GHQ had previously been used in Iceland (Tómasson and Gudmunsson, 2009), so a translated version was available. Other outcomes Mortality from any cause is an indicator of health in a population, if most deaths are due to natural causes; this outcome is useful as an indicator for health in a population (Logan, 1956) whereas in countries with a high mortality due to causes other than natural, it is less useful. It is preferable to use non-accidental mortality (that is, excluding deaths due to external causes) or cause-specific mortality where researchers typically select cardiopulmonary causes, which is used in many studies (Dockery et al., 1993; Halonen et al., 2010), but as this is a rare outcome it requires a population of a certain size to be useful, so these outcomes were not used in these studies. 3.1.1 Covariates Weather In studies of short-term effects, seasonal weather changes are of importance, as temperature and humidity influences the symptoms of asthma (Vernon et al., 2012), but also influences the levels of air pollutants (WHO, 2013). In the studies of long-term health effects, the change of season must be considered, not least because respiratory infections are more common in winter. 29 Table 2 Schematic overview of the data used in each study. Exposure Covariates Weather, influenza season, pollen Outcome data Daily number of anti-asthma (R03) drug dispensing, adults in PM10, NO2, O3, H2S the capital area Source The Icelandic prescription drug database Complete ness 44% (620 b /1394) Time period march I 2006-9a Weather, influenza season, lag 1 of the outcome No 2003-9 Daily number of ER visits and admissions for cardiopulmonary d PM10, NO2, O3 c disease and stroke , adults in the capital area II Landspítali University Hospital Admissions database 28-54% (1032-1961 Same as paper II /3653) Residence near the volcano or in unexposed region Having lived or worked near the volcano. PM10, NO2, H2S Age, gender, education, smoking status Age category, gender, Exposure to volcanic phenomenae Weather, influenza season, lag 1 of the outcome d 2% (2355 /2557) Lung function, physicians Medical examination, report, self-reported symptoms spirometry, of general, mental and questionnaires respiratory health e III 2007-12 93% (207/223) Daily number of ER visits and acute admissons for cardiorespiratory outcomes 31 May-7 IV June 2010 Self-reported general, mental and respiratory health Questionnaires Winter 2010 -2011 72% (1656 /2315) V aStudy period starts 8 March 2006. bOnly multi-pollutant analysis. cICD codes for pulmonary outcomes: J20-J22, J40-J46 and J96; cardiac: I20-I27, I46, I48 ,I50, stroke: G45-G46, I61-I69. dO3 only available until 2009 and H2S only available from February 2006, so excluded from analysis in paper 3 and 2 respectively. eLow number for multi-pollutant analysis, high number for single-pollutant analysis. 30 Table 3 Ethics approval sought for each study No Data I Bioethics Committee, VSNb2008050023/0 Dispensing Medicines Data Protection 3-15, of asthma dispensing Agency, National 2008080569/ÞPJ medication data Directorate of Health II+ III IV V Hospital admissions and ER visits Medical exam, spirometry, questionnaires Questionnaire Authority Bioethics Committee, Data Protection Agency, Hospital Executive Board Ref. no. For VSNb2010120017/0 3.7, Hospital 2010121176AT/, contacts Letter:2010/12/22 Public Health Survey National Directorate of Health Individlevel data a org/used No/no Yes/no Yes/yes Bioethics Committee, VSNb2010080002/0 Collecting Data Protection 3.7, S4878/2010 and keeping Yes/yes Agency (announced) data a were the original data provided as individual level data?/ were individual-level data used in the study analysis? Pollen Pollen levels can gravely affect symptoms in individuals with allergic asthma, so in time series analyses, it is important to adjust for daily pollen counts. These are measured from April to September by the Natural History Institute of Iceland (Icelandic Institute of Natural History 2014, personal communication Margrét Hallsdóttir November 16, 2010 and Lára Guðmundsdóttir May 21, 2013). The samples were collected at the Meteorological Institute of Iceland (see figure 11). In paper I, II and III, the analyses were adjusted for pollen counts in the initial analysis, though the results were not significant. Influenza When studying respiratory health in a population, information about epidemics of infectious diseases is of importance as the susceptible population is most at risk of experiencing worsening of their disease when getting sick from influenza. Information about influenza epidemics is reported 31 to the Directorate of Health which reports it in a newsletter and on their website (Chief Epidemiologists of Iceland, 2012a and b). Influenza epidemic periods were defined as more than 300 cases reported to the Directorate of Health per month. In the time series analyses (paper I, II and III), we adjusted for infectious disease epidemics. 3.1.2 Ethics approval For papers 1, 2, 3 and 5, ethics approval was sought. As the data used were collected either for surveillance purposes (paper IV) or for use within health care institutions (paper II and III) it is possible to argue that the data were used beyond their originally intended purpose (table 3). Thus, extra care must be taken that individual level data are not distributed beyond the source and that the use of the data does not compromise the privacy of the patients. 3.2 Methods In all papers, data were presented with descriptive statistics; other methods were applied to comply with the type of data and the aim of the study. A main distinction in environmental epidemiology is between studies of short-term effects (such as whether there was an increase in pollution levels on Monday associated with more cases of a certain disease on Tuesday?) and long-term effects, where areas are usually compared. In these studies a typical research question would be: does exposure to higher levels of pollution (e.g. living in an area with higher background pollution levels, for example, or close to a large road) increase the risk of a disease or symptom compared to an area with lower pollution levels. The danger when comparing different areas is that they may differ with respect to other factors than the pollution. In this section, methods used in the studies are presented; the methods are presented schematically for all studies table 4 after a general discussion. 3.2.1 Short-term effect studies Studies of short-term effects seek to find an association between temporal changes in exposure and changes in the outcome shortly after. A temporal association like this does not prove causality. The time from exposure to outcome is called a lag. The primary analytical method used is regression, with lagged exposures, sometimes called time series regression. In brief, the health outcome, dependent variable, is regressed on the exposure, the independent 32 variable(s), usually with a lag (delay) so that exposure during the previous days is taken into account. The selection of the lag time to use in the model must be built on knowledge of the physiological mechanisms and other factors that occur between the time of exposure and registration of the outcome of interest (Peng et al., 2008; Peng and Dominici, 2008; Dominici et al., 2003). It is necessary to adjust for covariates such as weather, day of week, and season indicators. Both exposures and outcomes have seasonal trends, air pollution levels are affected by meteorological variables; respiratory health outcome severity can be affected by weather, infectious disease epidemics, or pollen counts which all have seasonal patterns (Peng and Dominici 2008; Tolbert et al., 2007). Generalized linear models (GLM) and generalized additive models (GAM) are both frequently used in time series analysis for air pollution epidemiology. For a count outcome such as the number of patients admitted to hospital at time t (for example a certain day; Yt) at a certain exposure vector Xt., GAM or GLM take the following form: where denotes a measure of weather conditions; is an indicator of day of week. S denotes a smooth function, which is applied in order to account for fluctuations in the outcome that are due to other causes than the exposure (e.g. seasonal variation). Seasonal variation may confound the effect estimates of the exposure (Dominici et al., 2003). A smoother can be constructed using different methods; lowess (locally weighted scatterplot smoothing) smoothers (Vittinghoff et al., 2004 p.159), sine-cosine terms or splines (parametric in GLM, non-parametric in GAM) (Dominici et al., 2003). Visual inspection of the spline and the placing of knots can be used to estimate the non-linear effects of an exposure. In paper I, II and III, splines were used to adjust for time trends. Initial analyses of the data in paper I were done using sine-cosine terms. The distributed lag non-linear model (DNLM) is a newer method in testing regression of time series data (Gasparrini et al., 2010). The model allows for non-linear modelling (threshold, knots, splines) both across lags and exposure values. 33 Exposure assignment In air pollution studies, exposure is often assessed based on a geographical measure of the subject’s residence. Other factors like occupational exposures, the quality and indoor climate of the residence or the exposure at the workplace, or school in the case of children, can modify the total exposure. It is also possible to assign study subjects to carry personal measurement devices. Personal exposure methods give a better exposure assignment (Jerrett et al., 2004), but are impractical and expensive to use. Inadequate exposure assignment can lead to faulty results, but in most cases they will underestimate the effect of the exposure (Zeger et al., 2000). Multi- and single- pollutant models It has been a goal of the air pollution studies to determine which pollutants are most harmful to a specific outcome, but some pollutants have high correlation as the same factors (traffic, weather) influence their levels. Inserting all pollutants into a model can adjust for this, but may also disguise important associations, e.g. if two pollutants are highly correlated and are associated with increases in health outcome measures. Intercorrelated pollutants are at risk of violating the assumption of independence (Dominici et al., 2003; Tolbert et al., 2007). Missing data In the case where time series data have gaps of missing data, using multipollutant models can mean excluding a lot of data as there must be information about pollution levels for all pollutants for each day to be included in the analysis (Figure 13). Using long lag periods increases the severity of the problem, as one day of missing data means that a whole lag period must be excluded. Single-pollutants models with short lags are less sensitive to this problem. Results from single-pollutant models are often presented alongside results from multi-pollutant models. 34 Figure 13 Example of missing data in a multi-pollutant time series. The shaded areas will be excluded from regression analysis as values of one or more pollutants are missing. Auto-correlation Many outcomes are correlated with themselves, so that the outcome on a given day is highly correlated with the same outcome they day before or after (Madsen, 2007). The autocorrelation function can give an indication of whether there are signs of autocorrelations, and this can be often be resolved by including the lag 1 of the outcome as a predictor variable in the regression model. Serial autocorrelation due to seasonal trends can be adjusted with splines (Schwartz, 2000). Adjusting - and overadjusting While most epidemiological studies adjust for various confounders and time trend it is possible to go too far. Using splines to adjust for temporal trends, it is possible to over-adjust, as the spline tries to adapt to the temporal changes in the outcome. A spline with too many degrees of freedom can over-adjust and is in danger of eradicating the signal caused by the outcome of interest. A model showing signs of overadjustment will have no lags outside the 95% confidence interval in the autocorrelation function. 3.2.2 Long-term effect studies In studies of long-term effects, the aim is to find associations between certain exposures and occurrence of certain diseases. There is a hierarchy in the level of evidence inferred from each study type, and the outcomes that can be determined from them. An important measure in epidemiology is prevalence, i.e. how many individuals have a given disease at a certain time. Another is incidence, the proportion of new cases (new occurrences of the outcome) in a population per time unit. 35 Cross sectional study A cross-sectional study describes a moment in time; how many of the people in the study had a certain outcome at this given moment. Prevalence is the only measure that can be estimated from cross-sectional studies. Other caveats of these methods are spatial confounding, and the difficulty in distinguishing between whether an observed outcome is associated with either a chronic (background) exposure or a recent (acute) exposure. For these reasons, causality cannot be inferred from observational studies like these (Rothman, 2002). Cohort studies In cohort studies, a group of people are selected based on a common characteristic (most often residences within a geographic area, but other versions are known, e.g. occupation, year of birth). Characteristics of interest with respect to the outcome are measured at baseline (Rothman, 2002; Dominici et al., 2003). Then the group is followed and at certain time points the number of new occurrences of selected outcomes is measured and the incidence of the outcome of interest can be calculated. Cohort studies are both expensive and time-consuming, and it is hard to distinguish whether chronic or acute exposures were the cause of a particular outcome at a given time. Also, adjustment for residual confounding is always a concern, as both exposure and outcome can be associated with confounders with a geographic distribution (Dominici et al., 2003). Methods used in studies of long-term effects In paper IV and V several methods are used to determine if the occurrence of a certain characteristic is significantly different between two groups (exposed and unexposed); Χ2–tests were used for binary outcomes (Vittinghoff et al., 2004). T-tests were used to compare means of numerical outcomes between two groups. In paper V, we compared the occurrence of a binary outcome between two or more groups adjusting for several predictors or covariates using logistic regression (Daniel, 2005; Vittinghoff et al., 2004). See Table 4 for an overview of the methods used. A logistic regression with one binary predictor is identical to a Χ2-test. The logistic regression model takes the form; P(x) = E [ y | x ] = β0+β1x 36 37 V Descriptive, Logistic regression (exposed vs non-exposed & exposure category) Spline for study period (~5 df/yr) Spline for study period (1 df/yr) Spline for study period (1 df/yr) and season Time trend adjustment Main analysis repeated with healthy onlyb Exposure as 1-hr max, β-agonist drugsa, pollen b season Stratified by gender, age groups Sensitivity analysis 0-7 0-2 (0-5) 0-15 (3day means) Df: Degrees of freedom. GHQ-12 – General Health Questionnaire 12 item version. a fast-working drugs. b Not reported . South Iceland: 3 exposure levels. Nonexposed North Iceland reference group b Descriptive, χ2 – test, t-test. Stratified by exposure Daily air pollution (linear), binary indicator GAM, DLNM variables Counts (n reporting general, mental and respiratory health symtoms Counts III GAM Daily air pollution IV Counts II GAM (GLM, DLNM) Daily air pollution Experiences during eruption Counts I Statistic Expoure Lung function (%predicted), n reporting symptoms (GHQ12) Outcome format No Table 4 Schematic overview of the methods used in each study 4 Results The three time series studies used data from registers of drug dispensing (paper I) and ER visits and acute admissions for cardiovascular and stroke diagnoses (paper II and 3). In the data from 2003-2012 there were both seasonal trends and a decline in the number of events during the study period (figure 14). However, upon inspection of the hospital contacts data stratified for when the subjects were admitted to stay at least one night in hospital (blue triangles) or were sent home from the ER, it was clear that most of the seasonal variation and the decline over time was due to the ER visits. There were also seasonal trends in the levels of air pollutants 20032012 (figure 14) PM10 peaks tend to occur over the winter season, as do H2S levels, which peak during cold weather with no precipitation; NO 2 levels have much less variation. The highest levels occured during winter, and O 3 levels were highest during spring, in April. In the studies of the health effects form the Eyjafjallajökull eruptions, we surveyed 207 individuals thoroughly, and received questionnaires from 1656 individuals. We found strong indications that there was a good contrast in exposure, both between the exposed and non-exposed area, and the three exposure regions of South Iceland. In the following, the full time series for pollution data from Reykjavík, and some of the hospital admissions are presented, as are results for each paper. 4.1 Paper I Only 40% of the time series 2006-2009 had complete data for all four pollutants. Levels of all pollutants were higher in the winter season. On average, 76 people bought a prescription drug from the pharmacy per day. NO2 levels were significantly correlated with temperature and O 3. In the regression analysis, exposure was given first at 24-hour means (peak) and 1 hour daily maximum (peak) pollution. The outcomes were given first as all anti-asthma prescription medication (R03) and secondly as shortacting adrenergic inhalants (R03A) only. Three-day moving averages of the exposure up to lag 14 were used. Mean H2S was associated with increased dispensing of all asthma medication and adrenergic inhalants at lags 3-5. 39 40 100 NO2 0 50 µg m 3 NO2 O3 1. jan 2008 1. jan 2009 1. jan 2010 1. jan 2011 1. jan 2012 O3 100 1. jan 2003 1. jan 2004 1. jan 2005 1. jan 2006 1. jan 2007 50 µg/m3 Suspected faulty 3 0 H2S 1. jan 2004 1. jan 2005 1. jan 2006 1. jan 2007 1. jan 2008 1. jan 2009 1. jan 2010 1. jan 2011 1. jan 2012 31.dec 2012 50 H2S PM10 1. jan 2003 1. jan 2004 1. jan 2005 1. jan 2006 1. jan 2007 1. jan 2008 1. jan 2009 1. jan 2010 1. jan 2011 1. jan 2012 PM10 300 200 100 0 µg/m3 400 500 600 0 µg/m3 μg/m 1. jan 2003 1. jan 2003 1. jan 2004 1. jan 2005 1. jan 2006 1. jan 2007 1. jan 2008 1. jan 2009 1. jan 2010 1. jan 2011 1. jan 2012 Figure 15 Daily means of air pollutants (μg/m3) measured in Reykjavik 20032012. 41 Both mean and peak PM10 were associated with increased dispensing of all asthma medication and adrenergic inhalants at lags 3-5. Peak, but not mean NO2, was associated with increased dispensing of adrenergic inhalant drugs at lag 3-8. For O3, only peak values at lags 3-5 and 9-11 were associated with increased dispensing of all anti-asthma drugs and adrenergic inhalants. Figure 16 Overview of Reykjavík postcodes and measuring stations. Circled postcodes are re-analysed in figure 16 and table 5. H2S comes from point sources and distributes in a different way than the traffic-related pollution. Later research has shown that the weather conditions that cause the highest levels of H2S in Reykjavik are a slow breeze from the east, during cold weather, and that the resulting exposure “cloud” is only some 3 km wide (Ólafsdóttir et al., 2013). As the study area is some 20 km from north to south, the measured value at the station was not entirely representative of the exposure of the whole study population. In a further analysis, an attempt was made to improve the exposure classification, and the analysis was repeated counting only subjects who lived in the postcodes in line with the measuring station (figure 16). The results for 42 those who lived in the post codes areas between the exposure source and the measuring station (east Reykjavík) are shown in table 5 and figure 17. H2S and dispensing of asthma drugs in East Reykjavík Effect estimates adjusted (left) and unadjusted (right) for other pollutants for 3-day distributed lag across lag0H2S and dispensing 14. of asthma drugs 0 -6 -4 -2 % change 2 4 6 East Reykjavík : Effect estimates for H2S, adjusted (left) and uadjusted (right) for 3-day lag days 0-14 Lag0-2 Lag3-5 Lag6-8 Lag9-11 Lag12-14 Figure 17 The association between anti-asthma drug dispensing in east Reykjavik and H2S. Table 5 The association between H2S and anti-asthma medication dispensing in areas within Reykjavík. Adjusted for other pollutants, weather and time trend. Results are given as percent change per 10µg/m3 pollutant concentration at lags 0-14. All area In line with Hellisheiði – Grensásvegura Between Hellisheiði – Grensásvegurb % 95% CI % 95% CI % 95% CI H2S 0.66 0.10, 1.21 0.99 0.27, 1.72 1.11 0.20, 2.05 PM10 -0.00 -0.37, 0.32 -0.29 -0.61, 0.16 -0.14 -0.73, 0.43 NO2 0.49 -0.08, 1.05 0.46 -0.25, 1.19 0.23 -0.68, 1.26 O3 -0.42 -0.83, -0.01 -0.21 -0.73, 0.31 -0.58 -1.24, 0.09 a Within circled area in figure 16. bEastern part of the circled area in figure 16. 43 Furthermore, the estimated effect of a 10 µg/m3 increase in H2S was higher when including only the postcodes in the direct line between the source and the measuring station. We found that the effect size increased for H2S, whereas the results for the other pollutants did not change in any significant way, Analysis stratified by gender revealed that the association was stronger in women. 4.2 Paper II The pollution data from 2003-9 were 59-92% complete. There were 9.6 ER vists and hospital admissions per day, most were cardiac, and more than 60% were for people 60 years or older. Only O3 was consistently associated with increased admissions to hospital for cardiopulmonary disease or stroke, and these results were very robust when the analysis was repeated with different lag times and covariates. We excluded H2S from the final analysis of this paper and did not report the results in the paper, but we found a 1% (95% CI: 0, 2%) increase in hospital admissions and ER visits for a 5 th to 95th percentile increase in H2S, but the increase was not statistically significant. 4.3 Paper III The study period was 2007-2012. There were 121 days in the time series when the PM10 values exceeded 50µg/m3. Volcanic ash contributed to the high levels 20 times, and dust storms were a contributor 16 times. During the study period the average number of daily emergency hospital visits was 10.5. In a basic model, we found no association between PM10 and emergency hospital visits; the effect estimate was 0.8% (95% CI -0.5, 2.2). To answer the question if the effect of PM10 had changed after the volcanic eruption, we analyzed the period before and after the eruption separately. We found that the effect estimate for the latter period had increased to 1.6%, (95%CI -1.1, 4.3), but remained statistically insignificant. In the indicator analysis, high PM10 levels due to any cause were not associated with emergency hospital visits. High PM10 levels due to volcanic ash were significantly associated with emergency hospital visits when adjusting for other pollutants by 9.2% (95% CI -0.0, 19.6%). High PM10 levels due to dust storms were not associated with emergency hospital visits, the effect estimate was 4.5% (95% CI -1.6, 11.0%). 44 4.4 Paper IV At the end of the eruption of Eyjafjallajökull in 2010 a total of 167 adults and 40 children (under 18) were investigated with questionnaires, spirometry and a medical examination. Lung function was no worse than in a reference group from the capital area. In the questionnaires, the respondents reported high levels of irritation symptoms; more than half reported symptoms from the sensory organs that were severe enough to disturb their daily life. A high percentage reported psychological morbidity (39% fulfilled GHQ-12 criteria), whereas only few had symptoms of post-traumatic stress disorder. All children with asthma had reported using more medication than normal during the eruption. In the medical interview, a number of people reported stress; though only a few fulfilled the PSS-SR (post traumatic stress disorder symptom scale,-self report, Brewin et al., 2002) criteria for posttraumatic stress disorder. In the questionnaire that was handed out, others voiced their concerns. During the eruption while the ash was falling, my appetite was bad, I slept badly, was nauseous and anxious. Chronic fatigue the first week, afraid of more disasters and uncertainty about the future. Man, early 30s Was surprised how large the effects were on the lungs – felt in my lungs the minute ash began to fall here. Day or night – would have known if I was blindfolded. Woman, Late 30s I seem to have phlegm in the lungs and the dust (ash) must have gotten stuck there. Male, 50s I found it hard to experience, unreal. Was stressed because the roads were closed for a while and also because of the ash fall. Many friends and acquaintances called, empathy, yet people did not really understand. Female, 60s 45 Being exposed to the volcanic eruption, worrying about the safety and health of oneself, family and neighbors, was a disturbing event, but some also reported positive outcomes, such as having made new friends. 4.5 Paper V Six months after the eruption of Eyjafjallajökull, questionnaires were sent to a cohort of South Icelanders who lived between 10 and 100 km from Eyfjafjallajökull and a reference group from North Iceland. The exposed South Icelanders had two to three times increased risk of most respiratory and eye symptoms 6 months after the eruption, after adjusting for demographic factors. About half of the South Icelanders had symptoms from eyes, nose or throat, whereas one third of the reference group had symptoms. The sensory organ symptoms clustered in the exposed population, so individuals with one symptom were more likely to report other symptoms. The proportion reporting psychological morbidity had declined from 39% at the end of the eruption to 24% in the most exposed population, while it was 20% in the unexposed reference group. Bird and Gísladóttir (2012) polled people exposed to the eruption and showed that after exposure to the eruption from Eyjafjallajökull gave a more realistic expectation of what to expect from future eruptions. Figure 18 Proportion of cohort reporting “some” or “a lot” of exposure to volcanic phenomena at their residence during the eruption in Eyjafjallajökull 2010. 46 While there was a dose-response association between exposure and symptoms, we found that most individuals in the cohort had experienced ash fall and heard rumbling from the volcano. Only a minority had felt earthquakes. Generally, those with “medium exposure” had experienced more volcanic phenomena (figure 18). In the cohort study, participants were given the option of replying either online or on paper, and while the overall reply rate for the study was 72% (number of replies/number of people who the researchers were able to contact) there were differences between the reply categories. In stratifying the reply modes by exposure category (table 6), we found higher reply rates from people who agreed to answer online. This could be in part because the online repliers were younger, but that cannot entirely explain this difference. The numbers in Table 6 do not correspond to the actual reply rates reported in the paper as those only include people with accepted participation and who were sent a questionnaire. Table 6 Reply rates for Eyjafjallajökull cohort study – web and on paper Exposed Persons who received a questionnaire Number of valied questionnaires returned Reply rate by category Non-exposed paper web paper web 666 814 215 380 448 701 175 335 67.3% 86.1% 81.4% 88.2% 47 5 Discussion In the studies of short-term effects we found associations between increased pollution levels and increases in adverse health indicators. There was an association between PM10 and H2S levels and anti-asthma drug dispensing to adults in the capital area. In the studies of the health effects following the Eyjafjallajökull eruption, we found that lung function was not affected by exposure to the volcanic eruption, but that irritation and respiratory symptoms were more common in the exposed population. 5.1 Key results Only O3 was consistently associated with emergency hospital visits due to cardiopulmonary causes in adult males, females and the elderly over 70 years of age in 2003 to 2009. NO2 levels were only associated with increased emergency hospital visits in those over 70 years of age, and there were no associations between PM10. High PM10 levels due to volcanic ash from Eyjafjallajökull were associated with increased emergency hospital visits for cardiopulmonary causes in adults 2007-2012. The association between PM10 and emergency hospital visits was stronger after the eruption of Eyjafjallajökull than before, but neither were significant. In the studies of the South Iceland population exposed to ash from the Eyjafjallajökull eruption, we found that at the end of the eruption more than half of those exposed reported having experienced symptoms that were severe enough to disturb their daily life. Many experienced stress and psychological morbidity. Compared to a reference population from the capital area, lung function was not lower in the exposed population; however, the reference population included many heavy smokers. Six months later, the exposed population had two to three times increased risk of most respiratory and eye symptoms, and nearly half had symptoms from the eyes, nose or throat, compared to one third of the reference population. 49 5.2 Limitations and methodological considerations 5.2.1 Exposure In paper I and II, on the effects of pollution from urban sources, NO2 and O3 were found on ER visits and hospital admissions, but not for dispensing of anti-asthma medication in paper I. Effects from PM10 were only found in the dispensing of anti-asthma drugs, but not on ER visits and hospital admissions in 2003-2009. Data on PM2.5 were not available, which is unfortunate as many of the known health effects of PM are for this fraction. With PM 2.5 data, it would be possible at least to distinguish between mainly traffic related particles from fossil fuel combustion and particles from mechanical wear and dust storms, which tend to be larger. In paper III, we found mainly effects with H 2S and high levels of PM10 from volcanic ash, but O3 was not available. A lack of adjustment for O 3 is likely to affect the effect estimates for NO2, so this is unfortunate. The Icelandic capital area is surrounded by sea on three sides, and PM 10 has a significant salt content (3-11% Skúladóttir, 2003; Vegagerðin, 2013). Salt is considered to relieve some asthma symptoms, as has been suggested by other researchers (Andersen et al., 2008). The salt content could be a contributing factor to our null result for PM10 in paper II and partially in paper III. In paper I, PM10 was associated with the dispensing of anti-asthma drugs, which is similar to the findings of other studies using anti-asthma drug dispensing as outcome (Zeghnoun et al., 1999; Pitard et al., 2004; Laurent et al., 2008), and also for PM10 from natural sources and asthma morbidity in children and adolescents (Chimonas and Gessner, 2007). No associations were found with NO2 and O3 levels, but the concentrations of both were somewhat lower in Reykjavík than in the other studies, whereas levels of PM10 were similar to those in Laurent et al.’s study of pharmaceutical dispensing (2008). Other studies used another metric of combustion particles, Black Smoke (BS). There are relatively few studies of pharmaceutical dispensing, and none except this one considers H2S. A study from Taipei suggest that interactions between geothermal emissions and traffic pollution may further increase the aerosol level in urban areas (Lin et al., 2010). A study from New Zealand found that residential exposure to background H 2S was associated with lower risk of asthma (Bates et al., 2013). 50 In paper II, hospital emergency admissions 2003-2009 were only associated with O3, and NO2 in the elderly. The null result for PM10 was surprising, and possible causes for this are discussed below. No-effect levels for NO2 have been found in experimental studies, but those levels were much lower than in the current study (Hesterberg et al., 2009). Influenza epidemics were not a significant predictor for increased hospitalizations or ER visits in this study. It is possible that efforts to inoculate the susceptible population have been sufficient to remove this risk factor. The results of paper III indicate that the association between PM 10 from volcanic ash and emergency hospital visits does not follow the same doseresponse functions as traffic-related PM10. These finding are similar to those of Oudin et al., (2013) who found a bigger-than expected, but non-significant increase in mortality the week after the ash from the Grimsvötn volcanic eruption in 2011 passed over Sweden. Data on O3 levels were missing or suspected faulty since 2010 due to a fault in the measuring equipment. Therefore O 3 had to be excluded from the analyses of the data before and after the eruption. This means that the results are not immediately comparable to those from the 2003-2009 periods. In paper I, II and III, the exposure measured at one station was used as a proxy for the exposure for the entire population. This is not an unusual method, but as the recalculation of the results from paper I illustrate (figure 17), the exposure assessment for H2S was probably improved when only including the post codes areas near the measuring station. In these studies, we used microgram per cubic meter air as it was readily available. Other exposure metrics such as particle number concentration, size distribution and surface area are used in other studies. Newer results indicate that certain particle characteristics may be relevant to particular disease outcomes (Andersen et al., 2008, Peng et al., 2009; Atkinson et al., 2010). In paper IV all participants were exposed at their residence or when they were working in the area. Some were probably more exposed that others, but the study size or the information about the ash fall did not permit us to distinguish between degrees of exposure. A high level of variation (contrast) in the exposure variable is vital to the robustness of time series methods (Dominici et al., 2003; Künzli and Schindler, 2005). In our data, PM10 and H2S exhibited the highest degree of variability, and we found the most robust results for exactly those two pollutants in paper I, with only peak O 3 and NO2 significantly associated with the outcome. In paper II, we found significant results for O 3, but not other 51 pollutants. In paper III, the contrast in PM10 increased after the Eyfjafjallajökull volcanic eruption, which may have been a contributing factor to the higher effect of PM after the eruption. Some missing data meant that especially the analysis with long lags (15 days in paper I) had a lot of missing data. As we had a long time series, the statistical power was sufficient. But stratifying further (gender, age groups) we found no significant results. In paper V, we estimated exposure from the participants’ area of residence address and from satellite data estimates of the eruption plume, but the actual exposure would have been highly sensitive to the activities of the participants (working indoors or outdoors). Some left the exposed area for some periods during and after the eruption to “get a break”, but such behavior would mainly decrease the actual exposure and bias the results towards the null hypothesis. 5.2.2 Outcomes In paper I, we used pharmaceutical dispensing as the outcome. Use of this outcome is increasing as several countries now register dispensing in databases. This outcome is considered more sensitive as it reflects increased symptoms or disease worsening which is less severe than one which causes people to seek treatment in the emergency room or be admitted to hospital. There are also more events, as many people take medication continuously, which gives the results more statistical power. Drawbacks with pharmaceutical dispensing as outcome include significant uncertainty of the time the medication is actually used relative to the time it is dispensed (which is the date registered in the data), or if the medication was used at all. For anti-asthma medication a further caveat is that there is little specificity to asthma, as the medications are used to treat symptoms of a number of diseases. In paper II and 3, we combined ER visits and hospital admission for cardiopulmonary causes and stroke. These two outcomes have quite different associations with air pollution (Winquist et al., 2012). In our data, ER visits displayed a more temporal trend (figure 18), but we refrained from analyzing the ER visits and hospital admissions separately as the statistical power would have been considerably diminished. In paper IV, standardized spirometry methods (protocol from the BOLD study) were used to assess respiratory health, which facilitated comparisons 52 with other studies using the same methods. Unfortunately, we had no reference group for the people under 40, and spirometry cannot be used on children under the age of 6, so the respiratory health of these groups was not compared to a reference group. The self-reported health and symptom prevalence used in papers IV and V are sensitive to the respondents’ mental state at the time of answering the questionnaire, and there are concerns that the replies were influenced by gender and age. The questionnaires used to assess mental health in papers IV and V were rather robust (Goldberg et al., 1997). In paper IV, the free text replies and reported adverse mental health results have to be seen in light of the considerable level of uncertainty at the time of the study, May 31 – June 11, 2010. The eruption had subsided, but geoscientists suspected that it could start again. Eyjafjallajökull has a history of year-long eruptions with intermittent quiescence. An even greater concern was that nearby volcano Katla would erupt soon after an eruption of Eyjafjallajökull as had happened several times previously (Sturkell et al., 2010). A limitation of paper IV is the limited sample size, the lack of knowledge about the health status before the eruption and the lack of reference population and exposure contrast. Unfortunately, some participants did not answer the questionnaire, which further decreased the power of the study. In paper V, which was based on questionnaire data, the demographically matched reference group and the adjustment for demographic factors in the regression analysis should minimize the risk of over- or underestimation of symptoms in the exposed group. Still, it is impossible to eliminate a risk of over-reporting in the exposed population. We identified large differences in the occurrence of reported symptoms and other complaints; and adjusting for personal characteristics should have excluded most residual confounding. It is a limitation of the study that the health of the populations before the eruption is unknown, and we have little information about the non-responders and non-participants. Both the exposed and non-exposed populations are relatively small and tended to by rather few health professionals. Differences in professional preference and diagnostic criteria could mean a relatively high risk of diagnosis bias. This could possibly explain the higher asthma prevalence reported in the non-exposed population. Our exposure categories were based on ash fall estimates and knowledge of the area, but local 53 conditions can increase or decrease both perceived and actual exposure. This could bias the results in either direction, but most likely towards the null. The non-exposed population was surveyed later in winter (January-March) when there are more respiratory infections, which would bias the results towards the null. 5.2.3 Statistical methods In the time series studies (paper I, II and III) we adjusted for temporal trends using splines. Using splines with too many degrees of freedom can disguise the true correlations. Inspection of the splines and autocorrelation plots for signs of overfitting and a moderate selection of degrees of freedom ensured that the splines were suitable. Remaining signs of autocorrelation at lag 1 were removed when the lag 1 of the outcome was introduced as a predictor. Case crossover methods adjust for temporal trends by design; the exposure on a day with an event in an individual (index) is compared to the exposure during a day with no event (control) (Maclure, 1991; Maclure and Mittleman, 2000), but these methods have their own set of drawbacks, such as sensitivity to selection of reference dates (see e.g. Whitaker et al., 2007), and were not used in the current study. The DLNM method which was used in paper III is a rather new method. It appears highly sensitive to the selection of parameters, and while the method has gained popularity since its introduction by Gasparrini and Armstrong (2010), there is no best practice and little consensus as to how to best fit and optimize these models. In paper V, we presented the percentage reporting symptoms in each exposure category. We used logistic regression adjusted for age, gender, education and smoking status to obtain the risk estimates for the different exposure categories. Other information, such as occupation, and other lifestyle factors could have been included in the model. 5.3 Interpretation The results from paper I indicate that dispensing of anti-asthma medication, a proxy for population respiratory health, was affected by even moderate levels of air pollution as found in Reykjavík 2006-9. The results with regard to H2S are of particular interest as this was a rare exposure. The results from paper II showed an association between O 3 and emergency hospital visits for cardiopulmonary and stroke. O3 levels never surpassed the health limits in Iceland during the study period. 54 The results from paper III indicated that the pathogenic effects of PM 10 increased after volcanic ash from Eyjafjallajökull was added to the urban PM10. PM10 from volcanic ash and dust storms have substantial health effects, and are an ignored factor in air pollution studies. In paper IV, we found a high prevalence of self-reported irritation symptoms to the sensory organs in the population exposed to volcanic ash during the Eyjafjallajökull eruption. After 6 weeks of exposure, the participants did not have lower lung function than a matched reference group. In paper V, the results of this large cohort study suggest that exposure to a volcanic eruption is associated with increased rates of irritation symptoms of the sensory organs and psychological morbidity 6 months later, in spite of a concerted disaster response and mitigation efforts. 5.4 External validity The results from paper I, II and III are based on data from high quality registers in a health care system with universal coverage, making the studies in effect population based. Population-based studies are not prone to selection bias and have a high generalizability. The results from the studies add to the body of knowledge about exposure to moderate levels of air pollution in near-Arctic conditions and particularly exposure to H 2S and dust from volcanic ash, which are rare exposures that have not been extensively studied previously. The results from paper IV and V provide useful information about symptom prevalence and resilience in a well-defined population exposed to a volcanic eruption and volcanic ash. Pathogenic properties of volcanic ash vary greatly between volcanoes and eruptions, but methods to determine pathogenic properties of ash are constantly improving (Monick et al., 2013; Horwell et al., 2013). 55 6 Conclusions From the research presented in this thesis, we found that both anthropogenic and natural sources contribute to air pollution which has significant effects on respiratory health in Iceland. Paper I Daily number of individuals dispensed anti-asthma drugs was associated with the levels of PM10 and H2S 3-5 days previously, and more so for the daily maximum than the 24-hour mean. This association was more significant when restricting the analysis to short-acting medications, indicating that they are a better proxy for short-term changes in respiratory health in a population. Paper II Daily emergency hospital admissions and ER visits for cardiopulmonary disease and stroke were associated with O 3 levels at lags 02. Women and the elderly were more susceptible. NO 2 was also associated with increased admissions in the elderly. Paper III In this study of the association between emergency hospital contacts and particle sources during days with high PM10 levels, we found higher effect estimates when the source was volcanic, and smaller effect estimates when PM10 levels were high because of natural dust storms. The effect estimates of PM10 tended to be higher after the eruption of Eyjafjallajökull, though not significantly. Paper IV The population which lived within 40 km of Eyjafjallajökull reported high levels of irritation symptoms in the sensory organs as a consequence of being exposed to fresh volcanic ash for six weeks. Lung function was not affected, and mitigation efforts had been effective. Individuals with underlying obstructive lung disease, elderly and children were more vulnerable. Paper V Exposure to the Eyjafjallajökull volcanic eruption was associated with increased risk of respiratory symptoms and psychological morbidity, and the association followed a dose-response pattern. Psychological morbidity was more common among those who reported more than one physical symptom; mitigation efforts could be aimed at such subgroups. 57 Take home message Both anthropogenic pollution and natural particles have adverse consequences for respiratory health in Iceland. Mitigation measures in the capital area are already installed (dust binding) to reduce PM, but the natural source pollution has if anything been increasing and is a concern in the future. 6.1 Limitations of the current study and future perspectives The current studies of short-term exposure did not take the effects of personal risk factors or underlying diseases into account; this could be the subject of a future study, as several large cohorts with long follow-up times are in place in Iceland. In the studies of exposure to Eyjafjallajökull, we found that children had been severely affected by exposure to the ash from Eyjafjallajökull, and all children with asthma had experienced worsening of their symptoms, even though they were not in the area during the whole eruption. Ideas for future studies: Short-term health effects of traffic-related air pollution in children Short-term health effects of traffic-related pollution on susceptible groups, such as those with underlying diseases and the elderly. Exposure models for the capital area are being developed and can be used to estimate the effects of long-term exposure to traffic pollution. In studies of other outcomes, effect modification from chronic exposures to air pollution can be investigated using information from the models. Follow-up of the Eyjafjallajökulll cohort in medicines and chronic disease registers. 58 References Akselsson, R., Bohgard, M., Gudmundsson, A., Hansson, H.-C., Martinsson, B., & Svenningsson, B. (1994). Aerosoler. (M. Bohgard, Ed.). Lunds Tekniska Högskola och NOSA. Althingi. Reglugerð um brennisteinsdíoxíð, köfnunarefnisdíoxíð og köfnunarefnisoxíð, bensen, kolsýring, svifryk og blý í andrúmsloftinu og upplýsingar til almennings [Act regulating the surface concentration of sulfur dioxide, nitrogen dioxide, carbon dioxide, particle matter and lead, and information to the public], Pub. L. No. 251 (2002). Retrieved from http://www.reglugerd.is/interpro/dkm/WebGuard.nsf/key2/251-2002 [In Icelandic] Althingi. Reglugerð um styrk ósons við yfirborð jarðar [Act regulating surface ozone concentration]. , Pub. L. No. 745 (2003). [In Icelandic] Retrieved from http://www.reglugerd.is/interpro/dkm/WebGuard.nsf/key2/745-2003 [In Icelandic] Althingi. Reglugerð um styrk brennisteinsvetnis í andrumslofti [‚Act regulating the surface concentration of hydrogen sulphide]. , Pub. L. No. 514 (2010). [In Icelandic] Retrieved from http://www.reglugerd.is/interpro/dkm /WebGuard.nsf/58b439f05a7f412f00256a07003476bc/0cf126cdabe4eb9c 00257749004c2747?OpenDocument Amaral, A. F. S., & Rodrigues, A. S. (2007). Chronic exposure to volcanic environments and chronic bronchitis incidence in the Azores, Portugal. Environ Res, 103(3), 419–23. Andersen, Z. J., Wahlin, P., Raaschou-Nielsen, O., Ketzel, M., Scheike, T., & Loft, S. (2008). Size distribution and total number concentration of ultrafine and accumulation mode particles and hospital admissions in children and the elderly in Copenhagen, Denmark. Occup Environ Med, 65(7), 458–66. 59 Andersen, Z. J., Hvidberg, M., Jensen, S. S., Ketzel, M., Loft, S., Sørensen, M., Tjønneland, A., Overvad, K., & Raaschou-Nielsen, O. (2011). Chronic obstructive pulmonary disease and long-term exposure to traffic-related air pollution: A cohort study. Am J Respir Crit Care Med, 183(4), 455–61. Andersen, Z. J., Kristiansen, L. C., Andersen, K. K., Olsen, T. S., Hvidberg, M., Jensen, S. S., Ketzel, M., Loft, S., Sørensen, M., Tjønneland, A., Overvad, K., & Raaschou-Nielsen, O. (2012). Stroke and long-term exposure to outdoor air pollution from nitrogen dioxide A cohort study. Stroke, 43(2), 320–5. Anderson, G. B., Krall, J. R., Peng, R. D., & Bell, M. L. (2012). Is the relation between ozone and mortality confounded by chemical components of particulate matter? Analysis of 7 components in 57 US communities. Am J Epidem, 176(8), 726–32. Anderson, H. R., Favarato, G., & Atkinson, R. W. (2013). Long-term exposure to outdoor air pollution and the prevalence of asthma: meta-analysis of multi-community prevalence studies. Air Qual Atmos Health, 6(1), 57–68. Antó, J. M. (2012). Recent advances in the epidemiologic investigation of risk factors for asthma: a review of the 2011 literature. Curr Allergy Asthma Rep, 12(3), 192–200. Arnalds, O. (2010, August). Dust sources and deposition of Aeolian materials in Iceland. Icel Agric Sci, 23/2010, 3–21. Arnalds, O., Þórarinsdóttir, E. F., Þórsson, J., & Ágústsdóttir, A. M. (2011). Hvað varð um öskuna frá Eyjafjallajökli? [What happened to the ash from Eyjafjallajökull?] Presented at Fræðaþing Bændafélagsins, Reykjavík. [In Icelandic] Retrieved from www.lbhi.is/lisalib/getfile.aspx?itemid=4654 Arnalds, O., Thorarinsdottir, E. F., Thorsson, J., Waldhauserova, P. D., & Agustsdottir, A. M. (2013). An extreme wind erosion event of the fresh Eyjafjallajokull 2010 volcanic ash. Sci Rep, 3, p1257. Atkinson, R., Fuller, G., Anderson, H., Harrison, R., & Armstrong, B. (2010). Urban Ambient Particle Metrics and Health A Time-series Analysis. Epidemiology, 21(4), 501–11. 60 Bates, M. N. (2013, September). Long-term, Ambient Hydrogen Sulfide Exposure and Cognitive Function. Presented at the International Society of Environmental Epidemiology, Basel, Switzerland. Retrieved from http://ehp.niehs.nih.gov/ehbasel13/wp-content/uploads/2013/09/EHB13Abstracts.pdf Bates, M. N., Garrett, N., Crane, J., & Balmes, J. R. (2013). Associations of ambient hydrogen sulfide exposure with self-reported asthma and asthma symptoms. Environ Res, 122, 81–7. Benediktsdóttir, B., Gudmundsson, G., Jörundsdóttir, K. B., Vollmer, W., & Gíslason, T. (2007). [Prevalence of COPD in Iceland–the BOLD study]. Laeknabladid, 93(6), 471–7. Bérubé, K., Balharry, D., Jones, T., Moreno, T., Hayden, P., Sexton, K., Hicks, M., Merolla, L., Timblin, C., Shukla, A., & Mossman, B. (2006). Characterisation of airborne particulate matter and related mechanisms of toxicity: An experimental approach. In J. Ayres, R. Maynard, & H. Richard (Eds.). Air Pollution and Health (Vol. 3, pp. 69–109). London: Imperial College Press. Bird, D., & Gísladóttir, G. (2012). Residents’ attitudes and behaviour before and after the 2010 Eyjafjallajökull eruptions—a case study from southern Iceland. Bull Volcanol, 74(6), 1263–79 Bobb, J. F., Dominici, F., & Peng, R. D. (2011.). A Bayesian model averaging approach for estimating the relative risk of mortality associated with heat waves in 105 U.S. cities. Biometrics, 67(4), 1605–16. Bråbäck, L., & Forsberg, B. (2009). Does traffic exhaust contribute to the development of asthma and allergic sensitization in children: findings from recent cohort studies. Environ Health, 8(17). Bracha, H. S. (2006). Human brain evolution and the “Neuroevolutionary Time-depth Principle:” Implications for the reclassification of fear-circuitryrelated traits in DSM-V and for studying resilience to warzone-related posttraumatic stress disorder. Prog Neuro Psychoph, 30(5), 827–853. Brewin, C. R., Rose, S., Andrews, B., Green, J., Tata, P., McEvedy, C., Turner, S., Foa, E. B. (2002). Brief screening instrument for post-traumatic stress disorder. Br J Psychiatr, 181(2), 158–62. 61 Brook, R. D., Rajagopalan, S., Pope, C. A., 3rd, Brook, J. R., Bhatnagar, A., Diez-Roux, A. V., Holguin, F., Hong, Y., Luepker, R. V., Mittleman, M. R. Peters, A., Siscovick, D., Smith, S.C., & Kaufman, J.D. American Heart Association Council on Epidemiology and Prevention, Council on the Kidney in Cardiovascular Disease, and Council on Nutrition, Physical Activity and Metabolism. (2010). Particulate matter air pollution and cardiovascular disease: An update to the scientific statement from the American Heart Association. Circulation, 121(21), 2331–78. Brunekreef, B., & Holgate, S. T. (2002). Air pollution and health. Lancet, 360(9341), 1233–42. Buist, A. S., McBurnie, M. A., Vollmer, W. M., Gillespie, S., Burney, P., Mannino, D. M., Menezes, A. M. B., Sullivan, S. D. Lee, T. A., Weiss, K. B., Jensen, R. L., Marks, G. B. Gulsvik, A., & Nizankowska-Mogilnicka, E. (2007). International variation in the prevalence of COPD (the BOLD Study): A population-based prevalence study. Lancet, 370(9589), 741-50. Bullard, J. E. (2013). Contemporary glacigenic inputs to the dust cycle. Earth Surf Proc Land, 38(1), 71–89. Burney, P. G., Luczynska, C., Chinn, S., & Jarvis, D. (1994). The European Community Respiratory Health Survey. Eur Respir J, 7(5), 954–60. Burney, P., Jithoo, A., Kato, B., Janson, C., Mannino, D., NizankowskaMogilnicka, E.,Studnicka, M., Tan, W. Bateman, E., Koçabas, A., Vollmer, W. M., Gislason, T., Marks, G., Koul, P. A., Harrabi, I., Gnatiuc, L., & Buist, S. for the Burden of Obstructive Lung Disease (BOLD) Study. (2013). Chronic obstructive pulmonary disease mortality and prevalence: The associations with smoking and poverty--a BOLD analysis. Thorax, 69(5):465-73 Campagna, D., Kathman, S. J., Pierson, R., Inserra, S. G., Phifer, B. L., Middleton, D. C., Zarus, G. M., & White, M. C. (2004). Ambient hydrogen sulfide, total reduced sulfur, and hospital visits for respiratory diseases in northeast Nebraska, 1998–2000. J Expo Anal Epid, 14(2), 180–7. Cashman, K., & Cronin, S. (2008). Welcoming a monster to the world: Myths, oral tradition, and modern societal response to volcanic disasters. J Volcanol Geoth Res, 176(3), 407–18. 62 Chan, C. K., & Yao, X. (2008). Air pollution in mega cities in China. Atmos Environ, 42(1), 1–42. Chan, C.-C., & Ng, H.-C. (2011). A case-crossover analysis of Asian dust storms and mortality in the downwind areas using 14-year data in Taipei. Sci Tot Environ, 410–411, 47–52. Chen, H., Burnett, R. T., Kwong, J. C., Villeneuve, P. J., Goldberg, M. S., Brook, R. D., van Donkelaar, A., Jerrett, M., Martin, R. V., Kopp, A., Brook, J. R., & Copes, R. (2013). Spatial association between ambient fine particulate matter and incident hypertension. Circulation, 129 (5), 5629 Chief epidemiologist of Iceland. (2012a, May 4). Skráningarskyldir sjúkdómar eftir mánuðum, 1997-2011 (xls) [Infectious diseases by month 19972011]. Government institution. Retrieved January 25, 2014, from http://www.landlaeknir.is/servlet/file/store93/item17624/Skr%C3%A1ninga rskyldir_1997_2011.xls [In Icelandic] Chief epidemiologist of Iceland. (2012b, October 26). Tölur um inflúensu [Influenza statistics]. Government institution. Retrieved January 25, 2014, from http://www.landlaeknir.is/influensa/tolur-um-influensu/ [In Icelandic] Chimonas, M.-A. R., & D. Gessner, B. (2007). Airborne particulate matter from primarily geologic, non-industrial sources at levels below National Ambient Air Quality Standards is associated with outpatient visits for asthma and quick-relief medication prescriptions among children less than 20 years old enrolled in Medicaid in Anchorage, Alaska. Environ Res, 103(3), 397–404. Chuang, K.-J., Chan, C.-C., Su, T.-C., Lee, C.-T., & Tang, C.-S. (2007). The effect of urban air pollution on inflammation, oxidative stress, coagulation, and autonomic dysfunction in young adults. Am J Respir Crit Care Med, 176(4), 370–6. Collin-Lange, V. (2013). Socialities in motion: Automobility and car cruising in Iceland. Mobilities, 8(3), 406–23. D’Amato, G., Liccardi, G., D’Amato, M., & Holgate, S. (2005). Environmental risk factors and allergic bronchial asthma. Clin Exp Allergy 35(9), 1113-24. 63 Dagsson-Waldhauserova, P., Arnalds, O., & Olafsson, H. (2013). Long-term frequency and characteristics of dust storm events in Northeast Iceland (1949–2011). Atmos Environ, 77, 117–27. Daniel, W. W. (2005). Biostatistics - A Foundation for Analysis in the Health Sciences (8th ed.). Hoboken, New Jersey: John Wiley & Sons. Delfino, R. J., Staimer, N., Tjoa, T., Gillen, D. L., Polidori, A., Arhami, M., Kleinman, M. T., Vaziri, N. D., Longhurst, J., & Sioutas, C. (2009). Air Pollution Exposures and Circulating Biomarkers of Effect in a Susceptible Population: Clues to Potential Causal Component mixtures and mechanisms, Environ Health Perspect 117(8), 1232–8. Department of Health Clean Air Branch. (2001). 2001 Annual Summary Hawaii Air Quality Data (p. 55). Honolulu, Hawaii. Retrieved from http://health.hawaii.gov/cab/files/2013/05/aqbook_2010.pdf Derwent, R. G., Simmonds, P. G., Manning, A. J., & Spain, T. G. (2007). Trends over a 20-year period from 1987 to 2007 in surface ozone at the atmospheric research station, Mace Head, Ireland. Atmos Environ, 41(39), 9091–8. Devlin, R. B., Ghio, A. J., Kehrl, H., Sanders, G., & Cascio, W. (2003). Elderly humans exposed to concentrated air pollution particles have decreased heart rate variability. Eur Respir J (Suppl.), 40, 76s–80s. Dockery, D. W., Pope, C. A., Xu, X., Spengler, J. D., Ware, J. H., Fay, M. E., Ferris, B. G., & Speizer, F. E. (1993). An association between air pollution and mortality in six U.S. Cities. N Engl J Med, 329(24), 1753–9. Dominici, F., Sheppard, L., & Clyde, M. (2003). Health effects of air pollution: A statistical review. Int Stat Rev, 71(2), 243–76. Dominici, F., Peng, R. D., Barr, C. D., & Bell, M. L. (2010). Protecting human health from air pollution: Shifting from a single-pollutant to a multi-pollutant approach. Epidemiology, 21(2), 187–94. Donaldson, K., & Seaton, A. (2012). A short history of the toxicology of inhaled particles. Part Fibre Toxicol, 9(13). Donaldson, K., Stone, V., Faux, S., & MacNee, W. (2006). Testing new particles. In J. Ayres, R. Maynard, & R. Richards (Eds.), Air Pollution and Health (Vol. 3, pp. 163–195). London: Imperial College Press. 64 Doocy, S., Daniels, A., Dooling, S., & Gorokhovich, Y. (2013). The human impact of volcanoes: A historical review of events 1900-2009 and systematic literature review. PLoS Curr, 5. Duce, R. A., Unni, C. K., Ray, B. J., Prospero, J. M., & Merrill, J. T. (1980). Long-range atmospheric transport of soil dust from Asia to the tropical north Pacific: Temporal variability, Science 209 (4464), 1522–4. Dunér, D. (2012). Tankemaskinen - Polhems huvudvärd coh andra studier i tänkandets historia. Nora: Nya Doxa. [Book in Swedish] Durand, M., & Grattan, J. (2001). Effects of volcanic air pollution on health. Lancet, 357(9251), 164. Durand, M., & Wilson, J. G. (2006). Spatial analysis of respiratory disease on an urbanized geothermal field. Environ Res, 101(2), 238–45. Eccles, R. (2006). The role of the nose in health and disease. In J. Ayres, R. Maynard, & H. Richard (Eds.). Air Pollution and Health (Vol. 3, pp. 17–29). London: Imperial College Press. Elliot, A. J., Singh, N., Loveridge, P., Harcourt, S., Smith, S., Pnaiser, R., Kavanagh, K., Robertson, C., Ramsay, C. N., McMenamin, J., Kibble, A., Murray, V., Ibbottson, S., Catchpole, M., McCloskey, B., & Smith, G. E. (2010). Syndromic surveillance to assess the potential public health impact of the Icelandic volcanic ash plume across the United Kingdom, April 2010. Euro Surveill, 15(23). Emmanuel, S. C. (2000). Impact to lung health of haze from forest fires: The Singapore experience. Respirology, 5(2), 175–82. Fenger, J. (2002). Urban air quality. In J. Austin, P. Brimblecombe, & W. T. Sturges (Eds.). Air Pollution Science for the 21st Century (pp. 1–52). Oxford: Elsevier. Fiedler, N., Kipen, H., Ohman-Strickland, P., Zhang, J., Weisel, C., Laumbach, R., Kelly-McNeil, K., Olejerne, K., & Lioy, P. (2008). Sensory and cognitive effects of acute exposure to hydrogen sulfide. Environ Health Perspect, 116(1), 78–85. 65 Finnbjornsdottir, R. G., Zoëga, H., Olafsson, O., Thorsteinsson, T., & Rafnsson, V. (2013). Association of air pollution and use of glyceryl trinitrate against angina pectoris: A population-based case-crossover study. Environ Health, 12(1), 38. Forsberg, B. (2013, August 23). Vehicle exhaust level at home and incidence of diagnosed dementia. Scientific conference presented at the International Society of Environmental Epidemiology, Basel, Switzerland. Retrieved from http://pp-organizers.convent-info.de/0h8f76u1jpmxva 1b3ztgf0yp2yp0/$/ Francis, P., & Oppenheimer, C. (2004). Volcanoes, 2nd edition. New York: Oxford University press. Gasparrini, A., & Armstrong, B. (2010). Time series analysis on the health effects of temperature: Advancements and limitations. Environ Res, 110(6), 633–8. Gasparrini, A., Armstrong, B., & Kenward, M. G. (2010). Distributed lag non‐ linear models. Stat Med, 29(21), 2224–34. Gauderman, W. J., Vora, H., McConnell, R., Berhane, K., Gilliland, F., Thomas, D., Lurman, F., Avol. E., Künzli, N., Jerrett, M., & Peters, J. (2007). Effect of exposure to traffic on lung development from 10 to 18 years of age: A cohort study. Lancet, 369(9561), 571–7. Gíslason, D., Björnsdóttir, U., Blöndal, T., & Gíslason, T. (2002). European Community Respiratory Health Survey: The main results so far with special reference to Iceland. Laeknabladid, 88(12), 891–907. Gislason, S. R., Hassenkam, T., Nedel, S., Bovet, N., Eiriksdottir, E. S., Alfredsson, H. A., Hem, C. P., Balogh, Z. I.,. Dideriksen, K., Oskarsson, N., Sigfusson, B., Larsen, G., & Stipp, S. L. S. (2011). Characterization of Eyjafjallajökull volcanic ash particles and a protocol for rapid risk assessment. P Natl Acad Sci USA, 108(18), 7307 –12. Gislason, T., Olafsson, O., & Sigvaldason, A. (1997). Users of antiasthma drugs in Iceland: A drug utilization study. Eur Respir J, 10(6), 1230–4. GOLD-Global Initiative for Chronic Obstructive Lung Disease. (2010). GOLD - Spirometry Guide. Organisation. Retrieved November 25, 2013, from http://www.goldcopd.org/other-resources-gold-spirometry-guide.html 66 Gold, D. R., & Mittleman, M. A. (2013). New insights into pollution and the cardiovascular system: 2010 to 2012. Circulation, 127(18), 1903–13. Goldberg, D. P., Gater, R., Sartorius, N., Ustun, T. B., Piccinelli, M., Guree, O., & Rutter, C. (1997). The validity of two versions of the GHQ in the WHO Study of Mental Illness in General Health Care. Psychol Med, 27(01), 191–7. Goldberg, D., & Williams, P. (1988). A User’s Guide to the General Health Questionnaire. Oxford: NFER-Nelson Publishing Company Ltd. Retrieved from http://scholar.google.com/scholar?hl=en&q=goldberg+and+williams +1988+%22A+user%27s+guide%22&btnG=Search&as_sdt=0%2C5&as_ ylo=&as_vis=1 Gordian, M. E & Choudhury, A. H. (2003). PM10 and asthma medication in schoolchildren. Arch Environ Health, 58(1), 42–47. Gordian, M. E., Ozkaynak, H., Xue, J., Morris, S. S., & Spengler, J. D. (1996). Particulate air pollution and respiratory disease in Anchorage, Alaska. Environ Health Perspect, 104(3), 290–7. Götschi, T., Heinrich, J., Sunyer, J., & Künzli, N. (2008). Long-term effects of ambient air pollution on lung function: A review. Epidemiology ), 19(5), 690–701. Gudmundsson, M. T., Thordarson, T., Höskuldsson, Á., Larsen, G., Björnsson, H., Prata, F. J., Oddsson, B., Magnússon, E., Högnadóttir, T., Petersen, G. N., Hayward, C. L., Stevenson, J. A., & Jónsdóttir, I. (2012). Ash generation and distribution from the April-May 2010 eruption of Eyjafjallajökull, Iceland. Sci Rep, 2. Hallas, J. (2005). Drug utilization statistics for individual-level pharmacy dispensing data. Pharmacoepidem Dr S, 14(7), 455–63. Halonen, J. I., Lanki, T., Tiittanen, P., Niemi, J. V., Loh, M., & Pekkanen, J. (2010). Ozone and cause-specific cardiorespiratory morbidity and mortality. J Epidemiol Commun Health, 64(9), 814 –20. Halonen, J. I., Lanki, T., Yli-Tuomi, T., Kulmala, M., Tiittanen, P., & Pekkanen, J. (2008). Urban air pollution, and asthma and COPD hospital emergency room visits. Thorax, 63(7), 635–41. 67 Hankinson, J. L., Odencrantz, J. R., & Fedan, K. (1999). Spirometric reference values from a sample of the general U.S. population. Am J Respir Crit Care Med, 159(1), 179–87. Hansell, A. L., Horwell, C. J., & Oppenheimer, C. (2006). The health hazards of volcanoes and geothermal areas. Occup Environ Med, 63(2), 149–56, 125. Hansell, A., & Oppenheimer, C. (2004). Health hazards from volcanic gases: A systematic literature review. Arch Environ Health, 59(12), 628–39. Hefflin, B. J., & Jalaludin, B. (1994). Surveillance for dust storms and respiratory diseases in Washington State, 1991. Arch Environ Health, 49(3), 170–4. Heggie, T. W., (2009). Geotourism and volcanoes: health hazards facing tourists at volcanic and geothermal destinations. Travel Med Infect Dis, 7(5), 257–61. Henrotin, J. B., Besancenot, J. P., Bejot, Y., & Giroud, M. (2007). Short-term effects of ozone air pollution on ischaemic stroke occurrence: a casecrossover analysis from a 10-year population-based study in Dijon, France. Occup Environ Med, 64(7), 439–45. Henrotin, J.-B., Zeller, M., Lorgis, L., Cottin, Y., Giroud, M., & Béjot, Y. (2010). Evidence of the role of short-term exposure to ozone on ischaemic cerebral and cardiac events: The Dijon Vascular Project (DIVA). Heart, 96(24), 1990 –96. Hesterberg, T. W., Bunn, W. B., McClellan, R. O., Hamade, A. K., Long, C. M., & Valberg, P. A. (2009). Critical review of the human data on shortterm nitrogen dioxide (NO2) exposures: Evidence for NO 2 no-effect levels. Crit Rev Toxicol, 39(9), 743–81. Holgate, S. T., Arshad, H. S., Roberts, G. C., Howarth, P. H., Thurner, P., & Davies, D. E. (2010). A new look at the pathogenesis of asthma. Clin Sci, 118(7), 439–50. Horwell, C., & Baxter, P. (2006). The respiratory health hazards of volcanic ash: A review for volcanic risk mitigation. Bull Volcanol, 69(1), 1–24. 68 Horwell, C. J., Baxter, P. J., Hillman, S. E., Calkins, J. A., Damby, D. E., Delmelle, P., Donaldson, K., Dunster, C., Fubini, B., Kelly, F.J., Le Blond, J. S., Livi, K. J. T., Murphy, F., Nattrass, C., Sweeney, S., Tetley, T.D., Thordarson, & T.,Tomatis, M. (2013). Physicochemical and toxicological profiling of ash from the 2010 and 2011 eruptions of Eyjafjallajökull and Grímsvötn volcanoes, Iceland using a rapid respiratory hazard assessment protocol. Environ Res, 127, 63–73. Icelandic Directorate of Health. (2012, April 30). Lyfjagagnagrunnur [Medicines registry]. Government institution. Retrieved January 25, 2014, from http://www.landlaeknir.is/tolfraedi-og-rannsoknir/gagnasofn/ gagnasafn/item12455/Lyfjagagnagrunnur [Database in n Icelandic] Icelandic Institute of Natural History. (2014). Pollen monitoring in Reykjavik and Akureyri | The Icelandic Institute of Natural History. Pollen monitoring. Government institution. Retrieved January 25, 2014, from http://en.ni.is/botany/pollen-monitoring/ Institute of Earth Sciences. (2010). Eyjafjallajökull 2010 - Grain size distribution | Jarðvísindastofnun - Institute of Earth Sciences. University of Iceland. Retrieved January 24, 2014, from http://earthice.hi.is/ eyjafjallajokul l_2010_grain_size_distribution Ishigami, A., Kikuchi, Y., Iwasawa, S., Nishiwaki, Y., Takebayashi, T., Tanaka, S., & Omae, K. (2008). Volcanic sulfur dioxide and acute respiratory symptoms on Miyakejima island. Occup Environ Med, 65(10), 701–7. Iwasawa, S. (2013, August 23). Effects of sulfur dioxide on respiratory symptoms in child residents of Miyakejima seven years after returning to the island. Scientific conference presented at the International Society of Environmental Epidemiology, Basel, Switzerland. Retrieved from http://pporganizers.convent-info.de/0h8f76u1jpmxva1b3ztgf0yp2yp0/$/ Iwasawa, S., Michikawa, T., Nakano, M., Nishiwaki, Y., Tsuboi, T., Tanaka, S., Uemura, T., Milojevic, A., Nakashima, H., Takebayashi, T., Monkawa, A., Maruyama, K., Kudo, S., & Omae, K. (2009). Effects of SO2 on the respiratory systems of hild Miyakejima residents nearly 2 years after returning to the island. Epidemiology, 20(6), S112–S113. 69 Jaakkola, J. J., Partti-Pellinen, K., Marttila, O., Miettinen, P., Vilkka, V., & Haahtela, T. (1996). The South Karelia Air Pollution Study: Changes in respiratory health in relation to emission reduction of malodorous sulfur compounds from pulp mills. Arch Environ Health, 54(4), 254–63. Jacoby, G. C., Workman, K. W., & D’Arrigo, R. D. (1999). Laki eruption of 1783, tree rings, and disaster for northwest Alaska Inuit. Quaternary Sci Rev, 18(12), 1365–71. Jacquemin, B., Schikowski, T., Carsin, A., Hansell, A., Krämer, U., Sunyer, J., Probst-Hensch, N., Kauffmann, F., & Künzli, N. (2012). The role of air pollution in adult-onset A-asthma: A review of the current evidence. Semin Respir Crit Care, 33(06), 606–19. Janson, C. (2008). Phenotypes of obstructive lung disease. Clin Respir J, 2, 88–91. Jenkins, M. E., & Clemitshaw, K. (2002). Ozone and other secondary photochemical pollutants: Chemical processes giverning their formation in the planetary boundary layer. In J. Austin, P. Brimblecombe, & W. T. Sturges (Eds.), Air Pollution Science for the 21st Century (pp. 285–338). Oxford: Elsevier. Jerrett, M., Arain, A., Kanaroglou, P., Beckerman, B., Potoglou, D., Sahsuvaroglu, T., Morrison, J., & Giovis, C. (2004). A review and evaluation of intraurban air pollution exposure models. J Expo Sci Environ Epidemiol, 15(2), 185–204. Jóhansson, T. (2007). Svifryk í Reykjavík. Reykjavík: University of Iceland. Retrieved from http://www2.hi.is/page/msub070b [Ms. Thesis In Icelandic] Johnston, F., Hanigan, I., Henderson, S., Morgan, G., & Bowman, D. (2011). Extreme air pollution events from bushfires and dust storms and their association with mortality in Sydney, Australia 1994-2007. Environ Res, 111(6), 811–6. Karanasiou, A., Moreno, N., Moreno, T., Viana, M., de Leeuw, F., & Querol, X. (2012). Health effects from Sahara dust episodes in Europe: Literature review and research gaps. Environ Int, 47, 107–14. Kellogg, C. A., & Griffin, D. W. (2006). Aerobiology and the global transport of desert dust. Trends Ecol Evol, 21(11), 638–44. 70 Kilburn, K. H., Thrasher, J. D., & Gray, M. R. (2010). Low-level hydrogen sulfide and central nervous system dysfunction. Toxicol Ind Health, 26(7), 387–405. Kilburn, K. H., & Warshaw, R. H. (1995). Hydrogen sulfide and reduced-sulfur gases adversely affect neurophysiological functions. Toxicol Ind Health, 11(2), 185–97. Kochi, K. (2013, August 23). The relationship between sulfur dioxide exposure and the health of adult Miyakejima residents. Scientific conference presented at the International Society of Environmental Epidemiology, Basel, Switzerland. Retrieved from http://pporganizers.convent-info.de/0h8f76u1jpmxva1b3ztgf0yp2yp0/$/ Kreyling, W. G., Hirn, S., & Schleh, C. (2010). Nanoparticles in the lung. Nat Biotech, 28(12), 1275–6. Künzli, N., & Tager, I. B. (2005). Air pollution: from lung to heart. Swiss Med Wkly, 135(47-48), 697–702. Kunzli, N., Avol, E., Wu, J., Gauderman, W. J., Rappaport, E., Millstein, J., Bennion, J., McConnell, R., Gilliland, F. D., Berhane, K., Lurmann, F., Winer, A., & Peters, J. M. (2006). Health effects of the 2003 Southern California wildfires on children. Am J Respir Crit Care Med, 174(11), 1221–8. Künzli, N., Kaiser, R., Medina, S., Studnicka, M., Chanel, O., Filliger, P., Herry, M., Horak, F., Puybonnieux-Texier, V., Quénel, P., Schneider, J., Seethaler, R., Vergnaud, J. C., & Sommer, H. (2000). Public-health impact of outdoor and traffic-related air pollution: A European assessment. Lancet, 356(9232), 795–801. Künzli, N., Perez, L., von Klot, S., Baldassarre, D., Bauer, M., Basagana, X., Breton, C., Dratva, J., Elosua, R., de Faire, U., Fuks, K., de Groot, E., Marrugat, J., Penell, J., Seissler, J., Peters, A., & Hoffmann, B. (2011). Investigating air pollution and atherosclerosis in humans: Concepts and outlook. Prog Cardiovasc Dis, 53(5), 334–43. Künzli, N., & Schindler, C. (2005). A call for reporting the relevant exposure term in air pollution case-crossover studies. J Epidemiol Commun H , 59(6), 527–30. 71 Lacy, T. G. (1998). Ring of Seasons: Iceland, Its Culture and History. Reykjavík, Iceland: University of Iceland Press. Laurent, O., Pedrono, G., Filleul, L., Segala, C., Lefranc, A., Schillinger, C., Riviere, E., & Bard, D. (2008). Influence of socioeconomic deprivation on the relation between air pollution and beta-agonist sales for asthma. Chest, 135(3), 717-23. Laych, K., Vilen, A., & Latipov, O. (2009). IRF World Road Statistics 2009 Data 2002-2007 Booklet. Geneva, Switzerland: International Road Federation. Retrieved from http://www.irfnet.org/files-upload/stats/2009/ wrs2009_web.pdf Lee, H., Kim, H., Honda, Y., Lim, Y.-H., & Yi, S. (2013). Effect of Asian dust storms on daily mortality in seven metropolitan cities of Korea. Atmos Environ, 79, 510–7. Lim, S. S., Vos, T., Flaxman, A. D., Danaei, G., Shibuya, K., Adair-Rohani, H., AlMazroa, M. A., Arnann, M., Anderson, H. R., Andrews, K. G., Ayree, M., Atkinson, C., Bacchus, L. J., Bahalim, A. N., Balakrishnan, K., BarkerCollo, S., Baxter, A., Bell, M., Blore, J. D., Blyth, F., Bonner, C., Borges, G., Bourne, R., Boussinesq, M., Brauer, M., Brooks, P., Bruce, N. G., Brunekreef, B., Bryan-Hancock, C., Bucello, C., Buchbinder, R., Bull, F., Burnett, R. T., Byers, T. E., Calabria, B., Carapetis, J., Carnahan, E., Chafe, Z., Charlson, F., Chen, H., Chen, J. S., Cheng, A. T., Child, J. C., Cohen, A., Colson, B. C., Cowie, B. C., Darby, S., Darling, S., Davis, A., Degenhardt, L., et al. (2012). A comparative risk assessment of burden of disease and injury attributable to 67 risk factors and risk factor clusters in 21 regions, 1990–2010: A systematic analysis for the Global Burden of Disease Study 2010. Lancet, 380(9859), 2224–60. Lin, C.-H., Mao, I.-F., Tsai, P.-H., Chuang, H.-Y., Chen, Y.-J., & Chen, M.-L. (2010). Sulfur-rich geothermal emissions elevate acid aerosol levels in metropolitan Taipei. Environ Res, 110(6), 536–43. Logan, W. P. D. (1956). Mortality from fog in London, January, 1956. BMJ, 1(4969), 722–5. Longo, B. M. (2009). The Kilauea Volcano Adult Health Study. Nurs Res, 58(1), 23–31. 72 Longo, B. M. (2013). Adverse health effects associated with increased activity at Kīlauea Volcano: A repeated population-based survey. ISRN Public Health, 2013, 1–10. Longo, B. M., Rossignol, A., & Green, J. B. (2008). Cardiorespiratory health effects associated with sulphurous volcanic air pollution. Public Health, 122(8), 809–20. Longo, B. M., & Yang, W. (2008). Acute bronchitis and volcanic air pollution: a community-based cohort study at Kilauea Volcano, Hawai’i, USA. J Toxicol Environ Health, 71(24), 1565–71. Longo, B. M., Yang, W., Green, J. B., Crosby, F. L., & Crosby, V. L. (2010). Acute health effects associated with exposure to volcanic air pollution (vog) from increased activity at Kilauea Volcano in 2008. J Toxicol Environ Health, 73(20), 1370–81. Maclure, M. (1991). The case-crossover design: A method for studying transient effects on the risk of acute events. Am J Epidemiol, 133(2), 144– 153. Maclure, M., and Mittleman, A, M. (2000). Should We Use a Case-Crossover Design? Annu Rev Publ Health, 21(1), 193–221. Madsen, H. (2007). Time Series Analysis. London: Chapman & Hall. Marco, R. de, Accordini, S., Cerveri, I., Corsico, A., Antó, J. M., Künzli, N., Janson, C., Sunyer, J., Jarvis, D., Chinn, S., Vermeire, P., Svanes, C., Ackermann-Liebrich, U., Gislason, T., Heinrich, J., Leynaert, B., Neukirch, F., Schouten, J. P., Wjst, M., & Burney, P. (2007). Incidence of chronic obstructive pulmonary disease in a cohort of young adults according to the presence of chronic cough and phlegm. Am J Respir Crit Care Med, 175(1), 32–9. McConnell, R., Islam, T., Shankardass, K., Jerrett, M., Lurmann, F., Gilliland, F., Gauderman, F., Avol, E., Künzli, N., Yao, L., Peters, J., & Berhane, K. (2010). Childhood incident asthma and traffic-related air pollution at home and school. Environ Health Perspect, 118(7), 1021–26. McGavran, P. (2001). Literature Review of the Health Effects Associated with the Inhalation of Hydrogen Sulfide. Idaho Department of Environmental Quality. Retrieved from http://idahodocs.contentdm.oclc.org/cdm/ compoundobject/collection/p15100coll7/id/38592/rec/1 73 Meister, K., Johansson, C., & Forsberg, B. (2012). Estimated short-term effects of coarse particles on daily mortality in Stockholm, Sweden. Environ Health Perspect, 120(3), 431–6. Menichini, F., & Mudu, P. (2010). Drug consumption and air pollution: An overview. Pharmacoepidemiol Drug Saf, 19(12), 1300–15. Miller, K. A., Siscovick, D. S., Sheppard, L., Shepherd, K., Sullivan, J. H., Anderson, G. L., & Kaufman, J. D. (2007). Long-term exposure to air pollution and incidence of cardiovascular events in women. N Engl J Med, 356(5), 447–58. Monick, M. M., Baltrusaitis, J., Powers, L. S., Borcherding, J. A., Caraballo, J. C., Mudunkotuwa, I., Peate, D. W., Walters, K., Thompson, J. M., Grassian, V. H., Gudmunsson, G., & Comellas, A. P. (2013). Effects of Eyjafjallajökull volcanic ash on innate immune system responses and bacterial growth in vitro. Environ Health Perspect,121(6), 691–8. Morman, S. A., & Plumlee, G. S. (2013). The role of airborne mineral dusts in human disease. Aeolian Res, 9, 203–12. Naeher, L. P., Brauer, M., Lipsett, M., Zelikoff, J. T., Simpson, C. D., Koenig, J. Q., & Smith, K. R. (2007). Woodsmoke health effects: A review. Inhal Toxicol, 19(1), 67–106. National Land Survey of Iceland. (2012). Municipalities web page. National Land Survey of Iceland. Government institution. Retrieved January 14, 2014, from https://atlas.lmi.is/sveitarfelog/ Naumova, E. N., Yepes, H., Griffiths, J. K., Sempértegui, F., Khurana, G., Jagai, J. S., Játiva, E., & Estrella, B. (2007). Emergency room visits for respiratory conditions in children increased after Guagua Pichincha volcanic eruptions in April 2000 in Quito, Ecuador observational study: Time series analysis. Environ Health, 6, 21. Naureckas, E. T., Dukic, V., Bao, X., & Rathouz, P. (2005). Short-acting betaagonist prescription fills as a marker for asthma morbidity. Chest, 128(2), 602–8. Nemery, B., Hoet, P. H., & Nemmar, A. (2001). The Meuse Valley fog of 1930: An air pollution disaster. Lancet, 357(9257), 704–8. 74 Newnham, R., Dirks, K., & Samaranayake, D. (2010). An investigation into long-distance health impacts of the 1996 eruption of Mt Ruapehu, New Zealand. Atmos Environ 44(12), 1568–78. Ohta, Y., Araki, K., Kawasaki, N., Nakane, Y., Honda, S., & Mine, M. (2003). Psychological distress among evacuees of a volcanic eruption in Japan: A follow-up study. Psychiatry Clin. Neurosci, 57(1), 105–11. Olafsdóttir, I. S., Gíslason, T., Thjódleifsson, B., Olafsson, I., Gíslason, D., Jõgi, R., & Janson, C. (2007). Gender differences in the association between C-reactive protein, lung function impairment, and COPD. Int J Chron Obstruct Pulmon Dis, 2(4), 635–42. Ólafsdóttir, I. S., Gislason, T., Gudnason, V., Benediktsdóttir, B., Ólafsson, I., Aspelund, T., Thjódleifsson, B., & Janson, C. (2011). Systemic inflammation and lung function. Clin Respir Jal, 5, 7–8. Olafsdottir, S., & Gardarsson, S. M. (2013). Impacts of meteorological factors on hydrogen sulfide concentration downwind of geothermal power plants. Atmos Environ, 77, 185–92. Olafsdottir, S., Gardarsson, S. M., & Andradottir, H. O. (2014). Spatial distribution of hydrogen sulfide from two geothermal power plants in complex terrain. Atmos Environ, 82, 60–70. Olson, K. R. (2011). The therapeutic potential of hydrogen sulfide: Separating hype from hope. Am J Physiol Regul Integr Comp Physiol, 301(2), R297– R312. Oudin, A., Carlsen, H. K., Forsberg, B., & Johansson, C. (2013). Volcanic ash and daily mortality in Sweden after the Icelandic volcano eruption of May 2011. Int J Environ Res Public Health, 10(12), 6909–19. Oudin, A., Stroh, E., Strömberg, U., Jakobsson, K., & Björk, J. (2009). Longterm exposure to air pollution and hospital admissions for ischemic stroke: A register-based case-control study using modelled NO(x) as exposure proxy. BMC Public Health, 9, 301. Oudin, A., Strömberg, U., Jakobsson, K., Stroh, E., & Björk, J. (2010). Estimation of short-term effects of air pollution on stroke hospital admissions in Southern Sweden. Neuroepidemiology, 34(3), 131–42. 75 Partti-Pellinen, K., Marttila, O., Vilkka, V., Jaakkola, J. J. K., Jäppinen, P., & Haahtela, T. (1996). The South Karelia Air Pollution Study: Effects of lowlevel exposure to malodorous sulfur compounds on symptoms. Arch Environ Health, 51(4), 315–20. Peng, R. D., Bell, M. L., Geyh, A. S., McDermott, A., Zeger, S. L., Samet, J. M., & Dominici, F. (2009). Emergency admissions for cardiovascular and respiratory diseases and the chemical composition of fine particle air pollution. Environ Health Perspect, 117(6), 957–63. Peng, R. D., Chang, H. H., Bell, M. L., McDermott, A., Zeger, S. L., Samet, J. M., & Dominici, F. (2008). Coarse particulate matter air pollution and hospital admissions for cardiovascular and respiratory diseases among Medicare patients. J Am Med Assoc, 299(18), 2172–9. Peng, R. D., & Dominici, F. (2008). Statistical Methods for Environmental Epidemiology with R - A Case Study in Air Pollution and Health. New York: Springer. Pérez, L., Tobías, A., Pey, J., Pérez, N., Alastuey, A., Sunyer, J., & Querol, X. (2012). Effects of local and Saharan particles on cardiovascular disease mortality: Epidemiology, 23(5), 768–69. Pitard, A., Zeghnoun, A., Courseaux, A., Lamberty, J., Delmas, V., Fossard, J. L., & Villet, H. (2004). Short-term associations between air pollution and respiratory drug sales. Environ Res, 95(1), 43–52. Pope, C. A., & Dockery, D. W. (2006). Health effects of fine particulate air pollution: Lines that connect. J Air Waste Ma, 56(6), 709–42. Pope, C. A., Ezzati, M., & Dockery, D. W. (2009). Fine-particulate air pollution and life expectancy in the United States. N Engl J Med, 360(4), 376–86. Pope, C. A., Muhlestein, J. B., May, H. T., Renlund, D. G., Anderson, J. L., & Horne, B. D. (2006). Ischemic heart disease events triggered by shortterm exposure to fine particulate air pollution. Circulation, 114(23), 2443–8. Pope, C. A., Renlund, D. G., Kfoury, A. G., May, H. T., & Horne, B. D. (2008). Relation of heart failure hospitalization to exposure to fine particulate air pollution. Am J Cardiol, 102(9), 1230–4. 76 Prospero, J. H., Bullard, J. E., & Hodgkins, R. (2012). High-latitude dust over the North Atlantic: Inputs from Icelandic proglacial dust storms. Science, 335(2012), 1078–82. Roth, S. H., & Goodwin, V. M. (2003). Health Effects of Hydrogen Sulphide: Knowledge Gaps. Edmonton, Alberta: Alberta Environment. Retrieved from http://environment.gov.ab.ca/info/library/6708.pdf Rothman, K. (2002). Epidemiology: An Introduction. Oxford: Oxford University press. Retrieved from http://library.wur.nl/WebQuery/ clc/1691458 Samoli, E., Nastos, P. T., Paliatsos, A. G., Katsouyanni, K., & Priftis, K. N. (2011). Acute effects of air pollution on pediatric asthma exacerbation: Evidence of association and effect modification. Environ Res, 111(3), 418–24. Schikowski, T., Adam, M., Marcon, A., Cai, Y., Vierkötter, A., Carsin, A. E., Jacquemin, B., Al Kanani, Z., Beelen, R., Birk, M., Bridevaux, P-O., Brunekreef, B., Burney, P., Cirach, M., Cyrys, J., de Hoogh, K., de Marco, R., de Nazelle, A., Declercq, C., Forsberg, B., Hardy, R., Heinrich, J., Hoek, G., Jarvis, D., Keidel, D., Kuh, D., Kuhlusch, T., Micliore, E., Mosler, G., Nieuwenhuijsen, M. J., Phuleria, H., Rochat, T., Schindler, C., Villani, S., Tsai, M-Y., Zemp, E., Hansell, A., Kauffmann, F., Sunyer, J., Probst-Hensch, N., Krämer, U., & Künzli, N. (2014). Association of ambient air pollution with the prevalence and incidence of COPD. Eur Respir J, 44(3), 614–26. Schmidt, A., Ostro, B., Carslaw, K. S., Wilson, M., Thordarson, T., Mann, G. W., & Simmons, A. J. (2011). Excess mortality in Europe following a future Laki-style Icelandic eruption. Proc Natl Acad Sci USA, 108(38), 15710–5. Schwartz, J. (2000). Assessing confounding, effect modification, and thresholds in the association between ambient particles and daily deaths. Environ Health Perspect, 108(6), 563–68. Shimizu, Y., Dobashi, K., Hisada, T., Ono, A., Todokoro, M., Iijima, H., Utsugi, M., Kakegawa, S., Iizuka, K., Ishizuka, T., Morikawa, A., & Mori, M. (2007). Acute impact of volcanic ash on asthma symptoms and treatment. Int J Immunopathol Pharmacol, 20(2 Suppl 2), 9–14. 77 Shore, J. H., Tatum, E. L., & Vollmer, W. M. (1986). Evaluation of mental effects of disaster, Mount St. Helens eruption. Am J Public Health, 76(Suppl), 76–83. Sigmundsson, F., Hreinsdottir, S., Hooper, A., Arnadottir, T., Pedersen, R., Roberts, M. J., Oskarsson, N., Auriac, A., Decriem, J., Einarsson, P., Geirsson, H., Hensch, M., Ofeigsson, B. G., & Sturkell, E., Sveinbjorsson, H., Feigl, K. L. (2010). Intrusion triggering of the 2010 Eyjafjallajokull explosive eruption. Nature, 468(7322), 426–30. Sigurkarlsson, S., Clausen, M., Gislason, T., & Gislason, D. (2011). [Prevalence of respiratory symptoms and use of asthma drugs are increasing among young adult Icelanders]. Laeknabladid, 97(9), 463–7. [in Icelandic] Sillman, S. (2002). The relationship between ozone, NOx and hydrocarbons in urban and polluted rural environments. In J. Austin, P. Brimblecombe, & W. T. Sturges (Eds.), Air Pollution Science for the 21st Century (pp. 339– 386). Oxford:Elsevier. Skúladóttir, B., Larssen, S., Bjarnason, G., Hallsdóttir, B., Gustafsson, L., & Guðmundsdóttir, Á. (2003). Method for determining the composition of airborne particle pollution in Reykjavík. Reykjavík, Iceland: Icelandic Technological Institute. Retrieved from english.ust.is/media/skyrslur2003/ uppruni_svifryks_eng.pdf Small, C., & Naumann, T. (2001). The global distribution of human population and recent volcanism. Global Environ Change, 3(3-4), 93–109. Solberg, S., Bergström, R., Langner, J., Laurila, T., & Lindskog, A. (2005). Changes in Nordic surface ozone episodes due to European emission reductions in the 1990s. Atmos Environ, 39(1), 179–92. Statistics Iceland. (2013a). Statistics Iceland - Statistics » Tourism, transport and information technology » Transport. Retrieved November 20, 2013, from : http://www.statice.is/?PageID=1237&src=https://rannsokn.hagstofa.is/pxe n/Dialog/varval.asp?ma=SAM03103%26ti=Motor+vehicles+by+registered +domicile+of+owner+2001%2D2006++++%26path=../Database/ferdamal/ Okutaeki/%26lang=1%26units=Number 78 Statistics Iceland. (2013b, November 20). Statistics Iceland - Statistics » Population » Urban nuclei and zip codes. Population by urban nuclei, age and sex 1 January 2011-2013. Government institution. Retrieved November 20, 2013, from http://www.statice.is/?PageID=1173&src= https://rannsokn.hagstofa.is/pxen/Dialog/varval.asp?ma=MAN03105%26ti =Population+by+locality%2C+age+and+sex+1+January+2011%2D2013% 26path=../Database/mannfjoldi/Byggdakjarnar/%26lang=1%26units=Data Stohl, A., Prata, A. J., Eckhardt, S., Clarisse, L., Durant, A., Henne, S., Kristiansen, N. I., Minikin, A., Schumann, U., Seibert, P., Stebel, K., Thomas, H. E., Thorsteinsson, T., & Weinzierl, B. (2011). Determination of time- and height-resolved volcanic ash emissions for quantitative ash dispersion modeling: The 2010 Eyjafjallajökull eruption. Atmos Chem Phys Discuss, 11(2), 5541–88. Sturkell, E., Einarsson, P., Sigmundsson, F., Hooper, A., Ófeigsson, B. G., Geirsson, H., & Ólafsson, H. (2010). 2 Katla and Eyjafjallajökull Volcanoes. In A. Schomacker, J. Krüger, & K. H. Kjær (Eds.), The Mýrdalsjökull Ice Cap, Iceland. Glacial processes, sediments and landforms on an active volcano. Developments in Quaternary Sciences (Vol. 13, pp. 5–21). London: Elsevier. Retrieved from http://www.sciencedirect.com /science/article/pii/S1571086609013025 Sun, Q., Hong, X., & Wold, L. E. (2010). Cardiovascular Effects of Ambient Particulate Air Pollution Exposure. Circulation, 121(25), 2755–2765. Sunyer, J., Jarvis, D., Gotschi, T., Garcia-Esteban, R., Jacquemin, B., Aguilera, I., Ackerman, U., de Marco, R., Forsberg, B., Gislason, T., Heinrich, J., Norbäck, D., Villani, S., & Künzli, N. (2006). Chronic bronchitis and urban air pollution in an international study. Occup Environ Med, 63(12), 836–43. Sunyer, J., Schwartz, J., Tobías, A., Macfarlane, D., Garcia, J., & Antó, J. M. (2000). Patients with chronic obstructive pulmonary disease are at increased risk of death associated with urban particle air pollution: A casecrossover analysis. Am J Epidemiol, 151(1), 50 –56. Tam, W. W. S., Wong, T. W., Wong, A. H. S., & Hui, D. S. C. (2012). Effect of dust storm events on daily emergency admissions for respiratory diseases. Respirology 17(1), 143–8. 79 The Icelandic Institute of Natural History. (2014). Pollen monitoring in Reykjavik and Akureyri | The Icelandic Institute of Natural History. Pollen monitoring. Government institution. Retrieved January 25, 2014, from http://en.ni.is/botany/pollen-monitoring/ Thordarson, T., & Hoskuldsson, A. (2002). Iceland. Classic Geology in Europe Vol 3. Dunedin Academic Press, Ltd., Edinburgh, UK. Thorleifsson, S. J., Margretardottir, O. B., Gudmundsson, G., Olafsson, I., Benediktsdottir, B., Janson, C., Buist, S., & Gislason, T. (2009). Chronic airflow obstruction and markers of systemic inflammation: Results from the BOLD study in Iceland. Respir Med, 103(10), 1548–53. Thorsteinsson, T., Gísladóttir, G., Bullard, J., & McTainsh, G. (2011). Dust storm contributions to airborne particulate matter in Reykjavík, Iceland. Atmos Environ, 45(32), 5924–33. Thorsteinsson, T., Jóhannsson, T., Stohl, A., & Kristiansen, N. I. (2012). High levels of particulate matter in Iceland due to direct ash emissions by the Eyjafjallajökull eruption and resuspension of deposited ash. J Geophys Res, 117, 9 PP. To, T., Stanojevic, S., Moores, G., Gershon, A. S., Bateman, E. D., Cruz, A. A., & Boulet, L.-P. (2012). Global asthma prevalence in adults: Findings from the cross-sectional world health survey. BMC Public Health, 12(1), 204. Tobin, G. A., & Whiteford, L. M. (2012). Provisioning capacity: A critical component of vulnerability and resilience under chronic volcanic eruptions. In K. Pfeifer & N. Pfeifer (Eds.), Forces of Nature and Cultural Responses (pp. 139–66). Springer Netherlands. Tolbert, P. E., Klein, M., Peel, J. L., Sarnat, S. E., & Sarnat, J. A. (2007). Multipollutant modeling issues in a study of ambient air quality and emergency department visits in Atlanta. J Expo Sci Environ Epidemiol, 17(S2), S29–S35. Tómasson, K., & Gudmundsson, G. (2009). [Mental health and wellbeing in Icelandic farmers]. Laeknabladid, 95(11), 763–9. Tweed, F. S. (2012). “Now that the dust has settled…” The impacts of Icelandic volcanic eruptions. Geol Today, 28(6), 217–23. 80 UHR –Umhverfis og heilbrigðissvið Reykjavíkurborg [The Reykjavík Municipality Environmental Branch]. (2007). [Measurements of air pollutants in Reykjavík 2006]. Retrieved from http://www.reykjavik.is/Portaldata/1/Resources/umhverfissvid/myndir/skyrl sur/_RSSK_R SLA_2006_1.pdf [Report In Icelandic] Uno, I., Eguchi, K., Yumimoto, K., Takemura, T., Shimizu, A., Uematsu, M., Liu, Z., Want, Z., Hara, Y., & Sugimoto, N. (2009). Asian dust transported one full circuit around the globe. Nat Geosci, 2(8), 557–60. Vegagerðin. (2013). Samsetning svifryks í Reykjavík (Research report) (p. 21). Reykjavík, Iceland: The Icelandic Road Administration. Retrieved from http://www.vegagerdin.is/Vefur2.nsf/Files/Samsetning_svifryks_Rvk/$file/ Samsetning%20svifryks%20%C3%AD%20Reykjav%C3%ADk.pdf [Resport In Icelandic] Vernon, M. K., Wiklund, I., Bell, J. A., Dale, P., & Chapman, K. R. (2012). What do we know about asthma triggers? A review of the literature. J Asthma, 49(10), 991–8. Villeneuve, P., Chen, L., Rowe, B., & Coates, F. (2007). Outdoor air pollution and emergency department visits for asthma among children and adults: A case-crossover study in northern Alberta, Canada. Environ Health, 6(1), 40. Vittinghoff, E., Glidden, D. V., Shiboski, S. C., & McCulloch, C. E. (2004). Regression Methods in Biostatistics. New York: Springer. Volk, H. E., Kerin, T., Lurmann, F., Hertz-Picciotto, I., McConnell, R., & Campbell, D. B. (2014). Autism spectrum disorder: Interaction of air pollution with the MET receptor tyrosine kinase gene. Epidemiology, 25(1), 44–7. von Mutius, E., & Braun-Fahrländer, C. (2002). Environmental predicors of allergic disease and effects of air pollution in children. In J. D‘Amato G., & Holgate, S. T. (Eds.), The Impact of Air Pollution on Respiratory Health (Vol. 7, pp. 17–29). Huddersfield: European Respiratory Society. Wallgren, A., & Wallgren, B. (2007). Register-based Statistics – Administrative Data for Statistical Purposes (Vol. 553). Hoboken, New Jersey: John Wiley & Sons. 81 Whitaker, H. J., Hocine, M. N., & Farrington, C. P. (2007). On case-crossover methods for environmental time series data. Environmetrics, 18(2), 157– 71. WHO. (2000). Air Quality Guidelines for Europe (No. 91). Copenhagen: WHO. Retrieved from http://www.euro.who.int/__data/assets/ pdf_file/0005/74732/E71922.pdf WHO. (2005). Health Aspects of Air Pollution. Copenhagen: World Health Organisation. Retrieved from http://www.euro.who.int/document/ E83080.pdf WHO Regional Office for Europe. (2013). Review of Evidence on Health Aspects of Air Pollution – REVIHAAP Project Technical Report (Technical Report) (p. 67). Copenhagen: WHO. Winquist, A., Klein, M., Tolbert, P., Flanders, W. D., Hess, J., & Sarnat, S. E. (2012). Comparison of emergency department and hospital admissions data for air pollution time-series studies. Environ Health, 11(1), 70. Yang, Q., Chen, Y., Krewski, D., Burnett, R. T., Shi, Y., & McGrail, K. M. (2005). Effect of short-term exposure to low levels of gaseous pollutants on chronic obstructive pulmonary disease hospitalizations. Environ Res, 99(1), 99–105. Yorifuji, T., Kawachi, I., Sakamoto, T., & Doi, H. (2011). Associations of outdoor air pollution with hemorrhagic stroke mortality. J Occup Environ Med, 53(2), 124–6. Yu, I. T., Qiu, H., Wang, X., Tian, L., & Tse, L. A. (2013). Synergy between particles and nitrogen dioxide on emergency hospital admissions for cardiac diseases in Hong Kong. Int J Cardiol, 168(3), 2831–6. Zeger, S. L., Thomas, D., Dominici, F., Samet, J. M., Schwartz, J., Dockery, D., & Cohen, A. (2000). Exposure measurement error in time-series studies of air pollution: Concepts and consequences. Environ Health Perspect, 108(5), 419–26. Zeghnoun, A., Beaudeau, P., Carrat, F., Delmas, V., Boudhabhay, O., Gayon, F., Guincètre, & D.,Czernichow, P. (1999). Air pollution and respiratory drug sales in the City of Le Havre, France, 1993-1996. Environ Res, 81(3), 224–30. 82 Appendix 153 <≪< 153 154


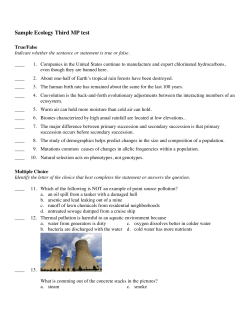


© Copyright 2026