
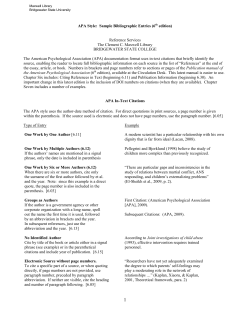
Understanding the functional difference between growth
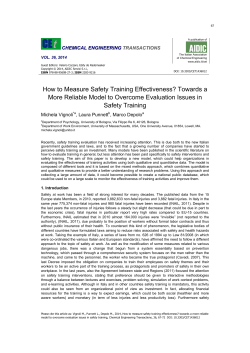
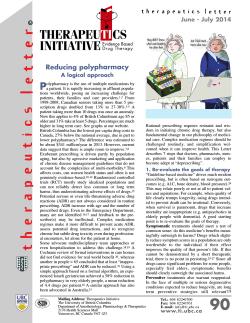
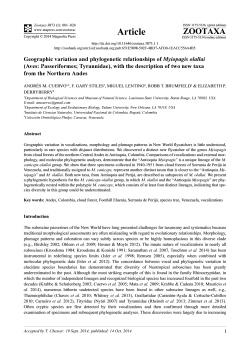
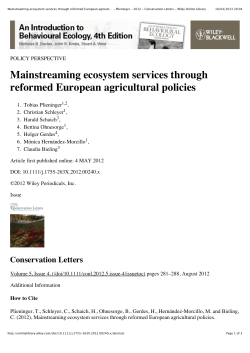
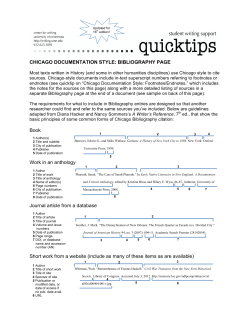
Downloaded from on October 28, 2014
Understanding the functional difference between growth
arrest-specific protein 6 and protein S: an evolutionary
approach
Romain A. Studer, Fred R. Opperdoes, Gerry A. F. Nicolaes, André B. Mulder and René Mulder
Open Biol. 2014 4, 140121, published 22 October 2014
References
This article cites 73 articles, 38 of which can be accessed free
/content/4/10/140121.full.html#ref-list-1
This is an open-access article distributed under the terms of the Creative Commons
Attribution License, which permits unrestricted use, distribution, and reproduction in
any medium, provided the original work is properly cited.
Subject collections
Articles on similar topics can be found in the following collections
biochemistry (71 articles)
bioinformatics (22 articles)
genetics (40 articles)
molecular biology (68 articles)
structural biology (30 articles)
Email alerting service
Receive free email alerts when new articles cite this article - sign up in the box at the top
right-hand corner of the article or click here
Downloaded from on October 28, 2014
rsob.royalsocietypublishing.org
Understanding the functional difference
between growth arrest-specific protein 6
and protein S: an evolutionary approach
Romain A. Studer1, Fred R. Opperdoes2, Gerry A. F. Nicolaes3,
Andre´ B. Mulder4 and Rene´ Mulder4
Research
Cite this article: Studer RA, Opperdoes FR,
Nicolaes GAF, Mulder AB, Mulder R. 2014
Understanding the functional difference
between growth arrest-specific protein 6 and
protein S: an evolutionary approach. Open Biol.
4: 140121.
http://dx.doi.org/10.1098/rsob.140121
Received: 26 June 2014
Accepted: 26 September 2014
Subject Area:
bioinformatics/genetics/molecular biology/
structural biology/biochemistry
Keywords:
protein S, growth arrest-specific protein 6,
evolution
Author for correspondence:
Rene´ Mulder
e-mail: [email protected]
Electronic supplementary material is available
at http://dx.doi.org/10.1098/rsob.140121.
1
European Molecular Biology Laboratory-European Bioinformatics Institute (EMBL-EBI), Wellcome Trust Genome
Campus, Hinxton, Cambridge CB10 1SD, UK
2
Laboratory of Biochemistry, de Duve Institute and Universite´ catholique de Louvain, Brussels 1200, Belgium
3
Department of Biochemistry, Cardiovascular Research Institute Maastricht, Maastricht University, Maastricht,
The Netherlands
4
Department of Laboratory Medicine, University Medical Centre Groningen, Groningen, The Netherlands
1. Summary
Although protein S (PROS1) and growth arrest-specific protein 6 (GAS6) proteins
are homologous with a high degree of structural similarity, they are functionally
different. The objectives of this study were to identify the evolutionary origins
from which these functional differences arose. Bioinformatics methods were
used to estimate the evolutionary divergence time and to detect the amino acid
residues under functional divergence between GAS6 and PROS1. The properties
of these residues were analysed in the light of their three-dimensional structures,
such as their stability effects, the identification of electrostatic patches and the
identification potential protein–protein interaction. The divergence between
GAS6 and PROS1 probably occurred during the whole-genome duplications in
vertebrates. A total of 78 amino acid sites were identified to be under functional
divergence. One of these sites, Asn463, is involved in N-glycosylation in GAS6,
but is mutated in PROS1, preventing this post-translational modification. Sites
experiencing functional divergence tend to express a greater diversity of stabilizing/destabilizing effects than sites that do not experience such functional
divergence. Three electrostatic patches in the LG1/LG2 domains were found to
differ between GAS6 and PROS1. Finally, a surface responsible for protein–
protein interactions was identified. These results may help researchers to analyse
disease-causing mutations in the light of evolutionary and structural constraints,
and link genetic pathology to clinical phenotypes.
2. Introduction
Growth arrest-specific protein 6 (GAS6, MIM# 600441) and protein S (PROS1,
MIM# 176880) are homologous vitamin K-dependent proteins [1]. Whereas
GAS6 is the main ligand for receptor tyrosine kinase Tyro3, Axl and Mer
(TAM), several lines of evidence have shown that PROS1 also interacts with
Tyro3 and Mer, but with a high degree of species specificity [2]. No interactions
between PROS1 and Axl have been reported. PROS1 functions as a cofactor for
activated protein C (APC) in the proteolytic degradation of activated coagulation factors Va (FVa) and VIIIa (FVIIIa) [3,4]. Recently, PROS1 has also
been identified to function as a cofactor for tissue factor pathway inhibitor
(TFPI), accelerating the inhibition of activated factor Xa (FXa) [5]. GAS6 and
PROS1 have been associated with a wide variety of conditions and disorders,
including thrombosis [6,7], systemic lupus erythematus [8,9], kidney disorders
[10,11], sepsis [12,13], cancer [14,15], pregnancy [16], infections such as human
immunodeficiency virus [17] and during the use of oral contraceptives [18].
Interestingly, both proteins exhibit different expression profiles. Contrary to
& 2014 The Authors. Published by the Royal Society under the terms of the Creative Commons Attribution
License http://creativecommons.org/licenses/by/4.0/, which permits unrestricted use, provided the original
author and source are credited.
Downloaded from on October 28, 2014
to the formation of GAS6 and PROS1, (ii) identify amino acid
regions that are responsible for functional divergence between
GAS6 and PROS1, and (iii) elucidate the structural impact of
these regions on the GAS6 and PROS1 protein structures.
3. Material and methods
3.1. Data collection
3.2. Phylogenetic analyses
Phylogenetic analyses producing trees reflecting the evolutionary history of this family were carried out using three
different methods: (i) a neighbour-joining (NJ) distance
matrix tree with exclusion of regions containing insertions
and deletions, and correction for multiple substitutions
with 1000 bootstrap samplings, created using the Tree
option of CLUSTALX; (ii) a maximum-likelihood (ML) analysis
with 100 bootstrap samplings using the JTT evolutionary substitution model with gamma rate distribution carried using
with the program PHYML [54]; and finally, (iii) a phylogenetic
tree inferred by Bayesian analysis using the program MRBAYES
v. 3.2 [55]. The model using the JTT substitution matrix and a
gamma rate distribution with four substitution rate categories
was the best-fitting model to our data. To estimate Bayesian
posterior probabilities, Markov chain Monte Carlo (MCMC)
chains were run for 100 000 generations and sampled every
100 generations (burn-in: 25%). The resulting tree was
rooted using mid-point rooting (figure 1; electronic supplementary material, table S1). Strict and relaxed molecular
clock models were applied to the same dataset running,
respectively, 100 000 and 400 000 generations (MRBAYES).
The molecular clock was time calibrated as follows: from
the divergence times of various pairs of taxa obtained from
the TimeTree web resource (http://www.timetree.org/) [56]
the clock rates, in substitutions per site per Myr, were estimated and an average clock rate was calculated. Best results
were obtained with the relaxed clock model.
3.3. Identification of amino acids under functional
divergence
For the identification of functional divergence, the original dataset was limited to only GAS6 and PROS1 sequences. This resulted
in a total of 30 sequences, from a GAS6 and a PROS1 clade with 15
sequences each. Amino acid sites under potential functional
divergence have been identified by using three methods from
two different packages: BADASP [57] and FUNDI [58].
BADASP is a package to detect both Type I and Type II of
functional divergence [57]. A score is given to each position on
the multiple alignment on the probability to be associated with
Open Biol. 4: 140121
Homologous protein sequences were collected by running
BlastP searches of the human PROS1 sequence (Uniprot ID:
P07225) against the UniProtKB/Swiss-Prot database (www.
uniprot.org). These retrieved sequences were aligned using
the L-INS-i algorithm from MAFFT (v. 7.113b), a multiple
sequence alignment (MSA) program [52]. The dataset is
composed of 32 sequences with 314 sites. The graphical rendering of the alignment using JALVIEW 2.8 [53] is provided
as electronic supplementary material, figure S1. Pairwise
percentage identities were calculated using CLUSTALX.
2
rsob.royalsocietypublishing.org
PROS1, GAS6 is not expressed in the liver, and its concentration in human plasma is almost 1500-fold less than that
of PROS1 (0.22 versus 346 nmol l21) [19,20].
GAS6 and PROS1 show a high degree of similarity, both in
module organization and at the amino acid level. GAS6 is 721
amino acids long (the isoform 2 has a length of 678 amino
acids) and PROS1 is 676 amino acids long. Both are multimodular proteins with an N-terminal region containing the
g-carboxyglutamic acid (GLA) domain, which is formed after
the post-translational modification of glutamic acid [21]. The
GLA domain is followed by a thumb loop, four sequentially
arranged epidermal growth factor-like (EGF) domains and
two laminin G (LG) domains that make up the sex hormonebinding globulin (SHBG). The SHBG-domain of GAS6 is
required for its interaction with the Axl receptor [22]. The binding site for complement component C4-binding protein (C4BP)
is contained in both LG domains within the SHBG-domain of
PROS1 [23–32], whereas the LG domains of PROS1, and in
particular LG2, were shown to be indispensable for expression
of the anticoagulant activities in the APC-catalysed inactivation of FVa and FVIIIa [33,34]. The LG2 domain of PROS1
also seems to contain a binding site for FVa [35]. Recently,
the LG1 domain of PROS1 was shown to be essential for
binding and enhancement of TFPI [36].
In plasma, approximately 60% of the total amount of
PROS1 is bound to C4BP, while the remaining 40% circulates
free and functions as a cofactor for APC. It has recently been
suggested that residues within the GLA and EGF1 domains
of PROS1 act cooperatively for its APC cofactor function [37].
The PROS1-binding site on C4BP is contained within the first
short consensus repeat (SCR) of its beta-chain [38–41]. SCR2
contributes to the interaction of SCR1 with PROS1 [42–44].
As GAS6 and PROS1 homologues share a common ancestor
and have retained overall structural similarities, why are they
functionally different? For example, both GAS6 and PROS1
are post-translationally modified through N-linked glycosylation (addition of a N-acetyl-D-glucosamine to an asparagine),
but at different positions, suggesting a potential shift in function. The availability of whole-genome data has enabled
scientists to address such questions through bioinformatic
approaches. GAS6 and PROS1 are paralogous genes that
were separated during a duplication event, probably during
the two rounds of whole-genome duplication at the beginning
of vertebrate evolution. Gene duplication followed by speciation provides opportunities for the creation of novel genetic
content [45–47]. The replacement (or substitution) rate of
amino acids in proteins can be accelerated or decelerated,
depending on the functional constraints and the selective
advantage of these new mutations [48]. Advantageous
mutations become ultimately fixed in the population. Such
functional divergence at the level of amino acids between
homologous genes can be classified into two types (Type I or
Type II) of functional divergence [49,50]. Type I is characterized
by amino acid patterns that are highly conserved in one group
of sequences (clade) but highly variable in the other. On the
other hand, Type II represents amino acid patterns that are
highly conserved in one group of sequences (clade) and also
conserved in the other group of sequences, but for a different
amino acid. Sites detected under either Type I or Type II of
functional divergence could explain the functional differences
between groups of sequences (orthologues or paralogues) [51].
In this context, we used an evolutionary approach to (i) identify the gene duplication and the subsequent evolution that lead
Downloaded from on October 28, 2014
(a)
(b)
human
chimpanzee
chimpanzee
rhesus monkey
rhesus monkey
cynomolgus monkey
cynomolgus monkey
0.72
mouse
rat
rat
mouse
dog
dog
flying fox
0.84
flying fox
PROS1
cow
cow
chicken
chicken
clawed frog
clawed frog
fugu
fugu
tetraodon
tetraodon
plattyfish
zebrafish
zebrafish
human
human
chimpanzee
chimpanzee
rhesus monkey
rhesus monkey
cynomolgus monkey
cynomolgus monkey
mouse
rat
rat
0.74
mouse
dog
dog
GAS6
cow
cow
flying fox
flying fox
chicken
chicken
clawed frog
clawed frog
fugu
fugu
tetraodon
tetraodon
plattyfish
plattyfish
zebrafish
zebrafish
human
chimpanzee
human
SHBG
chimpanzee
800
700
600
500 400 300
million years
200
100
0
Figure 1. Phylogenetic consensus tree with and without molecular clock of GAS6, PROS1 and SHBG sequences. (a) Tree without a molecular clock model. The GAS6
clade is coloured in red, the PROS1 clade is in blue and the SHBG clade is in green. Values at the nodes indicate posterior probabilities. Only values different from
1.00 are indicated. The lengths of the axes are proportional to the estimated number of mutations per site. (b) Phylogenetic tree under a relaxed clock model. The
tree topology is the same as that of the tree in panel (a). The estimated times of divergence of the more important nodes are indicated in electronic supplementary
material, table S1. The blue error bars at the nodes represent the 95% confidence limits.
Type II and/or Type I, according to a threshold. A previous
simulations study estimated this threshold to be 3.5 [59]. In
this previous study, we generated alignments composed of
random sites, under a nearly neutral process. We then computed the BADASP score for each site and defined the 99th
percentile based on the distribution of these scores. This percentile corresponds to a score of 3.5, which we used as our
threshold. It means that we tolerate 1% of false positive [59].
Type I sites are further divided into Type Ia (residues conserved in PROS1 and divergent in GAS6) and Type Ib
(residues divergent in PROS1 and conserved in GAS6; table 1).
FUNDI aims to detect sites under functional divergence
[58], independent of whether they belong to Type I or Type
II of functional divergence. A stringent 95% threshold of posterior probability was used. FUNDI requires a MSA without
gaps (insertion or deletion). As some of the sequences contained deletions or had ambiguous residues (annotated
with multiple ‘X’), 30 different MSAs were generated by
removing one sequence at a time, and the analyses were
performed on all these alignments. This ensured a greater
coverage than focusing on the whole alignment.
BADASP and FUNDI were applied to all these alignments
and every detected site was retained.
3.4. Identification of codons under positive selection
A change in amino acid can promote a functional change
that can be ultimately adaptive. This new adaptive change
will then be retained by positive Darwinian selection. The
detection of such positive selection at the residue level in
protein can be inferred by the estimation of the number of
non-synonymous (dN) substitutions, which change the
coded amino acid, and the number synonymous (dS) substitutions, which do not change the coded amino acid. A dN/
dS ratio can be computed to estimate the selective pressure
acting on that gene, and a ratio . 1 is an indicator of positive selection, while a ratio , 1 is an indicator of negative
( purifying) selection. A dN/dS ratio close to 1 indicates
that the gene is evolving neutrally. A statistical branch-site
model that tends to identify positive selection that happened on a subset of sites (codons) in a specific lineage
(branch) is implemented in the CODEML/PAML package
[60,61]. Positive selection on a specific branch is then identified by a likelihood-ratio test (LRT) based on a null-model
that does not allow positive selection (only neutral and
negative selection) versus a model that allows positive
selection (and neutral and negative selection). When the
LRT is significant, after correction for false-discovery rate,
codons that contribute to this positive selection can be
identified by a Bayes empirical Bayes (BEB) test. Sites can
be classified under relax and strict thresholds of BEB
score . 0.95 and BEB score . 0.99, respectively.
The codons under positive selection between GAS6 and
PROS1 were retrieved from the Selectome database of precomputed tests of positive selection [62,63], which uses the branchsite model from CODEML/PAML. In Selectome, we focused
Open Biol. 4: 140121
plattyfish
rsob.royalsocietypublishing.org
0.99
3
human
Downloaded from on October 28, 2014
AA
37 (37)
51 (51)
E
Q
60 (60)
97 (97)
PROS1
AA
methods
GAS6
AA
PROS1
AA
methods
31
44
Q
S
B_Ib
PS
384 (341)
405 (362)
Q
N
345
366
D
E
B_Ia
B_Ia, B_Ib
H
N
53
90
N
R
B_II
B_Ia, B_Ib
415 (372)
423 (380)
P
Q
376
384
D
N
B_II, PS
B_Ib
98 (98)
K
91
S
B_Ia, B_II
432 (389)
R
393
H
FD, B_Ib
100 (100)
102 (102)
G
P
93
103
Q
S
B_II
B_Ia
435 (392)
445 (402)
V
K
396
406
S
D
FD, B_II, PS
B_Ib
105 (105)
106 (106)
K
N
106
107
A
Y
B_Ib, B_II
B_Ib
448 (405)
455 (412)
V
P
409
416
K
P
FD, B_Ib
B_Ia
110 (110)
114 (114)
A
Q
111
115
R
N
FD, B_Ia, B_II
B_Ia
456 (413)
457 (414)
E
R
417
418
E
N
B_Ib
B_Ia
123 (123)
N
124
L
B_Ia, B_Ib
463 (420)
N
424
K
B_II
134 (134)
136 (136)
Q
L
135
137
K
G
B_Ib
FD
465 (422)
471 (428)
T
F
426
432
Y
R
FD
FD, B_Ia, B_Ib, B_II
141 (141)
143 (143)
F
L
142
144
T
T
FD
B_Ia
473 (430)
496 (453)
E
G
434
458
V
Q
B_II
FD, B_II
146 (146)
A
147
P
B_Ia
497 (454)
E
459
G
B_II
161 (161)
162 (162)
S
Q
162
163
K
D
B_Ib
FD
498 (455)
508 (465)
D
N
460
470
A
K
B_II
B_II
170 (170)
189 (189)
I
S
174
193
I
L
B_Ib
B_Ia
510 (467)
512 (469)
R
Q
472
474
N
H
B_Ia, B_Ib, B_II
B_Ib, B_II
192 (192)
203 (203)
G
D
196
207
K
L
B_Ia
B_II
517 (474)
518 (475)
T
E
479
480
V
E
FD
FD, B_Ia
204 (204)
S
209
P
B_Ib
526 (483)
S
488
S
B_Ia
218 (218)
222 (222)
S
L
223
227
D
E
B_Ib
B_II
585 (542)
586 (543)
Y
H
542
543
S
T
B_Ib, B_II
FD, B_Ia, B_Ib
224 (224)
248 (248)
D
E
229
253
P
A
B_Ia, B_Ib
B_II
588 (545)
593 (550)
T
K
545
547
E
S
B_Ia, B_Ib
B_Ib
266 (266)
G
271
K
B_Ia, B_Ib, B_II
595 (552)
L
549
D
B_Ia, B_Ib, B_II
274 (274)
322 (279)
M
D
279
284
Q
V
FD
B_Ib
614 (571)
618 (575)
D
H
569
573
S
S
B_Ib
FD, B_Ib
332 (289)
337 (294)
A
S
294
299
D
L
B_Ia, B_Ib
B_II
623 (580)
626 (583)
S
D
578
581
R
R
FD, B_Ib
B_Ia
343 (300)
M
305
Q
PS
639 (596)
Q
594
T
FD
351 (308)
356 (313)
R
R
312
317
Y
L
B_II, PS
B_II
640 (597)
641 (598)
S
E
595
596
I
S
B_Ib
FD, B_Ib
357 (314)
381 (338)
L
G
318
342
P
E
B_Ia, B_Ib, PS
B_II
657 (614)
703 (660)
H
Y
610
656
A
S
B_Ia, B_II, PS
FD, B_Ia, B_Ib
383 (340)
H
344
I
FD, B_Ia, B_Ib
717 (674)
E
670
W
B_Ib
solely on the branch named ‘Euteleostomi’ (which corresponds
roughly to the basis of vertebrates, as sharks and sea lampreys
are not present in Selectome), which separated the paralogous
genes PROS1 and GAS6.
3.5. Stability effect
The contribution of residues to the SHBG-domain stability
was computed by FOLDX [64], using the function ‘build
Open Biol. 4: 140121
GAS6
4
rsob.royalsocietypublishing.org
Table 1. Sites identified to be under functional divergence between GAS6 and PROS1. Functional divergence analysis was performed using three different
methods: FUNDI (FD) [59], BADASP (B) [57] and Selectome (PS) [62,63]. BADASP is a package to detect both Type I and Type II of functional divergence. Type I
sites are divided into Ia (amino acid conserved in PROS1 and divergent in GAS6) or Ib (amino acid conserved in GAS6 and divergent in PROS1). FUNDI aims to
detect sites under functional divergence, independent of whether they belong to Type I or Type II of functional divergence. For GAS6, numbering is based on
isoform 1 or 2 (between brackets). Overall, the methionine encoded by the translation initiation site is numbered as residue 1.
The human structures of GAS6 and PROS1 were modelled by
homology using MODELLER [65]. The template used was the
SHBG-domain of GAS6 (PDB ID: 2C5D). We decided to
model the GAS6 over its crystallized structure, in order to facilitate the direct comparison with the model of PROS1. The
electrostatic surfaces were computed using APBS (Adaptive
Poisson–Boltzmann Solver), a suite for performing Poisson–
Boltzmann electrostatic calculations on biomolecules [66] and
visualized in PYMOL [67].
3.7. Prediction of protein –protein interactions
GAS6 residues (PDB ID: 2C5D) involved in protein –protein
interactions were predicted with the OPTIMAL DOCKING AREA
(ODA) program from the ICM Pro package (Molsoft) [68].
4. Results and discussion
4.1. Data collection
Representative sequences were collected using BlastP searches
of SHBG, PROS1 and GAS6 amino acid sequences against
the UniProtKB/Swiss-Prot database (www.uniprot.org).
These sequences were aligned with MAFFT [52]. Within each
PROS1, GAS6 or SHBG clade, the sequences share between
100 and 50% pairwise identical residues, respectively. However, only approximately 40% identical residues were found
between the two clades of, respectively, GAS6 and PROS1
sequences, and sequences of the SHBG clade share only
between 22 and 28% of residues with sequences of the GAS6
and PROS1 clades, respectively.
1.5
1.0
0.5
0
divergent
not divergent
sites under functional divergence
Figure 2. Comparison of the stability effect between sites under functional
divergence and other sites. The x-axis represents the categories of sites
detected by FUNDI, BADASP or Selectome. The y-axis represents the absolute
median difference in stability effect (DDG, expressed in kcal mol21)
between the group of amino acids in PROS1 versus the group of amino
acids in GAS6. These values were estimated with FOLDX based on the structure
of GAS6 (PDB ID: 2C5D) [22]. Values above 0.5 kcal mol21 are slightly destabilizing, above 1 kcal mol21 are destabilizing and above 2 kcal mol21 are
strongly destabilizing.
a second and later duplication event resulted in the formation
of separate PROS1 and GAS6 genes. The similarity of the
branching order within the latter two clades represents the
events of speciation that took place during vertebrates’ evolution. To obtain further information about the time scale at
which the various events took place, a relaxed clock model
was applied using the MRBAYES program. First, using the estimated dates for the divergence of various taxa available in
the TimeTree database (figure 1; electronic supplementary
material, table S1) [56], the median clock rate was estimated
to be 0.00136 amino acid substitutions per site per million
years (figure 1; electronic supplementary material, table S1).
Using this rate, the evolutionary times of the two duplication
events were calculated to be 697 million years ago (Ma) for
SHBG/PROS þ GAS6 and 649 Ma for PROS/GAS6 (figure 1;
electronic supplementary material, table S1). These values are
in line with the evolution of vertebrates, as the split between
vertebrates and the urochordate Ciona is estimated around
700–800 Ma, according to TimeTree.
4.2. Phylogenetic analysis
4.3. Structural impact of the mutations
Phylogenetic inference using NJ, ML and Bayesian analysis
resulted in three almost identical and very robust trees
(with high confidence score per node). The phylogenetic
tree clearly showed three separate clades representing the
SHBG, the PROS1 and the GAS6 clusters (figure 1). Although
unrooted, it is clear that the SHBG clade may serve as an outgroup to the other two clades present in the tree. The tree
topology within the PROS1 and GAS6 clusters was identical.
The evolution of the three genes can be explained by two
rounds of whole-genome duplications ( proposed by Ohno
[69] and reviewed in [47] and [70]), where the first event of
duplication of an ancestral gene led to the formation of the
SHBG gene and the ancestor of PROS1/GAS6 genes, while
The replacement of one amino acid by another may have an
effect on protein structure, depending on the position and
physico-chemical properties of the substitution. Some changes
can be very drastic; for example, the replacement of a hydrophobic residue such as alanine with a charged residue such
as glutamic acid within the core of a protein structure is
likely to have major consequences for the local and overall
packing of amino acid residues. In the case of a functional
divergence between proteins, it has been hypothesized that
amino acid replacements tend to be more divergent (stabilizing
or destabilizing) compared with amino acids evolving under a
neutral process, where the function is preserved [71]. This has
previously been observed in a dataset of 22 different enzymes
Open Biol. 4: 140121
3.6. Electrostatic surface analysis
5
2.0
rsob.royalsocietypublishing.org
model’. We choose the crystallized SHBG domain of GAS6
(PDB ID: 2C5D) because it is the main domain of the protein
and the one participating in interaction. Each amino acid
has been mutated to itself to estimate its contribution to the
energy of the wild-type (DGwt, in kcal mol21). Second, each
amino acid is mutated to all the other 19 amino acids, to calculate the energy of the mutant (DGmut, in kcal mol21).
Therefore, the difference between DGwt and DGmut was
calculated to give the value for DDG (¼DGmut 2 DGwt), the
stability effect of replacement of one amino acid for another.
The final result was a substitution matrix for all the amino
acid positions in the GAS6 protein structure.
difference in stability (DDG, in kcal mol–1)
Downloaded from on October 28, 2014
Downloaded from on October 28, 2014
6
rsob.royalsocietypublishing.org
Figure 4. Three-dimensional visualization of GAS6 in complex with Axl (PDB ID: 2C5D). Sites under functional divergence are shown as spheres and coloured in
orange. Sites under functional divergence and in contact with Axl (in cartoon and in white) are in yellow. a-helices and b-sheets of GAS6 domain are in blue.
[72], as well as in ribulose-1,5-bisphosphate carboxylase/
oxygenase (RubisCO) [73] and in cetacean myoglobins [74].
To estimate the effect of an amino acid replacement, we
first calculated the effect on protein stability (DDG, in
kcal mol21) for all residue replacements in the GAS6 structure (PDB ID: 2C5D [22]). Each residue was mutated in
silico to all 19 other amino acids and the DDG was recorded.
We calculated the composition of amino acids in each column
of the MSA, and using this we defined the contribution of
each amino acid for each sequence to the protein structure
stability. Using the matrix thus generated, we estimated the
median DDG (in kcal mol21) for each column of GAS6 and
for each column of PROS1. Then, we computed the difference
in stability (in absolute value) between GAS6 and PROS1.
The mean and median of all the 391 differences were 0.68
and 0.15 kcal mol21, respectively. We then separated these
positions between sites under functional divergence and
sites not under functional divergence (figure 2). The mean
of non-divergent sites was 0.56 kcal mol21, while the mean
of divergent sites was 1.45 kcal mol21. Similarly, the
median of non-divergent sites was 0.08 kcal mol21, while
the median of divergent sites was 0.60 kcal mol21. The difference between sites under functional divergence and sites not
under functional divergence was significant (Wilcoxon
signed-rank test, p-value ¼ 1.932 1028). This would support
the above-mentioned hypothesis that sites under functional
divergence have a greater effect on the protein structure than
sites not detected to be under functional divergence.
4.4. Three-dimensional visualization
4.4.1. General
We used the crystallized structural complex of Gas6–Axl
(PDB ID: 2C5D [22]) and a homology-based structure for
PROS1 to visualize the location of sites under functional
divergence (figures 3–5). Residual numbering for GAS6 is
based on isoform 1 or 2 (between brackets). We followed
the Human Gene Variation Society (HGVS) numbering
where the methionine encoded by the translation initiation
site is numbered as residue 1 [75].
4.5. Residues close to Axl
Nine sites under functional divergencewere present at the interface
with Axl: Met343(300), Arg351(308), Arg356(313), Leu357(314),
Val435(392), Arg445(402), Arg457(414), Asp498(455) and
Asn508(465) (figure 4). Only residue Met343 was detected by
Selectome as being under positive selection. The methionine
in GAS6 was replaced by a glutamine in PROS1. Val435 and
Arg457 are very closely located in the three-dimensional structure, and Arg457 directly in contact with Axl. The hydrophobic
Val435 is mutated into a polar Ser396 in PROS1, and a polar
positively charged Arg457 is mutated into polar uncharged
Asn418, except in rodents, where there is an aspartate (another
negatively charged amino acid). Asp498 and Asn508 are on
both sides of the helix.
Open Biol. 4: 140121
Figure 3. Global view of all sites on PROS1. This is a composite model of the whole PROS1 using different templates. The modelling has been done with YASARA What If.
Colouring is domain specific: GLA (cyan), TSR (light yellow), EGF1 (dark blue), EGF2 (red), EGF3 (slate), EGF4 (mangenta), LG1 (yellow) and LG2 (orange).
Downloaded from on October 28, 2014
7
rsob.royalsocietypublishing.org
Open Biol. 4: 140121
Figure 5. Visualization of N-acetylglucosamine (NAG) binding site. The asparagine at position Asn463(420) in GAS6 is mutated to a lysine in PROS1. NAG ligand is in
stick and coloured in yellow. Sites under functional divergence are coloured in orange. a-helices and b-sheets of GAS6 domain are in blue. Axl domains are in grey.
4.6. Residues that have been reported to be involved
in binding of PROS1 to C4BPb
Four sites under functional divergence are present at the
˚ ) with C4BPb: Lys470, Asn472,
interface (less than 6 A
His474 and Ser488. In the three-dimensional structure of
PROS1 Lys470, Asn472 and His474 are sequentially clustered
on LG1, whereas Ser488 is situated on LG2 mirrored to
˚ . The basic residues
Asn472 at an estimated distance of 9.2 A
Lys470 and His474 are mutated to the polar residues
Asn508(465) and Glu512(469) in GAS6, respectively. The
polar Asn472 is mutated to the basic Arg510(467).
4.7. Residues that have been reported to be involved
in binding of PROS1 to FVa
One site (residue 670) under functional divergence is present
at the binding site for FVa [35]. The hydrophobic residue
Trp670 in PROS1 is mutated to the charged acidic residue
Glu717(673) in GAS6.
4.8. Residues close (less than 6 A˚ ) to N-acetyl-Dglucosamine
GAS6 and PROS1 are both post-translationally modified
through N-linked glycosylation, but at different amino acid positions. N-linked glycosylation occurs at the attachment site (or
sequon), whose consensus sequence is Asn-X-Ser/Thr
(N-X-S/T), where the N-glycans are covalently attached to the
protein at an asparagine (Asn) residue. N-glycans typically contain three mannose residues and two N-acetylglucosamine
(NAG) residues, where NAG is directly linked to the asparagine
side chain.
In GAS6, N-glycosylation occurs at one residue in the first
Laminin G-like domain (LG1), at asparagine Asn463(420),
which is on a b-strand in the core of the structure (figure 5).
This asparagine is detected to be under Type II of functional
divergence (replaced by a lysine in PROS1). The residue at position n þ 2 is a threonine, which is also under Type II of
functional divergence (replaced by a tyrosine in PROS1).
These two changes break the N-X-S/T motif and prevent Nglycosylation at this sequon. Two other sites in contact (less
˚ ) with NAG were also detected to be under functional
than 6 A
divergence: Arg351(308) and Gly381(338). They are on different b-strands and replaced by a tyrosine and a glutamic acid
in PROS1, respectively. Similarly, some residues, which are
part of the pocket where NAG is located, are under functional
divergence. For example, Thr465(422) is in the same b-strand as
Asn463(420). Gln384(341) is in close contact with Phe471(428),
which precedes His429. Gln384(341) is replaced by an aspartate
in PROS1 and Phe471(428) by a lysine.
In PROS1, N-glycosylations occur at three asparagine
residues (Asn499, Asn509 and Asn530) in the second Laminin
G-like domain (LG2). These three residues were not detected
to be under functional divergence, but they were also different
in GAS6, where they were replaced by Arg537 and Glu551.
Asn530 is an insertion in PROS1 primates. The region around
Asn530 is very divergent and none of the residues
around Asn530 in PROS1 were found to be functionally divergent. However, residues Arg578, Arg581 and Ala610, which
˚ ) to the NAG
are in close three-dimensional proximity (8 A
binding sites Asn499, Asn509 and Asn530, respectively, were
found to be functionally divergent. In GAS6, these residues
were replaced by Ser623(580), Asp626(583) and His657(614),
respectively (electronic supplementary material, figure S1).
4.9. Comparison of electrostatic surfaces between
PROS1 and GAS6
Using APBS [66] to compute the electrostatic properties of the
surfaces of the SHBG domain, we observed three patches that
are different between PROS1 and GAS6 (figure 6).
The first patch showed a strong basic patch in GAS6
(in blue), formed by residues Ala332(289), Lys333(290),
Lys336(293), Lys506(463), Arg510(467) and Arg684(641),
Downloaded from on October 28, 2014
PROS1
GAS6
8
rsob.royalsocietypublishing.org
Open Biol. 4: 140121
Figure 6. Visualization of electrostatic surfaces on the SHBG-domain of PROS1 and GAS6. To make the direct comparison between GAS6 and PROS1 easier, we have
modelled their SHBG domains using the GAS6 PDB structure (PDB ID: 2C5D). NAG ligand has been added to identify its putative binding pocket. While it is crystallized in GAS6, there is no evidence to indicate whether it can be present in PROS1. Basic surfaces are in blue while acidic surfaces are in red. The NAG ligand is in
green. The green circles indicate the observed differences in electrostatic surface potential between GAS6 and PROS1.
while in PROS1, the corresponding residues were either polar
or acidic (Asp294, Thr295, Glu298, Gln468, Asn472 and
Asn637). Residues Ala332(289) and Arg510(467) in GAS6
and residues Asp294 and Asn472 in PROS1 have been
detected to be under functional divergence. On this patch
residues Gln468 and Asn472 were located in the binding
site of C4BPb.
The second patch is more acidic in GAS6, formed
by Arg537(494), Ser623(580), Asp626(583), Glu628(585),
Gln648(605), Glu649(606), Arg656(613) and Arg659(616),
while more basic in PROS1 (Asn499, Arg578, Arg581,
Asn583, Gln601, Arg602, Lys609 and Lys612). Residues
Ser623(580) and Asp626(583) in GAS6 and residues Arg578
and Arg581 in PROS1 on this patch were detected to be
under functional divergence. Asp499 in PROS1, attached to
NAG, is located at the binding site of C4BPb.
The third patch is basic in GAS6 formed by Arg403(380),
Asn405(362), Ala431(388), Arg432(389), Lys445(402) and
Ala447(404), while it is an acidic patch in PROS1 formed by
Lys364, Glu366, Glu392, His393, Asp406 and Asn408. Residues Asn405(362), Arg432(389) and Lys445(402) in GAS6
and residues Glu366 and Asp406 in PROS1 were detected
to be under functional divergence. This patch is at the contact
interface between GAS6 and Axl.
involve large hydrophobic patches. ODA identifies optimal
surface patches with the lowest docking desolvation energy
values as calculated by atomic solvation parameters (ASP)
derived from octanol/water transfer experiments and
adjusted for protein –protein docking. Using the ODA analysis, we identified residues that may be responsible for
protein –protein interactions (figure 7).
We observed a striking difference between the two proteins
and a clear shift in the predicted protein–protein interaction
areas between the two proteins. Note that these residues are
present in the LG2 domain of both proteins. Three distinct
regions within the LG2 domain of PROS1 have been identified
to interact with C4BP (488–501 and 646–655) [25–27,31,32]
and FVa (662–676) [35]. No residues were located in one of
these three regions. For GAS6, the interactions with Axl in
the 2C5D structure appear exclusively mediated through LG1
[22]. Potentially, the predicted residues of GAS6 mediate contact to other receptors such as Mer or Tyro3, all of which
have been shown to interact with GAS6. However, among
the identified residues within the LG2 domain of GAS6,
Phe528 is suggested to have a controlling function in GAS6–
Axl interactions [22]. None of the predicted residues was
predicted to be under functional divergence.
4.10. Protein –protein interaction prediction
5. Conclusion
We used the ODA analysis [68] to identify residues that may
be responsible for protein –protein interactions. ODA works
essentially for protein –protein interaction predictions that
GAS6 and PROS1 have been widely studied for their biological functions. Despite their homology and structural
resemblances, both proteins exhibit distinct functions. In
Downloaded from on October 28, 2014
(a)
9
L663
rsob.royalsocietypublishing.org
F530
LG2
Open Biol. 4: 140121
LG1
P670/D671
F528
GAS6
(b)
LG2
A634
LG1
Q548
T520
T518
Y484
protein S
Figure 7. Optimal docking area analysis for LG1 and LG2-domains of GAS6 and PROS1. Red dots indicate likely interaction areas, blue indicates protein – protein
interactions to be unlikely. (a) For GAS6, the most likely interactions are with F528, F530, L663, P670 and D671. (b) For PROS1, the most likely interactions are with
Y484, T518, T520, Q548 and A634.
this study, we investigated the evolutionary trajectory of the
paralogous genes GAS6 and PROS1 to better understand
how these two genes became functionally different. Our
results indicate that these genes emerged at the beginning
of vertebrate evolution, which is estimated at 550 –700 Ma,
since the last split with urochordates (like the tunicate Ciona
intestinalis). This also corresponds to the time when the two
rounds of whole-genome duplication occurred in vertebrates.
Additionally, we identified residues under functional divergence in the two proteins encoded by GAS6 and PROS1.
These residues were scattered throughout the two genes.
However, approximately 60% of all residues under functional
divergence were located in the SHBG domain (LG1/LG2) in
both the proteins. GAS6 and PROS1 require this domain for
their distinct functions. Only a small fraction of functionally
divergent residues were located in the binding site. We also
determined the implications of the sites under functional divergence on the structures of GAS6 and PROS1. From these
data, we conclude that the sites under functional divergence
are predominantly required for the overall structure and function of both proteins. We identified functionally important
sites, which will help in understanding the molecular basis of
the functional divergence between both these genes as well
as providing significant information about species-specific
adaptation. Finally, these results might help researchers to analyse disease-causing mutations in the light of evolution and
structural constraints.
Acknowledgements. We thank Nuha Shiltagh and Pavithra Rallapalli for
their helpful comments on the manuscript. We also thank anonymous reviewers for their insightful remarks.
Downloaded from on October 28, 2014
References
1.
13.
14.
16.
17.
18.
19.
20.
21.
22.
23.
24.
25. Linse S, Ha¨rdig Y, Schultz DA, Dahlba¨ck B. 1997
A region of vitamin K-dependent protein S that
binds to C4b binding protein (C4BP) identified using
bacteriophage peptide display libraries. J. Biol.
Chem. 272, 14 658–14 665. (doi:10.1074/jbc.272.
23.14658)
26. Giri TK, Linse S, Garcı´a de Frutos P, Yamazaki T,
Villoutreix BO, Dahlba¨ck B. 2002 Structural
requirements of anticoagulant protein S for its
binding to the complement regulator C4b-binding
protein. J. Biol. Chem. 277, 15 099 –15 106.
(doi:10.1074/jbc.M103036200)
27. Nelson RM, Long GL. 1992 Binding of protein S to
C4b-binding protein: mutagenesis of protein S.
J. Biol. Chem. 267, 8140–8145.
28. Saposnik B, Borgel D, Aiach M, Gandrille S. 2003
Functional properties of the sex-hormone-binding
globulin (SHBG)-like domain of the anticoagulant
protein S. Eur. J. Biochem. 270, 545– 555. (doi:10.
1046/j.1432-1033.2003.03423.x)
29. Walker FJ. 1989 Characterization of a synthetic
peptide that inhibits the interaction between
protein S and C4b-binding protein. J. Biol. Chem.
264, 17 645 –17 648.
30. Evena¨s P, Garcı´a De Frutos P, Linse S, Dahlba¨ck B.
1999 Both G-type domains of protein S are required
for the high-affinity interaction with C4b-binding
protein. Eur. J. Biochem. 266, 935 –942. (doi:10.
1046/j.1432-1327.1999.00928.x)
31. Chang GT, Ploos van Amstel HK, Hessing M, Reitsma
PH, Bertina RM, Bouma BN. 1992 Expression and
characterization of recombinant human protein S in
heterologous cells—studies of the interaction of
amino acid residues leu-608 to glu-612 with human
C4b-binding protein. Thromb. Haemost. 67,
526–532.
32. Chang GT, Maas BH, Ploos van Amstel HK, Reitsma
PH, Bertina RM, Bouma BN. 1994 Studies of the
interaction between human protein S and human
C4b-binding protein using deletion variants of
recombinant human protein S. Thromb. Haemost.
71, 461 –467.
33. Evena¨s P, Garcı´a de Frutos P, Nicolaes GA, Dahlba¨ck
B. 2000 The second laminin G-type domain of
protein S is indispensable for expression of full
cofactor activity in activated protein C-catalysed
inactivation of factor Va and factor VIIIa. Thromb.
Haemost. 84, 271 –277.
34. Nyberg P, Dahlba¨ck B, Garcı´a de Frutos P. 1998 The
SHBG-like region of protein S is crucial for factor
V-dependent APC-cofactor function. FEBS Lett. 433,
28– 32. (doi:10.1016/S0014-5793(98)00877-1)
35. Heeb MJ, Kojima Y, Rosing J, Tans G, Griffin JH.
1999 C-terminal residues 621– 635 of protein S
are essential for binding to factor Va. J. Biol.
Chem. 274, 36 187–36 192. (doi:10.1074/jbc.
274.51.36187)
36. Reglin´ska-Matveyev N, Andersson HM, Rezende SM,
Dahlba¨ck B, Crawley JT, Lane DA, Ahnstro¨m J. 2014
TFPI cofactor function of protein S: essential role of
Open Biol. 4: 140121
15.
34, 219– 222. (doi:10.1097/01.CCM.0000195014.
56254.8A)
Kinasewitz GT et al. 2004 Universal changes in
biomarkers of coagulation and inflammation occur
in patients with severe sepsis, regardless of
causative micro-organism [ISRCTN74215569]. Crit.
Care 8, R82–R90. (doi:10.1186/cc2459)
Loges S et al. 2010 Malignant cells fuel tumor
growth by educating infiltrating leukocytes to
produce the mitogen Gas6. Blood 115, 2264–2273.
(doi:10.1182/blood-2009-06-228684)
Yigit E, Go¨nu¨llu¨ G, Yu¨cel I, Turgut M, Erdem D,
Cakar B. 2008 Relation between hemostatic
parameters and prognostic/predictive factors in
breast cancer. Eur. J. Intern. Med. 19, 602– 607.
(doi:10.1016/j.ejim.2007.06.036)
Said JM, Ignjatovic V, Monagle PT, Walker SP,
Higgins JR, Brennecke SP. 2010 Altered reference
ranges for protein C and protein S during early
pregnancy: Implications for the diagnosis of protein
C and protein S deficiency during pregnancy.
Thromb. Haemost. 103, 984–988. (doi:10.1160/
TH09-07-0476)
Mulder R, Tichelaar YI, Sprenger HG, Mulder AB,
Lijfering WM. 2011 Relationship between
cytomegalovirus infection and procoagulant
changes in human immunodeficiency virus-infected
patients. Clin. Microbiol. Infect. 17, 747–749.
(doi:10.1111/j.1469-0691.2010.03415.x)
Tans G, Curvers J, Middeldorp S, Thomassen MC,
Meijers JC, Prins MH, Bouma BN, Bu¨ller HR, Rosing J.
2000 A randomized cross-over study on the effects of
levonorgestrel- and desogestrel-containing oral
contraceptives on the anticoagulant pathways.
Thromb. Haemost. 84, 15–21.
Balogh I, Hafizi S, Stenhoff J, Hansson K, Dahlba¨ck B.
2005 Analysis of Gas6 in human platelets and plasma.
Arterioscler. Thromb. Vasc. Biol. 25, 1280–1286.
(doi:10.1161/01.ATV.0000163845.07146.48)
Griffin JH, Gruber A, Ferna´ndez JA. 1992
Reevaluation of total, free, and bound protein S
and C4b-binding protein levels in plasma
anticoagulated with citrate or hirudin. Blood 79,
3203 –3211.
Stafford DW. 2005 The vitamin K cycle. J. Thromb.
Haemost. 3, 1873 –1878. (doi:10.1111/j.1538-7836.
2005.01419.x)
Sasaki T, Knyazev PG, Clout NJ, Cheburkin Y,
Go¨hring W, Ullrich A, Timpl R, Hohenester E. 2006
Structural basis for Gas6-Axl signalling. EMBO J. 25,
80 –87. (doi:10.1038/sj.emboj.7600912)
Ferna´ndez JA, Heeb MJ, Griffin JH. 1993
Identification of residues 413–433 of plasma
protein S as essential for binding to C4b-binding
protein. J. Biol. Chem. 268, 16 788– 16 794.
Ferna´ndez JA, Griffin JH, Chang GT, Stam J, Reitsma
PH, Bertina RM, Bouma BN. 1998 Involvement of
amino acid residues 423–429 of human protein S
in binding to C4b-binding protein. Blood Cells Mol.
Dis. 24, 101 –112. (doi:10.1006/bcmd.1998.0175)
rsob.royalsocietypublishing.org
Manfioletti G, Brancolini C, Avanzi G, Schneider C.
1993 The protein encoded by a growth arrestspecific gene (gas6) is a new member of the
vitamin K-dependent proteins related to protein S,
a negative coregulator in the blood coagulation
cascade. Mol. Cell Biol. 13, 4976 –4985.
2. Hafizi S, Dahlba¨ck B. 2006 Gas6 and protein S.
Vitamin K-dependent ligands for the Axl receptor
tyrosine kinase subfamily. FEBS J. 273, 5231 –5244.
(doi:10.1111/j.1742-4658.2006.05529.x)
3. Walker FJ, Chavin SI, Fay PJ. 1987 Inactivation of
factor VIII by activated protein C and protein S.
Arch. Biochem. Biophys. 252, 322–328. (doi:10.
1016/0003-9861(87)90037-3)
4. Walker FJ. 1980 Regulation of activated protein C by
a new protein. A possible function for bovine
protein S. J. Biol. Chem. 255, 5521 –5524.
5. Hackeng TM, Sere´ KM, Tans G, Rosing J. 2006
Protein S stimulates inhibition of the tissue factor
pathway by tissue factor pathway inhibitor. Proc.
Natl Acad. Sci. USA 103, 3106 –3111. (doi:10.1073/
pnas.0504240103)
6. Robins RS, Lemarie´ CA, Laurance S, Aghourian MN,
Wu J, Blostein MD. 2013 Vascular Gas6 contributes
to thrombogenesis and promotes tissue factor upregulation after vessel injury in mice. Blood 121,
692–699. (doi:10.1182/blood-2012-05-433730)
7. Lijfering WM, Mulder R, ten Kate MK, Veeger NJ,
Mulder AB, van der Meer J. 2009 Clinical relevance
of decreased free protein S levels: results from a
retrospective family cohort study involving 1143
relatives. Blood 113, 1225 –1230. (doi:10.1182/
blood-2008-08-174128)
8. Brouwer JL, Bijl M, Veeger NJ, Kluin-Nelemans HC,
van der Meer J. 2004 The contribution of inherited
and acquired thrombophilic defects, alone or
combined with antiphospholipid antibodies, to
venous and arterial thromboembolism in patients
with systemic lupus erythematosus. Blood 104,
143–148. (doi:10.1182/blood-2003-11-4085)
9. Wu CS, Hu CY, Tsai HF, Chyuan IT, Chan CJ,
Chang SK, Hsu PN. 2014 Elevated serum level
of growth arrest-specific protein 6 (Gas6) in
systemic lupus erythematosus patients is
associated with nephritis and cutaneous
vasculitis. Rheumatol. Int. 34, 625–629.
(doi:10.1007/s00296-013-2882-1)
10. Lee IJ et al. 2012 Growth arrest-specific gene 6
(Gas6) levels are elevated in patients with
chronic renal failure. Nephrol. Dial. Transplant. 27,
4166–4172. (doi:10.1093/ndt/gfs337)
11. Vigano-D’Angelo S, D’Angelo A, Kaufman Jr CE,
Sholer C, Esmon CT, Comp PC. 1987 Protein S
deficiency occurs in the nephrotic syndrome. Ann.
Intern. Med. 107, 42 –47. (doi:10.7326/0003-4819107-1-42)
12. Borgel D, Clauser S, Bornstain C, Bie`che I, Bissery A,
Remones V, Fagon JY, Aiach M, Diehl JL. 2006
Elevated growth-arrest-specific protein 6 plasma
levels in patients with severe sepsis. Crit. Care Med.
10
Downloaded from on October 28, 2014
38.
40.
41.
42.
43.
44.
45.
46.
47.
48.
62. Moretti S et al. 2014 Selectome update: quality
control and computational improvements to a
database of positive selection. Nucleic Acids Res. 42,
D917– D921. (doi:10.1093/nar/gkt1065)
63. Proux E, Studer RA, Moretti S, Robinson-Rechavi M.
2009 Selectome: a database of positive selection.
Nucleic Acids Res. 37, D404 –D407. (doi:10.1093/
nar/gkn768)
64. Schymkowitz J, Borg J, Stricher F, Nys R, Rousseau
F, Serrano L. 2005 The FoldX web server: an online
force field. Nucleic Acids Res. 33, W382– W388.
(doi:10.1093/nar/gki387)
65. Sali A, Blundell TL. 1993 Comparative protein
modelling by satisfaction of spatial restraints. J. Mol.
Biol. 234, 779–815. (doi:10.1006/jmbi.1993.1626)
66. Baker NA, Sept D, Joseph S, Holst MJ, McCammon
JA. 2001 Electrostatics of nanosystems: application
to microtubules and the ribosome. Proc. Natl Acad.
Sci. USA 98, 10 037–10 041. (doi:10.1073/pnas.
181342398)
67. Schro¨dinger. 2010 The PyMOL molecular graphics
system, version 1.3r1. See http://www.pymol.org.
68. Fernandez-Recio J, Totrov M, Skorodumov C,
Abagyan R. 2005 Optimal docking area: a new
method for predicting protein-protein interaction
sites. Proteins 58, 134 –143. (doi:10.1002/
prot.20285)
69. Ohno S. 1970 Evolution by gene duplication. London,
UK: George Allen & Unwin.
70. Panopoulou G, Poustka AJ. 2005 Timing and
mechanism of ancient vertebrate genome
duplications—the adventure of a hypothesis. Trends
Genet. 21, 559–567. (doi:10.1016/j.tig.2005.08.004)
71. DePristo MA, Weinreich DM, Hartl DL. 2005
Missense meanderings in sequence space: a
biophysical view of protein evolution. Nat. Rev.
Genet. 6, 678–687. (doi:10.1038/nrg1672)
72. Tokuriki N, Stricher F, Serrano L, Tawfik DS. 2008
How protein stability and new functions trade off.
PLoS Comput. Biol. 4, e1000002. (doi:10.1371/
journal.pcbi.1000002)
73. Studer RA, Christin PA, Williams MA, Orengo CA.
2014 Stability-activity tradeoffs constrain the
adaptive evolution of RubisCO. Proc. Natl Acad. Sci.
USA 111, 2223 –2228. (doi:10.1073/pnas.
1310811111)
74. Dasmeh P, Serohijos AW, Kepp KP, Shakhnovich EI.
2013 Positively selected sites in cetacean
myoglobins contribute to protein stability. PLoS
Comput. Biol. 9, e1002929. (doi:10.1371/journal.
pcbi.1002929)
75. den Dunnen JT, Antonarakis SE. 2000 Mutation
nomenclature extensions and suggestions to
describe complex mutations: a discussion. Hum.
Mutat. 15, 7– 12. (doi:10.1002/(SICI)10981004(200001)15:1,7::AID-HUMU4.3.0.CO;2-N)
11
Open Biol. 4: 140121
39.
49. Gu X. 2003 Functional divergence in protein
(family) sequence evolution. Genetica 118,
133 –141. (doi:10.1007/978-94-010-0229-5_4)
50. Studer RA, Dessailly BH, Orengo CA. 2013 Residue
mutations and their impact on protein structure and
function: detecting beneficial and pathogenic
changes. Biochem. J. 449, 581 –594. (doi:10.1042/
BJ20121221)
51. Cacan E, Kratzer JT, Cole MF, Gaucher EA. 2013
Interchanging functionality among homologous
elongation factors using signatures of heterotachy.
J. Mol. Evol. 76, 4 –12. (doi:10.1007/s00239-0139540-9)
52. Katoh K, Standley DM. 2013 MAFFT multiple
sequence alignment software version 7:
improvements in performance and usability.
Mol. Biol. Evol. 30, 772–780. (doi:10.1093/
molbev/mst010)
53. Waterhouse AM, Procter JB, Martin DM, Clamp M,
Barton GJ. 2009 Jalview Version 2—a multiple
sequence alignment editor and analysis workbench.
Bioinformatics 25, 1189 –1191. (doi:10.1093/
bioinformatics/btp033)
54. Guindon S, Gascuel O. 2003 A simple, fast, and
accurate algorithm to estimate large phylogenies by
maximum likelihood. Syst. Biol. 52, 696– 704.
(doi:10.1080/10635150390235520)
55. Huelsenbeck JP, Ronquist F. 2001 MRBAYES:
Bayesian inference of phylogenetic trees.
Bioinformatics 17, 754–755. (doi:10.1093/
bioinformatics/17.8.754)
56. Hedges SB, Dudley J, Kumar S. 2006 TimeTree:
a public knowledge-base of divergence times
among organisms. Bioinformatics 22, 2971–2972.
(doi:10.1093/bioinformatics/btl505)
57. Edwards RJ, Shields DC. 2005 BADASP: predicting
functional specificity in protein families using
ancestral sequences. Bioinformatics 21, 4190–4191.
(doi:10.1093/bioinformatics/bti678)
58. Studer RA, Robinson-Rechavi M. 2010 Large-scale
analysis of orthologs and paralogs under covarionlike and constant-but-different models of amino
acid evolution. Mol. Biol. Evol. 27, 2618–2627.
(doi:10.1093/molbev/msq149)
59. Gaston D, Susko E, Roger AJ. 2011 A phylogenetic
mixture model for the identification of functionally
divergent protein residues. Bioinformatics 27,
2655 –2663. (doi:10.1093/bioinformatics/btr470)
60. Zhang J, Nielsen R, Yang Z. 2005 Evaluation of an
improved branch-site likelihood method for
detecting positive selection at the molecular level.
Mol. Biol. Evol. 22, 2472–2479. (doi:10.1093/
molbev/msi237)
61. Yang Z. 2007 PAML 4: phylogenetic analysis by
maximum likelihood. Mol. Biol. Evol. 24, 1586–
1591. (doi:10.1093/molbev/msm088)
rsob.royalsocietypublishing.org
37.
the protein S SHBG-like domain. Blood 123,
3979–3987. (doi:10.1182/blood-2014-01-551812)
Ahnstro¨m J et al. 2011 Activated protein C cofactor
function of protein S: a novel role for a
g-carboxyglutamic acid residue. Blood 117,
6685–6693. (doi:10.1182/blood-2010-11-317099)
Ferna´ndez JA, Villoutreix BO, Hackeng TM, Griffin
JH, Bouma BN. 1994 Analysis of protein S C4bbinding protein interactions by homology modeling
and inhibitory antibodies. Biochemistry 33,
11 073–11 078. (doi:10.1021/bi00203a003)
Ferna´ndez JA, Griffin JH. 1994 A protein S binding
site on C4b-binding protein involves beta chain
residues 31 –45. J. Biol. Chem. 269, 2535 –2540.
Villoutreix BO, Ferna´ndez JA, Teleman O, Griffin JH.
1995 Comparative modeling of the three CP
modules of the beta-chain of C4BP and evaluation
of potential sites of interaction with protein S.
Protein Eng. 8, 1253 –1258. (doi:10.1093/protein/8.
12.1253)
Ha¨rdig Y, Dahlba¨ck B. 1996 The amino-terminal
module of the C4b-binding protein beta-chain
contains the protein S-binding site. J. Biol. Chem.
271, 20 861–20 867. (doi:10.1074/jbc.271.
34.20861)
van de Poel RH, Meijers JC, Bouma BN. 1999
Interaction between protein S and complement
C4b-binding protein (C4BP): affinity studies using
chimeras containing c4 bp beta-chain short
consensus repeats. J. Biol. Chem. 274, 15 144–
15 150. (doi:10.1074/jbc.274.21.15144)
van de Poel RH, Meijers JC, Dahlba¨ck B, Bouma BN.
1999 C4b-binding protein (C4BP) beta-chain Short
Consensus Repeat-2 specifically contributes to the
interaction of C4BP with protein S. Blood Cells Mol.
Dis. 25, 279–286. (doi:10.1006/bcmd.1999.0255)
Webb JH, Villoutreix BO, Dahlba¨ck B, Blom AM.
2003 Role of CCP2 of the C4b-binding protein betachain in protein S binding evaluated by
mutagenesis and monoclonal antibodies.
Eur. J. Biochem. 270, 93 –100. (doi:10.1046/j.14321033.2003.03365.x)
Studer RA, Robinson-Rechavi M. 2009 How
confident can we be that orthologs are similar, but
paralogs differ? Trends Genet. 25, 210–216.
(doi:10.1016/j.tig.2009.03.004)
Gabaldo´n T, Koonin EV. 2013 Functional and
evolutionary implications of gene orthology. Nat.
Rev. Genet. 14, 360–366. (doi:10.1038/nrg3456)
Zhang J. 2003 Evolution by gene duplication: an
update. Trends Ecol. Evol. 18, 292–298. (doi:10.
1016/S0169-5347(03)00033-8)
Studer RA, Robinson-Rechavi M. 2009 Evidence for
an episodic model of protein sequence evolution.
Biochem. Soc. Trans. 37, 783–786. (doi:10.1042/
BST0370783)


© Copyright 2026