
Crack Fault Detection for a Gearbox Using Discrete Wavelet
Strojniški vestnik - Journal of Mechanical Engineering 61(2015)1, 63-73 © 2015 Journal of Mechanical Engineering. All rights reserved. DOI:10.5545/sv-jme.2014.1769 Original Scientific Paper Received for review: 2014-02-19 Received revised form: 2014-05-14 Accepted for publication: 2014-05-21 Crack Fault Detection for a Gearbox Using Discrete Wavelet Transform and an Adaptive Resonance Theory Neural Network Li, Z. – Ma, Z. – Liu, Y. – Teng, W. – Jiang, R. Zhuang Li* – Zhiyong Ma – Yibing Liu – Wei Teng – Rui Jiang North China Electric Power University, School of Energy Power and Mechanical Engineering, China In this paper, a new approach using discrete wavelet transform and an adaptive resonance theory neural network for crack fault detection of a gearbox is proposed. With the use of a multi-resolution analytical property of the discrete wavelet transform, the signals are decomposed into a series of sub-bands. The changes of sub-band energy are thought to be caused by the crack fault. Therefore, the relative wavelet energy is proposed as a feature. An artificial neural network is introduced for the detection of crack faults. Due to differences in operating environments, it is difficult to acquire typical, known samples of such faults. An adaptive resonance theory neural network is proposed in order to recognize the changing trend of crack faults without known samples on the basis of extracting the relative wavelet energy as an input eigenvector. The proposed method is applied to the vibration signals collected from a gearbox to diagnose a gear crack fault. The results show that the relative wavelet energy can effectively extract the signal feature and that the adaptive resonance theory neural network can recognize the changing trend from the normal state to a crack fault before the occurrence of a broken tooth fault. Keywords: relative wavelet energy, pattern recognition, gearbox, fault detection, adaptive resonance theory, neural network Highlights • Early fault diagnosis of a gearbox. • Proposed relative wavelet energy for feature extraction. • Proposed an adaptive resonance theory neural network for recognizing crack faults. • Recognized the changing trend from the normal state to a crack fault without known samples. 0 INTRODUCTION A gearbox is a core component in rotating machinery and has been widely employed in various industrial equipment. The meshing of gear teeth is a dynamic process that generates dynamic excitation forces, i.e. elastic variable forces and collision forces, but also forces due to the sliding and rolling of tooth flanks [1]. The gear of a gearbox in operation bears alternating friction and impact loads, which easily lead to variable defects and faults. Detecting gearbox faults as early as possible is essential in order to avoid fatal breakdowns of machines and loss of production and casualties. Vibration signal analysis is the main technique for monitoring the condition and detecting faults in a gearbox. By employing appropriate signal processing methods, changes in vibration signals caused by faults can be detected to aid in evaluating the gearbox’s health status. The development process from the normal state to a fault in the gearbox is a slow one. With the limitation of the mechanical structure and its working environment, it is difficult to directly measure the changes of state for a gearbox, e.g. gear wear and cracking. Generally, the changes of state are estimated by observing the changes of features extracted from vibration signals. Although a great variety of features provides information about different aspects of the working condition, it remains difficult to identify the condition only with a visual estimation. To solve this problem, pattern recognition is employed on the basis of feature extraction. With pattern recognition, the working condition of a gearbox can be classified, and faults can be detected automatically. Therefore, gearbox fault detection consists of feature extraction and pattern recognition [2]. New types of signal-processing techniques for feature extraction have emerged with different theoretical bases. Due to different working environments, not all the signal processing techniques work well for a specific system. Because the nonlinear factors (loads, friction, impact, etc.) have influence on gearbox vibration signals, choosing suitable signal processing techniques to acquire features for accurate and reliable fault detection should be considered. The main feature extraction methods include: timedomain methods, frequency-domain method and timefrequency methods. Time-domain and frequencydomain methods are the basic methods of signal processing. Features extracted with time-domain methods include peak amplitude, root-mean-square amplitude, kurtosis, crest factor, etc. [3]. Frequencydomain methods, including power spectrum, cepstrum analysis, and an envelope spectra technique, have been successfully applied to gear fault diagnosis [4] *Corr. Author’s Address: North China Electric Power University, School of Energy Power and Mechanical Engineering, Beijing, China, 102206, [email protected] 63 Strojniški vestnik - Journal of Mechanical Engineering 61(2015)1, 63-73 to [5]. As the gearbox vibration signals possess nonstationary and non-linear characteristics, it is difficult to diagnose the fault only by using traditional timedomain or frequency-domain methods. To solve this problem, time-frequency methods have been proposed, e.g. short-time Fourier transform (STFT), Wigner-Ville distribution (WVD) and wavelet transform, and have been widely used [6] to [8]. In the abovementioned methods, the wavelet transform that has the capability to offer good frequency resolution for low-frequency components and good time resolution for high-frequency components provides an efficient method for non-stationary signals [9]. Furthermore, discrete wavelet transform (DWT) based on a Mallat algorithm has received widespread attention in recent years. The DWT can be represented as a filtering process in which the signal is separated into a series of sub-bands and wavelet coefficients that are distributed on different frequency bands to reflect the signal feature at each of sub-band [10]. The DWT has been acknowledged to be a successful tool for fault detection [11]. In recent years, many studies on artificial neural networks have been carried out with the aim of determining intelligent fault diagnosis to investigate the potential applications in pattern recognition. It is common to train a neural network by using samples so that it can recognize the required inputoutput characteristics and classify the unknown input patterns [12]. This type of neural network is based on supervised learning, including back-propagation (BP) neural networks, fuzzy networks, probability neural network, etc.; they are commonly used in fault diagnosis [13] to [15]. However, only the patterns that occur in the training samples can be classified. If a new pattern is classified by the neural network, an incorrect result will be given. Both new patterns with original training samples as well as renewal training are needed in order to enable the neural network to recognize new patterns. Therefore, a neural network based on supervised learning cannot function without training samples. To overcome this issue, some unsupervised neural networks have been developed, including self-organizing competitive neural networks, self-organizing feature map neural networks, and adaptive resonance theory networks. They are all used for implementing pattern recognition without training samples [16] to [18]. Regarding this matter, an adaptive resonance theory (ART) neural network can not only recognize objects in a way similar to a brain learning autonomously, but also can solve the plasticity-stability dilemma [18]. Its algorithm can accept new input patterns 64 adaptively without modifying the trained neural network and/or increasing memory capacity with the species of samples. The process of learning, memory and training of an ART neural network proceed synchronously. ART was presented by Carpenter in 1976, and an ART neural network was presented in 1987 [19]. The type of ART neural network presented then was an ART-1 [19]. However, while an ART-1 neural network is appropriate for binary input, it is not appropriate in practical application. For adapting any types of input, an ART-2 neural network was presented [20], and it has been widely used in pattern recognition and fault detection. Lee et al. transferred the estimated parameters by using the ART-2 neural network with uneven vigilance parameters for fault isolation, which showed the effectiveness of the ART-2 neural network-based fault diagnosis method [21]. Lee et al. combined DWT and an ART-2 neural network for fault diagnosis of a dynamic system [22]. Obikawa and Shinozuka developed a monitoring system for classifying the levels of the tool flank wear of coated tools into some categories using an ART-2 neural network [23]. In this study, a new method for crack fault detection is proposed. Considering the non-stationary and non-linear characteristics of the signals, DWT is applied for feature extraction. The current situation of gearbox fault detection is time-consuming, and it is costly (or even impossible) to collect all kinds of known fault samples. Furthermore, an operating gearbox is influenced by its working environment. The samples obtained from a specific gearbox may not be suitable for other gearboxes with different working environments. There is a lack of known samplesfor the training of supervised neural networks. Therefore, an ART-2 neural network is proposed for state recognition and classification. Through the unsupervised classification of the samples via an ART-2 neural network, the changing trend from the normal state to a crack fault before a broken tooth fault occurs can be determined. Meanwhile, to verify the effectiveness of the ART-2 neural network, it is compared with a self-organizing competitive neural network and a self-organizing feature map neural network. This paper is organized as follows: in Section 1, the relative wavelet energy is proposed as a feature and an ART-2 neural network is presented for pattern recognition. In Section 2, the gearbox experiment is introduced. The relative wavelet energy of the signal samples are extracted and compared with the analysis in time and frequency domain, after which the ART-2 neural network is used for recognizing the changing Li, Z. – Ma, Z. – Liu, Y. – Teng, W. – Jiang, R. Strojniški vestnik - Journal of Mechanical Engineering 61(2015)1, 63-73 trend of the crack fault before a broken tooth fault happens. The conclusion is given in Section 3. 1 THEORETICAL BACKGROUND OF DWT AND ART-2 NEURAL NETWORK 1.1 Fundamental of Wavelet Transform 1.1.1 Discrete Wavelet Transform (DWT) The basic analysis wavelet ψ (t ) is a square integrable function, and it meets the following relationship: ∧ Cψ = ∫ ψ (ω ) ω R 2 d ω < ∞, (1) where ψ (ω ) is the Fourier transform of ψ (t ) . Through translation and dilation, a member of the function can be derived from the ψ (t ) . The equation can be described as follows: − 1 ψ a ,b (t ) = a 2 ψ ( t −b ), (2) a where ψ a ,b (t ) is a member of the wavelet basis, a and b represent the scale parameter and translation parameter, respectively. The continuous wavelet transform of a finite-energy signal x(t) is defined as follows: Wψ (a, b) = ∫ +∞ −∞ =a − 1 2 ∫ +∞ −∞ x(t )ψ * ( j A0 [ x(t )] = x(t ), (5) Aj [ x(t )] = ∑ H (2t − k ) Aj −1[ x(t )], (6) k D j [ x(t )] = ∑ G (2t − k ) Aj −1[ x(t )], (7) k where x(t) is the original signal, j is the decomposition level (j = 1, 2, …, J). H and G are wavelet decomposition filters for low-pass filtering and highpass filtering, respectively. Aj and Dj are the low frequency wavelet coefficients (Approximations) and the high frequency wavelet coefficients (Details) of signal x(t) at the jth level, respectively. The decomposition procedure of a J-level DWT is shown in Fig.1. It can be seen that Dj and Aj are obtained through high-pass filtering and low-pass filtering with down-sampling at each level. After the signal x(t) is decomposed by the J-level DWT, Dj at each level and AJ at the Jth level are obtained. Therefore, the DWT based on Mallat algorithm can be represented as a filtering process that the signal is decomposed into a series of sub-bands. t −b )dt , (3) a Wψ ( j , k ) = ∫ x(t )ψ *j ,k (t )dt , (4) − x(t )ψ a*,b (t )dt = where * denotes complex conjugation and Wψ (a, b) is wavelet coefficients. As seen in Eqs. (2) and (3), ψ a ,b (t ) can be regarded as a window function. a and b are used to adjust the frequency and time location of the wavelet. A small a offers high-frequency resolution and is useful in extracting high-frequency components of signals. a increases in response to the decrease in frequency resolution but the increase in time resolution and low-frequency components is easily extracted. The DWT is derived from the CWT through the discretization of the parameters a and b. Generally, a is replaced by 2j and b is replaced by k2j ( j , k ∈ Z ). Wψ (a, b) can be shown as: The Mallat algorithm is a breakthrough of the DWT, providing a fast algorithm and achieves multiresolution analysis of signals. Wavelet filters are used for decomposition and re-construction. It is shown in Eqs. (5) to (7). where ψ j ,k (t ) = 2 2ψ (2− j t − k ) . Fig. 1. Decomposition procedure of J-level DWT Dj and DJ can be used to reconstruct the signal branch separately, which represents the signal component in each sub-band through up-sampling and reconstruction filter h and g. The reconstruction process is shown in Fig. 2. D j (t ) and A J (t ) are represented as the signal branch reconstruction of Dj and AJ, respectively. The original signal x(t) can be regarded as the sum of each component. It can be described as: J x(t ) = A J (t ) + ∑ D j (t ). (8) j =1 Crack Fault Detection for a Gearbox Using Discrete Wavelet Transform and an Adaptive Resonance Theory Neural Network 65 Strojniški vestnik - Journal of Mechanical Engineering 61(2015)1, 63-73 feature of signals and used for future work in pattern recognition. 1.2 Fundamental of ART-2 Neural Network 1.2.1 Structure of ART-2 Neural Network Fig. 2. Reconstruction for the component of the signal in each sub-band 1.1.2 Relative Wavelet Energy The signal components derived through decomposition and reconstruction of DWT are distributed into independent sub-bands, and the component energy in each sub-band contains information available for fault detection. When a gear fault occurs, non-stationary and non-linear vibration energy is generated, which leads to a change of signal energy in some sub-bands. As the DWT has the characteristic of multi-resolution analysis, which makes it suitable for the analysis of non-stationary and non-linear signals, the DWT is used for feature extraction and the relative wavelet energy is proposed and calculated as the feature. The procedure is as follows: (1) Decomposition by J-level DWT for the N-point signal x(t) to obtained Dj (j = 1, 2, …, J) and AJ. (2) Reconstruction for Dj and AJ to obtain the signal components D j (t ) and A J (t ) in each sub-band. The length of D j (t ) and A J (t ) are the same as that of x(t). (3)Let A J (t ) = D J +1 (t ) and the wavelet sub-band energy in each sub-band is calculated as: The structure of an ART-2 neural network is shown in Fig. 3. It consists of two subsystems: the attentional subsystem and the orienting subsystem. The attentional subsystem consists of two layers: the comparison layer (F1) and the recognition layer (F2). The orienting subsystem is the reset system, which is represented as the trigonal part R. The F1 layer that contains n groups of neurons is used to accept an n-dimension input pattern (x1, x2, ..., xn). The F2 layer has m neurons, each of which represents a type of pattern or category. The neurons in the two layers form the short-term memory of the neural network. The F1 layer and F2 layer are connected by weights that form the long-term memory. With the processing of the F1 layer and weights, the input pattern is transferred to the F2 layer, and the output of the F2 layer (y1, y2, ..., ym) is obtained. The maximum value of output is chosen, and the corresponding neuron is activated as the winning neuron. If the degree of match between the feedback of the F2 layer and the output of the F1 layer is less than the threshold value, the orienting subsystem will reset the F2 layer, and the activated neuron will be restrained. Next, the winning neuron is again chosen from the F2 layer until the degree of match meets the requirements, and the weights connected to the activated neuron are modified at the same time. N 2 2 E j = D j (t ) = ∑ d j (k ) , (9) k =1 where N is the number of the data samples of D j (t ) , k represents the time-series of data samples, and dj(k) is the data sample of D j (t ) (i.e. d j (k ) ∈ D j (t ) , j = 1, 2, …, J+1). (4) The relative wavelet energy σj in each sub-band is shown as: σ j = E j / Etotal , (10) J +1 N 2 J +1 where Etotal = ∑ ∑ d j (k ) = ∑ E j . j =1 k =1 j =1 According to the above analysis, it can be seen that the DWT has a multi-resolution analytical property and that the relative wavelet energy can reflect the energy distribution of signals in different sub-bands. Thus, the relative wavelet energy is chosen as the 66 Fig. 3. Structure of ART-2 neural network 1.2.2 Algorithm of ART-2 Neural Network A topological structure is shown in Fig. 4 that describes the connection between the ith group of Li, Z. – Ma, Z. – Liu, Y. – Teng, W. – Jiang, R. Strojniški vestnik - Journal of Mechanical Engineering 61(2015)1, 63-73 neurons in the F1 layer and the jth neuron in the F2 layer. It can be seen that the F1 layer includes three levels. Two types of neurons exist in each level. The neurons represented by hollow circles are used to calculate the module of the input vector and transfer the inhibitive incentive; the neurons represented by filled circles are used to transfer excited incentives. F2 layer to the neuron pi in F1 layer and g(yj) is the feedback of the jth neuron in F2 layer. f(x) is a non-linear transformation function, which is shown in Eq. (17). 2θ x 2 / ( x 2 + θ 2 ) 0 ≤ x ≤ θ f ( x) = , (17) x x ≥ θ where θ is the anti-noise coefficient ( θ = 1 n ). (2) Calculation in the F2 layer The jth neuron in F2 level receives the output of neuron pi which can be described as: n T j = ∑ pi wij j = 1, 2,..., m, (18) i =1 where wij is the connected weight from the neuron pi in F1 layer to the jth neuron in F2 layer. The activated neuron is determined by Eq. (19): T j* max{ = Tj } j 1, 2,..., m (19) = Fig. 4. Topological of ART-2 neural network The algorithm process of an ART-2 neural network is shown as follows: (1) Calculation in the F1 layer The lower level of F1 layer receives the input xi , and the upper level receives the feedback of the F2 layer. These two levels are combined with the middle level separately, and positive feedback loops are formed. The algorithms in each level are shown in Eqs. (11) to (16). zi = xi + aui , (11) qi = zi / (e + Z ), (12) vi = f (qi ) + bf ( si ), (13) ui = vi / (e + V ), (14) si = pi / (e + P ), (15) pi = ui + ∑ g ( y j )t ji , (16) m j =1 where a and b are the coefficients of positive feedback (a > 1, b > 1), e is far less than 1. tji refers to the connected weight from the jth neuron in where j* refers to the serial number of activated neuron. The feedback of each neuron in F2 layer is calculated as: d g( y j ) = 0 j = j* j ≠ j* , (20) where d is the learning rate (0 < d < 1). According to Eq. (20), Eq. (16) can be described as: ui + dt ji pi = ui j = j* j ≠ j* . (21) (3) Calculation of the orienting subsystem According to Eqs. (11) to (16), it can be seen that the vector U = (u1, u2, ..., ui, ..., un) contains the features of input vector X, and the feedback features of F2 layer are included in the vector P = (p1, p2, ..., pi, ..., pn). Through comparing the degree of match between the vectors U and P, the orienting subsystem can determine whether the F2 layer should be reset. The degree of match ||R|| can be calculated as: R = ui + cpi , (22) e + U + cP where c is the weighting coefficient (c ≤ 1 / d – 1). The greater ||R|| is, the more similar the vectors U and P are. Define parameter ρ as the threshold Crack Fault Detection for a Gearbox Using Discrete Wavelet Transform and an Adaptive Resonance Theory Neural Network 67 Strojniški vestnik - Journal of Mechanical Engineering 61(2015)1, 63-73 value (0 < ρ < 1). When ||R|| > ρ, the F2 layer need not be reset, and the weights are modified directly. Otherwise, the orienting subsystem will reset the F2 layer. The activated neuron is restrained and chosen again from the F2 layer. Furthermore, the degree of match is repeatedly calculated until it meets the requirements, i.e. ||R|| > ρ. 2.2 Experiment Specification Fig. 6 shows a diagram of the experimental system used for analysing the changing trend of the crack fault. The gearbox is single-stage with helical cylindrical gears. Table 1 lists the parameters of the experimental system. (4) Modification of the weights After the winning neuron j* is determined, the weights connected to the activated neuron are modified according to Eqs. (23) and (24). wij* (k + 1) = wij* (k ) + d (1 − d )[ t j*i (k + 1) = t j*i (k ) + d (1 − d )[ ui (k ) − wij* (k )], (23) 1− d ui (k ) − t j*i (k )]. (24) 1− d 2 FEATURE EXTRACTION AND PATTERN RECOGNITION OF GEARBOX VIBRATION SIGNAL Fig. 6. Structure of experiment gearbox Table 1. Parameters of the experimental system 2.1 Method for Crack Fault Detection Motor A schematic representation of the proposed method is shown in Fig. 5. First, the sample series of the gearbox is acquired, and the relative wavelet energy features are extracted by DWT. Next, an ART-2 neural network is used for the recognition and classification of the sample series. Through the unsupervised classification, the samples of the same state are classified into the same category, and those of different states are classified into separate categories. Finally, the recognition result is output, and the changing trend from the normal state to the crack fault can be recognized from the classification of the samples. Gearbox Rated speed Number of teeth of driving gear Number of teeth of driven gear Mesh frequency 1120 rpm 75 17 1400 Hz The vibration signal of the gearbox was collected with a piezoelectric accelerometer, and the sampling frequency was 8000 Hz. The process of the driven gear from the normal state to a broken tooth fault was recorded with a monitoring system. The entire measuring time was 8 minutes, during which it took approximately 90 seconds for the motor to reach its rated speed. The rated speed was maintained for 290 seconds with constant load, after which a broken tooth fault occurred on the driven gear. The collected vibration signal contained the information of the change of state for the driven gear changes: normal state, crack formation, crack expansion and broken tooth fault. 2.3 Analysis of Time and Frequency Domain Fig. 5. Scheme of the proposed method 68 The time vibration signal is shown in Fig. 7a. In the first 90 seconds, the vibration amplitude increases with the rotational speed. The amplitude changes to steady in the following 290 seconds in which rotational speed of the motor reaches the rated speed, and the system enters a normal working state. At 380 s, the amplitude increases noticeably, and a broken tooth fault occurs. Li, Z. – Ma, Z. – Liu, Y. – Teng, W. – Jiang, R. 200 (a) vibration signal 0 0 100 200 300 400 200 300 400 (b) peak 200 0 0 K 15 100 (c) standard deviation 0 100 200 10 300 5 0 10 400 (d) kurtosis 10 10 PI 0 50 2 2 STD [m/s2] 100 power spectrum density of the four signal sections is calculated, and the results are shown in Fig. 9. The value of the integral for the faulted logarithmic power spectrum density is higher than the others; there is no obvious changing trend from initial to later period. Therefore, the crack changing process before the broken tooth fault occurs cannot be identified by using frequency-domain analysis. PSD [(m/s ) /Hz] -200 P [m/s2] A [m/s2] Strojniški vestnik - Journal of Mechanical Engineering 61(2015)1, 63-73 0 100 200 300 400 (e) peak index 10 10 4 initial middle later faulted 2 0 -2 5 0 0 100 200 t [s] 300 400 10 0 Fig. 7. Gearbox vibration signal and the time-domain features 1000 2000 f [Hz] 3000 4000 Fig. 8. Logarithmic power spectrum density of the four signal section 3 Integral of PSD [ms-2] During the normal working state (90 to 380 s), the vibration amplitude remains steady, and no abnormal condition that suggests a symptom of a broken tooth fault can be observed. The vibration signal is analysed using time-domain analysis. Four types of time-domain features are employed: peak, standard deviation, kurtosis, and peak index. The changing process of the features is shown in Fig. 7b to d. The features change noticeably only in the stage of increasing speed (0 to 90 s) and that of a broken tooth fault (380 to 480 s). However, the features do not change significantly during the normal working state (90 to 380 s). Neither the symptom of a broken tooth fault nor the information of crack formation and expansion can be acquired. Early fault detection via time-domain analysis only is difficult to obtain. Four signal sections are extracted from the vibration signal at 90, 200, 310 and 390 s; the length of each signal section is 0.25 s. They are represented as the four states of the operating gearbox including initial, middle, later and faulted. These signal sections are analysed using a logarithmic power spectrum, and the logarithmic power spectrum density (PSD) are shown in Fig. 8. The faulted state can be clearly identified, but the rest overlap each other. The initial period, the middle period and later period cannot be distinguished clearly. The integral for the logarithmic -4 4 ×10 2 1 0 initial middle later faulted Fig. 9. Integral of logarithmic power spectrum density of the four signal section 2.4 Analysis Based on the Relative Wavelet Energy According to the above analysis, the broken tooth fault can be diagnosed by using traditional methods of time and frequency domain analysis, but neither obvious symptoms nor changing trend of the fault can be obtained before the broken tooth fault occurs. When the crack occurred on the gear and expanded gradually, non-linear vibration energy was generated that led to a change of signal energy in the sub-bands. Crack Fault Detection for a Gearbox Using Discrete Wavelet Transform and an Adaptive Resonance Theory Neural Network 69 Strojniški vestnik - Journal of Mechanical Engineering 61(2015)1, 63-73 Therefore, the vibration signal from 90 to 380 s (i.e. the normal working state before the broken tooth fault happens) is analysed here and divided into 130 sections. In each section, 1 second of data with 8000 points is extracted and analysed via the 4-level DWT. The relative wavelet energy of the five sub-bands is calculated according to Eqs. (9) and (10), as shown in Fig. 10. A slight decrease and increase of the relative wavelet energy are found in d1 and d2, respectively. However, in the sub-bands of d3, d4 and a5, the relative wavelet energy shows an obviously increasing trend. Thus, the relative wavelet energy in different sub-bands can be used as the features for reflecting the changing trend of operating state of the gear. It can be seen from the above analysis that the relative wavelet energy based on DWT can essentially reflect the changing trend of the crack. However, the development process of the gear crack fault cannot be recognized, which makes early fault diagnosis difficult. Therefore, it is essential to introduce a method of pattern recognition for crack fault detection. d3 d2 0.9 0.8 0.7 (a) 0 50 100 150 200 250 50 100 150 200 250 (b) 0 12 d4 a5 0 50 -3 x 10 4 (d) 3.5 3 2.5 50 0 -4 x 10 10 (e) 100 100 150 150 200 200 250 250 5 0 1 , t ji = 0, (25) (1 − d ) n where i = 1, 2, ..., n and j = 1, 2, ..., m. To obtain better classification results, many experiments have been performed to set the parameters mentioned in Section 1.2, which are shown as follows: a = 10, b = 10, c = 0.1, d = 0.9, e = 10-8. θ is 0.4472, according to Section 1.2. Next, the sample matrix is classified with the ART-2 neural network. The threshold value ρ affects the number of categories. The bigger the threshold value is, the more precise the classification result is; the number of categories increases with the threshold value. Fig. 11 shows the relationship between the number of categories and the threshold value. (c) 0.03 0.02 50 100 150 t [s] 200 10 8 6 4 2 250 Fig. 10. Relative wavelet energy of the vibration signal 2.5 Pattern Recognition for Crack Fault Detection Based on an ART-2 Neural Network On the basis of extracting the relative wavelet energy as an input eigenvector, an ART-2 neural network is proposed in order to recognize the changing trend 70 wij = The number of categories d1 0.2 0.1 0 of crack faults for early fault diagnosis. The process is mainly divided into four parts: normal state, mild wear, micro-crack and crack expansion. The analysed signal and the extracted features mentioned in Section 2.4 are used here for the pattern recognition of an ART-2 neural network. A sample matrix is acquired with 130 samples and 5 features. The neural network is designed as follows: The number of neurons in the F1 layer is 5 (n = 5), which are used to receive the features of each sample. The number of neurons in the F2 layer is 130 (m = 130) which are the same as the number of samples. The connected weights are initialized according to Eq. (25). 0 0.8 0.85 0.95 0.9 Threshold value ρ 1 Fig. 11. Changes in the number of categories with the threshold value The classification results with the different number of categories are shown in Fig. 12. In Fig. 12a, 130 samples are almost classified into the 1st category; only a few of samples belongs to the 2nd category, Li, Z. – Ma, Z. – Liu, Y. – Teng, W. – Jiang, R. Strojniški vestnik - Journal of Mechanical Engineering 61(2015)1, 63-73 which is because the threshold value is low, and the degree of match is not high. In this case, the changing trend of crack faults cannot be identified. When the threshold value is increased, three and four categories can be obtained, shown in Figs. 12b and c. The stage change can be reflected briefly from the classification categories, but identifying the changing trend of crack faults remains difficult. A high threshold value causes the number of categories to be excessive, as is seen in Fig. 12d. The stage change is so confusing that the changing trend cannot be analysed. Therefore, neither too high nor too low a threshold value is suitable for the pattern recognition of the crack fault. 3 2 4 3 2 1 0 5 4 3 2 1 0 10 8 6 4 2 0 (a) 0 20 40 60 80 100 120 140 40 60 80 100 120 140 (b) 0 20 (a) 6 1—normal state 2—mild wear 3—micro crack 4—crack expansion 5 (c) 4 0 20 40 60 80 100 120 3 140 2 1 (d) 0 20 0 40 60 80 100 Sample series 120 140 Fig. 12. The classification results with the different number of categories; a) ρ = 0.9, b) ρ = 0.96, c) ρ = 0.967, and d) ρ = 0.996 Through many experiments, the best pattern recognition can be acquired when the threshold value ρ is set 0.97 to 0.974, following which five categories are classified, according to Fig. 10. The classification result with five categories is shown in Fig. 13a. According to the distribution of samples, the entire operating process can be divided into four stages to represent the development process of a crack fault from the normal state to crack expansion. In the first stage (samples 1 to 21), the gearbox enters into a normal working state, and the gear is in a healthy state. Therefore, the classification result is steady. The first stage can be regarded as the normal state. In the second stage (samples 22 to 60), a new category (i.e. the 2nd category) occurs. The sample category switches between the 1st and the 2nd categories. This stage is different from the first stage but has the characteristics 1 0 2 20 40 3 60 4 80 100 120 140 80 100 120 140 80 100 120 140 (b) 6 5 Category Category 1 0 of the first category. It indicates that the mild wear has just been formed, and the vibration increases slightly but not significantly. In the third stage (samples 61 to 100), the samples are classified into the 3rd category. The category in this stage is clearly distinct from the first two stages. It indicates that the micro-crack may occur on the gear that makes the vibration greater than that of the second stage. Under the influence of the alternating load, the micro-crack will gradually expand, while the vibration clearly and simultaneously increases. In the fourth stage (samples 101 to 130), new categories occur (i.e. the 4th category and the 5th category). Most of the samples in this stage are classified into the 4th category and a few samples are classified into the 5th category. According to the above analysis, the crack expansion exists in the fourth stage until the broken tooth fault occurs. It can be inferred that the crack fault has been serious from the start of 101st sample. Shutdown and maintenance are needed for the gearbox. Therefore, early fault detection is achieved. 4 3 2 1 0 0 20 40 60 (c) 6 5 4 3 2 1 0 0 20 40 60 Sample series Fig. 13. The classification result by using: a) ART-2 neural network proposed in this paper, b) self-organizing competitive neural network, and c) self-organizing feature map neural network Crack Fault Detection for a Gearbox Using Discrete Wavelet Transform and an Adaptive Resonance Theory Neural Network 71 Strojniški vestnik - Journal of Mechanical Engineering 61(2015)1, 63-73 The effectiveness of the ART-2 neural network is verified through comparisons with a self-organizing competitive neural network and a self-organizing feature map neural network. The same data are used for these networks, and the recognition results are shown in Figs. 13b and c. Through a comparison with the result shown in Fig. 13a, it can be seen that the recognition result is not obvious. The state of the sample series cannot be classified effectively by these two networks. Furthermore, the changing trend is also complex. Therefore, the crack fault cannot be detected effectively, which demonstrates the effectiveness of the DWT and the ART-2 neural networks in this paper. 3 CONCLUSIONS (1) For the detection of crack faults in a gearbox, a new approach using the discrete wavelet transform, and an adaptive resonance theory neural network is proposed in this paper. (2)The signal can be decomposed into a series of sub-bands based on the discrete wavelet transform; the relative wavelet energy is proposed to reflect the energy distribution of signals in different sub-bands. An adaptive resonance theory neural network based on unsupervised learning is proposed and designed for recognizing the changing trend of crack faults without known samples. (3) An experiment with a crack fault in the gearbox is implemented and analysed, using the proposed method. The results show that the relative wavelet energy extracted by discrete wavelet transform can extract the fault feature effectively. Through comparison with different unsupervised neural networks, it is verified that an adaptive resonance theory neural network can clearly recognize the changing trend from the normal state to a crack fault via crack fault detection with an appropriate threshold value. It provides a new tool for condition monitoring and early fault diagnosis of gearboxes. 4 ACKNOWLEDGEMENTS The research presented in this paper was supported by National Natural Science Foundation of China (No. 51305135). 5 REFERENCES [1] Ognjanović, M.B., Ristić, M., Vasin, S. (2013). BWE traction units failures caused by structural elasticity and gear 72 resonances. Tehnički Vjesnik – Technical Gazette, vol. 20, no. 4, p. 599-604. [2] Wenyi, L., Zhenfeng, W., Jiguang, H., Guangfeng, W. (2013). Wind turbine fault diagnosis method based on diagonal spectrum and clustering binary tree SVM. Renewable Energy, vol. 50, p. 1-6, DOI:10.1016/j.renene.2012.06.013. [3] Bin, G.F., Gao, J.J., Li, X.J., Dhillon, B.S. (2012). Early fault diagnosis of rotating machinery based on wavelet packets— Empirical mode decomposition feature extraction and neural network. Mechanical Systems and Signal Processing, vol. 27, p. 696-711, DOI:10.1016/j.ymssp.2011.08.002. [4] Mark, W.D., Lee, H., Patrick, R., Coker, J.D. (2010). A simple frequency-domain algorithm for early detection of damaged gear teeth. Mechanical Systems and Signal Processing, vol. 24, no. 8, p. 2807-2823, DOI:10.1016/j.ymssp.2010.04.004. [5] Badaoui, M.E., Guillet, F., Daniere, J. (2004). New applications of the real cepstrum to gear signals, including definition of a robust fault indicator. Mechanical Systems and Signal Processing, vol. 18, no. 5, p. 1031-1046, DOI:10.1016/j. ymssp.2004.01.005. [6] Sharma, G.K., Kumar, A., Babu Rao, C., Jayakumar, T., Raj, B. (2013). Short time Fourier transform analysis for understanding frequency dependent attenuation in austenitic stainless steel. NDT & E International, vol. 53, p. 1-7, DOI:10.1016/j.ndteint.2012.09.001. [7] Peng, Z.K., Tse, P.W., Chu, F.L. (2005). A comparison study of improved Hilbert–Huang transform and wavelet transform: application to fault diagnosis for rolling bearing. Mechanical systems and signal processing, vol. 19, no. 5, p. 974-988, DOI:10.1016/j.ymssp.2004.01.006. [8] Fang, N., Pai, P.S., Edwards, N. (2012). Tool-edge wear and wavelet packet transform analysis in high-speed machining of Inconel 718. Strojniski vestnik – Journal of Mechanical Engineering, vol. 58, no. 3, p. 191-202, DOI:10.5545/svjme.2011.063. [9] Al-Badour, F., Sunar, M., Cheded, L. (2011). Vibration analysis of rotating machinery using time–frequency analysis and wavelet techniques. Mechanical Systems and Signal Processing, vol. 25, no. 6, p. 2083-2101, DOI:10.1016/j. ymssp.2011.01.017. [10] Rosso, O.A., Martin, M.T., Figliola, A., Keller, K., Plastino, A. (2006). EEG analysis using wavelet-based information tools. Journal of Neuroscience Methods, vol. 153, no. 2, p. 163-182, DOI:10.1016/j.jneumeth.2005.10.009. [11] Saravanan, N., Ramachandran, K.I. (2010). Incipient gear box fault diagnosis using discrete wavelet transform (DWT) for feature extraction and classification using artificial neural network (ANN). Expert Systems with Applications, vol. 37, no. 6, p. 4168-4181, DOI:10.1016/j.eswa.2009.11.006. [12] Fan, J., Song, Y., Fei, M. (2008). ART2 neural network interacting with environment. Neurocomputing, vol. 72, no. 1-3, p. 170-176, DOI:10.1016/j.neucom.2008.02.026. [13] Sun, Y.J., Zhang, S., Miao, C.X., Li, J.M. (2007). Improved BP neural network for transformer fault diagnosis. Journal of China University of Mining and Technology, vol. 17, no. 1, p. 138-142, DOI:10.1016/S1006-1266(07)60029-7. [14] Čuš, F., Župerl, U. (2011). Real-time cutting tool condition monitoring in milling. Strojniski vestnik – Journal of Mechanical Li, Z. – Ma, Z. – Liu, Y. – Teng, W. – Jiang, R. Strojniški vestnik - Journal of Mechanical Engineering 61(2015)1, 63-73 Engineering, vol. 57, no. 2, p. 142-150, DOI:10.5545/svjme.2010.079. [15] Wang, C., Zhou, J., Qin, H., Li, C., Zhang, Y. (2011). Fault diagnosis based on pulse coupled neural network and probability neural network. Expert Systems with Applications, vol. 38, no. 11, p. 14307-14313, DOI:10.1016/j. eswa.2011.05.095. [16] Xu, P., Xu, S., Yin, H. (2007). Application of self-organizing competitive neural network in fault diagnosis of suck rod pumping system. Journal of Petroleum Science and Engineering, vol. 58, no. 1-2, p. 43-48, DOI:10.1016/j. petrol.2006.11.008. [17] Ghosh, S., Patra, S., Ghosh, A. (2009). An unsupervised context-sensitive change detection technique based on modified self-organizing feature map neural network. International Journal of Approximate Reasoning, vol. 50, no. 1, p. 37-50, DOI:10.1016/j.ijar.2008.01.008. [18] Grossberg, S. (2013). Adaptive Resonance Theory: How a brain learns to consciously attend, learn, and recognize a changing world. Neural Networks, vol. 37, p. 1-47, DOI:10.1016/j. neunet.2012.09.017. [19] Carpenter, G.A., Grossberg, S. (1987). A massively parallel architecture for a self-organizing neural pattern recognition machine. Computer Vision, Graphics, and Image Processing, vol. 37, no. 1, p. 54-115, DOI:10.1016/S0734189X(87)80014-2. [20] Carpenter, G.A., Grossberg, S. (1987). ART 2: Self-organization of stable category recognition codes for analog input patterns. Applied Optics, vol. 26, no. 23, p. 4919-4930, DOI:10.1364/ AO.26.004919. [21] Lee, I.S., Kim, J.T., Lee, J.W., Lee, D.Y., Kim, K.Y. (2003). Modelbased fault detection and isolation method using ART2 neural network. International Journal of Intelligent Systems, vol. 18, no. 10, p. 1087-1100, DOI:10.1002/int.10134. [22] Lee, I.S., Lee, S.J., Kim, Y.W. (2010). Fault diagnosis based on discrete wavelet transform and ART2 neural network. SICE Annual Conference Proceedings, p. 3365-3370. [23] Obikawa, T., Shinozuka, J. (2004). Monitoring of flank wear of coated tools in high speed machining with a neural network ART2. International Journal of Machine Tools and Manufacture, vol. 44, no. 12-13, p. 1311-1318, DOI:10.1016/j.ijmachtools.2004. 04.021. Crack Fault Detection for a Gearbox Using Discrete Wavelet Transform and an Adaptive Resonance Theory Neural Network 73


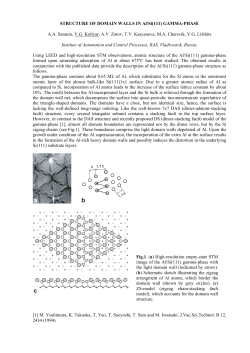


© Copyright 2026