
FORM N-Q SECURITIES AND EXCHANGE COMMISSION
SECURITIES AND EXCHANGE COMMISSION FORM N-Q Quarterly schedule of portfolio holdings of registered management investment company filed on Form N-Q Filing Date: 2014-10-27 | Period of Report: 2014-08-31 SEC Accession No. 0001193125-14-382672 (HTML Version on secdatabase.com) FILER VALUED ADVISERS TRUST CIK:1437249| IRS No.: 262762915 Type: N-Q | Act: 40 | File No.: 811-22208 | Film No.: 141173844 Mailing Address 2960 N MERIDIAN STREET STE 300 INDIANAPOLIS IN 46208 Copyright © 2014 www.secdatabase.com. All Rights Reserved. Please Consider the Environment Before Printing This Document Business Address 2960 N MERIDIAN STREET STE 300 INDIANAPOLIS IN 46208 317-917-7000 UNITED STATES SECURITIES AND EXCHANGE COMMISSION Washington, DC 20549 FORM N-Q QUARTERLY SCHEDULE OF PORTFOLIO HOLDINGS OF REGISTERED MANAGEMENT INVESTMENT COMPANY Investment Company Act file number 811-22208 Valued Advisers Trust (Exact name of registrant as specified in charter) Huntington Asset Services, Inc. 2960 N. Meridian Street, Suite 300 Indianapolis, IN 46208 (Address of principal executive offices) (Zip code) Capitol Services, Inc. 615 S. Dupont Hwy. Dover, DE 19901 (Name and address of agent for service) With a copy to: John H. Lively, Esq. The Law Offices of John H. Lively & Associates, Inc. A member firm of The 1940 Act Law Group 11300 Tomahawk Creek Parkway, Suite 310 Leawood, KS 66211 Registrants telephone number, including area code: 317-917-7000 Date of fiscal year end: 5/31 Date of reporting period: 8/31/14 Copyright © 2013 www.secdatabase.com. All Rights Reserved. Please Consider the Environment Before Printing This Document Item 1. Schedule of Investments. Copyright © 2013 www.secdatabase.com. All Rights Reserved. Please Consider the Environment Before Printing This Document BFS Equity Fund Schedule of Investments August 31, 2014 (Unaudited) Shares Fair Value 5,000 $539,900 2,300 3,000 200,307 277,470 477,777 950 1,800 90,269 193,644 283,913 2,300 165,669 2,000 2,200 263,100 213,686 476,786 2,700 8,500 333,801 437,240 771,041 3,150 322,875 5,000 447,750 10,000 9,000 160,900 535,050 695,950 3,000 149,460 2,300 236,923 2,500 274,100 1,800 2,500 217,944 151,300 369,244 4,000 310,280 1,500 4,000 140,580 311,240 451,820 Common Stocks 99.54% Aerospace & Defense 3.79% United Technologies Corp. Beverages 3.36% Constellation Brands, Inc. - Class A * PepsiCo, Inc. Biotechnology 1.99% Celgene Corp. * Gilead Sciences, Inc. * Capital Markets 1.16% State Street Corp. Chemicals 3.35% Praxair, Inc. Westlake Chemical Corp. Commercial Banks 5.41% M&T Bank Corp. Wells Fargo & Co. Computers & Peripherals 2.27% Apple, Inc. Consumer Finance 3.14% American Express Co. Diversified Financial Services 4.89% Bank of America Corp. JPMorgan Chase & Co. Diversified Telecommunication 1.05% Verizon Communications, Inc. Electronic Equipment, Instruments & Components 1.66% Amphenol Corp. - Class A Energy Equipment & Services 1.93% Schlumberger Ltd. Food & Staples Retailing 2.59% Costco Wholesale Corp. Walgreen Co. Food Products 2.18% Nestle SA ADR Hotels, Restaurants & Leisure 3.17% McDonalds Corp. Starbucks Corp. See accompanying notes which are an integral part of this schedule of investments. Copyright © 2013 www.secdatabase.com. All Rights Reserved. Please Consider the Environment Before Printing This Document Household Products 2.47% Colgate-Palmolive Co. Procter & Gamble Co. Industrial Conglomerates 4.04% Danaher Corp. Internet Software & Services 2.86% Google, Inc. - Class A * Life Sciences Tools & Services 2.95% Thermo Fisher Scientific, Inc. Machinery 0.71% Deere & Co. Media 3.79% Walt Disney Co./The Oil, Gas & Consumable Fuels 9.50% Continental Resources, Inc. * EOG Resources, Inc. Exxon Mobil Corp. Imperial Oil Ltd. Occidental Petroleum Corp. Pharmaceuticals 9.64% Johnson & Johnson Merck & Co., Inc. Novartis AG ADR Pfizer, Inc. Zoetis, Inc. Professional Services 1.98% Nielsen NV Real Estate Investment Trust 1.44% WP Carey, Inc. Road & Rail 2.24% Canadian National Railway Co. Kansas City Southern Software 6.35% Adobe Systems, Inc. * ANSYS, Inc. * Microsoft Corp. Specialty Retail 2.95% Home Depot, Inc./The Telecommunication Services 1.89% Level 3 Communications, Inc. * Textiles, Apparel & Luxury Goods 3.41% Luxottica Group SpA ADR NIKE, Inc. See accompanying notes which are an integral part of this schedule of investments. Copyright © 2013 www.secdatabase.com. All Rights Reserved. Please Consider the Environment Before Printing This Document 3,000 1,900 194,190 157,909 352,099 7,500 574,575 700 407,652 3,500 420,735 1,200 100,908 6,000 539,280 1,700 4,500 1,400 2,500 3,000 274,193 494,460 139,244 133,125 311,190 1,352,212 4,000 4,000 2,600 8,000 7,000 414,920 240,440 233,584 235,120 248,080 1,372,144 6,000 281,940 3,000 204,840 2,200 1,400 158,092 161,504 319,596 3,000 4,000 8,000 215,700 325,200 363,440 904,340 4,500 420,750 6,000 269,760 2,500 4,500 132,450 353,475 485,925 Tobacco 1.38% Genesee & Wyoming, Inc. - Class A * Total Common Stocks (Cost $12,971,155) Money Market Securities 4.03% 2,000 14,176,904 Fidelity Institutional Money Market - Prime Money Market Portfolio, 0.06% (a) Total Money Market Securities (Cost $573,473) Total Investments 103.57% (Cost $13,544,628) Liabilities in Excess of Other Assets (3.57)% TOTAL NET ASSETS 100.00% (a) * 196,660 Rate disclosed is the seven day yield as of August 31, 2014. Non-income producing security. ADR American Depositary Receipt See accompanying notes which are an integral part of this schedule of investments. Copyright © 2013 www.secdatabase.com. All Rights Reserved. Please Consider the Environment Before Printing This Document 573,473 573,473 573,473 14,750,377 (508,795 ) $14,241,582 At August 31, 2014, the cost and net unrealized appreciation (depreciation) of investments for tax purposes were as follows: Tax Cost of Securities $ 13,567,603 Unrealized Appreciation Unrealized Depreciation Net Unrealized Appreciation $1,214,541 (31,767 ) $1,182,774 The difference between book basis and tax basis unrealized appreciation was attributable primarily to the tax deferral of losses on wash sales of $22,975 for BFS Equity Fund. BFS Equity Fund Notes to the Schedule of Investments August 31, 2014 (Unaudited) The BFS Equity Fund (the Fund) is an investment company and follows accounting and reporting guidance under Financial Accounting Standards Board (FASB) Accounting Standards Codification (ASC) Topic 946, Financial Services-Investment Companies. The following is a summary of significant accounting policies consistently followed by the Fund in the preparation of its financial statements. The policies are in conformity with accounting principles generally accepted in the United States of America (GAAP). Security Transactions and Related Income The Fund follows industry practice and records security transactions on the trade date for financial reporting purposes. The Fund has chosen high cost as its standing (default) tax lot identification method for all securities transactions. Interest income is recorded on an accrual basis and dividend income is recorded on the ex-dividend date except in the case of foreign securities, in which case dividends are generally recorded as soon as such information becomes available. Discounts and premiums on securities purchased are accreted or amortized using the effective interest method. The ability of issuers of debt securities held by the Fund to meet their obligations may be affected by economic and political developments in a specific country or region. Withholding taxes on foreign dividends have been provided for in accordance with the Funds understanding of the applicable countrys tax rules and rates. Securities Valuation and Fair Value Measurements All investments in securities are recorded at their estimated fair value. Fair value is defined as the price that the Fund would receive upon selling an investment in a timely transaction to an independent buyer in the principal or most advantageous market of the investment. GAAP has established a three-tier hierarchy to maximize the use of observable market data and minimize the use of unobservable inputs and to establish classification of fair value measurements for disclosure purposes. Inputs refer broadly to the assumptions that market participants would use in pricing the asset or liability, including assumptions about risk (the risk inherent in a particular valuation technique used to measure fair value such as a pricing model and/or the risk inherent in the inputs to the valuation technique). Inputs may be observable or unobservable. Observable inputs are inputs that reflect the assumptions market participants would use in pricing the asset or liability developed based on market data obtained from sources independent of the reporting entity. Unobservable inputs are inputs that reflect the reporting entitys own assumptions about the assumptions market participants would use in pricing the asset or liability developed based on the best information available in the circumstances. Various inputs are used in determining the value of the Funds investments. These inputs are summarized in the three broad levels listed below. Level 1 quoted prices in active markets for identical securities Level 2 other significant observable inputs (including, but not limited to, quoted prices for an identical security in an inactive market, quoted prices for similar securities, interest rates, prepayment speeds, credit risk, etc.) Level 3 significant unobservable inputs (including the Funds own assumptions in determining fair value of investments based on the best information available) The inputs used to measure fair value may fall into different levels of the fair value hierarchy. In such cases, for disclosure purposes, the level in the fair value hierarchy within which the fair value measurement falls in its entirety, is determined based on the lowest level input that is significant to the fair value measurement in its entirety. Copyright © 2013 www.secdatabase.com. All Rights Reserved. Please Consider the Environment Before Printing This Document BFS Equity Fund Notes to the Schedule of Investments - continued August 31, 2014 (Unaudited) Equity securities, including common stocks, are generally valued by using market quotations, but may be valued on the basis of prices furnished by a pricing service when Bradley, Foster & Sargent, Inc. (the Adviser) believes such prices more accurately reflect the fair value of such securities. Securities that are traded on any stock exchange are generally valued by the pricing service at the last quoted sale price. Lacking a last sale price, an exchange traded security is generally valued by the pricing service at its last bid price. Securities traded in the NASDAQ over-the-counter market are generally valued by the pricing service at the NASDAQ Official Closing Price. When using the market quotations or close prices provided by the pricing service and when the market is considered active, the security will be classified as a Level 1 security. Sometimes, an equity security owned by the Fund will be valued by the pricing service with factors other than market quotations or when the market is considered inactive. When this happens, the security will be classified as a Level 2 security. When market quotations are not readily available, when the Adviser determines that the market quotation or the price provided by the pricing service does not accurately reflect the current fair value, or when restricted or illiquid securities are being valued, such securities are valued as determined in good faith by the Adviser, in conformity with guidelines adopted by and subject to review by the Board of Trustees (the Board). These securities will be categorized as Level 3 securities. Investments in mutual funds, including money market mutual funds, are generally priced at the ending net asset value (NAV) provided by the service agent of the funds. These securities will be categorized as Level 1 securities. In accordance with the Valued Advisers Trust (the Trust) good faith pricing guidelines, the Adviser is required to consider all appropriate factors relevant to the value of securities for which it has determined other pricing sources are not available or reliable as described above. No single standard exists for determining fair value, because fair value depends upon the circumstances of each individual case. As a general principle, the current fair value of an issue of securities being valued by the Adviser would appear to be the amount which the owner might reasonably expect to receive for them upon their current sale. Methods which are in accordance with this principle may, for example, be based on (i) a multiple of earnings; (ii) a discount from market of a similar freely traded security (including a derivative security or a basket of securities traded on other markets, exchanges or among dealers); or (iii) yield to maturity with respect to debt issues, or a combination of these and other methods. Good faith pricing is permitted if, in the Advisers opinion, the validity of market quotations appears to be questionable based on factors such as evidence of a thin market in the security based on a small number of quotations, a significant event occurs after the close of a market but before a Funds NAV calculation that may affect a securitys value, or the Adviser is aware of any other data that calls into question the reliability of market quotations. Good faith pricing may also be used in instances when the bonds the Fund invests in may default or otherwise cease to have market quotations readily available. The following is a summary of the inputs used to value the Funds investments as of August 31, 2014: Assets Common Stocks* Money Market Securities Total Level 1 Quoted Prices in Active Markets $14,176,904 573,473 $14,750,377 Valuation Inputs Level 2 Other Significant Observable Inputs Level 3 Significant Unobservable Inputs $ $ $ $ Total $14,176,904 573,473 $14,750,377 * Refer to Schedule of Investments for industry classifications. The Fund did not hold any investments at any time during the reporting period in which significant unobservable inputs were used in determining fair value; therefore, no reconciliation of Level 3 securities is included for this reporting period. The Trust recognizes transfers between fair value hierarchy levels at the end of the reporting period. There were no transfers between any levels during the period ended August 31, 2014. Copyright © 2013 www.secdatabase.com. All Rights Reserved. Please Consider the Environment Before Printing This Document Cloud Capital Strategic Large Cap Fund Schedule of Investments August 31, 2014 (Unaudited) Shares Fair Value 88 521 56 481 1,020 449 1,726 667 762 490 50 743 567 1,266 605 438 348 379 379 478 546 377 432 1,762 274 741 1,025 702 491 822 346 1,091 43 889 428 286 568 370 1,870 1,512 598 561 515 888 720 650 515 472 766 291 325 $29,918 28,280 30,119 30,892 32,532 27,925 31,952 34,977 28,854 29,075 33,745 27,380 31,029 27,442 28,616 30,466 30,073 16,561 16,275 30,565 29,297 32,420 34,496 30,676 27,744 31,260 34,589 32,384 26,662 28,612 30,401 28,335 30,719 29,804 27,193 32,965 29,897 34,605 31,521 29,539 29,209 33,009 32,887 31,143 28,226 34,106 32,103 32,766 26,404 27,318 26,018 Common Stocks 98.52% Consumer Discretionary 10.96% Amazon.com, Inc. * AutoNation, Inc. * AutoZone, Inc. * Bed Bath & Beyond, Inc. * Best Buy Co., Inc. BorgWarner, Inc. Cablevision Systems Corp. CarMax, Inc. * Carnival Corp. CBS Corp. - Class B Chipotle Mexican Grill, Inc. * Coach, Inc. Comcast Corp. - Class A D.R. Horton, Inc. Darden Restaurants, Inc. Delphi Automotive PLC DIRECTV - Class A * Discovery Communications, Inc. - Class A * Discovery Communications, Inc. - Class C * Dollar General Corp. * Dollar Tree, Inc. * Expedia, Inc. Family Dollar Stores, Inc. Ford Motor Co. Fossil Group, Inc. * GameStop Corp. - Class A Gannett Co., Inc. Gap, Inc./The Garmin Ltd. General Motors Co. Genuine Parts Co. Goodyear Tire & Rubber Co./The Graham Holdings Co. H & R Block, Inc. Harley-Davidson, Inc. Harman International Industries, Inc. Hasbro, Inc. Home Depot, Inc./The International Game Technology Interpublic Group of Cos., Inc./The Johnson Controls, Inc. Kohls Corp. L Brands, Inc. Leggett & Platt, Inc. Lennar Corp. - Class A Lowes Companies, Inc. Macys, Inc. Marriott International, Inc. - Class A Mattel, Inc. McDonalds Corp. Michael Kors Holdings Ltd. * Copyright © 2013 www.secdatabase.com. All Rights Reserved. Please Consider the Environment Before Printing This Document Mohawk Industries, Inc. * Netflix, Inc. * 199 67 See accompanying notes which are an integral part of these schedules of investments. Copyright © 2013 www.secdatabase.com. All Rights Reserved. Please Consider the Environment Before Printing This Document 29,090 31,911 Newell Rubbermaid, Inc. News Corp. - Class A * NIKE, Inc. - Class B Nordstrom, Inc. Omnicom Group, Inc. OReilly Automotive, Inc. * PetSmart, Inc. Priceline.com, Inc. * Pulte Group, Inc. PVH Corp. Ralph Lauren Corp. Ross Stores, Inc. Scripps Networks Interactive, Inc. - Class A Staples, Inc. Starbucks Corp. Starwood Hotels & Resorts Worldwide, Inc. Target Corp. Tiffany & Co. Time Warner Cable, Inc. - Class A Time Warner, Inc. TJX Cos., Inc./The TripAdvisor, Inc. * Twenty-First Century Fox, Inc. * Urban Outfitters, Inc. * VF Corp. Viacom, Inc. - Class B Walt Disney Co./The Whirlpool Corp. Wyndham Worldwide Corp. Wynn Resorts Ltd. Yum! Brands, Inc. 954 1,714 395 436 424 196 504 25 1,527 254 192 439 368 2,671 397 374 505 299 209 427 538 283 837 876 479 344 353 215 406 152 375 31,994 30,212 31,065 30,207 30,501 30,519 36,069 30,843 29,351 29,632 32,468 33,115 29,363 31,195 30,899 31,598 30,336 30,156 30,914 32,870 32,078 28,080 29,644 34,873 30,683 27,944 31,715 32,881 32,884 29,359 27,180 2,544,613 Consumer Staples 10.85% Altria Group, Inc. Archer-Daniels-Midland Co. Avon Products, Inc. Brown-Forman Corp. - Class B Campbell Soup Co. Clorox Co./The Coca-Cola Co./The Coca-Cola Enterprises, Inc. Colgate-Palmolive Co. ConAgra Foods, Inc. Constellation Brands, Inc. - Class A * Costco Wholesale Corp. CVS Caremark Corp. Dr. Pepper Snapple Group, Inc. Estee Lauder Cos., Inc./The - Class A General Mills, Inc. Hershey Co./The Hormel Foods Corp. JM Smucker Co./The Kellogg Co. Kimberly-Clark Corp. Kraft Foods Group, Inc. Kroger Co./The Lorillard, Inc. McCormick & Co., Inc. 1,530 1,434 4,329 671 1,405 712 1,568 1,400 935 2,071 749 555 835 1,088 842 1,182 645 1,315 601 966 576 1,151 1,353 1,007 891 65,897 71,503 60,775 62,164 62,972 63,093 65,398 66,900 60,521 66,688 65,214 67,141 66,325 68,457 64,693 63,074 58,959 66,651 61,695 62,729 62,177 67,783 68,956 60,115 62,097 Copyright © 2013 www.secdatabase.com. All Rights Reserved. Please Consider the Environment Before Printing This Document Mead Johnson Nutrition Co. Molson Coors Brewing Co. - Class B Mondelez International, Inc. - Class A 715 886 1,716 See accompanying notes which are an integral part of these schedules of investments. Copyright © 2013 www.secdatabase.com. All Rights Reserved. Please Consider the Environment Before Printing This Document 68,377 65,537 62,089 Monster Beverage Corp. * PepsiCo, Inc. Philip Morris International, Inc. Procter & Gamble Co. Reynolds American, Inc. Safeway, Inc. Sysco Corp. Tyson Foods, Inc. - Class A Walgreen Co. Wal-Mart Stores, Inc. Whole Foods Market, Inc. 903 730 720 808 1,059 1,884 1,744 1,763 850 841 1,526 79,807 67,481 61,623 67,161 61,918 65,537 65,962 67,091 51,428 63,516 59,720 2,519,224 Energy 10.99% Anadarko Petroleum Corp. Apache Corp. Baker Hughes, Inc. Cabot Oil & Gas Corp. Cameron International Corp. * Chesapeake Energy Corp. Chevron Corp. ConocoPhillips Consol Energy, Inc. Denbury Resources, Inc. Devon Energy Corp. Diamond Offshore Drilling, Inc. Ensco PLC - Class A EOG Resources, Inc. EQT Corp. Exxon Mobil Corp. FMC Technologies, Inc. * Halliburton Co. Helmerich & Payne, Inc. Hess Corp. Kinder Morgan, Inc. Marathon Oil Corp. Marathon Petroleum Corp. Murphy Oil Corp. Nabors Industries Ltd. National Oilwell Varco, Inc. Newfield Exploration Co. * Noble Corp. PLC Noble Energy, Inc. Occidental Petroleum Corp. Paragon Offshore PLC * Peabody Energy Corp. Phillips 66 Pioneer Natural Resources Co. QEP Resources, Inc. Range Resources Corp. Rowan Cos. PLC Schlumberger Ltd. Seventy Seven Energy, Inc. * Southwestern Energy Co. * Spectra Energy Corp. Tesoro Corp. Transocean Ltd. Valero Energy Corp. Williams Cos., Inc./The 538 594 815 1,680 896 1,915 452 695 1,270 3,259 743 1,184 1,084 512 537 565 987 858 508 606 1,682 1,485 668 892 2,129 753 1,386 1,747 761 569 574 3,532 689 256 1,771 661 1,789 547 140 1,242 1,412 992 1,330 1,075 1,010 60,646 60,447 56,380 56,350 66,613 52,086 58,484 56,458 51,157 56,112 56,034 52,021 54,712 56,276 53,223 56,243 61,047 57,981 53,403 61,284 67,735 61,930 60,810 55,717 57,936 65,057 62,105 49,709 54,900 59,039 5,353 56,089 59,972 53,437 62,989 51,909 54,257 59,971 3,287 51,125 58,841 64,251 51,419 58,208 60,054 Copyright © 2013 www.secdatabase.com. All Rights Reserved. Please Consider the Environment Before Printing This Document WPX Energy, Inc. * 2,541 See accompanying notes which are an integral part of these schedules of investments. Copyright © 2013 www.secdatabase.com. All Rights Reserved. Please Consider the Environment Before Printing This Document 67,636 2,550,693 Financials 8.44% ACE Ltd. Aflac, Inc. Allstate Corp./The American Express Co. American International Group, Inc. Ameriprise Financial, Inc. Aon PLC Assurant, Inc. Bank of America Corp. Bank of New York Mellon Corp./The BB&T Corp. Berkshire Hathaway, Inc. - Class B * BlackRock, Inc. Capital One Financial Corp. CBRE Group, Inc. * Charles Schwab Corp./The Chubb Corp./The Cincinnati Financial Corp. Citigroup, Inc. CME Group, Inc. Comerica, Inc. Discover Financial Services E*Trade Financial Corp. * Fifth Third Bancorp. Franklin Resources, Inc. Genworth Financial, Inc. - Class A * Goldman Sachs Group, Inc./The Hartford Financial Services Group, Inc. Hudson City Bancorp, Inc. Intercontinental Exchange Group, Inc. Invesco Ltd. JPMorgan Chase & Co. KeyCorp Legg Mason, Inc. Leucadia National Corp. Lincoln National Corp. Loews Corp. M&T Bank Corp. Marsh & McLennan Cos., Inc. McGraw Hill Financial, Inc. * MetLife, Inc. Moodys Corp. Morgan Stanley NASDAQ OMX Group, Inc./The Northern Trust Corp. Peoples United Financial, Inc. PNC Financial Services Group, Inc. Principal Financial Group, Inc. Progressive Corp./The Prudential Financial, Inc. Regions Financial Corp. SLM Corp. State Street Corp. SunTrust Banks, Inc. T. Rowe Price Group, Inc. Torchmark Corp. Travelers Cos., Inc./The U.S. Bancorp 297 491 525 326 567 267 344 465 2,002 879 803 247 100 385 1,026 1,148 334 645 648 433 617 504 1,431 1,457 544 1,773 185 872 3,133 157 834 547 2,181 620 1,187 601 714 253 609 377 555 359 967 828 490 2,114 353 635 1,221 351 2,919 3,643 458 770 378 569 327 723 Copyright © 2013 www.secdatabase.com. All Rights Reserved. Please Consider the Environment Before Printing This Document 31,607 30,046 32,288 29,167 31,765 33,618 30,010 31,022 32,206 34,456 29,989 33,876 32,974 31,572 32,601 32,725 30,686 31,021 33,458 33,160 31,061 31,409 31,856 29,736 30,747 25,159 33,211 32,321 30,926 29,681 34,074 32,493 29,682 30,596 29,580 33,102 31,249 31,297 32,320 30,566 30,379 33,562 33,193 35,999 33,969 31,599 29,888 34,459 30,545 31,522 29,630 32,280 33,006 29,336 30,582 31,065 30,995 30,559 Unum Group Wells Fargo & Co. XL Group PLC Zions Bancorp. 886 601 958 1,049 See accompanying notes which are an integral part of these schedules of investments. Copyright © 2013 www.secdatabase.com. All Rights Reserved. Please Consider the Environment Before Printing This Document 32,126 30,896 32,752 30,582 1,958,237 Health Care 10.98% Abbott Laboratories AbbVie, Inc. Actavis PLC * Aetna, Inc. Agilent Technologies, Inc. Alexion Pharmaceuticals, Inc. * Allergan, Inc. AmerisourceBergen Corp. Amgen, Inc. Baxter International, Inc. Becton, Dickinson and Co. Biogen Idec, Inc. * Boston Scientific Corp. * Bristol-Myers Squibb Co. C.R. Bard, Inc. Cardinal Health, Inc. CareFusion Corp. * Celgene Corp. * Cerner Corp. * CIGNA Corp. Covidien PLC DaVita, Inc. * DENTSPLY International, Inc. Edwards LifeSciences Corp. * Eli Lilly & Co. Express Scripts Holding Co. * Gilead Sciences, Inc. * Hospira, Inc. * Humana, Inc. Intuitive Surgical, Inc. * Johnson & Johnson Laboratory Corp. of America Holdings * McKesson Corp. Medtronic, Inc. Merck & Co., Inc. Mylan, Inc. * Patterson Companies, Inc. PerkinElmer, Inc. Perrigo Co. PLC Pfizer, Inc. Quest Diagnostics, Inc. Regeneron Pharmaceuticals, Inc. * St. Jude Medical, Inc. Stryker Corp. Tenet Healthcare Corp. * Thermo Fisher Scientific, Inc. UnitedHealth Group, Inc. Varian Medical Systems, Inc. * Vertex Pharmaceuticals, Inc. * Waters Corp. * WellPoint, Inc. Zimmer Holdings, Inc. Zoetis, Inc. 1,107 814 349 552 750 274 271 614 379 605 378 144 3,530 941 323 651 1,036 555 836 495 498 631 929 539 743 645 557 869 361 110 435 442 240 712 770 877 1,142 948 310 1,492 764 146 669 528 939 373 571 536 677 418 421 421 1,498 46,751 44,988 79,262 45,353 42,849 46,460 44,307 47,544 52,797 45,367 44,318 49,466 44,758 47,655 48,013 47,951 47,556 52,702 48,215 46,817 43,241 47,149 44,331 53,490 47,255 47,659 59,918 46,714 46,515 51,716 45,099 47,445 46,836 45,461 46,291 42,599 45,980 42,517 46,056 43,849 48,273 51,002 43,857 44,011 57,436 44,794 49,466 45,576 63,366 43,189 49,065 41,841 53,099 2,548,225 Industrials 11.19% 3M Co. ADT Corp./The 269 1,134 38,806 41,813 Copyright © 2013 www.secdatabase.com. All Rights Reserved. Please Consider the Environment Before Printing This Document Allegion PLC 677 See accompanying notes which are an integral part of these schedules of investments. Copyright © 2013 www.secdatabase.com. All Rights Reserved. Please Consider the Environment Before Printing This Document 34,807 AMETEK, Inc. Avery Dennison Corp. Boeing Co./The Caterpillar, Inc. CH Robinson Worldwide, Inc. Cintas Corp. CSX Corp. Cummins, Inc. Danaher Corp. Deere & Co. Delta Air Lines, Inc. Dover Corp. Dun & Bradstreet Corp. Eaton Corp. PLC Emerson Electric Co. Equifax, Inc. Expeditors International of Washington, Inc. Fastenal Co. FedEx Corp. Flowserve Corp. Fluor Corp. General Dynamics Corp. General Electric Co. Honeywell International, Inc. Illinois Tool Works, Inc. Ingersoll-Rand PLC Iron Mountain, Inc. Jacobs Engineering Group, Inc. * Joy Global, Inc. Kansas City Southern L-3 Communications Holdings, Inc. Lockheed Martin Corp. Masco Corp. Nielsen NV Norfolk Southern Corp. Northrop Grumman Corp. PACCAR, Inc. Pall Corp. Parker Hannifin Corp. Pentair PLC Pitney Bowes, Inc. Precision Castparts Corp. Quanta Services, Inc. * Raytheon Co. Republic Services, Inc. Robert Half International, Inc. Rockwell Automation, Inc. Rockwell Collins, Inc. Roper Industries, Inc. Ryder System, Inc. Snap-on, Inc. Southwest Airlines Co. Stanley Black & Decker, Inc. Stericycle, Inc. * Textron, Inc. Tyco International Ltd. Union Pacific Corp. United Parcel Service, Inc. - Class B United Technologies Corp. Copyright © 2013 www.secdatabase.com. All Rights Reserved. Please Consider the Environment Before Printing This Document 734 1,555 293 367 621 614 1,270 250 484 436 1,156 439 372 517 581 549 880 795 266 511 508 328 1,471 418 447 625 1,283 719 642 372 315 242 1,816 837 385 325 618 465 308 522 1,408 148 1,156 409 1,057 825 309 491 267 451 332 1,485 447 333 983 859 395 382 334 38,871 74,830 37,198 39,999 42,377 40,641 39,242 36,265 37,113 36,672 45,766 38,544 43,698 36,081 37,200 43,218 36,354 35,980 39,404 38,796 37,552 40,465 38,208 39,772 39,399 37,601 46,172 38,775 40,545 42,860 34,590 42,052 42,615 39,345 41,196 41,406 38,836 39,251 35,545 35,552 38,109 36,081 42,009 39,369 41,569 41,400 36,011 37,812 40,239 40,711 41,533 47,544 40,931 39,532 37,368 38,314 41,529 37,187 36,060 W.W. Grainger, Inc. Waste Management, Inc. Xylem, Inc. 153 891 1,012 See accompanying notes which are an integral part of these schedules of investments. Copyright © 2013 www.secdatabase.com. All Rights Reserved. Please Consider the Environment Before Printing This Document 37,704 41,833 37,711 2,595,968 Information Technology 9.74% Accenture PLC - Class A Adobe Systems, Inc. * Akamai Technologies, Inc. * Alliance Data Systems Corp. * Altera Corp. Amphenol Corp. - Class A Analog Devices, Inc. Apple, Inc. Applied Materials, Inc. Autodesk, Inc. * Automatic Data Processing, Inc. Broadcom Corp. - Class A CA, Inc. Cisco Systems, Inc. Citrix Systems, Inc. * Cognizant Technology Solutions Corp. - Class A * Computer Sciences Corp. Corning, Inc. eBay, Inc. * Electronic Arts, Inc. * EMC Corp. F5 Networks, Inc. * Facebook, Inc. - Class A * Fidelity National Information Services, Inc. First Solar, Inc. * Fiserv, Inc. * FLIR Systems, Inc. Google, Inc. - Class A * Harris Corp. Hewlett-Packard Co. Intel Corp. International Business Machines Corp. Intuit, Inc. Jabil Circuit, Inc. Juniper Networks, Inc. KLA-Tencor Corp. Lam Research Corp. Linear Technology Corp. MasterCard, Inc. - Class A Microchip Technology, Inc. Micron Technology, Inc. * Microsoft Corp. Motorola Solutions, Inc. NetApp, Inc. NVIDIA Corp. Oracle Corp. Paychex, Inc. QUALCOMM, Inc. Red Hat, Inc. * Salesforce.com, Inc. * SanDisk Corp. Seagate Technology PLC Symantec Corp. TE Connectivity Ltd. Teradata Corp. * Texas Instruments, Inc. Total System Services, Inc. VeriSign, Inc. * Copyright © 2013 www.secdatabase.com. All Rights Reserved. Please Consider the Environment Before Printing This Document 417 465 569 126 991 357 619 375 1,533 611 439 893 1,179 1,400 523 703 540 1,621 692 930 1,290 305 469 635 500 572 944 61 453 982 1,140 187 432 1,717 1,363 494 515 727 453 694 1,072 824 512 937 1,755 806 838 433 647 592 334 611 1,582 554 775 714 1,131 663 33,770 33,457 34,354 33,359 35,038 36,766 31,668 38,440 35,410 32,764 36,671 35,162 33,293 34,986 36,779 32,150 32,299 33,809 38,393 35,198 38,088 37,897 35,091 36,059 34,831 36,893 31,910 35,755 32,334 37,324 39,805 35,991 35,902 37,056 31,618 37,761 37,048 32,806 34,368 33,864 34,932 37,422 30,414 39,518 34,140 33,456 34,887 32,972 39,423 34,965 32,759 38,234 38,399 34,704 35,374 34,395 35,571 37,827 See accompanying notes which are an integral part of these schedules of investments. Copyright © 2013 www.secdatabase.com. All Rights Reserved. Please Consider the Environment Before Printing This Document Visa, Inc. - Class A Western Digital Corp. Western Union Co./The Xerox Corp. Xilinx, Inc. Yahoo!, Inc. * 162 372 2,123 2,684 728 989 34,500 38,349 37,092 37,068 30,754 38,088 2,261,410 Materials 10.53% Air Products & Chemicals, Inc. Airgas, Inc. Alcoa, Inc. Allegheny Technologies, Inc. Ball Corp. Bemis Co., Inc. CF Industries Holdings, Inc. Cliffs Natural Resources, Inc. Dow Chemical Co./The Eastman Chemical Co. Ecolab, Inc. EI du Pont de Nemours & Co. FMC Corp. Freeport-McMoRan Copper & Gold, Inc. - Class B International Flavors & Fragrances, Inc. International Paper Co. Lyondellbasell Industries NV - Class A MeadWestvaco Corp. Monsanto Co. Mosaic Co./The Newmont Mining Corp. Nucor Corp. Owens-Illinois, Inc. * PPG Industries, Inc. Praxair, Inc. Sealed Air Corp. Sherwin-Williams Co./The Sigma-Aldrich Corp. United States Steel Corp. Veritiv Corp. * Vulcan Materials Co. 599 725 5,413 1,864 1,290 1,904 320 5,465 1,504 891 725 1,145 1,031 2,323 772 1,601 793 1,790 652 1,568 3,346 1,520 2,320 385 589 2,307 385 782 3,173 33 1,224 79,827 80,050 89,916 78,596 82,664 77,558 82,531 82,351 80,532 73,473 83,293 75,696 68,191 84,488 78,392 77,560 90,693 76,988 75,382 74,883 90,640 82,559 71,446 79,274 77,500 83,297 84,055 81,317 122,643 1,480 77,608 2,444,883 Real Estate Investment Trusts 2.55% American Tower Corp. - Class A Apartment Investment & Management Co. - Class A AvalonBay Communities, Inc. Boston Properties, Inc. Equity Residential General Growth Properties, Inc. HCP, Inc. Health Care REIT, Inc. Host Hotels & Resorts, Inc. Kimco Realty Corp. Macerich Co./The Plum Creek Timber Co., Inc. ProLogis, Inc. Public Storage, Inc. Simon Property Group, Inc. Ventas, Inc. Vornado Realty Trust 356 983 225 271 513 1,366 783 507 1,416 1,382 472 706 761 185 189 503 300 35,099 33,693 34,615 32,866 34,104 33,562 33,923 34,297 32,306 32,462 30,843 28,689 31,166 32,347 32,078 33,062 31,771 Copyright © 2013 www.secdatabase.com. All Rights Reserved. Please Consider the Environment Before Printing This Document Weyerhaeuser Co. 1,007 See accompanying notes which are an integral part of these schedules of investments. Copyright © 2013 www.secdatabase.com. All Rights Reserved. Please Consider the Environment Before Printing This Document 34,186 591,069 Telecommunication Services 1.20% AT&T, Inc. CenturyLink, Inc. Crown Castle International Corp. Frontier Communications Corp. Sprint Corp. * T-Mobile US, Inc. * Verizon Communications, Inc. Windstream Holdings, Inc. 986 948 468 6,048 3,823 1,039 703 3,491 34,479 38,839 37,209 41,126 21,448 31,250 35,023 39,453 278,827 Utilities 11.09% AES Corp./The AGL Resources, Inc. Ameren Corp. American Electric Power Co., Inc. CenterPoint Energy, Inc. CMS Energy Corp. Consolidated Edison, Inc. Dominion Resources, Inc. - Class A DTE Energy Co. Duke Energy Corp. Edison International Entergy Corp. Exelon Corp. FirstEnergy Corp. Integrys Energy Group, Inc. NextEra Energy, Inc. NiSource, Inc. Northeast Utilities NRG Energy, Inc. Oneok, Inc. Pepco Holdings, Inc. PG&E Corp. Pinnacle West Capital Corp. PPL Corp. Public Service Enterprise Group, Inc. SCANA Corp. Sempra Energy Southern Co. TECO Energy, Inc. Wisconsin Energy Corp. Xcel Energy, Inc. 5,585 1,521 2,107 1,529 3,321 2,711 1,461 1,190 1,088 1,143 1,462 1,033 2,238 2,348 1,398 833 2,172 1,785 2,221 1,286 3,016 1,751 1,491 2,407 2,132 1,605 800 1,865 4,626 1,787 2,642 84,780 81,099 84,260 82,100 82,497 82,787 84,555 83,560 85,104 84,565 86,434 79,984 74,798 80,399 94,910 81,993 86,157 81,934 68,376 90,297 83,118 81,369 84,923 83,359 79,722 83,384 84,777 82,784 83,738 81,011 84,668 2,573,442 Total Common Stocks (Cost $19,346,459) Cash Equivalents 1.49% 22,866,591 FOLIOfn Investment Cash Account, 0.01% (a) FOLIOfn Investment Sweep Account, 0.01% (a) Total Cash Equivalents (Cost $345,854) Total Investments 100.01% (Cost $19,692,313) Liabilities in Excess of Other Assets (0.01)% TOTAL NET ASSETS 100.00% (a) Rate disclosed is the seven day yield as of August 31, 2014. Copyright © 2013 www.secdatabase.com. All Rights Reserved. Please Consider the Environment Before Printing This Document 2 345,852 2 345,852 345,854 23,212,445 (1,188 ) $23,211,257 * Non-income producing security. See accompanying notes which are an integral part of these schedules of investments. Copyright © 2013 www.secdatabase.com. All Rights Reserved. Please Consider the Environment Before Printing This Document Cloud Capital Strategic Mid Cap Fund Schedule of Investments August 31, 2014 (Unaudited) Shares Fair Value 1,015 272 9,713 570 2,996 840 1,161 2,002 531 1,623 772 699 687 565 493 760 2,068 1,048 1,007 426 789 780 3 494 1,391 701 1,205 1,303 396 612 1,086 591 510 2,021 697 729 1,322 860 1,213 786 264 2,256 31 6,107 234 267 2,501 1,217 1,048 3,111 1,725 $25,997 37,068 40,699 35,655 42,187 34,820 32,251 34,818 42,131 38,717 35,781 30,337 33,581 34,496 40,791 34,169 32,681 36,998 35,079 39,311 33,886 35,172 343 37,270 30,366 39,309 35,608 30,539 40,646 37,099 36,356 35,344 30,585 35,872 36,561 33,609 37,534 39,679 35,202 36,596 38,479 27,927 36,239 31,268 35,044 38,887 37,783 33,894 36,730 31,576 38,245 Common Stocks 97.15% Consumer Discretionary 10.17% Aarons, Inc. Advance Auto Parts, Inc. Aeropostale, Inc. * AMC Networks, Inc. - Class A * American Eagle Outfitters, Inc. ANN, Inc. * Apollo Group, Inc. - Class A * Ascena Retail Group, Inc. * Bally Technologies, Inc. * Barnes & Noble, Inc. * Big Lots, Inc. Bob Evans Farms, Inc. Brinker International, Inc. Cabelas, Inc. - Class A * Carters, Inc. Cheesecake Factory, Inc./The Chicos FAS, Inc. Cinemark Holdings, Inc. CST Brands, Inc. Deckers Outdoor Corp. * DeVry Education Group, Inc. Dicks Sporting Goods, Inc. Dillards, Inc. - Class A Dominos Pizza, Inc. DreamWorks Animation SKG, Inc. - Class A * Foot Locker, Inc. Gentex Corp. Guess?, Inc. Hanesbrands, Inc. HSN, Inc. International Speedway Corp. - Class A Jarden Corp. * John Wiley & Sons, Inc. - Class A KB Home Lamar Advertising Co. Life Time Fitness, Inc. * LKQ Corp. * Matthews International Corp. - Class A MDC Holdings, Inc. Meredith Corp. Mohawk Industries, Inc. * New York Times Co./The - Class A NVR, Inc. * Office Depot, Inc. * Panera Bread Co. - Class A * Polaris Industries, Inc. Regis Corp. Rent-A-Center, Inc. Scholastic Corp. Scientific Games Corp. - Class A * Service Corporation International Copyright © 2013 www.secdatabase.com. All Rights Reserved. Please Consider the Environment Before Printing This Document Signet Jewelers Ltd. Sothebys 319 851 See accompanying notes which are an integral part of these schedules of investments. Copyright © 2013 www.secdatabase.com. All Rights Reserved. Please Consider the Environment Before Printing This Document 37,588 34,721 Strayer Education, Inc. * Tempur Sealy International, Inc. * Thor Industries, Inc. Toll Brothers, Inc. * Tractor Supply Co. Tupperware Brands Corp. Under Armour, Inc. - Class A * Wendys Co./The Williams-Sonoma, Inc. 627 603 598 967 536 422 593 4,067 455 38,088 35,276 32,112 34,416 35,900 30,905 40,552 33,143 29,954 2,163,870 Consumer Staples 10.34% Church & Dwight Co., Inc. Dean Foods Co. Energizer Holdings, Inc. Flowers Foods, Inc. Ingredion, Inc. Keurig Green Mountain, Inc. Lancaster Colony Corp. Post Holdings, Inc. * SUPERVALU, Inc. * Tootsie Roll Industries, Inc. United Natural Foods, Inc. * Universal Corp. WhiteWave Food Co. - Class A * 2,459 9,630 1,426 8,348 2,253 1,388 1,836 3,348 21,716 5,999 2,646 3,062 5,139 167,784 155,809 173,296 163,458 179,701 185,074 162,318 123,769 207,388 169,467 170,105 161,533 179,962 2,199,664 Energy 9.54% Alpha Natural Resources, Inc. * Arch Coal, Inc. Atwood Oceanics, Inc. * Bill Barrett Corp. * CARBO Ceramics, Inc. Cimarex Energy Co. Dresser-Rand Group, Inc. * Dril-Quip, Inc. * Energen Corp. Helix Energy Solutions Group, Inc. * HollyFrontier Corp. Oceaneering International, Inc. Oil States International, Inc. * Patterson-UTI Energy, Inc. Rosetta Resources, Inc. * SM Energy Co. Superior Energy Services, Inc. Tidewater, Inc. Unit Corp. * World Fuel Services Corp. 28,811 29,102 2,010 3,705 758 752 1,665 987 1,169 4,113 2,193 1,388 1,638 3,061 1,956 1,266 2,935 1,903 1,560 2,189 113,804 88,762 99,326 84,357 81,540 109,189 115,362 100,144 94,088 112,369 109,732 96,515 105,744 105,743 97,776 112,763 105,200 96,815 102,662 97,129 2,029,020 Financials 8.88% Affiliated Managers Group, Inc. * Alexander & Baldwin, Inc. Alleghany Corp. * American Financial Group, Inc. Apollo Investment Corp. Arthur J Gallagher & Co. Aspen Insurance Holdings Ltd. Associated Banc-Corp. Astoria Financial Corp. BancorpSouth, Inc. 165 409 77 559 4,035 725 721 1,840 2,449 1,356 34,744 16,729 33,024 33,522 35,385 34,264 30,670 33,453 32,006 28,707 Copyright © 2013 www.secdatabase.com. All Rights Reserved. Please Consider the Environment Before Printing This Document Bank of Hawaii Corp. Brown & Brown, Inc. 569 1,079 See accompanying notes which are an integral part of these schedules of investments. Copyright © 2013 www.secdatabase.com. All Rights Reserved. Please Consider the Environment Before Printing This Document 33,059 35,193 Cathay General Bancorp CBOE Holdings, Inc. City National Corp. Commerce Bancshares, Inc. Cullen/Frost Bankers, Inc. East West Bancorp, Inc. Eaton Vance Corp. Everest Re Group Ltd. Federated Investors, Inc. - Class B Fidelity National Financial, Inc. - Class A * Fidelity National Financial, Inc. * First American Financial Corp. First Horizon National Corp. First Niagara Financial Group, Inc. FirstMerit Corp. Fulton Financial Corp. Greenhill & Co., Inc. Hancock Holding Co. Hanover Insurance Group, Inc. HCC Insurance Holdings, Inc. International Bancshares Corp. Janus Capital Group, Inc. Jones Lang LaSalle, Inc. Kemper Corp. Mercury General Corp. MSCI, Inc. - Class A * New York Community Bancorp, Inc. * Old Republic International Corp. Primerica, Inc. Prosperity Bancshares, Inc. Protective Life Corp. Raymond James Financial, Inc. Reinsurance Group of America, Inc. SEI Investments Co. Signature Bank * StanCorp Financial Group, Inc. SVB Financial Group * Synovus Financial Corp. TCF Financial Corp. Trustmark Corp. Valley National Bancorp W.R. Berkley Corp. Waddell & Reed Financial, Inc. - Class A Washington Federal, Inc. Webster Financial Corp. Westamerica Bancorp 1,270 647 439 724 418 941 898 104 1,110 2,032 644 1,156 2,769 3,813 1,687 2,676 699 944 526 694 1,261 2,721 267 905 715 731 2,100 1,934 697 537 476 660 418 1,019 270 515 282 1,343 2,017 1,357 3,311 724 547 1,469 1,070 595 33,074 34,324 33,287 33,405 32,881 32,790 35,182 17,041 34,058 57,526 9,653 32,758 33,669 33,173 29,071 30,867 34,284 31,375 33,354 34,796 33,230 33,060 35,676 32,914 36,647 33,732 33,500 29,686 35,079 32,437 33,025 36,073 34,717 38,596 32,026 33,747 31,356 32,422 31,861 32,199 33,106 34,994 29,798 31,946 31,569 28,790 1,889,510 Health Care 11.45% Allscripts Healthcare Solutions, Inc. * Bio-Rad Laboratories, Inc. - Class A * Charles River Laboratories International, Inc. * Community Health Systems, Inc. * Cooper Cos., Inc./The Covance, Inc. * Endo International PLC * Health Net, Inc. * Henry Schein, Inc. * Hill-Rom Holdings, Inc. 4,820 602 1,354 1,671 544 841 1,056 1,818 615 1,820 71,217 72,342 80,019 90,722 88,687 69,758 67,296 85,824 73,591 79,724 Copyright © 2013 www.secdatabase.com. All Rights Reserved. Please Consider the Environment Before Printing This Document HMS Holdings Corp. * Hologic, Inc. * IDEXX Laboratories, Inc. * 3,789 2,889 551 See accompanying notes which are an integral part of these schedules of investments. Copyright © 2013 www.secdatabase.com. All Rights Reserved. Please Consider the Environment Before Printing This Document 86,625 71,845 68,360 LifePoint Hospitals, Inc. * Mallinckrodt PLC * Masimo Corp. * Mednax, Inc. * Mettler-Toledo International, Inc. * Omnicare, Inc. Owens & Minor, Inc. ResMed, Inc. Salix Pharmaceuticals Ltd. * STERIS Corp. Techne Corp. Teleflex, Inc. Thoratec Corp. * United Therapeutics Corp. * Universal Health Services, Inc. - Class B VCA Antech, Inc. * Vertex Pharmaceuticals, Inc. * WellCare Health Plans, Inc. * 1,132 947 3,122 1,236 295 1,117 2,109 1,379 635 1,408 807 695 2,165 841 801 2,054 1,131 956 84,666 77,198 70,047 70,756 79,714 71,225 72,542 73,176 101,112 79,244 77,129 76,061 54,126 99,127 91,655 83,688 105,807 62,950 2,436,233 Industrials 10.88% Acuity Brands, Inc. AECOM Technology Corp. * AGCO Corp. Alaska Air Group, Inc. Alliant Techsystems, Inc. AMETEK, Inc. BE Aerospace, Inc. * Brinks Co./The Carlisle Cos., Inc. CLARCOR, Inc. Clean Harbors, Inc. * Con-way, Inc. Copart, Inc. * Corporate Executive Board Co./The * Crane Co. Deluxe Corp. Donaldson Co., Inc. Esterline Technologies Corp. * Exelis, Inc. Fortune Brands Home & Security, Inc. FTI Consulting, Inc. * GATX Corp. General Cable Corp. Genesee & Wyoming, Inc. - Class A * Graco, Inc. Granite Construction, Inc. Harsco Corp. Herman Miller, Inc. HNI Corp. Hubbell, Inc. - Class B Huntington Ingalls Industries, Inc. IDEX Corp. ITT Corp. JB Hunt Transport Services, Inc. KBR, Inc. Kennametal, Inc. Kirby Corp. * Landstar System, Inc. 279 1,137 666 772 270 686 388 1,325 422 625 586 752 1,009 539 498 640 875 308 2,147 940 1,000 562 1,453 353 483 1,041 1,366 1,172 951 297 371 463 788 476 1,396 776 316 568 34,510 43,033 32,542 35,751 33,960 36,308 32,912 36,268 34,963 39,482 35,464 38,528 34,738 35,530 34,662 38,110 36,616 36,152 36,902 40,627 37,082 37,262 31,203 34,667 37,092 36,724 33,063 34,824 36,054 35,926 37,931 35,604 37,711 35,952 30,751 34,758 37,698 38,527 Copyright © 2013 www.secdatabase.com. All Rights Reserved. Please Consider the Environment Before Printing This Document Lennox International, Inc. Lincoln Electric Holdings, Inc. ManpowerGroup 413 517 433 See accompanying notes which are an integral part of these schedules of investments. Copyright © 2013 www.secdatabase.com. All Rights Reserved. Please Consider the Environment Before Printing This Document 34,551 36,775 33,568 Matson, Inc. MSA Safety, Inc. MSC Industrial Direct Co., Inc. - Class A Nordson Corp. Oshkosh Corp. R.R. Donnelley & Sons Co. Regal-Beloit Corp. Rollins, Inc. SPX Corp. Terex Corp. Timken Co. Towers Watson & Co. - Class A Trinity Industries, Inc. Triumph Group, Inc. United Rentals, Inc. * URS Corp. UTi Worldwide, Inc. * Valmont Industries, Inc. Wabtec Corp. Waste Connections, Inc. Watsco, Inc. Werner Enterprises, Inc. Woodward, Inc. 1,473 642 388 444 678 2,222 463 1,187 339 951 546 338 864 511 352 822 3,804 228 444 846 362 1,376 750 39,761 35,564 34,979 35,958 33,701 39,268 32,918 35,316 35,237 35,560 24,716 37,027 41,823 35,465 41,379 49,788 34,921 32,076 37,011 41,517 33,514 34,262 39,146 2,315,688 Information Technology 11.00% 3D Systems Corp. * ACI Worldwide, Inc. * Acxiom Corp. * ADTRAN, Inc. Advent Software, Inc. Alliance Data Systems Corp. * ANSYS, Inc. * AOL, Inc. * Arrow Electronics, Inc. * Atmel Corp. * Avnet, Inc. Broadridge Financial Solutions, Inc. Cadence Design Systems, Inc. * Ciena Corp. * CommVault Systems, Inc. * Compuware Corp. Concur Technologies, Inc. * Convergys Corp. Conversant, Inc. * CoreLogic, Inc. * Cree, Inc. * Cypress Semiconductor Corp. Diebold, Inc. DST Systems, Inc. Equinix, Inc. * Factset Research Systems, Inc. Fair Isaac Corp. Fairchild Semiconductor International, Inc. * Gartner, Inc. * Global Payments, Inc. Informatica Corp. * Ingram Micro, Inc. - Class A * Integrated Device Technology, Inc. * 642 1,822 1,580 1,550 1,071 126 449 931 562 3,575 774 840 2,012 1,523 688 3,441 364 1,607 1,396 1,132 671 3,121 877 372 165 294 569 2,126 486 485 923 1,213 2,355 34,356 35,476 29,307 35,785 34,612 33,312 36,526 40,221 34,985 31,676 34,437 35,740 35,485 31,520 37,949 32,175 36,517 30,854 38,433 31,997 30,556 34,485 33,313 34,508 35,929 37,474 33,101 37,311 36,271 35,257 31,428 34,959 38,746 Copyright © 2013 www.secdatabase.com. All Rights Reserved. Please Consider the Environment Before Printing This Document InterDigital, Inc. International Rectifier Corp. * Intersil Corp. - Class A 730 1,193 2,263 See accompanying notes which are an integral part of these schedules of investments. Copyright © 2013 www.secdatabase.com. All Rights Reserved. Please Consider the Environment Before Printing This Document 32,374 46,997 34,047 Itron, Inc. * Jack Henry & Associates, Inc. Lexmark International, Inc. - Class A ManTech International Corp. - Class A Mentor Graphics Corp. MICROS Systems, Inc. * Monster Worldwide, Inc. * National Instruments Corp. NCR Corp. * NeuStar, Inc. - Class A * Plantronics, Inc. Polycom, Inc. * PTC, Inc. * Rackspace Hosting, Inc. * RF Micro Devices, Inc. * Riverbed Technology, Inc. * Rovi Corp. * Semtech Corp. * Silicon Laboratories, Inc. * Skyworks Solutions, Inc. SolarWinds, Inc. * Solera Holdings, Inc. SunEdison, Inc. * Synopsys, Inc. * Tech Data Corp. * TIBCO Software, Inc. * Trimble Navigation Ltd. * VeriFone Systems, Inc. * Vishay Intertechnology, Inc. WEX, Inc. * Zebra Technologies Corp. - Class A * 840 577 749 1,180 1,603 515 5,515 1,084 1,017 1,403 733 2,720 912 918 3,430 1,669 1,408 1,248 705 718 840 521 1,563 874 555 1,624 892 930 2,234 328 437 35,475 33,336 37,893 34,194 34,968 34,975 31,820 35,931 34,745 41,370 35,007 36,040 35,284 31,770 42,768 31,448 32,571 32,522 31,964 40,702 35,927 31,776 34,441 35,744 37,488 33,847 29,669 32,460 35,737 37,241 34,114 2,341,346 Materials 11.11% Albemarle Corp. AptarGroup, Inc. Ashland, Inc. Cabot Corp. Carpenter Technology Corp. Commercial Metals Co. Compass Minerals International, Inc. Cytec Industries, Inc. Domtar Corp. Eagle Materials, Inc. Greif, Inc. - Class A Intrepid Potash, Inc. * Louisiana-Pacific Corp. * Martin Marietta Materials, Inc. Minerals Technologies, Inc. NewMarket Corp. Olin Corp. Packaging Corp. of America Rayonier Advanced Materials, Inc. * Reliance Steel & Aluminum Co. Rock-Tenn Co. - Class A Royal Gold, Inc. RPM International, Inc. Scotts Miracle-Gro Co./The - Class A Sensient Technologies Corp. 1,153 1,240 770 1,353 1,295 4,516 873 809 1,890 868 1,520 4,630 5,544 621 1,304 215 2,944 1,172 115 1,121 1,587 1,190 1,824 1,425 1,523 73,332 79,570 82,529 74,132 70,895 78,037 77,779 83,395 70,461 88,473 72,811 70,975 79,108 81,357 81,670 87,380 80,339 79,695 3,813 78,375 78,030 92,504 85,979 82,242 85,457 Copyright © 2013 www.secdatabase.com. All Rights Reserved. Please Consider the Environment Before Printing This Document Silgan Holdings, Inc. Sonoco Products Co. Steel Dynamics, Inc. 1,663 1,885 4,562 See accompanying notes which are an integral part of these schedules of investments. Copyright © 2013 www.secdatabase.com. All Rights Reserved. Please Consider the Environment Before Printing This Document 83,750 77,577 106,030 TimkenSteel Corp. Valspar Corp. Worthington Industries, Inc. 271 1,075 1,934 12,946 86,793 78,219 2,363,653 Real Estate Investment Trusts 2.48% Alexandria Real Estate Equities, Inc. American Campus Communities, Inc. BioMed Realty Trust, Inc. Camden Property Trust Corporate Office Properties Trust Corrections Corp. of America Duke Realty Corp. Equity One, Inc. Essex Property Trust, Inc. Extra Space Storage, Inc. Federal Realty Investment Trust Highwoods Properties, Inc. Home Properties, Inc. Hospitality Properties Trust Kilroy Realty Corp. Liberty Property Trust * Mack-Cali Realty Corp. National Retail Properties, Inc. Omega Healthcare Investors, Inc. Potlatch Corp. Rayonier, Inc. Realty Income Corp. Regency Centers Corp. Senior Housing Properties Trust SL Green Realty Corp. Taubman Centers, Inc. UDR, Inc. Weingarten Realty Investors 217 435 758 241 589 1,021 927 710 186 316 140 398 270 571 270 445 761 461 478 416 357 380 303 706 150 445 606 519 17,161 17,206 17,019 18,037 16,712 36,373 17,251 16,762 35,980 16,663 17,518 16,938 17,317 16,817 17,049 15,745 16,078 17,117 18,012 17,774 12,220 17,009 17,291 16,474 16,395 33,900 18,129 17,773 528,720 Telecommunication Services 0.16% Telephone & Data Systems, Inc. TW Telecom, Inc. * 645 411 16,988 16,853 33,841 Utilities 11.14% Alliant Energy Corp. Aqua America, Inc. Atmos Energy Corp. Black Hills Corp. Cleco Corp. Great Plains Energy, Inc. Hawaiian Electric Industries, Inc. IDACORP, Inc. MDU Resources Group, Inc. National Fuel Gas Co. OGE Energy Corp. ONE Gas, Inc. Oneok, Inc. PNM Resources, Inc. Questar Corp. UGI Corp. Vectren Corp. Westar Energy, Inc. WGL Holdings, Inc. 2,385 5,460 2,678 2,335 2,677 5,476 5,693 2,489 4,132 1,822 3,793 3 10 4,878 5,833 2,858 3,411 3,824 3,347 139,481 136,560 135,397 125,446 151,060 140,558 144,546 141,170 129,374 139,303 142,310 94 702 127,857 137,133 151,398 140,644 141,216 145,566 Copyright © 2013 www.secdatabase.com. All Rights Reserved. Please Consider the Environment Before Printing This Document 2,369,815 See accompanying notes which are an integral part of these schedules of investments. Copyright © 2013 www.secdatabase.com. All Rights Reserved. Please Consider the Environment Before Printing This Document Total Common Stocks (Cost $17,000,738) Cash Equivalents 2.14% 20,671,360 FOLIOfn Investment Sweep Account, 0.01% (a) Total Cash Equivalents (Cost $455,002) Total Investments 99.29% (Cost $17,455,740) Other Assets in Excess of Liabilities 0.71% TOTAL NET ASSETS 100.00% (a) * Rate disclosed is the seven day yield as of August 31, 2014. Non-income producing security. See accompanying notes which are an integral part of these schedules of investments. Copyright © 2013 www.secdatabase.com. All Rights Reserved. Please Consider the Environment Before Printing This Document 455,002 455,002 455,002 21,126,362 151,403 $21,277,765 At August 31, 2014, the net unrealized appreciation (depreciation) of investments for tax purposes was as follows: Fund Cloud Capital Strategic Large Cap Fund Cloud Capital Strategic Mid Cap Fund Tax Cost of Securities Unrealized Appreciation Unrealized Depreciation Net Unrealized Appreciation $19,923,500 18,227,634 $3,422,611 3,183,095 $(133,666 ) (284,367 ) $3,288,945 2,898,728 The difference between book basis and tax basis unrealized appreciation was attributable primarily to the tax deferral of losses on wash sales of $231,187 for the Cloud Capital Strategic Large Cap Fund $771,894 and for the Cloud Capital Strategic Mid Cap Fund. Cloud Capital Funds Notes to the Schedules of Investments August 31, 2014 (Unaudited) The Cloud Capital Strategic Large Cap Equity Fund and the Cloud Capital Strategic Mid Cap Equity Fund (each a Fund and, collectively the Funds) are each an investment company and both follow accounting and reporting guidance under Financial Accounting Standards Board (FASB) Accounting Standards Codification (ASC) Topic 946, Financial Services-Investment Companies. The following is a summary of significant accounting policies consistently followed by the Funds in the preparation of its financial statements. The policies are in conformity with accounting principles generally accepted in the United States of America (GAAP). Security Transactions and Related Income - The Funds follow industry practice and records security transactions on the trade date for financial reporting purposes. The first in, first out (FIFO) method is used for determining gains or losses for financial statement and income tax purposes. Dividend income is recorded on the ex-dividend date and interest income is recorded on an accrual basis. Discounts and premiums on securities purchased are accreted or amortized using the effective interest method. Withholding taxes on foreign dividends have been provided for in accordance with the Funds understanding of the applicable countrys tax rules and rates. The ability of issuers of debt securities held the Funds to meet their obligations may be affected by economic and political developments in a specific country or region. Securities Valuation and Fair Value Measurements - Fair value is defined as the price that each Fund would receive upon selling an investment in an orderly transaction to an independent buyer in the principal or most advantageous market of the investment. GAAP establishes a three-tier hierarchy to maximize the use of observable market data and minimize the use of unobservable inputs and to establish classification of fair value measurements for disclosure purposes. Inputs refer broadly to the assumptions that market participants would use in pricing the asset or liability, including assumptions about risk (the risk inherent in a particular valuation technique used to measure fair value such as pricing model and/or the risk inherent in the inputs to the valuation technique). Inputs may be observable or unobservable. Observable inputs are inputs that reflect the assumptions market participants would use in pricing the asset or liability developed based on market data obtained from sources independent of the reporting entity. Unobservable inputs are inputs that reflect the reporting entitys own assumptions about the assumptions market participants would use in pricing the asset or liability developed based on the best information available in the circumstances. Various inputs are used in determining the value of each Funds investments. These inputs are summarized in the three broad levels listed below. Level 1 quoted prices in active markets for identical securities Level 2 other significant observable inputs (including, but not limited to, quoted prices for an identical security in an inactive market, quoted prices for similar securities, interest rates, prepayment speeds, credit risk, etc.) Level 3 significant unobservable inputs (including each Funds own assumptions in determining fair value of investments based on the best information available) The inputs used to measure fair value may fall into different levels of the fair value hierarchy. In such cases, for disclosure purposes, the level in the fair value hierarchy within which the fair value measurement falls in its entirety, is determined based on the lowest level input that is significant to the fair value measurement in its entirety. Equity securities, including common stocks, are generally valued by using market quotations, but may be valued on the basis of prices furnished by a pricing service when Cloud Capital LLC (the Adviser) believes such prices more Copyright © 2013 www.secdatabase.com. All Rights Reserved. Please Consider the Environment Before Printing This Document Cloud Capital Funds Notes to the Schedules of Investments - continued August 31, 2014 (Unaudited) accurately reflect the fair value of such securities. Securities that are traded on any stock exchange are generally valued by the pricing service at the last quoted sale price. Lacking a last sale price, an exchange traded security is generally valued by the pricing service at its last bid price. Securities traded in the NASDAQ over-the-counter market are generally valued by the pricing service at the NASDAQ Official Closing Price. When using the market quotations or close prices provided by the pricing service and when the market is considered active, the security will be classified as a Level 1 security. Sometimes, an equity security owned by the Fund will be valued by the pricing service with factors other than market quotations or when the market is considered inactive. When this happens, the security will be classified as a Level 2 security. When market quotations are not readily available, when the Adviser determines that the market quotation or the price provided by the pricing service does not accurately reflect the current fair value, or when restricted or illiquid securities are being valued, such securities are valued as determined in good faith by the Adviser, in conformity with guidelines adopted by and subject to review by the Board of Trustees (Board). These securities will be categorized as Level 3 securities. In accordance with the Valued Advisers Trusts (the Trust) good faith pricing guidelines, the Adviser is required to consider all appropriate factors relevant to the value of securities for which it has determined other pricing sources are not available or reliable as described above. No single standard exists for determining fair value, because fair value depends upon the circumstances of each individual case. As a general principle, the current fair value of an issue of securities being valued by the Adviser would appear to be the amount which the owner might reasonably expect to receive for them upon their current sale. Methods which are in accordance with this principle may, for example, be based on (i) a multiple of earnings; (ii) a discount from market of a similar freely traded security (including a derivative security or a basket of securities traded on other markets, exchanges or among dealers); or (iii) yield to maturity with respect to debt issues, or a combination of these and other methods. Good faith pricing is permitted if, in the Advisers opinion, the validity of market quotations appears to be questionable based on factors such as evidence of a thin market in the security based on a small number of quotations, a significant event occurs after the close of a market but before each Funds NAV calculation that may affect a securitys value, or the Adviser is aware of any other data that calls into question the reliability of market quotations. Good faith pricing may also be used in instances when the bonds the Funds invest in may default or otherwise cease to have market quotations readily available. Any fair valuation pricing done outside the Funds approved pricing methods must be approved by the Pricing Committee of the Board. The following is a summary of the inputs used to value the Funds investments as of August 31, 2014: Level 1 Quoted Prices in Active Markets Cloud Capital Strategic Large Cap Fund Common Stocks * Cash Equivalents Total Cloud Capital Strategic Mid Cap Fund Common Stocks * Cash Equivalents Total Valuation Inputs Level 2 Other Significant Observable Inputs $22,866,591 345,854 23,212,445 $ 20,671,360 455,002 21,126,362 Level 3 Significant Unobservable Inputs $ Total $22,866,591 345,854 23,212,445 20,671,360 455,002 21,126,362 * Refer to the Schedule of Investments for industry classifications. The Funds did not hold any investments at any time during the reporting period in which significant unobservable inputs were used in determining fair value; therefore, no reconciliation of Level 3 securities is included for this reporting period. The Funds did hold any derivative instruments during the reporting period. Copyright © 2013 www.secdatabase.com. All Rights Reserved. Please Consider the Environment Before Printing This Document Cloud Capital Funds Notes to the Schedules of Investments - continued August 31, 2014 (Unaudited) The Trust recognizes transfers between fair value hierarchy levels at the end of the reporting period. There were no transfers between any levels for the reporting period ended August 31, 2014. Copyright © 2013 www.secdatabase.com. All Rights Reserved. Please Consider the Environment Before Printing This Document LS Opportunity Fund Schedule of Investments August 31, 2014 (Unaudited) Shares Fair Value Consumer Discretionary 11.91% Discovery Communications, Inc. - Class A * Discovery Communications, Inc. - Class C * L Brands, Inc. Lennar Corp. - Class A Life Time Fitness, Inc. * Mohawk Industries, Inc. * Priceline.com, Inc. * SeaWorld Entertainment, Inc. Sothebys Tempur Sealy International, Inc. * Time Warner, Inc. Tribune Co. (a)* Tribune Publishing Co. (a)* 21,676 21,676 29,170 32,672 33,102 17,926 1,443 83,386 31,335 43,612 33,256 29,452 8,487 $947,675 931,418 1,862,504 1,280,089 1,526,002 2,617,554 1,795,539 1,733,595 1,278,781 2,552,174 2,561,710 2,247,188 162,950 21,497,179 Consumer Staples 1.34% Diamond Foods, Inc. * WhiteWave Food Co. - Class A * 58,433 22,948 1,610,998 803,639 2,414,637 Energy 18.65% Anadarko Petroleum Corp. Dresser-Rand Group, Inc. * Hess Corp. (a) Occidental Petroleum Corp. (a) Pioneer Natural Resources Co. (a) Schlumberger Ltd. (a) Valero Energy Corp. Williams Cos., Inc./The (a) 27,510 56,292 36,186 44,052 14,990 60,766 22,954 124,613 3,100,102 3,901,036 3,658,405 4,569,514 3,127,663 6,662,384 1,242,730 7,406,997 33,668,831 Financials 9.58% American International Group, Inc. (a) Charles Schwab Corp./The NorthStar Asset Management Group, Inc. (a)* NorthStar Realty Finance Corp. (a) 70,001 129,891 239,309 283,367 3,924,256 3,703,192 4,424,823 5,245,123 17,297,394 Health Care 22.14% Amicus Therapeutics, Inc. * BioDelivery Sciences International, Inc. * Catalent, Inc. * Celgene Corp. (a)* Cerner Corp. * DaVita, Inc. (a)* HCA Holdings, Inc. (a)* Hologic, Inc. * Intercept Pharmaceuticals, Inc. * InterMune, Inc. (a)* Medivation, Inc. * Quest Diagnostics, Inc. Salix Pharmaceuticals Ltd. * United Therapeutics Corp. * 73,362 96,801 71,177 45,180 44,691 52,037 115,924 27,862 8,208 82,099 22,782 30,919 16,993 14,168 527,473 1,548,816 1,530,305 4,293,004 2,576,883 3,886,123 8,093,814 692,928 2,378,022 6,030,172 2,079,085 1,954,390 2,703,756 1,669,415 39,964,186 Common Stocks - Long - Domestic 72.38% Copyright © 2013 www.secdatabase.com. All Rights Reserved. Please Consider the Environment Before Printing This Document Industrials 1.34% Hertz Global Holdings, Inc. * 82,161 See accompanying notes which are an integral part of this schedule of investments. Copyright © 2013 www.secdatabase.com. All Rights Reserved. Please Consider the Environment Before Printing This Document 2,427,858 Information Technology 4.89% Aspen Technology, Inc. * Facebook, Inc. - Class A * Google, Inc. - Class A * SunEdison, Inc. (a)* Materials 1.42% Monsanto Co. (a) Real Estate Investment Trusts 1.04% Ryman Hospitality Properties, Inc. Telecommunication Services 0.07% TW Telecom, Inc. * Total Common Stocks - Long - Domestic (Cost $115,761,858) Common Stocks - Long - International 9.41% 30,160 47,594 4,307 68,541 1,239,274 3,560,983 2,508,224 1,509,958 8,818,439 22,102 2,556,096 37,844 1,882,739 3,130 128,440 130,655,799 Consumer Discretionary 2.67% Liberty Global PLC - Class A (a)* Liberty Global PLC - Class C * 67,532 44,728 2,949,122 1,875,445 4,824,567 Energy 1.65% GasLog Partners LP * Golar LNG Ltd. 24,596 34,169 819,785 2,152,647 2,972,432 59,789 1,259,156 26,885 5,767,370 53,734 2,155,271 Financials 0.70% Essent Group Ltd. * Information Technology 3.20% Baidu, Inc. (a)* Utilities 1.19% Abengoa Yield PLC * Total Common Stocks - Long - International (Cost $15,012,147) Total Investments 81.79% (Cost $130,774,005) Total Securities Sold Short (20.90)% (Proceeds Received $35,985,895) Other Assets in Excess of Liabilities 39.11% TOTAL NET ASSETS 100.00% (a) * 16,978,796 147,634,595 (37,719,688 ) 70,593,950 $180,508,857 All or a portion of the security is held as collateral for securities sold short. The total fair value of this collateral on August 31, 2014 was $55,159,260. Non-income producing security. See accompanying notes which are an integral part of this schedule of investments. Copyright © 2013 www.secdatabase.com. All Rights Reserved. Please Consider the Environment Before Printing This Document LS Opportunity Fund Schedule of Securities Sold Short August 31, 2014 (Unaudited) Shares Fair Value Common Stocks - Short - Domestic (8.84)% Consumer Discretionary (2.04)% Apollo Group, Inc. - Class A GameStop Corp. - Class A McDonalds Corp. Nordstrom, Inc. Red Robin Gourmet Burgers, Inc. Starbucks Corp. (11,925) (24,211) (12,463) (9,770 ) (5,995 ) (2,226 ) $(331,157 (1,021,704 (1,168,032 (676,573 (318,335 (173,205 (3,689,006 ) ) ) ) ) ) ) Consumer Staples (0.33)% Nu Skin Enterprises, Inc. - Class A Post Holdings, Inc. (12,478) (1,121 ) (558,016 (41,443 (599,459 ) ) ) (12,780) (1,271,099 ) (12,463) (1,180,371 ) (3,630 ) (21,937) (5,756 ) (6,977 ) (17,720) (9,493 ) (4,282 ) (11,321) (5,507 ) (6,239 ) (153,331 (670,175 (401,021 (660,024 (1,126,283 (197,929 (273,406 (332,724 (361,204 (619,595 (4,795,692 Industrials (1.14)% Danaher Corp. Deere & Co. (13,262) (12,419) (1,016,002 ) (1,044,314 ) (2,060,316 ) Information Technology (0.86)% International Business Machines Corp. Zillow, Inc. - Class A (6,809 ) (1,690 ) (1,309,371 ) (242,447 ) (1,551,818 ) (3,120 ) (803,930 Energy (0.71)% Exxon Mobil Corp. Financials (0.65)% Travelers Cos., Inc./The Health Care (2.66)% Abbott Laboratories Aegerion Pharmaceuticals, Inc. Alnylam Pharmaceuticals, Inc. CIGNA Corp. Eli Lilly & Co. Exact Sciences Corp. Medtronic, Inc. Pfizer, Inc. St. Jude Medical, Inc. Zimmer Holdings, Inc. Materials (0.45)% CF Industries Holdings, Inc. Total Common Stocks - Short - Domestic (Proceeds Received $15,706,306) Common Stocks - Short - International (1.71)% Consumer Discretionary (0.39)% Garmin Ltd. Vipshop Holdings Ltd. Copyright © 2013 www.secdatabase.com. All Rights Reserved. Please Consider the Environment Before Printing This Document ) (15,951,691) (6,065 ) (1,872 ) See accompanying notes which are an integral part of this schedule of investments. ) ) ) ) ) ) ) ) ) ) ) (329,511 (368,091 (697,602 ) ) ) Health Care (0.74)% GlaxoSmithKline PLC ADR Information Technology (0.48)% Bitauto Holdings Ltd. SINA Corp. Materials (0.10)% Potash Corporation of Saskatchewan, Inc. Total Common Stocks - Short - International (Proceeds Received $3,091,922) Exchange-Traded Funds - Short (10.35)% Consumer Discretionary Select Sector SPDR Fund Energy Select Sector SPDR Fund Health Care Select Sector SPDR Fund Industrial Select Sector SPDR Fund iShares Nasdaq Biotechnology ETF Powershares QQQ Trust, Series 1 SPDR S&P 500 ETF Trust Total Exchange-Traded Funds - Short (Proceeds Received $17,187,667) Total Securities Sold Short (20.90)% (Proceeds Received $35,985,895) (27,312) (1,341,019 ) (2,496 ) (14,009) (219,224 (646,936 (866,160 ) ) ) (5,033 ) (176,960 ) (3,081,741 ) (16,900) (4,388 ) (20,298) (21,602) (2,677 ) (55,831) (41,431) (1,163,058 (433,271 (1,296,230 (1,166,940 (740,324 (5,570,817 (8,315,616 (18,686,256) $(37,719,688) ADR American Depositary Receipt Tax Related - At August 31, 2014, the appreciation (depreciation) of investments, net of proceeds for investment securities sold short, was as follows: Unrealized appreciation Unrealized depreciation Net unrealized appreciation (depreciation) $16,070,125 (2,251,560 ) 13,818,565 Aggregate cost of securities for income tax purposes $96,096,342 The difference between book basis and tax basis unrealized appreciation was attributable primarily to the tax deferral of losses on wash sales of $1,308,232 for LS Opportunity Fund. See accompanying notes which are an integral part of this schedule of investments. Copyright © 2013 www.secdatabase.com. All Rights Reserved. Please Consider the Environment Before Printing This Document ) ) ) ) ) ) ) LS Opportunity Fund Notes to the Schedule of Investments August 31, 2014 (Unaudited) The LS Opportunity Fund (the Fund) is an investment company and follows accounting and reporting guidance under Financial Accounting Standards Board (FASB) Accounting Standards Codification (ASC) Topic 946, Financial Services-Investment Companies. The following is a summary of significant accounting policies consistently followed by the Fund in the preparation of its financial statements. The policies are in conformity with accounting principles generally accepted in the United States of America (GAAP). Security Transactions and Related Income - The Fund follows industry practice and records security transactions on the trade date for financial reporting purposes. The Last In, First Out method is used for determining gains or losses on securities transactions for financial statement and income tax purposes. Dividend income and dividend expense are recorded on the ex-dividend date and interest income is recorded on an accrual basis. Distributions from Limited Partnerships are recognized on the ex-date. Income or loss from Limited Partnerships is reclassified in the components of net assets upon receipt of Schedules K-1 (Form 1065). Discounts and premiums on securities purchased are amortized or accreted using the effective interest method. Withholding taxes on foreign dividends have been provided for in accordance with the Funds understanding of the applicable countrys tax rules and rates. Short Sales - The Fund may make short sales as part of its overall portfolio management strategies or to offset a potential decline in value of a security. The Fund may engage in short sales with respect to various types of securities, including Exchange Traded Funds (ETFs). A short sale involves the sale of a security that is borrowed from a broker or other institution to complete the sale. The Fund may engage in short sales with respect to securities it owns, as well as securities that it does not own. Short sales expose the Fund to the risk that it will be required to acquire, convert or exchange securities to replace the borrowed securities (also known as covering the short position) at a time when the securities sold short have appreciated in value, thus resulting in a loss to the Fund. The Funds investment performance may also suffer if the Fund is required to close out a short position earlier than it had intended. The Fund must segregate assets determined to be liquid in accordance with procedures established by the Board of Trustees, or otherwise cover its position in a permissible manner. The Fund will be required to pledge its liquid assets to the broker in order to secure its performance on short sales. As a result, the assets pledged may not be available to meet the Funds needs for immediate cash or other liquidity. In addition, the Fund may be subject to expenses related to short sales that are not typically associated with investing in securities directly, such as costs of borrowing and margin account maintenance costs associated with the Funds open short positions. These types of short sales expenses are sometimes referred to as the negative cost of carry, and will tend to cause the Fund to lose money on a short sale even in instances where the price of the underlying security sold short does not change over the duration of the short sale. Dividend expenses on securities sold short and borrowing costs are not covered under the Long Short Advisors, LLC (the Adviser) expense limitation agreement with the Fund and, therefore, these expenses will be borne by the shareholders of the Fund. The amount of restricted cash held at the broker as collateral for securities sold short was $20,261,785 as of August 31, 2014. Foreign Currency Translations Foreign currency amounts are translated into U.S. dollars as follows: (i) assets and liabilities at the rate of exchange at the end of the respective period; and (ii) purchases and sales of securities and income and expenses at the rate of exchange prevailing on the dates of such transactions. The portion of the results of operations arising from changes in the exchange rates and the portion due to fluctuations arising from changes in the market prices of securities are not isolated. Such fluctuations are included with the net realized and unrealized gain or loss on investments. The Fund may enter into transactions to purchase or sell foreign currencies to protect the U.S. dollar value of its underlying portfolio securities against the effect of possible adverse movements in foreign exchange rates. Principal risks associated with such transactions include the movement in value of the foreign currency relative to the U.S. dollar and the ability of the counterparty to perform. Fluctuations in the value of such forward currency transactions are recorded daily as unrealized gain or loss; realized gain or loss includes net gain or loss on transactions that have terminated by settlement or by a fund entering into offsetting commitments. Reported net realized foreign exchange gains or losses arise from sales of foreign currencies, currency gains or losses realized between the trade and settlement dates on securities transactions, and the difference between the amounts of dividends, interest, and foreign withholding taxes recorded on the companys books and the U.S. dollar equivalent of the amounts actually received or paid. These instruments involve market risk, credit risk, or both kinds of risks, in excess of the amount recognized in the Statement of Assets and Liabilities. Risks arise from the possible inability of counterparties to meet the terms of their contracts and from movement in currency and securities values and interest rates. Securities Valuation and Fair Value Measurements - Fair value is defined as the price that a Fund would receive upon selling an investment in an orderly transaction to an independent buyer in the principal or most advantageous market of the investment. GAAP establishes a three-tier hierarchy to maximize the use of observable market data and minimize the use of unobservable inputs and to establish classification of fair value measurements for disclosure purposes. Copyright © 2013 www.secdatabase.com. All Rights Reserved. Please Consider the Environment Before Printing This Document Inputs refer broadly to the assumptions that market participants would use in pricing the asset or liability, including assumptions about risk (the risk inherent in a particular valuation technique used to measure fair value such a pricing model Copyright © 2013 www.secdatabase.com. All Rights Reserved. Please Consider the Environment Before Printing This Document LS Opportunity Fund Notes to the Schedule of Investments - continued August 31, 2014 (Unaudited) and/or the risk inherent in the inputs to the valuation technique). Inputs may be observable or unobservable. Observable inputs are inputs that reflect the assumptions market participants would use in pricing the asset or liability developed based on market data obtained from sources independent of the reporting entity. Unobservable inputs are inputs that reflect the reporting entitys own assumptions about the assumptions market participants would use in pricing the asset or liability developed based on the best information available in the circumstances. Various inputs are used in determining the value of the Funds investments. These inputs are summarized in the three broad levels listed below. Level 1 quoted prices in active markets for identical securities Level 2 other significant observable inputs (including, but not limited to, quoted prices for an identical security in an inactive market, quoted prices for similar securities, interest rates, prepayment speeds, credit risk, etc.) Level 3 significant unobservable inputs (including the Funds own assumptions in determining fair value of investments based on the best information available) The inputs used to measure fair value may fall into different levels of the fair value hierarchy. In such cases, for disclosure purposes, the level in the fair value hierarchy within which the fair value measurement falls in its entirety, is determined based on the lowest level input that is significant to the fair value measurement in its entirety. Equity securities, including common stocks, exchange traded funds, real estate investment trusts, and american depositary receipts are generally valued by using market quotations, furnished by a pricing service. Securities that are traded on any stock exchange are generally valued at the last quoted sale price. Lacking a last sale price, an exchange traded security is generally valued by the pricing service at its last bid price. Securities traded in the NASDAQ over-the-counter market are generally valued by the pricing service at the NASDAQ Official Closing Price. When using the market quotations or close prices provided by the pricing service and when the market is considered active, the security is classified as a Level 1 security. Sometimes, an equity security owned by the Fund will be valued by the pricing service with factors other than market quotations or when the market is considered inactive. When this happens, the security is classified as a Level 2 security. When market quotations are not readily available, when the Adviser determines that the market quotation or the price provided by the pricing service does not accurately reflect the current fair value, or when restricted or illiquid securities are being valued, such securities are valued as determined in good faith by the Adviser, in conformity with guidelines adopted by and subject to review by the Board. These securities are generally categorized as Level 3 securities. Investments in mutual funds, including money market mutual funds, are generally priced at the ending net asset value (NAV) provided by the service agent of the funds. These securities are categorized as Level 1 securities. In accordance with the Trusts good faith pricing guidelines, the Adviser is required to consider all appropriate factors relevant to the value of securities for which it has determined other pricing sources are not available or reliable as described above. No single standard exists for determining fair value, because fair value depends upon the circumstances of each individual case. As a general principle, the current fair value of an issue of securities being valued by the Adviser would appear to be the amount which the owner might reasonably expect to receive for them upon their current sale. Methods which are in accordance with this principle may, for example, be based on (i) a multiple of earnings; (ii) a discount from market of a similar freely traded security (including a derivative security or a basket of securities traded on other markets, exchanges or among dealers); or (iii) yield to maturity with respect to debt issues, or a combination of these and other methods. Good faith pricing is permitted if, in the Advisers opinion, the validity of market quotations appears to be questionable based on factors such as evidence of a thin market in the security based on a small number of quotations, a significant event occurs after the close of a market but before a Funds NAV calculation that may affect a securitys value, or the Adviser is aware of any other data that calls into question the reliability of market quotations. Good faith pricing may also be used in instances when the bonds the Fund invests in may default or otherwise cease to have market quotations readily available. Copyright © 2013 www.secdatabase.com. All Rights Reserved. Please Consider the Environment Before Printing This Document The following is a summary of the inputs used to value the Funds investments as of August 31, 2014: LS Opportunity Fund Notes to the Schedule of Investments - continued August 31, 2014 (Unaudited) Valuation Inputs Assets Common Stocks* Total Level 1 - Quoted Prices in Active Markets Level 2 - Other Significant Observable Inputs Level 3 Significant Unobservable Inputs $147,634,595 $147,634,595 $ $ $ $ Total $147,634,595 $147,634,595 * Refer to the Schedule of Investments for industry classifications. Valuation Inputs Liabilities Common Stocks* Exchange - Traded Funds Total Level 1 - Quoted Prices in Active Markets Level 2 - Other Significant Observable Inputs Level 3 Significant Unobservable Inputs $(19,033,432 ) (18,686,256 ) $(37,719,688 ) $ $ $ $ Total $(19,033,432) (18,686,256) $(37,719,688) * Refer to the Schedule of Securities Sold Short for industry classifications. The Fund did not hold any investments at any time during the reporting period in which significant unobservable inputs were used in determining fair value; therefore no reconciliation of Level 3 securities is included for this reporting period. The Trust recognizes transfers between fair value hierarchy levels at the reporting period end. There were no transfers between any levels as of August 31, 2014. Copyright © 2013 www.secdatabase.com. All Rights Reserved. Please Consider the Environment Before Printing This Document Item 2. Controls and Procedures. (a) Based on an evaluation of the registrants disclosure controls and procedures as of a date within 90 days of the filing date of this report the Principal Executive Officer and Principal Financial Officer concluded the disclosure controls and procedures are reasonably designed to ensure that the information required in filings on Forms N-Q is recorded, processed, summarized, and reported on a timely basis. (b) There were no significant changes in the registrants internal control over financial reporting that occurred during the registrants last fiscal quarter that have materially affected, or are reasonably likely to materially affect, the registrants internal control over financial reporting. Item 3. Exhibits. Certifications by the registrants principal executive officer and principal financial officer, pursuant to the Sarbanes- Oxley Act of 2002 and required by Rule 30a-2a under the Investment Company Act of 1940 are filed herewith. Copyright © 2013 www.secdatabase.com. All Rights Reserved. Please Consider the Environment Before Printing This Document SIGNATURES Pursuant to the requirements of the Securities Exchange Act of 1934 and the Investment Company Act of 1940, the registrant has duly caused this report to be signed on its behalf by the undersigned, thereunto duly authorized. Registrant By Date Valued Advisers Trust /s/ R. Jeffrey Young R. Jeffrey Young, President and Principal Executive Officer October 21, 2014 Pursuant to the requirements of the Securities Exchange Act of 1934 and the Investment Company Act of 1940, this report has been signed below by the following persons on behalf of the registrant and in the capacities and on the dates indicated. By Date By Date /s/ R. Jeffrey Young R. Jeffrey Young, President and Principal Executive Officer October 21, 2014 /s/ Bryan W. Ashmus Bryan W. Ashmus, Treasurer and Principal Financial Officer October 21, 2014 Copyright © 2013 www.secdatabase.com. All Rights Reserved. Please Consider the Environment Before Printing This Document FORM N-Q CERTIFICATION I, R. Jeffrey Young, certify that: 1. I have reviewed this report on Form N-Q of Valued Advisers Trust; 2. Based on my knowledge, this report does not contain any untrue statement of a material fact or omit to state a material fact necessary to make the statements made, in light of the circumstances under which such statements were made, not misleading with respect to the period covered by this report; 3. Based on my knowledge, the schedules of investments included in this report fairly present in all material respects the investments of the registrant as of the end of the fiscal quarter for which the report is filed; 4. The registrants other certifying officer(s) and I are responsible for establishing and maintaining disclosure controls and procedures (as defined in Rule 30a-3(c) under the Investment Company Act of 1940) and internal control over financial reporting (as defined in Rule 30a-3(d) under the Investment Company Act of 1940) for the registrant and have: 5. a) designed such disclosure controls and procedures, or caused such disclosure controls and procedures to be designed under our supervision, to ensure that material information relating to the registrant, including its consolidated subsidiaries, is made known to us by others within those entities, particularly during the period in which this report is being prepared; b) designed such internal control over financial reporting, or caused such internal control over financial reporting to be designed under our supervision, to provide reasonable assurance regarding the reliability of financial reporting and the preparation of financial statements for external purposes in accordance with generally accepted accounting principles; c) evaluated the effectiveness of the registrants disclosure controls and procedures and presented in this report our conclusions about the effectiveness of the disclosure controls and procedures, as of a date within 90 days prior to the filing date of this report based on such evaluation; and d) disclosed in this report any change in the registrants internal control over financial reporting that occurred during the registrants most recent fiscal quarter that has materially affected, or is reasonably likely to materially affect, the registrants internal control over financial reporting; and The registrants other certifying officer(s) and I have disclosed to the registrants auditors and the audit committee of the registrants board of directors (or persons performing the equivalent functions): (a) All significant deficiencies and material weaknesses in the design or operation of internal control over financial reporting which are reasonably likely to adversely affect the registrants ability to record, process, summarize, and report financial information; and (b) Any fraud, whether or not material, that involves management or other employees who have a significant role in the registrants internal control over financial reporting. Date: October 21, 2014 /s/ R. Jeffrey Young R. Jeffrey Young President and Principal Executive Officer Copyright © 2013 www.secdatabase.com. All Rights Reserved. Please Consider the Environment Before Printing This Document FORM N-Q CERTIFICATION I, Bryan W. Ashmus, certify that: 1. I have reviewed this report on Form N-Q of Valued Advisers Trust; 2. Based on my knowledge, this report does not contain any untrue statement of a material fact or omit to state a material fact necessary to make the statements made, in light of the circumstances under which such statements were made, not misleading with respect to the period covered by this report; 3. Based on my knowledge, the schedules of investments included in this report fairly present in all material respects the investments of the registrant as of the end of the fiscal quarter for which the report is filed; 4. The registrants other certifying officer(s) and I are responsible for establishing and maintaining disclosure controls and procedures (as defined in Rule 30a-3(c) under the Investment Company Act of 1940) and internal control over financial reporting (as defined in Rule 30a-3(d) under the Investment Company Act of 1940) for the registrant and have: 5. a) designed such disclosure controls and procedures, or caused such disclosure controls and procedures to be designed under our supervision, to ensure that material information relating to the registrant, including its consolidated subsidiaries, is made known to us by others within those entities, particularly during the period in which this report is being prepared; b) designed such internal control over financial reporting, or caused such internal control over financial reporting to be designed under our supervision, to provide reasonable assurance regarding the reliability of financial reporting and the preparation of financial statements for external purposes in accordance with generally accepted accounting principles; c) evaluated the effectiveness of the registrants disclosure controls and procedures and presented in this report our conclusions about the effectiveness of the disclosure controls and procedures, as of a date within 90 days prior to the filing date of this report based on such evaluation; and d) disclosed in this report any change in the registrants internal control over financial reporting that occurred during the registrants most recent fiscal quarter that has materially affected, or is reasonably likely to materially affect, the registrants internal control over financial reporting; and The registrants other certifying officer(s) and I have disclosed to the registrants auditors and the audit committee of the registrants board of directors (or persons performing the equivalent functions): (a) All significant deficiencies and material weaknesses in the design or operation of internal control over financial reporting which are reasonably likely to adversely affect the registrants ability to record, process, summarize, and report financial information; and (b) Any fraud, whether or not material, that involves management or other employees who have a significant role in the registrants internal control over financial reporting. Date: October 21, 2014 /s/ Bryan W. Ashmus Bryan W. Ashmus Treasurer and Principal Financial Officer Copyright © 2013 www.secdatabase.com. All Rights Reserved. Please Consider the Environment Before Printing This Document
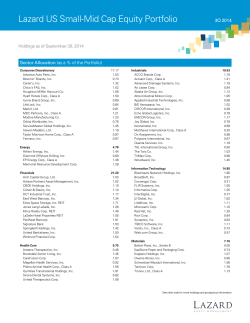
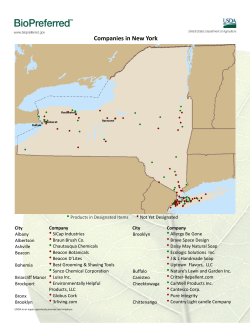


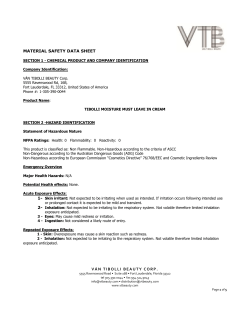


© Copyright 2026