
Benchmarking diaspora performance as an input for policy makers: a comparative
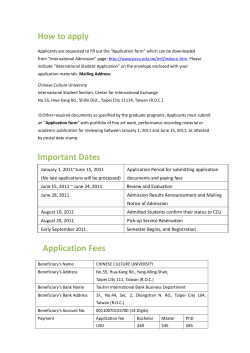
GENERAL ARTICLES
Benchmarking diaspora performance as an
input for policy makers: a comparative
statistical analysis
Dusan Milosevic, Jovan Filipovic, Mladen Djuric and Marina Dobrota*
This article presents a benchmarking study that identifies relationships among diaspora-related
performance indicators. It essentially examines whether diasporas based in high human development
index states are directly correlated to high remittance amounts per diaspora member. It also argues
that remittances and foreign direct investment are not directly correlated to net migration rates, as
may have been predicted previously. A performance functional benchmarking study was conducted
to test hypotheses on seven diasporas – Armenian, Lebanese, Chinese, Indian, Filipino, Romanian
and Serbian. The results might serve as an informative input for policy makers on diaspora issues.
Keywords:
Benchmarking, diaspora, performance indicators, policy makers.
DIASPORA has proven to be an invaluable economic
resource for many countries1 . Therefore, measuring diaspora performances and identifying the underlying relations between diaspora performance indicators, can create
a significant input for policy makers dealing with this
subject matter.
Diaspora might be defined as a transnational network
of places populated by dispersed political subjects that
are connected by ties of co-responsibility across boundaries of nations2, and often is the discussion issue3,4.
Boyarin and Boyarin5 suggested a diaspora-based
synthetic model as an alternative to national selfdetermination, especially in the context of problems that
arise around the globe regarding unresolved border and
territory disputes, and particularly effective when it
comes to Jewish communities and the complexity that
emerges from their historical legacy. Thus comprehended, diaspora represents ‘a dissociation of ethnicities
and political hegemonies as the only social structure that
even begins to make possible maintenance of cultural
identity in a world grown thoroughly and inextricably
interdependent’5. According to Brinkerhoff6, although
policy makers recognize diaspora’s growing influence in
international affairs and domestic policy, and its contributions to development, the extent to which it is possible
to control these contributions is limited.
As Sheffer7 underlines, a trilateral process, between
home government, diaspora community and host government, shapes diaspora policies. Brinkerhoff8 uses this
conclusion to challenge the contribution of selected diasThe authors are in Faculty of Organizational Sciences, University of
Belgrade, Jove Ilica 154, 11000 Belgrade, Serbia
*For correspondence. (e-mail: [email protected])
CURRENT SCIENCE, VOL. 107, NO. 8, 25 OCTOBER 2014
pora members and organizations, and their influence on
global policies, which can be both positive and negative,
while dominantly it is perceived as negative. Gerson 9
argued about the harmfulness of ethnic groups’ participation in American foreign policy and influence of these
groups on decision-making process. However, Brinkerhoff8 supports his argument with the example presented
by Shain10, where American policy makers worked with
diasporas on contributing to US foreign policy by exporting and preserving American values abroad. Baubock11
states that some governments feel constant fear of social
activities of the ethnic groups that seem easy to be outside of their control and consist of people who often promote political changes in their motherland and oppose its
authorities, especially through organization of networks
which deploy accumulated human and social capital of
compatriots scattered in their host lands.
On the other hand, countries gain access to external
resources (such as different communities of practice and
knowledge communities in which experts in diaspora
participate) through relations with other organizations
and individuals – experts in diaspora1. Diaspora is a public resource, and analysing and organizing diaspora issues
is a public administration topic12.
Having this in mind, policy makers need to acknowledge that diaspora is not only an unexploited national
resource, but that diaspora communities also represent
marginalized constituencies13. The trend of growing
interest in Diaspora is not reflected in the literature with
respect to empirically based studies. This research should
contribute to bridging this gap by testing hypotheses that
might help attempts to come up with ‘widely conceived
and morally grounded strategy’ as well as an ‘overarching policy and associated practices that facilitate the
1253
GENERAL ARTICLES
ongoing development of the relationship between motherland and its diaspora’14.
An ever present challenge for diaspora researchers
might be finding some kind of pattern in common for a
number of diasporas originating from different sociocultural archetypes. In essays on multifaceted diaspora configurations throughout the world, Braziel and Mannur15
allow us to follow characteristics of diasporas that emerged from Asian, South American and African countries’
emigrations in order to provide a common basis for establishing models and approaches for this sensitive, sometimes very subtle and complex area. Thus, it was firstly
important to select countries that were of the best possible interest. Seven countries were selected for the research, due to availability of data: Armenia, China, India,
Lebanon, the Philippines, Romania and Serbia. Countries
were matched according to some predefined notions. For
example: Armenia and Lebanon were chosen for their
high percentage of diaspora population versus homecountry population; China and India – two giants were
chosen as states with the highest remittance amounts and
biggest diasporas; the Philippines and Romania were chosen as two states with the highest remittance amounts per
diaspora member; lastly, Serbia was chosen, since from
our perspective it holds elements of all the previously discussed countries.
Since benchmarking can function efficiently and effectively in public sector and that it is suitable for use by
governments within their performance improvement
methodologies14, we followed the prescribed benchmarking study framework16 to ensure a high quality input for
policy makers regarding diaspora issues.
Research methodology
Type of benchmarking study
In the first step, we identified the type of benchmarking
study. For this research, we applied the plan-do-check-act
benchmarking approach17,18. The idea is to benchmark the
performance of various diasporas. Since these diasporas
are not in direct competition, the study will take on a
functional benchmarking character19,20.
Performance indicators and data collection
The second step was to identify the performance indicators. We identified the following indicators, and collected
data from 2000 to 2009. Besides a brief explanation of
indicators, we also provide a clarification of the selection
and intertwining process.
Remittance: One of the key indicators of diaspora involvement in mother country activities are remittances –
transfers of money by a diaspora member to his or her
1254
home country. In many country cases, remittances
account for considerable percentages of state Gross
Domestic Product (GDP)21. The data were obtained from
The World Bank22; with US$ 46 billion, India is in the
lead, while Armenia has the lowest remittance amount at
US$ 743 million, as estimated by the years end of 2009.
All countries exhibit considerable growth in remittance
amounts from year to year.
Foreign direct investment: Foreign direct investment
(FDI) is a concept that cannot be directly related to the
diaspora; however, it is a concept closely related to remittances, because they are correlated to development and
growth. Both Riddle et al. 23 and Javorcik et al.24 claim
that diasporas can play an important role in attracting FDI
to their home countries by facilitating information flows
across borders and providing trust. According to data,
China leads with an amount of US$ 147 billion, while
once again Armenia has the lowest figures at US$ 935
million.
Net migration rate (NMR): It is the net measure of incoming and outgoing migrants in a particular scenario –
in our case, country. Armenia leads at a rate of –4.56 persons per 1000, whereas Lebanon has a neutral migration
rate.
Unemployment rate: It is the measure of the number of
unemployed persons versus the total workforce, as a percentage, of a given country. Unemployment rate is important for this study since it is believed that it will have a
direct correlation to remittances, similar to claims by
Mansoor and Quillin 25, and León-Ledesma and Piracha26.
Data were collected from The World Fact Book27,28;
Armenia and Serbia had the greatest unemployment rates,
while China and Romania had the lowest.
Gross domestic product (GDP): It measures growth and
sets a benchmark against which remittances can be compared. According to International Monetary Fund29, most
countries had decreased GDP going from 2008 to 2009,
excluding Lebanon, China and India. This can largely be
attributed to the global financial crisis.
Human development index (HDI): It is a composite statistic, which includes health, schooling and incomerelated performances, and is used as an index to rank
countries by their level of human development. The HDI
data are collected from the United Nations Development
Programme (UNDP)30.
Diaspora demographics: These include the size and distribution measurements of a given diaspora. It must be
noted that there are two types of diaspora demographics
data: Census data31 and estimated figures. According
to UNDP32, China has both the largest diaspora of the
CURRENT SCIENCE, VOL. 107, NO. 8, 25 OCTOBER 2014
GENERAL ARTICLES
countries in this study as well as in the world, estimated
at some 40 million persons living abroad. Serbia has the
smallest number of persons living abroad, at just under 3
million. The whole set of analysed data is available upon
request.
Rationale for indicators selection: Some of the problems that limit the field of our research, with regard to
some of the countries that could have been of interest,
were significant issues with lack of available and reliable
data. Not necessarily remittance data, but as the process
of data collection grew, so did the scope of the searched
data. Therefore, some of the states that may have had interesting remittance data did not have others that were
sought after as well. While NMR and diaspora demographics are substantial for this study, the originally
sought data were regarding remittances (as stated above,
it was suggested that the remittances are in positive correlation with unemployment rate), but soon GDP and FDI
seemed to be quite related and of interest (see, for example, Liu et al.33 ). HDI played an important role in the
research as this multiple index connects data from many
countries through composition of health (life expectancy
at birth), education (mean and expected years of schooling) and living standards (gross national income per
capita) indicators to compare overall well-being over
conventional economic metrics34. Finally, the following
criteria were used to select the diasporas that were to be
studied: high remittance amounts, high remittance per
diaspora member, high remittance as a percentage of
GDP and high percentage of diaspora populations versus
home-country populations.
Research hypotheses
In the next step, we identified the potential relations
among the selected performance indicators, in order to
describe how the indicators will affect each other as well
as the general performance.
Hypothesis 1. Remittances, FDI and NMR relations: Remittances and FDI are assumed to be directly correlated.
NMR should be negatively correlated to remittances, and
therefore negatively correlated with FDI, as evidenced by
Liu et al.33. Hypothetically, a decrease in the NMR means
that diaspora size has increased, which should mean that
remittances will increase. Remittances are found to be a
less volatile source of external finance than FDI35.
Hypothesis 2. Remittances, remittance as a percentage of
GDP and unemployment rate relations: Hypothetically,
as unemployment rates increase, so should incoming remittance amounts, as previously found by Mansoor and
Quillin25, and León-Ledesma and Piracha26. This is due to
an expected inflow of money to combat the effects of
CURRENT SCIENCE, VOL. 107, NO. 8, 25 OCTOBER 2014
unemployment. Additionally, as unemployment increases, GDP should decrease since the country should be
producing less with more people unemployed. Therefore,
the remittances percentage of GDP should be related to
unemployment percentage. As unemployment increases,
remittances increase and GDP decreases, remittances as a
percentage of GDP will increase. Previous evidence such
as Drinkwater et al.36 also report the correlation between
remittances (as a percentage of GDP) and the unemployment rate for a number of countries36.
Hypothesis 3. Diaspora demographics and HDI relations: The comparison of diaspora demographics and
the HDI of given states in which diasporas are located
should have a direct relation to the remittance amount per
diaspora member. Higher the HDI average of a given
diaspora, greater the amounts of remittance per diaspora
member34.
Hypothesis 4. Average remittance amounts per diaspora
member and weighted HDI average relations: Previous
research shows that remittances effect economic growth,
and thus HDI, positively and significantly37. The resulting amounts of average remittance per diaspora member
show the average performance of each diaspora member.
These two figures should be directly related: higher the
HDI weighted average, higher the average remittance
amount per diaspora member.
Results
In order to test the outlined hypotheses, we processed the
collected data and conducted analyses.
According to Hypothesis 1, remittances and FDI
should increase when NMR decreases, and vice versa.
This is because a decrease in NMR means that the number of individuals leaving the country is increasing. This
should directly correspond to a rise of remittances and
FDI, because as the number of individuals leaving the
country increases, incoming remittances and FDI should
also increase.
The analysis (Table 1) indicates that the above
hypothesis is only partially correct. There does seem to
be a direct correlation between remittances and FDI: if
we calculate Pearson’s correlation coefficient38,39 for all
the collected data, we can conclude that there is a strong40
significant correlation (r = 0.711, p < 0.001) between
these two indicators. Furthermore, we analysed data for
each country separately. The correlations are strong for
Armenia (r = 0.969, p < 0.001), Lebanon (r = 0.908,
p = 0.001), China (r = 0.962, p < 0.001), India (r = 0.975,
p < 0.001), Romania (r = 0.918, p < 0.001), and Serbia
(r = 0.831, p = 0.005), all at 0.01 level of significance.
Only for the Philippines, correlation is not statistically
significant (r = 0.455, p = 0.219).
1255
GENERAL ARTICLES
Relations among remittances, FDI and NMR were as
predicted only in a few isolated cases. For example:
Armenia between 2003 and 2004; China between 2003
and 2004; Serbia between 2006 and 2007. If we observe
remittances and NMR, Pearson’s correlation for all the
collected data is moderate40 (r = –0.432, p = 0.002), at the
0.01 significance level. If we split the data, significant
correlations only occur in the case of India (r = –0.921,
p = 0.003). Other correlations are non-significant41.
If we observe FDI and NMR, Pearson’s correlation
coefficient for all the collected data is non-significant
(r = –0.263, p = 0.093). However, observing the separated data, we could see that significant correlations do
occur in the cases of India (r = –0.848, p = 0.033) and the
Philippines (r = –0.838, p = 0.037), both significant at the
0.05 level.
Overall, these mixed results can be attributed to the
fact that it takes some time for the migrants leaving a
country to establish themselves and make an impact on
their home countries, in terms of contributing to remittances and FDI.
According to Hypothesis 2, as remittances increase,
unemployment rate should decrease, while remittance as
percentage of GDP and unemployment rate should move
in unison. The conclusion, driven from the data analysis,
is that this hypothesis was mostly correct. Generally, as
remittances increase, unemployment decreases. Pearson’s
Table 1.
Pearson’s correlation coefficients between remittances, FDI
and NMR
Data
Remittances
and FDI
Remittances
and NMR
FDI
and NMR
0.711**
0.969**
0.908**
0.962**
0.975**
0.455
0.918**
0.831**
–0.432**
0.320
–
0.502
–0.921**
0.679
–0.597
0.619
–0.263
0.182
–
0.459
–0.848*
–0.838*
–0.744
0.322
Grouped data
Armenia
Lebanon
China
India
Philippines
Romania
Serbia
*p < 0.5; **p < 0.01.
Table
2. Pearson’s correlation coefficient
remittances and unemployment rates
Data
Grouped data
Armenia
Lebanon
China
India
Philippines
Romania
Serbia
1256
Remittances and
unemployment rate
–0.427
–0.372
–0.372
0.400
–0.066
–0.797
–0.638
–0.559
for
correlation for all the collected data is significant (r =
–0.427, p = 0.001) at 0.01 level, so there is a moderate
indirect correlation between these two indicators. Furthermore, this conclusion is highly prominent in the cases
of the Philippines (r = –0.797, p = 0.006) and Romania
(r = –0.638, p = 0.047). Also, the remittances share of a
country’s GDP moves in unison with the unemployment
rate (r = 0.857, p = 0.014).
Additionally, these two figures were very close percentage-wise. For example: Indian remittances started
increasing largely in 2004; at the same time, the unemployment rate started to decrease; finally, the remittances
percentage of GDP and the unemployment rate are separated by 3% as of 2009.
The only state that stands out is China: the unemployment rate increase has coincided with increase in inflowing remittances. Indeed, if we separate China’s data from
other sets of data, we can observe that there is a positive
correlation between these two variables. These results are
given in Table 2.
Based on the data provided for Hypothesis 3, Serbian
diaspora seems to be the most strategically located,
whereas diasporas China and Armenia are more regionally based. According to the collected statistics, almost
99% of the Serbian diaspora is located in ‘very high’ HDI
countries. Conversely, Armenian diaspora has the lowest
number of those located in ‘very high’ HDI countries, at
just over 27%. These statistics should directly correlate to
the remittance amount per diaspora member, where Serbia should have the highest and Armenia the lowest
amount per diaspora member.
For the purpose of testing Hypothesis 4, we used additional data from the IMF29, UN DESA42 and the World
Bank22. Key statistics collected during this research are
presented in Table 3.
Many conclusions can hereupon be made. For example:
the Philippines have the highest remittance amount per
diaspora member. Even though Lebanon has the second
smallest remittance amount per diaspora member, it has
the highest remittance amount as a percentage of GDP of
2009, at 20.84%. Lebanon also has an estimated diaspora
size of over 14 million people, whereas the home country
has only a population of 4.2 million. Similarly, Armenia
has a diaspora size greater than the home-country population, but it has only an average remittance amount per
diaspora member of US$ 120 per year. The Philippines
have the highest remittance amount per diaspora member
at US$ 2,723 per year, whereas Romania is in a close
second at US$ 2,718. Average remittance amount per
diaspora member versus the weighted HDI diaspora is
presented in Figure 1. China, Lebanon and Armenia are
below the average remittance amount. India, Serbia, the
Philippines and Romania are all above the average remittance amount (Figure 1).
Statistics indicate that this hypothesis is not strongly
supported by the given data. Having set the weighted
CURRENT SCIENCE, VOL. 107, NO. 8, 25 OCTOBER 2014
GENERAL ARTICLES
Table 3.
Country
Population
2009
Armenia
3,238,000
Lebanon
4,224,000
China
1,337,340,000
India
1,180,462,000
The
92,226,600
Philippines
Romania
21,466,174
Serbia
7,334,935
Key diaspora statistics
GDP
per
capita
2009
(US$)
Remittances
Unemp- amount
loyment
2009e
rate
(US$
2009
mil)
Rem. %
GDP
2009
Remittnces
amount per
diaspora
pop
(US$)
Weighted
average
diaspora
HDI
Estimates
diaspora
size 2009
Diaspora
as %
of
Pop.
6,172,298
14,247,100
40,046,628
22,470,876
7,127,535
190.62%
337.29%
2.99%
1.90%
7.73%
8,714
33,585
4,908,982
1,235,975
160,991
2,668
8,707
3,678
1,031
1,746
7.10%
9.20%
4.00%
6.80%
7.40%
743
7,000
46,989
47,000
19,411
8.53%
20.84%
0.96%
3.80%
12.06%
120
491
1,173
2,092
2,723
0.840
0.858
0.818
0.787
0.911
2,943,022
2,874,154
13.71%
39.18%
161,521
42,879
7,542
5,809
3.60%
18.8%
8,000
5,438
4.95%
12.68%
2,718
1,892
0.940
0.954
GDP
(US$ mil)
Source: refs 22, 29 and 42.
Discussion and conclusion
Figure 1.
Average remittance amounts and weighted HDI average.
average as the baseline, it would be expected that Armenia and Lebanon would have higher remittance amount,
while India should have lower remittance amount. However, both Armenia and Lebanon have much larger diasporas than the populations of their home countries, at
191% and 337% respectively. It can be argued that the
links between the home country and diaspora may have
weakened to the point where entire families live outside
the home country and have no reason to send remittances.
Indeed, Pearson correlation between diaspora as a percentage of population and average remittance amounts
per diaspora member is significant at 0.05 level (r =
–0.769, p = 0.043). Therefore, we exclude Armenia and
Lebanon on the grounds of the above argument; the
remaining countries are much closer to the weighted
baseline.
CURRENT SCIENCE, VOL. 107, NO. 8, 25 OCTOBER 2014
This article endeavours to present outcomes of our research to policy makers by defining and analysing the
relations among the listed diaspora performance indicators. To encompass different kinds of interrelated diaspora policies, Smith34 discussed whether both home and
host countries have an impact on creating, extending and
limiting the space for policies towards diaspora. According to Brinkerhoff6 , the transnational role of diaspora
organizations increases and this trend is likely to continue, because of the development of communication and
transportation technologies. Policy makers should strive
to develop policies and international networks that enable
better coordination and employment of untapped resources located in diasporas6.
Based on the analysis of the major hypotheses, some
solid conclusions have been made. Regarding the assumption that remittances and FDI should be directly correlated and NMR and diaspora indirectly correlated, we
have found that this was only partially supported. The
correlation is direct and significant between remittances
and FDI based on the grouped data (r = 0.711), as well as
all the countries separately. On the other hand, NMR is
negatively correlated with other two variables, but only
significant between remittances and NMR (r = –0.432).
When it comes to formulating policies regarding remittances, it is necessary to review both positive and negative impacts of this kind of money transfer from labour
migration done35. The positive view considers remittances to be the effective response to market forces: they
improve income distribution and increase quality of life,
thus enabling a transition to an otherwise unsustainable
development43. The negative attitudes toward remittances
are mainly based on the assumptions that this kind of
money transfer increases dependency, consequently jeopardizing both economic and political stability and development, and causing economic decline with the costs
1257
GENERAL ARTICLES
being much larger than benefits of some temporary
advantages. Economic policy makers must balance
between the two while participating in the development
of the appropriate motherland–diaspora relations management system.
Initial assumptions also argue that as unemployment
increases, remittances should decrease, while remittances
as a percentage of GDP should increase. This theory has
been supported, and in most cases, if there has been an
increase in unemployment, remittances have increased in
the percentage of the GDP (r = 0.857). There is also a
trend that as remittances increase, unemployment decreases (r = –0.427). The only anomaly was China, where
the opposite occurred. However, it can be said that remittance amounts as a percentage of GDP and unemployment rates are all directly correlated, and both indirectly
correlated with remittances.
The assumption that the average remittance amount per
diaspora member and the weighted HDI average of diaspora disbursement should be directly correlated, has been
partially supported. Armenia and Lebanon were the most
anomalous, but this can be attributed to the large diaspora
versus home-country population percentages (r =
–0.769). However, excluding these two cases, this theory
has proven to be correct. The Philippines and Romania
have proven to be the two strongest and most solid
benchmarks.
Conclusions provided in this study should serve as an
important marker of the relations among all the diaspora
performance indicators. Besides being a contribution to
diaspora literature, the article can be used as an input for
policy makers to anticipate factors relevant to remittance
issues. As a result, appropriate policy changes can be easily analysed and effectively implemented.
1. Filipovic, J., Devjak, S. and Putnik, G., Knowledge based economy: the role of expert. Panoeconomicus, 2012, 59(3), 369–386;
doi:10.2298/PAN1203369F.
2. Werbner, P., The place which is diaspora: citizenship, religion and
gender in the making of chaordic transnationalism. J. Ethn. Migr.
Stud., 2002, 28(1), 119–133; doi:10.1080/13691830120103967.
3. Yoon, I. J., Migration and the Korean diaspora: a comparative
description of five cases. J. Ethn. Migr. Stud., 2012, 38(3), 413–
435; doi:10.1080/1369183X.2012.658545.
4. Oiarzabal, P. J. and Reips, U. D., Migration and diaspora in the
age of information and communication technologies. J. Ethn.
Migr. Stud., 2012, 38(9), 1333–1338; doi:10.1080/1369183X.
2012.698202.
5. Boyarin, D. and Boyarin, J., Diaspora: generation and the ground
of Jewish identity. Crit. Inquiry, 1993, 19(4), 693–725.
6. Brinkerhoff, J. M., David and goliath: Diaspora organizations as
partners in the development industry. Public Admin. Develop.,
2011, 31(1), 37–49; doi:10.1002/pad.587.
7. Sheffer, G., Modern Diasporas in International Politics
(ed. Gabriel Sheffer), Croom Helm, London, UK, 1986.
8. Brinkerhoff, J. M., Digital diasporas and international development: Afghan–Americans and the reconstruction of Afghanistan.
Public Admin. Develop., 2004, 24(5), 397–413; doi:10.1002/
pad.326.
1258
9. Gerson, L. L., The Hyphenate in Recent American Politics
and Diplomacy, University of Kansas Press, Lawrence, Kansas,
1964.
10. Shain, Y., Ethnic diasporas and US foreign policy. Polit. Sci.
Quart., 1994, 109(5), 811–841.
11. Baubock, R., Ties across borders: The growing salience of transnationalism and diaspora politics. IMISCOE Policy Brief, 2008;
http://dare.uva.nl/cgi/arno/show.cgi?fid=138152 (accessed on 14
June 2014).
12. Gamlen, A., Diaspora engagement policies: What are they, and
what kinds of states use them? Centre Migr. Policy Soc., 2006,
WP-06-32, 1–31.
13. Boyle, M. and Kitchin, R., Towards an Irish diaspora strategy: a
position paper. NIRSA Working Paper Series No. 37, 2008;
www.nuim.ie/nirsa/research/documents/WP37_BoyleandKitchin.
pdf (accessed on 19 September 2012 and 28 May 2014).
14. Djuric, M., Milosevic, D., Filipovic, J. and Ristic, S., Benchmarking as a quality management tool in public administration. Eng.
Econ., 2013, 24(4), 364–372; doi:10.5755/j01.ee.24.4.2785.
15. Braziel, J. E. and Mannur, A., Theorizing Diaspora: A Reader,
Blackwell Publishing Ltd, Malden, 2003.
16. Auluck, R., Benchmarking: A tool for facilitating organizational
learning? Public Admin. Develop., 2002, 22(2), 109–122; doi:10.
1002/pad.219.
17. Pulat, M. B., Benchmarking is more than organised tourism. Ind.
Eng., 1994, 26(3), 22–24.
18. Longbottom, D., Benchmarking in the UK: An empirical study of
practitioners and academics. Benchmarking: An Int. J., 2000, 7(2),
98–117; doi:10.1108/14635770010322324.
19. Bhutta, K. S. and Huq, F., Benchmarking – best practices: an integrated approach. Benchmarking Qual. Manage. Technol., 1999,
6(3), 254–268.
20. Elmuti, D. and Kathawala, Y., An overview of benchmarking
process: a tool for continuous improvement and competitive
advantage. Benchmarking Qual. Manage. Technol., 1997, 4(4),
229–243.
21. UNDP, Human Development Reports (HDR). United Nations
Development Programme, 2010; http://www.undp.org (accessed
on 25 April 2010).
22. World Bank, Prospects – Migration and remittances, 2010;
http://www.worldbank.org (accessed on 25 May 2010).
23. Riddle, L., Brinkerhoff, J. M. and Nielsen, T., Partnering to
beckon them home: public sector innovation for diaspora foreign
investment promotion. Public Admin. Develop., 2008, 28(1),
54–66; doi:10.1002/pad.469.
24. Javorcik, B. S. et al., Migrant networks and foreign direct investment. J. Dev. Econ., 2010, 94(2), 231–241.
25. Mansoor, A. and Quillin, B., Migration and Remittances:
Eastern Europe and the Former Soviet Union, The World Bank,
2006.
26. León-Ledesma, M. and Piracha, M., International migration and
the role of remittances in Eastern Europe, Department of Economics Discussion Paper No. 01/13, University of Kent, 2001.
27. CIA Fact book, CIA – The world fact book – Country comparison:
Net migration rate, 2010; https://www.cia.gov/library/publications/the-world-factbook/index.html (accessed on 25 May 2010).
28. IOM, International Organization for Migration, 2010; http://www.
iom.int (accessed on 25 May 2010).
29. IMF, International Monetary Fund, 2010; http://www.imf.org (accessed on 25 May 2010).
30. UNDP, Towards Human Resilience: Sustaining MDG Progress in
an Age of Economic Uncertainty, United Nations Development
Programme, 2012; http://www.undp.org/content/dam/undp/library/
Poverty%20Reduction/Towards_SustainingMDG_Web1005.pdf
(accessed on 16 October 2012).
31. US Census Bureau, Diaspora, 2012; http://www.census.gov
(accessed on 25 June 2012).
CURRENT SCIENCE, VOL. 107, NO. 8, 25 OCTOBER 2014
GENERAL ARTICLES
32. UNDP, Human development reports: human development index –
indices and data, 2013; http://hdr.undp.org/en/statistics/hdi/
(accessed on 16 May 2013).
33. Liu, X., Burridge, P. and Sinclair, P. J. N., Relationships between
economic growth, foreign direct investment and trade: evidence
from China. Appl. Econ., 2002, 34(11), 1433–1440; doi:10.
1080/00036840110100835.
34. Smith, R. C., Diasporic membership in historical perspective:
comparative insights from the Mexican, Italian and Polish cases.
Int. Migr. Rev., 2003, 37(3), 724–759; doi:10.1111/j.1747-7379.
2003.tb00156.x.
35. Keely, C. B. and Tran, B. N., Remittances from labor migration:
Evaluations, performance and implications. Int. Migr. Rev., 1989,
23(3), 500–525.
36. Drinkwater, S., Levine, P. and Lotti, E., The labour market effects
of remittances. Flowenla Discussion Paper, Hamburg Institute of
International Economics, 2003.
37. Javid, M., Arif, U. and Qayyum, A., Impact of remittances
on economic growth and poverty. Acad. Res. Int., 2012, 2(1),
433–447.
CURRENT SCIENCE, VOL. 107, NO. 8, 25 OCTOBER 2014
38. Rodgers, J. L. and Nicewander, A. W., Thirteen ways to look at
the correlation coefficient. Am. Stat., 1988, 42(1), 59–66.
39. Stigler, S. M., Francis Galton’s account of the invention of correlation. Stat. Sci., 1989, 4(2), 73–79; doi:10.1214/ss/1177012580.
40. Cohen, J., Statistical Power Analysis for the Behavioral Sciences,
Lawrence Earlbaum Associates, Hillsdale, NJ, 1988, 2nd edn.
41. Myers, J. L. and Well, A. D., Research Design and Statistical
Analysis, Lawrence Erlbaum Associates, Mahwah, New Jersey,
2003, 2nd edn, p. 508.
42. UN DESA, United Nations Population Division Home Page,
United Nations Department of Economic and Social Affairs, 2010;
http://www.un.org/en/development/desa (accessed on 25 April
2010).
43. Ahmed, J. and Martinez-Zarzoso, I., Blessing or curse: The stabilizing role of remittances, foreign aid and FDI to Pakistan;
http://www.iza.org/conference_files/SUMS_2013/ahmed_j8716.
pdf (accessed on 10 June 2014).
Received 1 February 2014; revised accepted 5 August 2014
1259


© Copyright 2026