
Document 372967
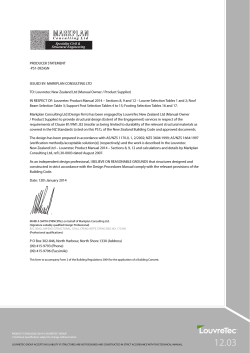
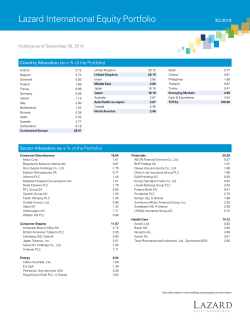
Daily Calls
October 28, 2014
Market Outlook
Domestic Indices
Indices
Close
Change
Change%
26752.90
-98.15
-0.37
7991.70
-22.85
-0.29
7998.00
-25.85
-0.32
10214.15
9592.09
-40.55
-80.94
-0.40
-0.84
10642.69
-19.96
-0.19
Indices
Close
16817.94
Dow Jones
Nasdaq
4485.93
6363.46
FTSE
DAX
8902.61
Hang Seng
23256.68
Nikkei
15363.18
8025.00
SGX Nifty
* Asian Market at 7:30 am.IST
Change
12.53
2.22
-25.27
-85.19
144.04
-28.47
29.00
Change%
0.07
0.05
-0.40
-0.95
0.62
-0.19
0.36
S&P BSE Sensex
CNX Nifty
Nifty future
S&PBSE 500
S&PBSE Midcap
S&PBSE Smallcap
Sensex: We said, "The bias can turn negative with a close below the previous candle..." The index opened 144 points higher but
weakened 268 points intra-day and finished 98 points or 0.3% lower. Hindustan Unilever, down 4.7%, and oil & gas majors kept
the Sensex under pressure. The Realty Index also lost 3.7% while the A/D ratio turned negative 1:2 in tune.
The action formed an Engulfing Line Bear candle at 81% retracement level to the channelled 14-day fall from 27257 to 25911. The
bottom of the candle is seen testing last Wednesday's gap-up area, which offers immediate technical support. However, further
negative options can open up if bulls fail to take advantage of the gap-up support.
Exhibit 1: Sensex – Daily Candlestick Chart
Global Indices
Market Breadth
23
114
Unchg
NSE
BSE
697
Decline
448
Advance
0
1610
1244
500
1000
1500
2000
Recommendations for the day
1. Sell Nifty Oct Future in range of 8030-8035
2. Buy Union Bank of India above 227.50
3. Buy Hindustan Zinc in range of 167.50-168.00
4. Sell Century Textile below 523.00
5. Sell RCom in range of 101.00-101.50
*All recommendations are of October Future
Source: ASA, ICICIdirect.com Research
ICICI Securities Ltd. | Retail Equity Research
Exhibit 2: Nifty Future – Daily Candlestick Chart
CNX Nifty (Cash Levels) Technical Picture
Nifty
Trend
Intraday
Rangebound
Short Term
Up
Support
7975-7950
7650
Resistance
8025-8050
8200
Trend Reversal
7650
20 Days EMA
7933
200 days EMA
7288
Nifty Future Recommendations
CMP :
7998.00
Comment : ‘Nov Future premium decreased from 53 points
to 51.Reacts lower from the Neckline levels,
testing last Wed’s gap-up area. Reverse if holds
7975-85 or 8000-10
Action :
Sell in the range of 8030-8035
Targets :
8000/7980/Lower
Stop-loss :
8050.00
Source: ASA, ICICIdirect.com Research
ICICI Securities Ltd. | Retail Equity Research
Page 2
Trend Scanner
Global Currencies
Spot
Positive Trends
Close
Prev.close
% Chg
Rupee (|)
61.280
61.281
-0.04
Scrip Name
Dollar Index
85.543
85.495
0.05
Bajaj Finserv Ltd
Euro
1.271
1.270
0.10
British Pound
1.613
1.612
Japanese Yen
107.860
Australian ($)
0.882
Swiss Franc
0.949
Candlestick Patterns
Close
% Change
10-day SMA
Delivery (%)
1067.60
3.12
1048.63
54.53
Mahindra & Mahindra Financial Services L
289.50
3.01
281.52
54.86
0.06
BEML Ltd
682.35
5.28
604.28
19.29
107.820
-0.06
Voltas Ltd
245.30
1.66
234.23
34.13
0.880
0.20
0.950
0.08
Global Treasury Yields
Closing Yield (%)
Previous Yield (%)
8.32
8.32
US 10 Year
2.26
2.26
EURO 10 Year
0.87
0.89
GBP 10 Year
2.21
2.23
JPY 10 Year
0.47
0.47
Commodities
Close
Prev. Close
%Chg
1230.38
1226.62
0.25
Copper /ton
6797
6762
0.55
Brent Crude/barrel
85.25
85.83
-0.68
Scrip Name
Close
Reliance Communications Ltd
% Change
99.50
Tata Steel Ltd
Just Dial
Cash Segment (| Cr)
27-Oct-14
FII
49.1
DII
9.6
23-Oct-14
-12.4
10.9
22-Oct-14
7.5
375.6
21-Oct-14
32.4
68.9
20-Oct-14
1,040.1
-166.1
Scrip Name
TBZ
Close
169.0
-3.59
10-day SMA
101.03
Delivery (%)
31.24
450.50
-1.87
452.11
42.22
1452.15
-10.48
1627.37
48.15
Scrip Name
Close
Punj Lloyd
35.9
Praj Industries
62.4
Bearish Continuation pattern
221.0
Cairn India
276.7
BHEL
253.2
DLF
110.0
M&M Finance
290.0
Hindustan Unilever
716.0
178.5
Yes Bank
644.5
Crompton Greaves
Union Bank
228.8
HDIL
74.4
Evening Star
Adani Ports
263.3
Jindal Steel & Power
152.0
Note: For Candlestick pattern description refer towards the end of
the report.
Overbought Stocks
Oversold Stocks
Stocks hitting 52 week high
Stocks rising for 5 days & stochastic overbought
Stocks falling for 5 days & stochastic oversold
Scrip Name
Scrip Name
Scrip Name
Ashok Leyland
IDFC
Petronet LNG
Institutional Activity
Bearish Engulfing
Ambuja Cement
US Dollar
Gold/ounce
Bearish Candlestick Formations
Bullish Engulfing
Bullish Continuation pattern
Negative Trends
India 10 year
Bullish Candlestick Formations
ICICI Securities Ltd. | Retail Equity Research
LTP
Stochastic
144.5
83.08
195
81.4
IOC
LTP
Stochastic
352.5
11.65
Divi's Laboratories
LTP
45.8
1809.85
ENIL
485.05
GAIL
487.35
Symphony
1771
Yes Bank
642.9
Page 3
Stock recommendations for the day
Exhibit 3: Union Bank of India (UNIBAN)
Daily Candlestick Chart
Price breakout of the major short term range in the daily chart
signalling continuation of positive trend in the short term
Union Bank of India (UNIBAN) October Future
CMP
227.95
Comment : Price breakout above major short term range and
MACD giving buy signal moving above trigger
line in the daily chart
Action :
Buy above 227.50
Targets :
231/233/Higher
Stop-loss :
225.20
MACD giving buy signal in the daily chart moving above
trigger line thus supports positive trend in price
Source: Bloomberg, ICICIdirect.com Research
ICICI Securities Ltd. | Retail Equity Research
Page 4
Exhibit 4: Hindustan Zinc (HINZIN)
Daily Candlestick Chart
Price trading in a rising channel and sustaining above the 13 days
EMA suggesting continuation of positive trend in short term
Hindustan Zinc (HINZIN) October Future
CMP
168.45
Comment : Price taking support at the lower band of the
rising channel and sustaining above 13 days
EMA and RSI giving buy signal in the daily chart
Action :
Buy in the range of 167.50-168.00
Targets :
170.75/172.25/Higher
Stop-loss :
166.10
13 days EMA
RSI giving buy signal forming higher high in the daily chart
Source: Bloomberg, ICICIdirect.com Research
ICICI Securities Ltd. | Retail Equity Research
Page 5
Exhibit 5: Century Textiles (CENTEX)
Daily Candlestick Chart
21 days EMA
Century Textiles (CENTEX) October Future
CMP
523.60
Comment : Price taking resistance near the 21 days EMA
and 38.2% retracement of the previous up move
and stochastic giving sell signal in the dialy chart
Action :
Sell below 523.00
Targets :
514/510/Lower
Stop-loss :
527.50
Price taking resistance at the 38.2% retracement of the immediate previous
decline and 21 days EMA signalling bearish bias to continue in the coming
sessions
Stochastic giving sell signal in the daily
chart
Source: Bloomberg , ICICIdirect.com Research
ICICI Securities Ltd. | Retail Equity Research
Page 6
Exhibit 6: Reliance Communication (RELCOM)
Daily Candlestick Chart
Price taking resistance from 21 days EMA and rising support line joining
immediate lows breached in the daily chart suggesting continuation of
negative trend in the coming sessions
Reliance Communication (RELCOM) October Future
CMP
99.55
Comment : Price taking resistance from the 21 days EMA
and has given a trendline breakdown in the daily
chart and RSI giving sell signal in the daily chart
Action :
Sell in the range of 101.00-101.50
Targets :
99.25/98.20/Lower
Stop-loss :
102.35
Bearish crossover of the 14 periods RSI in the daily chart
Source: Bloomberg , ICICIdirect.com Research
ICICI Securities Ltd. | Retail Equity Research
Page 7
Previous Day’s Performance
Scrip
Nifty
Divis Laboratories
Tata Chemical
Tata global
Product
Future
Future
Future
Future
Strategy
Buy
Buy
Buy
Buy
Recommended Price
In range of 7995-8000
In range of 1815-1817
above 410.50
In range of 157.75-158.30
Targets
8030/8050/+
1841/1855/+
418/422/+
161/162.5/+
SL
7980.00
1802.00
406.50
156.50
Gain/Loss %*
-0.95
-1.00
Comment
No Trade
No Trade (Opened at Target)
Stoploss triggered
Stoploss triggered
* Return Opportunity
Nifty Points gained for the day: 0 points
Gains over last 131 days: 460 points
Stock profits: Avg -1.00% per trade
(Cum. Profits over last 131 days:154.25%)
Strike Rate for the day: 0/2
(Cum strike rate over 131 days: 164/291
NOTE: The follow-up and performance review table of the strategies indicates the profit opportunity that was available in the strategies. Individual profits may vary,
depending upon the entry and exit price and stop losses
ICICI Securities Ltd. | Retail Equity Research
Page 8
Support and Resistance Table (Cash Levels)
SCRIP
CLOSE
S1
S2
S3
R1
R2
R3
TREND
SENSEX
26752.9
26654.85
26619.1
26583.35
26788.9
26855.95
26922.95
-ve
NIFTY
7991.70
7963.45
7954.45
7945.50
8002.80
8022.50
8042.20
-ve
ACC
1460.10
1450.40
1447.65
1444.90
1463.95
1470.70
1477.45
-ve
463.75
457.85
456.65
455.45
465.55
469.45
473.30
-ve
-ve
ADANI ENTER.
ADANI POWER
ADITYA BIRLA
ALLAHABAD BANK
ANDHRA BANK
45.40
44.90
44.70
44.55
45.60
45.95
46.30
1667.85
1642.75
1635.80
1628.90
1671.50
1685.85
1700.25
107.40
106.75
105.95
105.65
108.35
109.15
109.45
-ve
Neutral
77.10
77.00
76.20
75.35
78.65
78.95
79.20
+ve
1089.15
1088.75
1080.10
1071.45
1106.05
1109.20
1112.40
+ve
APOLLO TYRES
215.75
212.25
211.50
210.80
216.20
218.15
220.15
-ve
ARVIND
295.50
291.50
290.85
290.20
296.75
299.40
302.00
-ve
APOLLO HOSPITALS
ASHOK LEYLAND
45.75
45.80
45.55
45.35
46.30
46.65
47.00
ASIAN PAINTS
648.75
644.35
641.50
638.60
650.15
653.05
655.95
-ve
AUROBINDO PHARMA
942.90
929.75
926.25
922.80
946.65
955.10
963.55
-ve
2517.45
2498.05
2485.30
2472.55
2519.50
2530.20
2540.90
905.65
903.40
896.00
888.60
918.20
919.80
921.40
+ve
+ve
BAJAJ AUTO
BOB
BOI
+ve
-ve
271.45
270.60
268.25
265.90
275.25
276.35
277.40
1236.75
1223.70
1219.15
1214.60
1240.95
1249.55
1258.20
-ve
BHARAT FORGE
766.90
759.40
756.15
752.90
769.25
774.20
779.10
-ve
BPCL
686.15
677.80
676.75
675.70
686.45
690.80
695.15
-ve
+ve
BATA INDIA
BHARTI AIRTEL
414.55
414.35
412.90
411.45
417.25
418.50
419.80
BIOCON
469.85
464.95
463.60
462.25
471.65
475.05
478.40
-ve
CAIRNS INDIA
277.35
272.35
271.50
270.65
279.25
282.70
286.15
-ve
CANARA BANK
388.40
388.80
386.35
383.90
393.70
394.65
395.60
+ve
CENTURY TEXT.
523.70
517.25
516.05
514.85
526.05
530.45
534.85
-ve
CESC
671.70
659.05
656.15
653.25
673.85
681.25
688.65
61.35
61.60
60.85
60.10
63.15
63.45
63.80
CIPLA
628.10
621.75
619.45
617.10
627.25
630.00
632.75
-ve
COAL INDIA
356.50
355.50
352.65
349.75
361.25
362.65
364.05
+ve
CHAMBAL FERT.
COLGATE PALM.
-ve
+ve
1722.70
1718.05
1711.80
1709.25
1730.55
1736.75
1739.35
CROMPTON GREAVES
178.55
174.05
173.50
172.95
180.25
183.35
186.45
-ve
DABUR INDIA
209.40
197.45
196.95
196.40
208.95
214.70
220.40
-ve
56.60
56.15
55.80
55.60
56.85
57.15
57.35
DISH TV
ICICI Securities Ltd. | Retail Equity Research
Neutral
Neutral
Page 9
SCRIP
DIVI'S LAB.
CLOSE
S1
S2
S3
R1
R2
R3
TREND
1803.35
1777.90
1769.15
1760.40
1806.20
1820.30
1834.45
110.50
107.65
106.10
104.50
111.15
112.90
114.65
3105.80
3114.75
3085.95
3057.20
3172.30
3183.00
3193.70
EXIDE IND.
156.40
153.85
152.60
151.35
157.35
159.10
160.80
-ve
FEDERAL BANK
138.35
136.05
135.85
135.65
138.90
140.30
141.70
-ve
DLF
DR.REDDY'S LAB.
-ve
-ve
+ve
FUTURE RETAIL
111.50
109.65
109.20
108.70
111.80
112.90
113.95
-ve
GAIL
486.55
486.90
483.25
479.65
494.15
495.15
496.20
+ve
5279.00
5198.45
5180.50
5162.55
5286.10
5329.95
5373.80
715.60
716.80
713.30
709.85
723.75
726.85
730.00
GLAXO SMITH.C.H.
GLENMARK PHARMA.
GMR INFRA.
GODREJ CONSUMER
GODREJ IND.
GRASIM
AMBUJA CEMENT
HAVELL'S INDIA
HCL TECH
HDFC BANK
20.50
20.00
19.95
19.85
20.65
20.95
21.25
-ve
914.25
898.65
895.55
892.45
918.45
928.35
938.25
-ve
-ve
289.70
286.30
285.25
284.20
290.65
292.85
295.00
3395.65
3373.95
3362.80
3351.70
3399.30
3412.00
3424.70
221.35
220.70
219.45
218.15
223.25
223.65
224.05
+ve
-ve
-ve
269.70
266.15
264.70
263.25
270.15
272.15
274.15
1496.75
1476.50
1471.05
1465.60
1502.00
1514.75
1527.50
897.25
898.40
895.10
891.85
905.00
906.45
907.90
+ve
+ve
HDFC
1036.75
1041.00
1032.55
1024.10
1057.90
1060.20
1062.45
HERO MOTO
3082.95
3054.35
3042.35
3030.35
3087.30
3103.80
3120.30
189.50
188.65
186.75
184.85
192.45
192.95
193.45
HEXAWARE TECH.
-ve
+ve
-ve
-ve
+ve
HINDALCO
147.35
145.45
145.05
144.70
147.90
149.15
150.40
-ve
HIND. UNILEVER
720.45
701.95
699.60
697.25
727.20
739.85
752.50
-ve
HPCL
515.85
508.70
507.25
505.75
517.50
521.90
526.30
-ve
HINDUSTAN ZINC
168.30
167.70
166.55
165.35
170.10
170.60
171.15
+ve
HDIL
ICICI BANK
IDBI
74.30
72.90
72.65
72.40
74.70
75.55
76.45
-ve
1573.05
1564.50
1561.20
1557.85
1574.65
1579.75
1584.80
-ve
68.35
68.20
67.80
67.40
69.05
69.25
69.45
IDEA CELLULAR
156.85
154.90
154.60
154.25
157.50
158.75
160.05
-ve
NSE INFRA DEV FINANC
144.20
142.85
142.60
142.35
144.70
145.65
146.60
-ve
IFCI
+ve
35.60
35.55
35.35
35.10
36.05
36.10
36.20
+ve
3203.20
3200.50
3189.30
3178.10
3222.90
3234.10
3245.35
+ve
INDUSIND BANK
696.80
697.95
693.80
689.65
706.25
710.70
715.15
+ve
INDIA CEMENTS
107.30
104.75
104.45
104.10
108.30
110.10
111.85
-ve
INDRAPRASTHA GAS
402.05
396.00
394.40
392.75
403.65
407.50
411.30
-ve
ORACLE FIN.
ICICI Securities Ltd. | Retail Equity Research
Page 10
SCRIP
CLOSE
S1
S2
S3
R1
R2
R3
TREND
IOC
353.10
347.85
347.10
346.30
354.95
358.50
362.05
IOB
61.00
60.40
59.90
59.70
61.40
61.95
62.15
Neutral
IB REAL ESTATE
63.95
62.70
62.45
62.20
64.35
65.20
66.00
-ve
INFOSYS
-ve
3803.05
3790.45
3773.50
3769.15
3824.35
3841.30
3845.65
IRB INFRA.
242.95
239.60
238.90
238.20
243.30
245.20
247.05
Neutral
-ve
ITC
349.55
347.90
347.35
346.75
349.60
350.45
351.30
-ve
JAIPRAKASH ASS.
29.20
28.30
28.15
28.05
29.25
29.70
30.20
-ve
J.P.POWER VENT.
12.40
12.25
12.15
12.10
12.45
12.55
12.70
-ve
+ve
JAIN IRRIGATION
84.85
84.95
84.30
83.65
86.25
86.70
87.15
JINDAL ST&POW
152.55
149.45
145.95
142.50
153.65
155.75
157.90
-ve
74.40
73.65
73.20
72.75
74.65
75.15
75.65
-ve
JSW ENERGY
NSE JSW STEEL
1233.40
1232.00
1218.65
1205.35
1258.70
1260.95
1263.25
+ve
JUBILANT FOOD
1315.40
1305.90
1300.00
1294.15
1317.45
1323.20
1329.00
-ve
KARNATAKA BANK
118.30
117.40
117.00
116.65
118.60
119.20
119.85
KOTAK MAH.BANK
1085.00
1082.80
1076.10
1069.45
1096.15
1100.30
1104.45
+ve
L&T
1567.35
1568.50
1563.55
1558.55
1578.50
1582.10
1585.75
+ve
334.20
328.40
327.25
326.15
336.30
340.25
344.20
NSE LUPIN
1393.25
1387.35
1382.90
1379.70
1396.30
1400.80
1404.00
M&M
1256.80
1240.10
1235.85
1231.60
1256.65
1264.90
1273.20
-ve
MARUTI SUZUKI
3169.70
3141.25
3120.15
3110.50
3183.50
3204.65
3214.25
Neutral
UNITED SPIRITS
2662.20
2645.55
2609.45
2573.35
2717.70
2725.45
2733.15
+ve
251.90
251.50
250.25
248.95
254.05
254.90
255.75
+ve
+ve
LIC HOUSING
MCLEOD RUSSEL
M&M FIN.SERV.
-ve
-ve
Neutral
289.50
287.70
282.65
277.55
297.85
299.10
300.30
30742.50
30568.35
30508.30
30448.25
30763.35
30860.85
30958.35
263.85
260.70
260.10
259.50
264.80
266.90
268.95
-ve
19.95
19.75
19.65
19.60
20.00
20.15
20.30
-ve
NMDC
163.60
163.15
162.25
161.40
164.90
165.30
165.75
+ve
NSE NTPC
145.85
144.45
144.10
143.70
146.15
147.00
147.85
-ve
ONGC
394.65
390.15
388.80
387.45
396.35
399.45
402.55
-ve
OBC
265.40
265.50
263.30
261.05
269.95
270.60
271.25
+ve
MRF
ADANI PORTS SEZ
NSE NHPC
-ve
PETRONET LNG
194.60
192.75
192.00
191.25
195.05
196.20
197.35
-ve
POWER FINANCE
276.95
277.00
274.95
272.95
281.05
281.70
282.35
+ve
POWER GRID
142.05
142.30
141.00
139.65
144.90
145.25
145.55
+ve
85.90
85.25
84.95
84.65
86.05
86.45
86.85
POWER TRADING
ICICI Securities Ltd. | Retail Equity Research
-ve
Page 11
SCRIP
CLOSE
S1
S2
S3
R1
R2
R3
TREND
PNB
932.55
923.35
921.90
920.50
933.60
938.70
943.85
-ve
RANBAXY
598.60
594.60
591.75
590.40
600.35
603.20
604.55
Neutral
99.50
97.75
97.55
97.35
100.20
101.40
102.65
-ve
REL. CAPITAL
458.45
451.35
450.35
449.35
459.45
463.50
467.55
-ve
RELIANCE INFRA.
568.50
562.00
560.80
559.55
570.00
574.00
578.00
-ve
RELIANCE
941.35
930.80
928.55
926.35
944.35
951.15
957.95
-ve
71.75
70.95
70.80
70.60
72.00
72.50
73.00
-ve
286.00
286.75
284.90
283.05
290.45
291.45
292.45
82.25
81.50
81.10
80.70
82.35
82.80
83.20
SESA GOA
249.05
249.60
247.80
246.05
253.10
254.40
255.70
SHRIRAM TRANS.
897.55
881.95
877.80
873.65
903.30
914.00
924.70
-ve
SIEMENS
859.15
854.70
850.45
847.35
863.25
867.55
870.60
Neutral
RCOM
RELIANCE POWER
REC
SAIL
SBI
+ve
-ve
+ve
2597.80
2598.70
2588.95
2579.25
2618.15
2623.65
2629.20
SUN PHARMA
805.20
792.70
791.15
789.60
803.85
809.45
815.05
-ve
SUN TV
314.70
314.50
311.80
309.05
319.90
321.15
322.35
+ve
SYNDICATE BANK
117.05
115.55
115.10
114.60
117.00
117.75
118.45
-ve
TATA CHEMICALS
404.00
399.45
397.95
396.45
405.50
408.55
411.60
-ve
-ve
TATA MOTOR DVR
318.20
314.80
313.70
312.60
319.15
321.35
323.55
TATA MOTORS
503.70
497.95
496.85
495.70
505.85
509.80
513.70
88.45
87.90
87.40
87.10
88.90
89.35
89.70
TATA POWER
TATA GLOBAL BEV.
+ve
-ve
Neutral
156.30
155.10
154.45
153.85
156.75
157.55
158.40
TCS
2457.15
2428.15
2424.15
2420.10
2465.55
2484.25
2502.90
-ve
-ve
TECH MAHINDRA
2326.40
2307.85
2300.25
2292.70
2332.65
2345.05
2357.50
-ve
TATA STEEL
450.50
445.75
444.80
443.80
452.15
455.35
458.50
-ve
TITAN IND.
400.80
399.50
396.70
393.95
405.05
406.85
408.65
+ve
+ve
UCO BANK
82.45
82.25
81.50
80.80
83.75
84.10
84.50
2430.60
2405.60
2395.90
2386.20
2430.45
2442.85
2455.30
UBI
228.00
226.85
224.60
222.40
231.30
231.90
232.55
+ve
UNITED BREW.
698.00
687.85
680.45
673.05
697.35
702.10
706.85
-ve
UNITED PHOSPH.
335.95
331.90
331.20
330.50
336.95
339.50
342.00
-ve
17.15
16.80
16.75
16.70
17.25
17.50
17.70
AXIS BANK
426.80
423.95
421.80
420.80
428.25
430.40
431.40
TATA COMM.
382.50
377.75
376.65
375.55
382.30
384.60
386.85
-ve
VOLTAS
245.30
244.70
241.75
238.75
250.60
251.40
252.20
+ve
ULTRATECH CEMENT
UNITECH
ICICI Securities Ltd. | Retail Equity Research
-ve
-ve
Neutral
Page 12
SCRIP
CLOSE
S1
S2
S3
R1
R2
R3
TREND
WIPRO
554.80
548.45
540.70
532.90
554.15
557.00
559.80
-ve
NSE YES BANK
643.95
640.10
633.40
626.70
653.50
655.10
656.75
+ve
ZEE
330.35
321.80
320.60
319.45
330.75
335.20
339.70
-ve
NOTES:
•
•
•
•
•
•
•
Please execute the recommendation within the levels provided in the report
Once the recommendation is executed, it is advisable to keep strict stop loss as provided in the report
Avoid entering into the recommendation in the first 5 minutes of trade
If the recommendation opens near the target levels due to gap up/gap down opening, then the
recommendation is considered not initiated
The recommendations are valid only for the day and should be squared off by the end of the day
Only stocks in derivatives segment have been considered for daily trading
Medium to long-term prospects of a stock does not have any bearing on the daily view
Trading Portfolio allocation
•
•
•
•
It is recommended to spread out the trading corpus in a proportionate manner between the various technical
research products.
Please avoid allocating the entire trading corpus to a single stock or a single product segment
Within each product segment it is advisable to allocate equal amount to each recommendation.
For example: The ‘Daily Calls’ product carries 3 to 4 intraday recommendations. It is advisable to allocate
equal amount to each recommendation
ICICI Securities Ltd. | Retail Equity Research
Page 13
Recommended Trading Portfolio allocation
Products
Allocations
Product wise
Max allocation
allocation
in 1 stock
Return Objective
Number of Calls
Frontline Stocks
Mid-cap stocks
Duration
Daily Calls
8%
2-3%
3-4 Stocks
0.50-1%
2-3%
Intraday
Short term Delivery
6%
3-5%
7-10 p.m
4-5%
7-10%
Opportunity based
Weekly Calls
8%
3-5%
1-2 Stocks
5-7%
7-10%
1 Week
Weekly Technical
8%
3-5%
1-2 Stocks
5-7%
7-10%
1 Week
Monthly Call
15%
5%
2-3 Stocks
7-10%
10-15%
1 Month
Monthly Technical
15%
2-4%
5-8 Stocks
7-10%
10-15%
1 Month
Techno Funda
15%
5-10%
1-2 Stocks
10% and above
15% and above
6 Months
Technical Breakout
15%
5-10%
1-2 Stocks
10% and above
15% and above
3-6 Months
Cash in Hand
10%
-
-
-
-
-
100%
ICICI Securities Ltd. | Retail Equity Research
Page 14
Candlesticks Glossary:
Candlestick patterns describe the market sentiment for the specified period. Some of the formations suggest reversal of
sentiment (trend) and, therefore, are important for a chart reader. By themselves, the patterns do not carry any price target but
only an indication of change in market behaviour. More importance needs to be given to the placement of the pattern within
larger trend
Bullish Engulfing Line: A potential bottom reversal pattern. This pattern typically appears at the culmination of a decline or
downtrend. The market falls, and a black candle forms (ideally a small black candle). Next, a white real body wraps around the
prior session’s black body. Low of the pattern becomes short term support for prices
Piercing Line: Potential bottom reversal pattern. A black body forms in the downtrend. The market continues moving south on
the next session’s open but that session culminates in a white real body that closes (e.g. pierces) than half way or more into the
prior black body. Lowest low between two candles is referred to as technical support for prices
Hammer: A candlestick line which, during a downtrend, has a very long lower shadow and small real body (black or white) at
the top end of the session’s range. There should be no, or a very small, upper shadow. Pattern suggests buying support during
declines and needs confirmation in terms of sustainability of prices above head of the Hammer in following session
Bearish Engulfing Line: Potential top reversal signal. This two candlestick pattern emerges during a rally. A black candle real
body wraps around a white real body (classically a small white candle) Highest high between two candles becomes resistance
level for prices for future reference
Dark Cloud cover: A dark cloud cover forms a top reversal pattern. The first session should be a strong, white real body. The
second session’s price opens over the prior session’s high (or above the prior session’s close). By the end of the second session,
it closes near the low of the session and should fall well into the prior session’s white body. Pattern suggests that market has a
poor chance of rising immediately
Shooting Star: A single candlestick line during a rally in which there is a small real body (white or black) at the bottom end of
the session's range and a very long upper shadow. The candle line should also have little or no lower shadow. Pattern suggest
the trouble for prices overhead
ICICI Securities Ltd. | Retail Equity Research
Page 15
Pankaj Pandey
Head – Research
[email protected]
ICICIdirect.com Research Desk,
ICICI Securities Limited,
1st Floor, Akruti Trade Centre,
Road No 7, MIDC
Andheri (East)
Mumbai – 400 093
[email protected]
Disclaimer
The report and information contained herein is strictly confidential and meant solely for the selected recipient and may not be altered in any way, transmitted to, copied or distributed, in part or in whole, to any other
person or to the media or reproduced in any form, without prior written consent of ICICI Securities Ltd (I-Sec). The author may be holding a small number of shares/position in the above-referred companies as on
date of release of this report. I-Sec may be holding a small number of shares/position in the above-referred companies as on date of release of this report. This report is based on information obtained from public
sources and sources believed to be reliable, but no independent verification has been made nor is its accuracy or completeness guaranteed. This report and information herein is solely for informational purpose and
may not be used or considered as an offer document or solicitation of offer to buy or sell or subscribe for securities or other financial instruments. Nothing in this report constitutes investment, legal, accounting and
tax advice or a representation that any investment or strategy is suitable or appropriate to your specific circumstances. The securities discussed and opinions expressed in this report may not be suitable for all
investors, who must make their own investment decisions, based on their own investment objectives, financial positions and needs of specific recipient. This report may not be taken in substitution for the exercise of
independent judgment by any recipient. The recipient should independently evaluate the investment risks. I-Sec and affiliates accept no liabilities for any loss or damage of any kind arising out of the use of this
report. Past performance is not necessarily a guide to future performance. Actual results may differ materially from those set forth in projections. I-Sec may have issued other reports that are inconsistent with and
reach different conclusion from the information presented in this report. This report is not directed or intended for distribution to, or use by, any person or entity who is a citizen or resident of or located in any
locality, state, country or other jurisdiction, where such distribution, publication, availability or use would be contrary to law, regulation or which would subject I-Sec and affiliates to any registration or licensing
requirement within such jurisdiction. The securities described herein may or may not be eligible for sale in all jurisdictions or to certain category of investors. Persons in whose possession this document may come
are required to inform themselves of and to observe such restriction.
ICICI Securities Ltd. | Retail Equity Research
Page 16


© Copyright 2026