
Daily Calls - ICICI Direct
Daily Calls
August 28, 2014
Market Outlook
Domestic Indices
Indices
Close
S&P BSE Sensex
CNX Nifty
Nifty future
S&PBSE 500
S&PBSE Midcap
Change
Change%
26560.15
117.34
0.44
7936.05
31.30
0.40
7931.60
25.10
0.32
10086.44
42.13
0.42
9326.59
67.77
0.73
10253.87
80.49
0.79
Indices
Close
17122.01
Dow Jones
Nasdaq
4569.62
6830.66
FTSE
DAX
9569.71
Hang Seng
24995.62
Nikkei
15462.41
7950.00
SGX Nifty
* Asian Market at 7:30 am.IST
Change
15.31
-1.02
7.90
-18.44
62.39
-73.63
13.00
Change%
0.09
-0.02
0.12
-0.19
0.25
-0.47
0.16
S&PBSE Smallcap
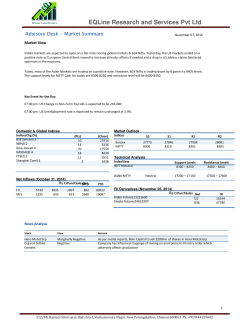
Sensex: We said, "Positive if follow-up support sustains above candle's head..." The index opened gap-up above the candle, and
trading volatile in a sideways range through the day, finished 117 points or 0.4% higher. While the Realty Index lost 1.3% mainly
due to DLF, other sectors ended flat to positive. The A/D ratio also turned marginally positive.
The action formed a Doji candle after the previous day's Counter Attack Bull. With open and close at similar levels, the Doji
suggested caution at higher levels. On the expiry day today, strength above it could see an attempt at the higher end of the
seven-day range. However, failure to sustain above the Doji's head can open up negative trading options.
Exhibit 1: Sensex – Daily Candlestick Chart
Global Indices
Market Breadth
70
122
Unchg
NSE
BSE
694
1379
Decline
852
Advance
0
500
1606
1000
1500
2000
Recommendations for the day
1. Buy Nifty August Future in range of 7920-7925
2. Buy Federal Bank in range of 120.50-121.00
3. Buy BPCL in range of 676.00-678.00
*All recommendations are of August Future
Source: ASA, ICICIdirect.com Research
ICICI Securities Ltd. | Retail Equity Research
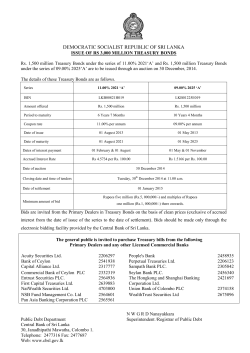
Exhibit 2: Nifty Future – Daily Candlestick Chart
CNX Nifty (Cash Levels) Technical Picture
Nifty
Trend
Trend Reversal
Intraday
Up
Short Term
Up
7910
7600
Support
7910-7880
7600
Resistance
7970-7995
8100
20 Days EMA
7808
200 days EMA
6976
Nifty Future Recommendations
CMP :
7931.60('Aug)
Comment : ‘Sep Future premium decreased from 39 points
to 37. Doji candle suggested cautiousness at
higher levels. Reverse if fails to reach or sustain
above 7950-60 or 7970-80
Action :
Buy in the range of 7920-7925
Targets :
7955/7975/Higher
Stop-loss :
7905.00
Source: ASA, ICICIdirect.com Research
ICICI Securities Ltd. | Retail Equity Research
Page 2
Trend Scanner
Global Currencies
Spot
Positive Trends
Close
Prev.close
% Chg
Rupee (|)
60.451
60.435
-0.03
Scrip Name
Dollar Index
82.367
82.428
-0.07
Euro
1.321
1.319
British Pound
1.659
Japanese Yen
Australian ($)
Swiss Franc
Candlestick Patterns
Close
% Change
10-day SMA
Delivery (%)
AIA Engineering Ltd
839.60
2.82
827.73
70.45
0.11
Asian Paints Ltd
617.45
1.55
613.49
62.25
1.658
0.10
Oil India Ltd
606.00
2.76
594.99
92.53
103.800
103.880
0.09
Federal Bank Ltd
0.936
0.934
0.22
HCL Technologies Ltd
0.914
0.915
0.12
Global Treasury Yields
122.15
3.82
118.72
43.83
1649.90
3.02
1571.80
55.53
Closing Yield (%)
Previous Yield (%)
Stocks rising for 5 days & stochastic overbought
Stocks falling for 5 days & stochastic oversold
8.55
8.56
Scrip Name
Scrip Name
US 10 Year
2.35
2.36
Cipla
EURO 10 Year
0.91
0.94
Kotak Bank
GBP 10 Year
2.37
2.45
Lupin
1287.6
87.82
JPY 10 Year
0.49
0.50
US Dollar
Close
Prev. Close
%Chg
1285.82
1282.63
0.25
Copper
19.503
19.4631
0.20
Brent Crude
102.58
102.72
-0.14
Bearish Engulfing
Scrip Name
LTP
Stochastic
514
91.4
GSFC
1044.4
86.9
ZEE Entertainment
LTP
Stochastic
67
12.66
277.7
15.8
122.4
Oil India
606.0
Bullish Continuation pattern
Cash Segment (| Cr)
27-Aug-14
FII
290.2
DII
237.0
26-Aug-14
364.7
-259.2
25-Aug-14
127.3
45.7
22-Aug-14
302.1
-183.6
21-Aug-14
412.8
63.7
ICICI Securities Ltd. | Retail Equity Research
Scrip Name
Close
IDBI
77.6
Bearish Continuation pattern
682.0
1649.0
Indusind Bank
579.6
Idea
157.4
DLF
183.0
Allahabad Bank
114.2
Bullish Engulfing
Wipro
559.1
Note: For Candlestick pattern description refer towards the end of
the report.
Stocks hitting 52 week high
Scrip Name
LTP
Dr Reddy's
2921.1
EIHotel
104.25
HCL tech
Institutional Activity
Close
Federal Bank
HCL Technology
Oversold Stocks
India 10 year
Gold
Bearish Candlestick Formations
Morning Star
BPCL
Overbought Stocks
Commodities
Bullish Candlestick Formations
1650
SKF India
1193
Tata Motors
521.5
Tomas Cook
151.25
Page 3
Stock recommendations for the day
Exhibit 3: Federal Bank (FEDBAN)
Bullish morning star candlestick pattern at the 61.8% retracement of the
previous up move in daily chart signalling reversal of trend after recent
corrective price action
Federal Bank (FEDBAN) August Future
CMP
Daily Candlestick Chart
122.00
Comment : Bullish morning star candlestick pattern at the
61.8% retracement of the previous up move and
RSI giving buy signal in the daily chart
Action :
Buy in the range of 120.50-121.00
Targets :
123.50/125/Higher
Stop-loss :
119.40
The 14 periods RSI giving buy signal taking support at its nine
periods average in the daily chart
Source: Bloomberg, ICICIdirect.com Research
ICICI Securities Ltd. | Retail Equity Research
Page 4
Exhibit 4: BPCL (BHAPET )
Daily Candlestick Chart
Price in uptrend forming rising peak and rising trough in
the daily chart and taking support at the lower band of the
rising channel and 13 days EMA in the daily chart
BPCL (BHAPET) August Future
CMP
677.65
Comment : Price trading in a rising channel and has bounced
back taking support near the 13 days EMA and
the lower band of the channel and MACD in
rising trend
Action :
Buy in the range of 676-678.00
Targets :
688/694/Higher
Stop-loss :
671.00
13 days EMA
MACD in rising trend forming higher high in the daily chart thus
supports the uptrend in price
Source: Bloomberg, ICICIdirect.com Research
ICICI Securities Ltd. | Retail Equity Research
Page 5
Previous Day’s Performance
Scrip
Nifty
ITC
Glenmark Pharma
Dish TV
Product
Future
Future
Future
Future
Strategy
Buy
Buy
Buy
Sell
Recommended Price
Targets
In range of 7890-7895
In range of 352-353.00
In range of 724.50-726.00
In range of 54.20-54.60
7925/7945/+
357.5/360/+
736/741/+
53.20/52.60/-
SL
7878.00
349.70
719.80
55.10
Gain/Loss %*
-0.75
0.40
Comment
No Trade
Closed at cost
Stoploss triggered
Closed at 54.20
* Return Opportunity
Nifty Points gained for the day: 0 points
Stock profits: Avg -0.15% per trade
Strike Rate for the day: 1/2
Gains over last 97 days: 375 points
(Cum. Profits over last 97 days:115.30%)
(Cum strike rate over 97 days: 123/224
NOTE: The follow-up and performance review table of the strategies indicates the profit opportunity that was available in the strategies. Individual profits may
vary, depending upon the entry and exit price and stop losses
ICICI Securities Ltd. | Retail Equity Research
Page 6
Support and Resistance Table (Cash Levels)
SCRIP
SENSEX
CLOSE
S1
S2
S3
R1
R2
R3
TREND
26560.15
26555.35
26528.7
26502.05
26608.7
26662.85
26717.05
+ve
NIFTY
7936.05
7934.60
7927.00
7919.45
7949.75
7965.95
7982.15
+ve
ACC
+ve
1502.75
1500.35
1493.15
1485.95
1514.70
1529.35
1543.95
ADANI ENTER.
482.40
474.40
470.10
465.80
483.35
487.80
492.30
-ve
ADANI POWER
48.70
48.20
47.10
46.05
48.80
49.10
49.45
-ve
1451.80
1435.05
1415.70
1396.35
1453.50
1462.70
1471.90
-ve
114.40
112.85
111.20
109.55
114.75
115.70
116.60
75.15
74.80
74.15
73.50
76.15
76.70
77.30
ADITYA BIRLA
ALLAHABAD BANK
ANDHRA BANK
APOLLO HOSPITALS
-ve
+ve
1189.60
1173.05
1159.70
1146.35
1194.10
1204.60
1215.10
APOLLO TYRES
166.95
166.20
165.45
163.85
167.70
168.45
170.10
Neutral
ARVIND
278.45
276.40
274.50
272.55
280.15
282.00
283.95
Neutral
36.70
36.65
36.50
36.30
37.00
37.45
37.85
+ve
ASIAN PAINTS
617.45
615.95
612.70
609.45
622.50
624.65
626.80
+ve
AUROBINDO PHARMA
824.70
814.80
809.55
804.25
824.80
829.80
834.75
2280.30
2280.95
2269.80
2258.65
2303.25
2318.40
2333.55
BOB
887.75
880.80
876.60
872.35
889.55
893.90
898.25
-ve
BOI
281.75
280.45
279.10
277.15
283.10
284.45
286.40
Neutral
Neutral
ASHOK LEYLAND
BAJAJ AUTO
BATA INDIA
-ve
-ve
+ve
1257.40
1254.65
1250.60
1241.20
1262.65
1266.65
1276.10
BHARAT FORGE
797.15
796.40
792.95
789.55
803.25
810.65
818.10
BPCL
677.75
676.40
672.30
668.20
684.65
691.05
697.50
+ve
BHARTI AIRTEL
369.00
367.20
365.15
362.55
371.20
373.20
375.85
Neutral
BIOCON
470.45
466.75
462.65
458.55
471.40
473.70
476.05
-ve
CAIRNS INDIA
323.75
323.35
322.25
321.15
325.55
326.95
328.40
+ve
CANARA BANK
389.35
384.75
380.35
375.95
390.45
393.30
396.15
-ve
CENTURY TEXT.
597.30
591.55
585.20
578.80
598.05
601.30
604.50
-ve
CESC
693.65
690.40
685.55
674.50
700.05
704.85
715.95
Neutral
59.40
58.85
58.35
57.90
59.50
59.85
60.20
513.35
511.10
508.90
505.90
515.45
517.60
520.60
Neutral
CHAMBAL FERT.
CIPLA
COAL INDIA
+ve
-ve
358.55
358.60
356.25
353.90
363.35
366.85
370.35
+ve
1539.25
1536.05
1524.35
1512.65
1559.45
1564.15
1568.90
+ve
CROMPTON GREAVES
195.25
192.90
191.35
189.85
195.80
197.25
198.75
-ve
DABUR INDIA
232.25
231.95
229.90
227.80
236.10
237.60
239.10
+ve
54.45
54.45
54.20
54.00
54.90
55.55
56.20
+ve
COLGATE PALM.
DISH TV
ICICI Securities Ltd. | Retail Equity Research
Page 7
SCRIP
DIVI'S LAB.
CLOSE
S1
S2
S3
R1
R2
R3
TREND
1561.35
1545.15
1532.20
1519.20
1564.35
1573.95
1583.50
182.90
178.15
176.80
175.50
184.45
187.60
190.80
2922.75
2923.35
2913.65
2903.95
2942.75
2962.85
2982.95
+ve
EXIDE IND.
164.30
163.65
162.30
161.00
166.30
167.85
169.40
+ve
FEDERAL BANK
122.15
121.60
120.35
119.15
124.05
124.90
125.75
+ve
FUTURE RETAIL
122.55
122.65
121.60
120.55
124.75
125.45
126.15
+ve
DLF
DR.REDDY'S LAB.
GAIL
GLAXO SMITH.C.H.
GLENMARK PHARMA.
GMR INFRA.
GODREJ CONSUMER
GODREJ IND.
435.70
434.10
430.30
426.50
441.70
444.70
447.70
5242.10
5215.70
5196.25
5141.25
5254.55
5273.95
5328.95
714.50
706.45
700.45
694.45
717.30
722.70
728.15
24.95
24.60
24.35
24.10
25.05
25.30
25.50
966.30
963.85
954.45
945.05
982.70
998.35
1014.00
-ve
-ve
+ve
Neutral
-ve
-ve
+ve
326.90
323.55
320.90
318.30
327.85
330.00
332.15
3389.45
3371.45
3358.95
3326.45
3396.50
3409.05
3441.55
AMBUJA CEMENT
206.95
204.95
203.80
202.65
207.30
208.50
209.65
-ve
HAVELL'S INDIA
294.55
291.90
287.10
282.25
301.55
552.35
803.10
+ve
1649.90
1643.35
1630.65
1617.95
1668.75
1681.85
1694.90
+ve
836.60
831.75
829.15
826.55
837.75
840.75
843.75
HDFC
1069.65
1068.60
1064.05
1059.45
1077.75
1081.70
1085.65
HERO MOTO
GRASIM
HCL TECH
HDFC BANK
-ve
Neutral
-ve
+ve
2600.00
2593.05
2580.55
2568.10
2617.95
2633.55
2649.15
+ve
HEXAWARE TECH.
162.05
161.75
160.40
159.05
164.50
165.65
166.85
+ve
HINDALCO
172.30
171.80
170.55
169.25
174.30
177.80
181.25
+ve
HIND. UNILEVER
734.85
733.70
729.70
725.65
741.80
745.35
748.85
+ve
+ve
HPCL
453.60
453.50
450.90
448.35
458.70
464.60
470.55
HINDUSTAN ZINC
163.90
161.65
160.55
159.50
163.90
165.05
166.20
92.20
91.30
90.25
89.00
93.40
94.45
95.70
1540.30
1538.75
1532.10
1525.40
1552.10
1564.50
1576.90
77.95
76.75
76.15
75.55
78.20
78.95
79.70
IDEA CELLULAR
157.40
156.55
155.00
153.45
159.65
160.70
161.75
NSE INFRA DEV FINANC
141.10
139.55
138.20
136.85
141.55
142.55
143.55
34.25
34.10
33.75
33.50
34.70
35.00
35.30
HDIL
ICICI BANK
IDBI
IFCI
ORACLE FIN.
-ve
Neutral
+ve
-ve
+ve
-ve
Neutral
3632.45
3622.80
3602.55
3582.30
3663.30
3681.30
3699.35
+ve
INDUSIND BANK
577.40
575.25
570.30
565.40
585.10
588.60
592.10
+ve
INDIA CEMENTS
113.85
113.00
111.45
109.85
116.10
117.45
118.75
+ve
INDRAPRASTHA GAS
375.65
374.25
371.50
368.80
379.75
381.90
384.05
+ve
ICICI Securities Ltd. | Retail Equity Research
Page 8
SCRIP
CLOSE
S1
S2
S3
R1
R2
R3
TREND
IOC
355.40
355.25
354.05
352.85
357.60
361.60
365.55
IOB
62.50
61.80
61.35
60.95
62.70
63.15
63.60
-ve
IB REAL ESTATE
69.45
69.65
68.80
68.00
71.30
72.00
72.65
+ve
INFOSYS
+ve
3630.55
3616.65
3604.45
3594.45
3641.10
3653.35
3663.35
IRB INFRA.
254.80
254.05
252.35
250.65
257.50
259.30
261.15
Neutral
+ve
ITC
352.35
351.70
350.85
349.70
353.50
354.40
355.50
Neutral
JAIPRAKASH ASS.
48.50
47.60
46.60
45.55
48.75
49.30
49.85
-ve
J.P.POWER VENT.
14.90
14.80
14.70
14.40
15.00
15.10
15.40
Neutral
JAIN IRRIGATION
90.75
90.15
88.75
87.35
92.95
94.10
95.25
+ve
JINDAL ST&POW
244.20
243.30
241.05
238.80
247.80
253.15
258.50
+ve
77.15
76.20
74.75
73.30
77.30
77.85
78.40
NSE JSW STEEL
1253.80
1254.20
1248.70
1243.20
1265.20
1273.35
1281.45
JUBILANT FOOD
1295.15
1284.60
1272.35
1263.90
1309.15
1321.45
1329.90
Neutral
123.85
123.35
122.65
121.90
124.75
125.45
126.20
Neutral
JSW ENERGY
KARNATAKA BANK
-ve
+ve
KOTAK MAH.BANK
1040.00
1027.10
1022.20
1017.35
1041.75
1049.10
1056.45
-ve
L&T
1503.65
1498.80
1492.65
1483.30
1511.05
1517.20
1526.55
Neutral
LIC HOUSING
302.80
300.30
298.60
296.95
302.95
304.30
305.65
NSE LUPIN
1289.65
1292.15
1286.75
1281.30
1303.00
1311.40
1319.80
+ve
-ve
M&M
1395.90
1392.10
1386.05
1380.10
1404.30
1410.40
1416.30
Neutral
MARUTI SUZUKI
2769.25
2753.80
2741.05
2728.35
2772.75
2782.20
2791.70
-ve
UNITED SPIRITS
2408.50
2408.40
2399.30
2390.25
2426.50
2444.00
2461.50
+ve
MCLEOD RUSSEL
302.80
302.45
300.05
297.65
307.30
310.50
313.75
+ve
M&M FIN.SERV.
279.50
279.90
278.05
276.15
283.65
286.65
289.65
+ve
24255.40
24223.95
24144.45
24064.95
24382.90
24460.90
24538.90
+ve
288.25
280.80
277.90
274.95
290.00
294.60
299.20
20.95
20.85
20.75
20.60
21.10
21.20
21.35
MRF
ADANI PORTS SEZ
NSE NHPC
-ve
Neutral
NMDC
168.80
167.40
166.45
165.50
169.15
170.05
170.95
-ve
NSE NTPC
139.50
137.35
136.65
136.00
139.45
140.50
141.60
-ve
ONGC
428.15
427.65
426.00
424.40
430.90
437.15
443.40
+ve
OBC
269.35
266.90
264.80
260.50
271.10
273.20
277.45
Neutral
Neutral
PETRONET LNG
184.30
182.90
181.80
179.90
185.10
186.20
188.10
POWER FINANCE
251.95
247.60
244.00
240.40
251.85
254.00
256.10
-ve
POWER GRID
129.50
127.50
126.85
126.20
129.70
130.75
131.85
-ve
86.70
86.50
86.05
85.55
87.50
87.95
88.40
POWER TRADING
ICICI Securities Ltd. | Retail Equity Research
+ve
Page 9
SCRIP
CLOSE
S1
S2
S3
R1
R2
R3
TREND
PNB
961.85
962.20
958.35
954.55
969.90
976.35
982.80
+ve
RANBAXY
648.60
641.60
636.00
630.40
649.70
653.75
657.80
-ve
RCOM
116.15
114.95
113.55
112.20
116.55
117.35
118.20
-ve
REL. CAPITAL
540.20
534.15
529.70
525.25
542.25
546.30
550.35
-ve
RELIANCE INFRA.
699.80
699.60
695.60
691.55
707.65
713.40
719.10
+ve
RELIANCE
993.70
993.90
990.15
986.45
1001.40
1004.85
1008.35
76.65
76.30
75.95
74.00
77.05
77.45
79.35
265.70
266.10
264.35
262.55
269.65
272.55
275.45
+ve
82.75
82.70
82.30
81.90
83.55
84.25
84.95
+ve
SESA GOA
276.40
273.10
270.55
268.00
277.35
279.45
281.55
-ve
SHRIRAM TRANS.
919.35
917.80
913.60
909.45
926.10
934.10
942.10
+ve
Neutral
RELIANCE POWER
REC
SAIL
SIEMENS
+ve
Neutral
796.50
791.15
784.50
772.25
804.45
811.10
823.35
2505.00
2504.90
2489.55
2474.25
2535.50
2546.45
2557.40
SUN PHARMA
862.40
853.85
847.25
840.70
863.00
867.55
872.15
-ve
SUN TV
354.55
350.20
348.55
346.90
355.35
357.90
360.45
-ve
SYNDICATE BANK
122.55
121.10
120.05
118.95
122.80
123.65
124.45
-ve
TATA CHEMICALS
374.65
373.95
372.45
370.90
377.00
378.60
380.15
+ve
+ve
SBI
+ve
TATA MOTOR DVR
371.80
371.10
368.50
365.95
376.25
379.25
382.25
TATA MOTORS
521.70
521.15
519.20
517.25
525.05
530.65
536.25
+ve
88.65
88.65
88.15
87.65
89.60
90.65
91.70
+ve
TATA POWER
TATA GLOBAL BEV.
153.10
152.70
152.10
151.10
153.90
154.45
155.50
Neutral
TCS
2549.95
2533.55
2520.20
2507.70
2560.20
2573.55
2586.05
Neutral
TECH MAHINDRA
2329.60
2314.60
2301.20
2287.85
2333.85
2343.50
2353.15
TATA STEEL
523.20
521.00
517.95
513.80
527.10
530.20
534.30
Neutral
TITAN IND.
363.60
364.05
362.20
360.35
367.75
369.40
371.05
+ve
UCO BANK
90.35
88.75
86.90
85.00
90.70
91.70
92.65
2594.50
2578.60
2560.85
2543.10
2597.70
2607.25
2616.85
UBI
208.85
208.45
206.75
205.00
211.90
214.80
217.70
UNITED BREW.
720.50
714.10
711.35
708.60
720.95
724.35
727.75
-ve
UNITED PHOSPH.
324.85
323.65
321.55
317.85
327.75
329.80
333.55
Neutral
ULTRATECH CEMENT
UNITECH
-ve
-ve
-ve
+ve
22.05
21.50
21.20
20.90
22.10
22.45
22.75
398.75
399.05
397.55
396.10
402.00
404.55
407.10
+ve
TATA COMM.
359.50
358.65
356.50
354.35
363.00
364.75
366.50
+ve
VOLTAS
241.10
241.15
239.50
237.85
244.45
247.80
251.15
+ve
AXIS BANK
ICICI Securities Ltd. | Retail Equity Research
-ve
Page 10
SCRIP
CLOSE
S1
S2
S3
R1
R2
R3
TREND
WIPRO
558.55
557.15
553.95
550.75
563.55
567.10
570.60
+ve
YES BANK
573.60
572.85
570.30
567.75
577.95
582.85
587.75
+ve
ZEE
277.50
275.25
273.80
272.40
278.40
279.95
281.55
-ve
NOTES:
•
•
•
•
•
•
•
Please execute the recommendation within the levels provided in the report
Once the recommendation is executed, it is advisable to keep strict stop loss as provided in the report
Avoid entering into the recommendation in the first 5 minutes of trade
If the recommendation opens near the target levels due to gap up/gap down opening, then the
recommendation is considered not initiated
The recommendations are valid only for the day and should be squared off by the end of the day
Only stocks in derivatives segment have been considered for daily trading
Medium to long-term prospects of a stock does not have any bearing on the daily view
Trading Portfolio allocation
•
•
•
•
It is recommended to spread out the trading corpus in a proportionate manner between the various technical
research products.
Please avoid allocating the entire trading corpus to a single stock or a single product segment
Within each product segment it is advisable to allocate equal amount to each recommendation.
For example: The ‘Daily Calls’ product carries 3 to 4 intraday recommendations. It is advisable to allocate
equal amount to each recommendation
ICICI Securities Ltd. | Retail Equity Research
Page 11
Recommended Trading Portfolio allocation
Products
Allocations
Product wise
Max allocation
allocation
in 1 stock
Return Objective
Number of Calls
Frontline Stocks
Mid-cap stocks
Duration
Daily Calls
8%
2-3%
3-4 Stocks
0.50-1%
2-3%
Intraday
Short term Delivery
6%
3-5%
7-10 p.m
4-5%
7-10%
Opportunity based
Weekly Calls
8%
3-5%
1-2 Stocks
5-7%
7-10%
1 Week
Weekly Technical
8%
3-5%
1-2 Stocks
5-7%
7-10%
1 Week
Monthly Call
15%
5%
2-3 Stocks
7-10%
10-15%
1 Month
Monthly Technical
15%
2-4%
5-8 Stocks
7-10%
10-15%
1 Month
Techno Funda
15%
5-10%
1-2 Stocks
10% and above
15% and above
6 Months
Technical Breakout
15%
5-10%
1-2 Stocks
10% and above
15% and above
3-6 Months
Cash in Hand
10%
-
-
-
-
-
100%
ICICI Securities Ltd. | Retail Equity Research
Page 12
Candlesticks Glossary:
Candlestick patterns describe the market sentiment for the specified period. Some of the formations suggest reversal of
sentiment (trend) and, therefore, are important for a chart reader. By themselves, the patterns do not carry any price target but
only an indication of change in market behaviour. More importance needs to be given to the placement of the pattern within
larger trend
Bullish Engulfing Line: A potential bottom reversal pattern. This pattern typically appears at the culmination of a decline or
downtrend. The market falls, and a black candle forms (ideally a small black candle). Next, a white real body wraps around the
prior session’s black body. Low of the pattern becomes short term support for prices
Piercing Line: Potential bottom reversal pattern. A black body forms in the downtrend. The market continues moving south on
the next session’s open but that session culminates in a white real body that closes (e.g. pierces) than half way or more into the
prior black body. Lowest low between two candles is referred to as technical support for prices
Hammer: A candlestick line which, during a downtrend, has a very long lower shadow and small real body (black or white) at
the top end of the session’s range. There should be no, or a very small, upper shadow. Pattern suggests buying support during
declines and needs confirmation in terms of sustainability of prices above head of the Hammer in following session
Bearish Engulfing Line: Potential top reversal signal. This two candlestick pattern emerges during a rally. A black candle real
body wraps around a white real body (classically a small white candle) Highest high between two candles becomes resistance
level for prices for future reference
Dark Cloud cover: A dark cloud cover forms a top reversal pattern. The first session should be a strong, white real body. The
second session’s price opens over the prior session’s high (or above the prior session’s close). By the end of the second session,
it closes near the low of the session and should fall well into the prior session’s white body. Pattern suggests that market has a
poor chance of rising immediately
Shooting Star: A single candlestick line during a rally in which there is a small real body (white or black) at the bottom end of
the session's range and a very long upper shadow. The candle line should also have little or no lower shadow. Pattern suggest
the trouble for prices overhead
ICICI Securities Ltd. | Retail Equity Research
Page 13
Pankaj Pandey
Head – Research
[email protected]
ICICIdirect.com Research Desk,
ICICI Securities Limited,
1st Floor, Akruti Trade Centre,
Road No 7, MIDC
Andheri (East)
Mumbai – 400 093
[email protected]
Disclaimer
The report and information contained herein is strictly confidential and meant solely for the selected recipient and may not be altered in any way, transmitted to, copied or distributed, in part or in whole, to any other
person or to the media or reproduced in any form, without prior written consent of ICICI Securities Ltd (I-Sec). The author may be holding a small number of shares/position in the above-referred companies as on
date of release of this report. I-Sec may be holding a small number of shares/position in the above-referred companies as on date of release of this report. This report is based on information obtained from public
sources and sources believed to be reliable, but no independent verification has been made nor is its accuracy or completeness guaranteed. This report and information herein is solely for informational purpose and
may not be used or considered as an offer document or solicitation of offer to buy or sell or subscribe for securities or other financial instruments. Nothing in this report constitutes investment, legal, accounting and
tax advice or a representation that any investment or strategy is suitable or appropriate to your specific circumstances. The securities discussed and opinions expressed in this report may not be suitable for all
investors, who must make their own investment decisions, based on their own investment objectives, financial positions and needs of specific recipient. This report may not be taken in substitution for the exercise of
independent judgment by any recipient. The recipient should independently evaluate the investment risks. I-Sec and affiliates accept no liabilities for any loss or damage of any kind arising out of the use of this
report. Past performance is not necessarily a guide to future performance. Actual results may differ materially from those set forth in projections. I-Sec may have issued other reports that are inconsistent with and
reach different conclusion from the information presented in this report. This report is not directed or intended for distribution to, or use by, any person or entity who is a citizen or resident of or located in any
locality, state, country or other jurisdiction, where such distribution, publication, availability or use would be contrary to law, regulation or which would subject I-Sec and affiliates to any registration or licensing
requirement within such jurisdiction. The securities described herein may or may not be eligible for sale in all jurisdictions or to certain category of investors. Persons in whose possession this document may come
are required to inform themselves of and to observe such restriction.
ICICI Securities Ltd. | Retail Equity Research
Page 14


© Copyright 2026