
| HOLD MAPLETREE LOGISTICS TRUST
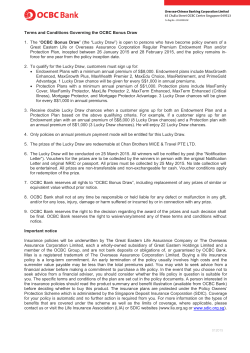
Singapore | REITs
Asia Pacific Equity Research
MAPLETREE LOGISTICS TRUST
MARKET CAP: USD 2.3B
HOLD
23 Oct 2014
Company Update
AVG DAILY TURNOVER: USD 3M
CHALLENGING NEAR-TERM
OUTLOOK
HOLD (maintain)
Fair value
S$1.12
add: 12m dividend forecast
2QFY15 DPU grew 3.3% YoY
Positive rental reversions of 9%
Accretive acquisitions made
•
•
•
|
S$0.076
S$1.20
versus: Current price
12m total return forecast
2QFY15 results within expectations
Mapletree Logistics Trust (MLT) reported a 3.3% YoY increase in its
2QFY15 DPU to 1.88 S cents on the back of a 5.8% growth in its gross
revenue to S$81.5m. This was driven by contributions from its
redevelopment project Mapletree Benoi Logistics Hub, higher revenue
from existing assets in Singapore and Hong Kong, but partially offset
by lower occupancy at several of its newly converted multi-tenanted
buildings in Singapore. Overall portfolio occupancy rates slipped 0.4
ppt to 97.2%, its fourth consecutive quarter of QoQ decline. For
1HFY15, revenue and DPU grew 6.6% and 4.4% to S$162.5m and
3.78 S cents, respectively, both of which formed 49.4% of our FY15
forecasts. We view this set of results as in-line with our expectations.
0%
Analysts
Wong Teck Ching (Andy), CFA (Lead) ● +65 6531 9817
[email protected]
Eli Lee ● +65 6531 9112
[email protected]
Key information
Market cap. (m)
S$2,955 /
USD2,323
Avg daily turnover (m)
S$3 /
USD3
Avg daily vol. (m)
3.0
52-wk range (S$)
0.98 - 1.2
Free float (%)
59.3
Shares o/s. (m)
2,462.4
Four accretive acquisitions concluded YTD
MLT has concluded four accretive acquisitions in Malaysia, South
Korea and China worth ~S$149m YTD (two were completed post
2QFY15 in China on 8 Oct), with NPI yields ranging from 7.5%-8.4%.
This is attractive compared to its FY14 portfolio NPI yield of 6.3%, in
our view. The four assets are funded wholly by debt, which will cause
its aggregate leverage ratio to increase to 34.6%.
Exchange
1m
3m
Maintain HOLD on muted outlook
Although MLT managed to achieve positive average rental reversions
of 9% for leases renewed in 2QFY15, the outlook remains muted. This
is attributed to the sluggish macroeconomic environment, tighter
regulatory landscape and higher expenses from the continued
conversion of its single-tenanted assets to multi-tenanted buildings in
Singapore. Nevertheless, we still expect rental reversions to remain
positive, although the pace of growth would likely moderate. After
updating our valuation model for our latest assumptions, our DDMderived fair value remains unchanged at S$1.12. Maintain HOLD. In
our view, valuations appear rich, with the stock trading at 1.23x
FY15F P/B, which is approximately 0.5 standard deviation above its
10-year average forward P/B ratio of 1.07x.
Company (%)
6
5
18
STI-adjusted (%)
9
7
14
SGX
BBRG ticker
MLT SP
Reuters ticker
MAPL.SI
ISIN code
M44U
GICS Sector
GICS Industry
Top shareholder
Relative total return
Financials
REITs
Temasek - 40.4%
12m
Price performance chart
Sources: Bloomberg, OIR estimates
Industry-relative metrics
Key financial highlights
Year Ended 31 Mar (S$ m)
FY13
FY14
FY15F
FY16F
Gross revenue
307.8
310.7
328.9
342.4
Total property expenses
-39.7
-43.1
-43.2
-45.4
Net property income
268.1
267.6
285.7
297.1
Amount available for distribution
166.4
179.7
187.9
194.3
6.9
7.4
7.6
7.8
na
na
7.6
7.8
DPU yield (%)
5.7
6.1
6.4
6.5
P/NAV (x)
1.3
1.2
1.2
1.2
ROE (%)
10.1
13.5
9.1
9.3
Gearing (%)
33.8
33.1
35.1
35.1
DPU per share (S cents)
Cons. DPU (S cents)
Note: Industry universe defined as companies under identical GICS classification listed
on the same exchange.
Sources: Bloomberg, OIR estimates
Please refer to important disclosures at the back of this document.
MCI (P) 004/06/2014
OCBC Investment Research
Singapore Equities
Exhibit 1: Quarterly financial highlights
2QFY14
2QFY15
% Chg
1QFY15
% Chg
(S$m)
(S$m)
(YoY)
(S$m)
(QoQ)
0.6%
Gross revenue
77.1
81.5
5.8%
81.0
-10.5
-12.9
23.0%
-12.0
6.8%
Net property income
66.6
68.7
3.1%
69.0
-0.4%
Management fees
-7.7
-8.1
5.2%
-8.0
0.8%
Trustee's fees
-0.2
-0.2
3.2%
-0.2
1.3%
4.4
3.3
-24.1%
-0.1
nm
Property operating expenses
Other trust income/(expenses)
Finance income
0.1
0.2
83.5%
0.2
13.1%
-7.3
-8.0
9.4%
-7.7
3.6%
0.0
0.0
nm
0.0
nm
55.9
56.0
0.0%
53.2
5.3%
Net change in fair value of financial derivatives
1.0
3.2
212.8%
-7.8
nm
Change in fair value of investment properties
0.0
0.0
nm
0.0
nm
Finance costs
Foreign exchange gain
Net income
Gain on divestment of investment property
Total return for the year before income tax expense
0.0
0.0
nm
0.0
nm
57.0
59.1
3.8%
45.3
30.4%
Income tax expense
-3.2
-3.1
-2.8%
-2.9
6.2%
Total return for the year after income tax expense
53.8
56.1
4.2%
42.5
32.1%
Non-tax deductible expenses, net and other adjustments
-4.5
-4.9
8.2%
9.0
nm
0.0
0.0
nm
0.0
nm
Income available for distribution
49.3
51.2
3.8%
51.4
-0.5%
Less: Perpetual securities holders
-4.7
-4.7
0.0%
-4.7
1.1%
Less: Non-controlling interests
-0.1
-0.2
146.7%
-0.2
15.6%
Total amount available for distribution
44.5
46.3
4.0%
46.6
-0.7%
Change in fair value of investment properties
Source: REIT Manager
Exhibit 2: MLT’s forward P/B trend
2.5
2
1.5
1
0.5
Forward P/B
10-year average
Source: Bloomberg, OIR
2
+1 SD
-1 SD
26/9/2014
26/3/2014
26/9/2013
26/3/2013
26/9/2012
26/3/2012
26/9/2011
26/3/2011
26/9/2010
26/3/2010
26/9/2009
26/3/2009
26/9/2008
26/3/2008
26/9/2007
26/3/2007
26/9/2006
26/3/2006
26/9/2005
0
OCBC Investment Research
Singapore Equities
Company financial highlights
Income statement
Year Ended 31 Mar (S$ m)
FY13
FY14
FY15F
FY16F
307.8
-39.7
268.1
-37.9
-31.1
-5.8
193.3
222.6
-56.2
166.4
310.7
-43.1
267.6
-28.7
-30.8
12.6
220.7
312.2
-132.4
179.7
328.9
-43.2
285.7
-30.4
-33.0
-4.6
217.7
217.7
-29.8
187.9
342.4
-45.4
297.1
-32.1
-33.2
-4.8
226.9
224.5
-30.2
194.3
FY13
FY14
FY15F
FY16F
4,050.4
0.0
134.8
186.5
4,236.9
171.3
1,433.5
1,654.6
2,232.0
4,236.9
4,235.1
0.0
114.3
161.9
4,397.0
150.9
1,455.4
1,664.8
2,381.9
4,397.0
4,397.9
0.0
126.2
174.8
4,573.5
159.3
1,605.5
1,823.5
2,399.0
4,573.5
4,431.1
0.0
152.8
202.6
4,635.3
182.5
1,625.5
1,866.8
2,416.8
4,635.3
FY13
FY14
FY15F
FY16F
222.6
21.0
243.5
15.1
258.6
-197.3
-84.8
-23.4
167.6
134.8
312.2
-68.3
243.9
-33.0
210.9
-101.0
-130.0
-20.1
134.8
114.3
217.7
34.1
251.8
-6.8
245.0
-152.1
-81.0
11.9
114.3
126.2
224.5
35.8
260.2
7.3
267.5
-22.0
-218.9
26.7
126.2
152.8
Key rates & ratios
FY13
FY14
FY15F
FY16F
DPU per share (S cents)
NAV per share (S cents)
PER (x)
P/NAV (x)
NPI margin (%)
Net income margin (%)
Gearing (%)
DPU yield (%)
ROE (%)
ROA (%)
6.9
91.8
13.1
1.3
87.1
62.8
33.8
5.7
10.1
5.2
7.4
97.3
9.4
1.2
86.1
71.0
33.1
6.1
13.5
7.2
7.6
97.3
13.5
1.2
86.9
66.2
35.1
6.4
9.1
4.9
7.8
97.4
13.2
1.2
86.7
66.3
35.1
6.5
9.3
4.9
Gross revenue
Total property expenses
Net property income
Net finance costs
Manager's management fees
Other expenses
Net income
Total return for the period
Adjustments
Amount available for distribution
Balance sheet
As at 31 Mar (S$ m)
Investment properties
Properties under development
Cash
Total current assets
Total assets
Current liabilities ex debt
Debt
Total liabilities
Unitholders' funds
Total equity and liabilities
Cash flow statement
Year Ended 31 Mar (S$ m)
Total return
Adjustments
Operating income before working cap chgs
Change in working capital
Cash generated from operating activities
Cashflow from investing activities
Cashflow from financing activities
Change in cash
Cash at beginning of period
Cash at end of period
Source: REIT Manager, OIR forecasts
Company financial highlights
OCBC Investment Research
Singapore Equities
SHAREHOLDING DECLARATION:
The analyst/analysts who wrote this report holds/hold NIL shares in the above security.
DISCLAIMER FOR RESEARCH REPORT
This report is solely for information and general circulation only and may not be published, circulated,
reproduced or distributed in whole or in part to any other person without our written consent. This report
should not be construed as an offer or solicitation for the subscription, purchase or sale of the securities
mentioned herein. Whilst we have taken all reasonable care to ensure that the information contained in this
publication is not untrue or misleading at the time of publication, we cannot guarantee its accuracy or
completeness, and you should not act on it without first independently verifying its contents. Any opinion or
estimate contained in this report is subject to change without notice. We have not given any consideration to
and we have not made any investigation of the investment objectives, financial situation or particular needs of
the recipient or any class of persons, and accordingly, no warranty whatsoever is given and no liability
whatsoever is accepted for any loss arising whether directly or indirectly as a result of the recipient or any
class of persons acting on such information or opinion or estimate. You may wish to seek advice from a
financial adviser regarding the suitability of the securities mentioned herein, taking into consideration your
investment objectives, financial situation or particular needs, before making a commitment to invest in the
securities. OCBC Investment Research Pte Ltd, OCBC Securities Pte Ltd and their respective connected and
associated corporations together with their respective directors and officers may have or take positions in the
securities mentioned in this report and may also perform or seek to perform broking and other investment or
securities related services for the corporations whose securities are mentioned in this report as well as other
parties generally.
Privileged / confidential information may be contained in this document. If you are not the addressee indicated
in this document (or responsible for delivery of this message to such person), you may not copy or deliver this
message to anyone. Opinions, conclusions and other information in this document that do not relate to the
official business of OCBC Investment Research Pte Ltd, OCBC Securities Pte Ltd and their respective
connected and associated corporations shall not be understood as neither given nor endorsed.
RATINGS AND RECOMMENDATIONS:
- OCBC Investment Research’s (OIR) technical comments and recommendations are short-term and trading
oriented.
- OIR’s fundamental views and ratings (Buy, Hold, Sell) are medium-term calls within a 12-month investment
horizon.
- As a guide, OIR’s BUY rating indicates a total return in excess of 10% based on the current price; a HOLD
rating indicates total returns within +10% and -5%; a SELL rating indicates total returns less than -5%.
Co.Reg.no.: 198301152E
Carmen Lee
Head of Research
For OCBC Investment Research Pte Ltd
Published by OCBC Investment Research Pte Ltd
Important disclosures


© Copyright 2026