
- University of Vaasa
MERVI TOIVANEN
Essays on Credit Contagion
and Shocks in Banking
ACTA WASAENSIA 332
ECONOMICS 9
Reviewers
Professor Koen Schoors
Ghent University
Reep 1
BE-9000 Gent
Belgium
Professor Ari Hyytinen
University of Jyväskylä,
School of Business and Economics
PL 35
FI-40014 Jyväskylän yliopisto
III
Julkaisija
Vaasan yliopisto
Tekijä(t)
Mervi Toivanen
Yhteystiedot
Vaasan yliopisto
PL 700
65101 VAASA
Julkaisupäivämäärä
Elokuu 2015
Julkaisun tyyppi
Artikkeliväitöskirja
Julkaisusarjan nimi, osan numero
Acta Wasaensia, 332
ISBN
978-952-476-630-2 (painettu)
978-952-476-631-9 (verkkojulkaisu)
ISSN
0355-2667 (Acta Wasaensia 332, painettu)
2323-9123 (Acta Wasaensia 332, verkkojulkaisu)
1235-788X (Acta Wasaensia. Kansantaloustiede 9, painettu)
2342-2238 (Acta Wasaensia. Kansantaloustiede 9,
verkkojulkaisu)
Sivumäärä
Kieli
168
Englanti
Julkaisun nimike
Essays on Credit Contagion and Shocks in Banking
Tiivistelmä
Tässä väitöskirjassa käsitellään sokkien vaikutusta pankkeihin finanssikriisien aikana.
Tarkemmin ottaen tarkastelun kohteena ovat tartuntariskit pankkien välisillä rahamarkkinoilla Suomessa ja Euroopassa. Lisäksi tarkastellaan pankkien pääomaan ja likviditeettiin
kohdistuvien paineiden vaikutusta euroalueen pankkien lainanantoon ja makrotalouteen.
Ensimmäisessä esseessä tutkitaan kotimaisten ja ulkomaisten tartuntariskien välittymistä
Suomen rahamarkkinoilla. Tulokset osoittavat, että kotimaisen tartuntariskin takia keskimäärin noin puolet Suomen pankkisektorista joutuu vaikeuksiin 1990-luvulla ja 66 %
vuosina 2005–2011. 2000-luvulla ulkomaisen pankin kaatuminen vaikuttaa 77 prosenttiin
suomalaisista pankeista. Toisessa esseessä tarkastellaan pankkien välisiä tartuntariskejä
Euroopassa. Ne vaikuttavat keskimäärin 70 prosenttiin pankeista vuonna 2007 ja 40 prosenttiin vuonna 2010. Ranskalaiset, englantilaiset, saksalaiset ja espanjalaiset pankit ovat
merkittävimpiä tartuntariskien lähteitä. Tutkimus myös osoittaa, että tartuntariskiä lisäävät pankin keskeinen asema rahamarkkinoilla, lainapositioiltaan suurten pankkien ryhmät, useat linkit ja pankin suuri koko.
Kolmannessa esseessä analysoidaan euroalueen pankkien sisäisiä vakavaraisuustavoitteita ja sitä, vaikuttaako tavoitteisiin pyrkiminen pankkien taseisiin. Tulokset osoittavat, että
euroalueen pankit olivat alipääomitettuja vuonna 2008. Täyttäessään pääomavajeitaan
pankit supistavat lainanantoa vähemmän kuin arvopaperiomistuksia. Neljännessä esseessä tarkastellaan riski-, rahoitus- ja velkakriisisokkien vaikutusta euroalueella, Saksassa,
Ranskassa, Italiassa ja Espanjassa. Vuonna 2009 sokit selittävät noin 60 % euroalueen
yrityslainanannon vähenemisestä ja noin kolmasosan vuosittaisen bruttokansantuotteen
supistumisesta. Sokkien vaikutus on merkittävä Saksassa ja Ranskassa vuosina 2009–
2011, mutta italialaisille ja espanjalaisille pankeille sokit ovat merkittäviä vasta simulointiperiodin loppupuolella.
Asiasanat
pankit, finanssikriisit, tartuntariski, interbanksaamiset, euroalue, Suomi, luotontarjonta
V
Publisher
University of Vaasa
Author(s)
Mervi Toivanen
Contact information
University of Vaasa
P.O. BOX 700
FI-65101 Vaasa
Finland
Date of publication
August 2015
Type of publication
Selection of Articles
Name and number of series
Acta Wasaensia, 332
ISBN
978-952-476-630-2 (print)
978-952-476-631-9 (online)
ISSN
0355-2667 (Acta Wasaensia 332, print)
2323-9123 (Acta Wasaensia 332, online)
1235-788X (Acta Wasaensia. Economics 9, print)
2342-2238 (Acta Wasaensia. Economics 9, online)
Number of pages
Language
168
English
Title of publication
Essays on Credit Contagion and Shocks in Banking
Abstract
This dissertation examines the impact of shocks on banks in the context of financial
crises. Specifically, it studies credit contagion in Finnish and European interbank markets as well as the effects of capital and liquidity pressures on euro area banks’ lending
and the macro economy.
The first essay studies the domestic and foreign credit contagion via Finnish banks’
interbank exposures. The results show that domestic contagion affects, on average, almost half of the Finnish banking sector in the 1990s and 66% in 2005–2011. In the
2000s, the failure of a foreign bank impacts 77% of the total assets of Finnish banks.
The second essay examines credit contagion at the European level. The average contagion affects 70% and 40% of European banks’ total assets in 2007 and in 2010, respectively. Contagion is most prevalent among the French, British, German and Spanish
banks. The most prominent factors for determining the magnitude of contagion are the
bank’s central position in the network, bank clusters with large interbank loans, number
of links and bank size.
The third essay analyses euro area banks’ internal target capital ratios and whether
banks’ adjustments towards their targets affect their balance sheets. The results indicate
that euro area banks were undercapitalised in 2008. While closing the capital gap, banks
reduce lending less than security holdings. The fourth essay disentangles the impact of
risk, funding and sovereign shocks in the euro area as a whole and in Germany, France,
Italy and Spain. In 2009 the shocks account for about 60% of the decrease in corporate
lending and around a third of the decline of annual GDP growth in the euro area. While
shocks exhibit a notable impact on Germany and France in 2009–2011, they are significant for Italian and Spanish banks only towards the end of the simulation period.
Keywords
banks, financial crises, contagion, interbank exposures, euro area, Finland, credit supply
VII
ACKNOWLEDGEMENTS
The completion of this doctoral dissertation has been a long journey and at times
it seemed to be an ever-expanding project with no end in sight. At the wire, it is
nevertheless my privilege to thank several persons who have supported me
throughout the process.
First of all, I would like to thank Professors Hannu Piekkola and Panu Kalmi for
discussions and advice. By organizing seminars, courses and study visits they
have enhanced the faculty’s research and working atmosphere. I am also very
grateful for the opportunity to spend some time as a researcher in the economics
department of the University of Vaasa. That period allowed me to fully concentrate in my thesis and made it possible to finalise one of the articles.
I would like to express my sincerest gratitude for the pre-examiners of this dissertation, Professor Ari Hyytinen from the University of Jyväskylä and Professor
Koen Schoors from Ghent University. Their valuable comments, suggestions and
insightful views have improved the quality and presentation of this dissertation
immensely. A special thank you goes to my co-author, Mr. Laurent Maurin, for
the exchange of ideas and brainstorming and for sharing his knowledge of methodologies and programming issues. The keen-sighted and explicit advice of Mr.
Simone Giansante is also highly appreciated.
Special acknowledgement belongs to the OP-Pohjola Research Foundation and
Yrjö Jahnsson Foundation for providing financial support for the research.
My sincere thanks also go to others who have helped me in various ways. The
swift editorial assistance of Ms. Merja Kallio helped me to finalize the dissertation. Mr. Glenn Harma has been most kind in helping me enormously with the
English language. A word of thanks goes also to Mr. Jouko Vilmunen and Mr.
Heikki Koskenkylä for providing me with an opportunity to visit the research
department of the Bank of Finland in the early days of the project.
I’m deeply indebted to my parents who have patiently supported me in my continuous studies and in my deep love affair with books. I wouldn’t be at this point
without them. I’m especially grateful to Dad for taking me to the public library in
my youth, and to my granddad for teaching me to read and write as well as for
providing the first insights into calculus already before I started preliminary
school. I thank my Mom for being there and for providing the best food in the
VIII
world. I also want to thank my brother who has always managed to find time and
solutions to my IT problems.
Finally, special thanks go to Risto who has shown incredible patience and support
while I made absolutely no sense to a fellow human being in talking about the
details and challenges of my research. Yet, he sustained all those rattles valiantly.
He also managed to keep my feet on the ground, reminding me of the necessity to
finalise the project.
Helsinki, July 2015
Mervi Toivanen
IX
Contents
ACKNOWLEDGEMENTS ................................................................................ VII
1
INTRODUCTION ........................................................................................... 1
2
OVERVIEW OF LITERATURE..................................................................... 2
2.1
Contagion .............................................................................................. 2
2.2
Basics for modelling scale-free networks ............................................. 4
2.3
The relationship between bank capital, lending and the
macroeconomy ...................................................................................... 6
2.3.1
Bank capital, liquidity and funding in relation to bank
lending.................................................................................. 6
2.3.2
Bank lending and the macro economy ................................. 9
3
FINANCIAL CRISES.................................................................................... 11
3.1
The Finnish banking crisis in the 1990s ............................................. 11
3.2
The financial crisis from 2007 onwards ............................................. 14
3.2.1
The building blocks of the crisis ........................................ 14
3.2.2
The impact of the crisis in the United States ..................... 16
3.2.3
The impact of the crisis in Europe ..................................... 20
4
SUMMARY OF THE ESSAYS .................................................................... 23
4.1
Essay 1: Interbank exposures and risk of contagion in crises:
Evidence from Finland in the 1990s and the 2000s ............................ 23
4.2
Essay 2: Contagion in the interbank network: An epidemiological
approach .............................................................................................. 25
4.3
Essay 3: Risk, capital buffers and bank lending: The adjustment of
euro area banks ................................................................................... 27
4.4
Essay 4: The impact of risk, funding and sovereign shocks on euro
area banks and economies................................................................... 29
5
CONCLUSIONS ............................................................................................ 32
REFERENCES......................................................................................................33
X
This thesis consists of an introductory chapter and the following four essays:
1. Toivanen, M. (2013). Interbank exposures and risk of contagion in crises:
Evidence from Finland in the 1990s and the 2000s. Journal of Applied Finance & Banking 3: 6, 45–65 1..........................................................42
2. Toivanen, M. (2015). Contagion in the interbank network: An epidemiological approach 2.......................................................................................63
3. Maurin, L. & Toivanen, M. (2015). Risk, capital buffers and bank lending:
The adjustment of euro area banks. Journal of Banking and Financial
Economics 1, 113–129 3 ..........................................................................100
4. Maurin, L. & Toivanen, M. (2014). The impact of risk, funding and sovereign shocks on euro area banks and economies.......................................117
1
2
3
Printed with kind permission of Scienpress Ltd.
Previous version published as Bank of Finland Discussion Paper 19/2013.
Printed with kind permission of the University of Warsaw.
1 INTRODUCTION
After a period of relative calm and prosperity financial markets were confronted
with a global financial crisis. It sent shockwaves throughout the world, impacting
negatively on financial institutions and their operating environment. Especially
banks came under considerable stress as their losses increased, financial performance and capital positions deteriorated and funding became scarce. As a result,
governments and central banks were forced to step in and bail out several banks
of relevance that were about to fail.
The crisis highlighted the importance of networks and linkages between financial
institutions, by showing that a failure of bank can have negative repercussions for
other banks although they are not directly connected to first failing bank. Authorities also justified rescue measures by the prevention of contagion. But how severe
would credit contagion be if no measures were taken? What banks are the most
contagious? And what are the leading factors determining the magnitude of domino effects? Answering these questions is of relevance from the financial stability
point of view. In order to design appropriate policy measures and regulatory requirements one needs to understand the impact of network effects and the underlying dynamics. This doctoral dissertation sheds more light on credit contagion in
the Finnish and European interbank markets.
The crisis also brought to light a question as to banks’ ability to grant credit to
private sector. As banks transmit funds from sectors with a surplus to sectors with
a deficit, they support firms' investments and thus economic growth. But if financial intermediation is disturbed, a lack of adequate funding may be detrimental to
economic activity. During the global financial crisis the risk, capital and funding
shocks to euro area banks have been particularly severe. Hence, the monitoring of
potential deleveraging pressures and implications for the macro economy are of
relevance. So what happened in the recent crisis? Did euro area banks reduce their
lending? And if so, what were the implications for the economy? This dissertation
builds on previous research and investigates the adjustment of euro area banks.
The remainder of the introductory chapter is organized as follows. Section 2 gives
a brief overview of research and theoretical fundamentals related to contagion and
network theory. Section 3 describes the academic literature related to capital and
liquidity shocks, bank lending and economic growth. To provide a background
for the essays of the dissertation section 4 overviews the Finnish banking crisis in
the 1990s and the global financial crisis in the 2000s. Section 5 summarizes the
four essays of this dissertation, while section 6 concludes with the outcomes of
the analyses.
2
Acta Wasaensia
2 OVERVIEW OF LITERATURE
2.1
Contagion
Contagion refers to the spreading of negative spillover effects in the economy or
in the financial markets. Although the interest in contagion has gained momentum
during the global financial crisis, the phenomenon has so far been mainly studied
in relation to earlier currency crises, stock market crashes and banking crises. In
banking, contagion is defined as a crisis that spills over from one financial institution to another institution. (Müller 2006)
Contagion may be either direct or indirect, may occur through a multitude of
channels (such as interbank markets, payment systems, derivative exposures and
asset holdings) and may impact both the liability and asset sides of banks’ balance
sheets. It can be caused by a multitude of factors. Firstly, owing to an idiosyncratic shock a borrower defaults on its interbank loans, inducing loan losses to lender.
If such losses exceed the lender's equity capital, a default of a financial institution
could thus trigger the failure of others and even cause a systemic meltdown of the
banking system (so called credit contagion). For instance, the bailouts of American International Group (AIG) and German Industriekreditbank (IKB) were justified by these potential negative spillover effects (Upper 2011). Contagion may
also be driven by information, by distressed banks' sale of illiquid assets (so
called fire sales) as well as by fear of losses or negative effects from other market
players/banks that run for safety at the same time. Owing to liquidity hoarding,
the availability of interbank loans diminishes, inducing funding liquidity shocks
and a cascade of failures. Moreover, the failure of a large number of banks could
also be the outcome of a macroeconomic shock that affects institutions exposed to
a common risk more or less simultaneously. (Upper 2011; Haldane & May 2011;
Pais & Stork 2011)
The academic literature comprises both theoretical models which analyse specific
aspects of contagion and empirical analyses. The seminal paper by Allen & Gale
(2000) shows that the spreading of a financial crisis depends crucially on the
banking sector's pattern of interconnectedness. They demonstrate that if the interbank market is complete and each region is connected to all other regions, the
initial impact of a financial crisis in one region may be attenuated. But, if each
region is connected with only a small number of other regions (the interbank
market is incomplete), the initial impact of financial crisis may be felt strongly in
neighbouring regions. By applying network modelling and adding further reality
to models, for instance, in terms of heterogeneous banks and network structures,
Acta Wasaensia
3
fire-sales and volume of shocks, recent papers show that high interconnectedness
of banks may not necessarily be beneficial for financial stability (Acemoglu, Ozdaglar & Tahbaz-Salehi 2013; Battiston et al. 2012; Gai & Kapadia 2010). While
increasing connectivity attenuates contagion via risk sharing and improves the
ability of a banking system to absorb shocks, it also facilitates spillover effects
and can make the system more fragile ("robust-yet-fragile" tendency).
The second set of papers provides further evidence on characteristics of interbank
markets by modelling financial connections between banks as networks and employing simulation techniques to assess the outcomes of a bank failure. (Anand et
al. 2013; Gai, Haldane & Kapadia 2011; Nier et al. 2007; Arinaminpathy, Kapadia & May 2013; Krause & Giansante 2012; Iori, Jafarey & Padilla 2006) Based
on a set of assumptions, accounting identities and behavioural rules, these models
present a banking sector composed of individual banks with balance sheets and a
transmission mechanism for shocks. The contagion arises when the losses exceed
the net equity of a bank, inducing a bank failure. An enlargement of interbank
liabilities, high concentration of the banking sector and a shock to a wellconnected and big bank are shown to make the system vulnerable to large systemic risks. Meanwhile, the higher the capital ratios of banks, the more resilient the
system is to large systemic risks. Finally, the structure and tiering of the network
are most important in explaining the magnitude of the contagion.
Thirdly, empirical studies on credit contagion in interbank markets often rely on
estimations and counterfactual analyses. Upper & Worms (2004) use the method
of entropy maximization to estimate the distribution of individual banks' interbank loans and deposits. Having constructed a matrix of banks' interbank exposures, the effects of a bank failure are subsequently simulated to analyse the possibility of contagion in the German banking sector. The methodology has been
widely applied, and similar studies have been done for the Swiss, Belgian, English, Dutch, British and Italian interbank markets. (Sheldon & Maurer 1998;
Degryse & Nguyen 2007; Wells 2004; van Lelyveld & Liedorp 2006; Mistrulli
2011) In general, all authors found a potential for significant contagion effects but
regard a substantial weakening of the whole banking sector as unlikely. The negative effects differ according to loss-given-defaults (LGDs) with contagion being
limited for lower values of LGDs and substantial for the worst-case scenarios. In
addition, Degryse, Elahi & Penas (2010) provide evidence on cross-border contagion and show that the contagion is more widespread between countries situated
geographically close to each other. Furthermore, they suggest that the risk of
cross-border contagion has increased over the years.
4
Acta Wasaensia
Finally, other approaches estimate contagion by considering a wider variety of
risks and factors. For instance, Müller (2006) tests the general stability of the
Swiss interbank market by analysing the banking system's exposure to the aggregate risk that stems from the market's network structure. The possibility of contagion is evaluated by solving a clearing problem of a multilateral, complex network model using a recursive algorithm. Elsinger, Lehar & Summer (2006) use
standard risk management techniques in combination with a network model of
interbank exposures to analyse the consequences of macroeconomic shocks for
bank insolvency risk. They consider interest rate shocks, exchange rate and stock
market movements as well as shocks related to the business cycle. Gropp, Lo Duca & Vesala (2009) use a distance-to-default indicator, multinomial logit model
and "coexceedances" to study contagion risk in the European banking market.
2.2
Basics for modelling scale-free networks
The global financial crisis served as a reminder of the high levels of interconnectedness in the financial markets and banking systems. But old modelling techniques failed to properly recognize the interdependencies between economic
agents that determine the crucial contagion dynamics. As Haldane (2009) states,
risk measurement in financial systems had been atomistic and there was little understanding of the systemic overall risks in a financial system. It was easier to
assess risky investment positions of a single bank than to map interbank exposures that are hazardous from the systemic point of view.
As a consequence, the use of network models increased substantially for describing complex financial systems and interrelationships. The modelling approach
provides valuable insights into large and complex networks by providing statistical methods to describe and quantify network properties (Newman 2003). The
network approach is also well-suited to analyse the resiliency of financial networks and financial stability of banking sectors, as it can be used to model the
externalities that a single institution may create for the entire system. (Allen &
Babus 2009)
The network theory originates from mathematics and physics. A network (or
graph in mathematics) describes a collection of economic agents (i.e. nodes or
vertexes) and connections (i.e. links or edges) between them. The notions are fairly general, as nodes can be individuals, firms or groups of these players. Similarly, a link can be a friendship tie, an economic contract or financial obligation. In
the context of financial systems, the nodes of the network represent financial institutions (banks), and the links are mutual exposures such as interbank assets and
Acta Wasaensia
5
claims. (Allen & Babus 2009) Links can be either undirected or directed, representing from whom to whom the link (for example a transfer of funds or a message) goes. Links can also carry weights signifying, for instance, the volume of
payments. (Newman 2003)
In mathematical terms a graph is a pair of sets G = {P,E}, where P is a set of N
nodes P1,P2, ..., PN and E is a set of edges (or lines) that connect two elements of
P. In figures, the graphs are usually represented as a set of dots, each corresponding a node, and lines that join two dots if the corresponding nodes are connected.
(Albert & Barabasi 2002) As an example, figure 1 presents a graph of European
banks’ interbank linkages. In the figure, nodes (P1,P2, ..., PN), i.e. banks, are presented with circles. Edges or connections between the banks are depicted with
lines.
Note: A realization of the Barabasi-Albert (1999) model for the European interbank network.
Each node represents a bank in the sample, and its size is scaled in proportion to the sum of
interbank exposures of the given bank at the end of 2010. Similarly, the darkness of a line reflects the proportional value of a bilateral exposure.
Figure 1. A graph presenting a European interbank network
The structure of networks varies, and several models have been proposed to model the characteristics of real-world networks. The main classes of modelling paradigms are random graphs, small-world models and scale-free models. (Albert &
Barabasi 2002; Keeling & Eames 2005; Newman 2003) As scale-free networks
are of relevance in the context of this doctoral thesis, they are modelled by the
Barabasi & Albert (1999) model that features two important characteristics of
real-world networks: the growth of a network and preferential attachment.
Acta Wasaensia
6
In technical terms a scale-free network is created as follows. Starting with a small
number of nodes, n0, the network is constructed by adding one node at a time until the network contains N nodes. At each step, a new node, nj, enters the network
and connects to the existing nodes of the network via a given number of links, kj.
The new node prefers to connect with institutions that already have a large number of contacts. This is an intuitive assumption, as trust plays an important role in
money markets, and banks are more likely to establish business relationships with
renowned counterparties versus less-known banks (or banks with bad reputation).
Thus, the probability that a new bank j connects with an existing bank i depends
on the connectivity of the bank i (ki), i.e. π = 𝑘𝑖 / ∑𝑗 𝑘𝑗 4. (Barabasi & Albert
1999; Moreno, Pastor-Satorras & Vespignani 2002; Keeling & Eames 2005; Albert & Barabasi 2002; Newman 2003) It is noteworthy that although banks create
equal numbers of linkages when entering the network, the final number of individual banks’ linkages differs. Some banks will have more connections than others.
3F
2.3
The relationship between bank capital, lending and
the macroeconomy
The impact that variations in bank capital can have on bank lending and ultimately on the real economy and business cycles have been widely studied, especially
in relation to the US and previous downturns. But the global financial crisis and
the implementation of new regulatory requirements brought the issue back to the
frontline of research. The following chapters give an overview, first, of studies
examining how different shocks affect banks' lending, and secondly, on papers
disentangling the impacts of changes in bank lending on the macro economy.
2.3.1
Bank capital, liquidity and funding in relation to bank lending
Since the beginning of the financial crisis banks’ operating environment has
changed drastically, and banks have been confronted with pressures such as declining profitability, new capital requirements, disruptions in banks’ access to
funding and the sovereign debt crisis. These shocks influence banks’ capital and
liquidity positions and induce banks to modify their balance sheets by increasing
core capital, adjusting the security portfolio and reducing risk-weighted assets. As
banks mediate funds from sectors with surplus to those with capital shortfall,
4
The probability has the following conditions: πi = [0, 1] and ∑πi =1.
Acta Wasaensia
7
banks and bank loans to private sector are a vital piece of a well-functioning
economy. Different shocks may nevertheless be multiplied or attenuated in the
financial system owing to incompleteness of the financial markets and financial
frictions. Consequently, financial intermediation is distorted. Research on the
relationship between bank characteristics and financial intermediation often relates to studies on bank lending channels, sharp contractions in banks’ credit supply (so called credit crunches) and implementation of the Basel Accords.
First, extensive academic research exists on the impact of capital regulation (so
called Basel Capital Accords) on credit supply. The research has mainly been
conducted in relation to US banking markets, but some evidence exists also for
European banks. In general, changes in bank capital have been shown to impact
banks’ willingness to lend. Regarding the implementation of Basel I, empirical
papers demonstrate that new risk-based capital standards were a significant factor
in explaining the decrease in lending (business lending, in particular) and the
credit crunch of the early 1990s in the US. These papers also indicate that banks
with capital constraints cut back lending more quickly than their better-capitalized
competitors. (See Bernanke & Lown 1991; Hancock & Wilcox 1993 & 1998;
Hancock, Laing & Wilcox 1995; Berger & Udell 1994; Brewer, Kaufmann &
Wall 2008; Hall 1993; Wall & Peterson 1995; Peek & Rosengren 1995a, 1995b,
1997 & 2000; Brinkmann & Horvitz 1995; Shrieves & Dahl 1995) Individual
bank’s responses to changes in capital seem to be determined also by bank size.
For instance, Hancock, Laing & Wilcox (1995) find that the capital shocks affected banks’ total portfolio size and their holdings of loans for 2–3 years, and that
large banks were able to adjust their portfolios faster than small banks. Also,
Hancock & Wilcox (1998) show that small banks shrank their portfolios considerably more than large banks in response to the decline in their own bank capital.
Studies with European data are very limited. Takala & Viren (1995) studied the
potential role of changes in bank capital on bank lending in the UK and in Finland. They provided some evidence of a credit crunch. However, Vihriälä (1997)
does not find evidence for Finland that would support the credit crunch hypothesis.
Similarly, Basel II requirements have been shown to increase the volatility of
bank lending, especially for undercapitalised and less liquid banks (ECB 2007;
Jacques 2008). Also the latest analysis on the forthcoming implementation of Basel III have concluded that the increase in capital requirement as well as the implementation of minimum liquidity requirement could exert a negative impact on
banks’ lending volumes (BIS 2010a).
8
Acta Wasaensia
Secondly, research on bank lending channels provides further evidence that the
banks’ financial position and changes in operating environment affect banks’
lending in Europe and in the euro area. (see, for instance, Altunbas, Gambacorta
& Marques-Ibanez 2010; Gambacorta & Mistrulli 2003; Gambacorta & MarquesIbanez 2011; Gambacorta 2005; Jimenez et al. 2012; Hülsewig, Mayer,
Wollmershäuser 2006). The lending of well-capitalised banks is shown to decline
less than the lending of less-capitalised banks. Moreover, banks with relatively
more liquid asset holdings and better funding positions can contain the negative
effects of a shock and are in a better position to shield their loan books than banks
with less liquid assets. Low-funded banks only adjustment mechanism is to restrict the provision of loans to the economy. In line with research on the impact of
Basel Accords, individual bank’s response to changes is conditional on the bank
size, as small banks are less able to replace their balance sheet items than large
banks. (Gambacorta & Marques-Ibanez 2011) Similar evidence exists also for the
US (see, for instance, Kishan & Opiela 2000 and 2006)
Regarding the impact of the global financial crisis, Cihak & Brooks (2009) show
that euro area banks’ loan supply responds negatively to weakened soundness of
banks, measured by the capital ratio or deposits-to-loans ratio. Puri, Rocholl &
Steffen (2011) examine German banks in the aftermath of the global financial
crisis. Banks that encountered either a capital or funding shock during the crisis
rejected substantially more loan applications and reduced their domestic lending
more than the non-affected banks. In the case of capital shock, the results are particularly strong for smaller and more liquidity-constrained banks. Similar evidence is also provided by Aiyar (2011), showing that a reduction in banks’ external funding caused a contraction in lending. Especially foreign subsidiaries and
branches reduced lending and reacted more to the funding shock than UK-owned
banks. In a similar vein, US banks that were vulnerable to credit-line drawdowns,
reliant on short-term debt and had limited access to deposit financing reduced
their lending more than their counterparts during the latest financial crisis (Ivashina & Scharfstein 2010).
Thirdly, Berrospide & Edge (2010) and Francis & Osborne (2009) have used partial adjustment models and information on banks’ target capital ratios to examine
how banks’ capital targets impact bank lending. By analysing US banks, Berrospide & Edge (2010) find relatively modest effects of bank capital on lending and
a more important role for factors such as economic activity and the perceived
macroeconomic uncertainty. Francis & Osborne (2009) concentrate on UK banks
and find that banks with surplus (shortfall) of capital relative to their target tend to
record higher (lower) credit growth. More recently, Kok & Schepens (2013) applied a similar method to analyse European banks. Their findings are similar to
Acta Wasaensia
9
those of Berrospide & Edge (2010) and Francis & Osborne (2009), indicating low
credit growth for undercapitalized banks during the recent financial crisis.
2.3.2
Bank lending and the macro economy
As changes in banks’ loan supply conditions affect the availability of credit and
firms’ capacity to obtain funding, declining bank lending may have negative repercussions on firms’ potential to invest. While investment supports economic
growth, a lack of such may have adverse effects on the macro economy, business
cycles and GDP growth. The impact of bank loans arises from the fact that many
small lenders such as small and medium size enterprises are bank-dependent and
are unable to substitute bank loans with other forms of financing.
Most of the research on macro-financial linkages has previously concentrated on
the US. While the evidence is to some extent mixed, most of the recent papers
suggest that shocks to credit markets and banks’ capital lead to a reduction in
credit availability and subsequent fall in GDP. Bayoumi & Melander (2008) build
a stylized model and apply a stepwise estimation process to assess the impact of a
negative shock to the equity ratio. They estimate that a one percentage point decline in the equity ratio of US banks leads to a 1.5 percent fall in GDP. Similarly,
Lown & Morgan (2006) find that a 16 percent tightening of credit standards leads
to a 1 percent decline in GDP. Analogous effects are demonstrated by Swiston
(2008) who shows that a net tightening of credit standards of 20 percentage points
reduces economic activity by 0.75 percent after one year and 1.25 percent after
two years. Peek, Rosengren & Tootell (2003) identify a significant positive effect
of loan supply on GDP in general and on business inventories, which is a major
component of GDP, in particular. However, Driscoll (2004) finds no statistically
significant effects of bank loans on output, albeit the multipliers in the estimations
have the right (negative) sign.
Helbling et al. (2011) examine the importance of credit market shocks in the context of global business cycles in G-7 countries by estimating a VAR model. The
shocks are shown to be important in driving economic activity, especially during
the latest financial crisis. These results are similar to those of Bernanke (1983)
and Bordo & Haubrich (2010) who show that financial crises have negative effects on financial intermediation and exacerbate cyclical downturns.
The evidence regarding the euro area indicates that a reduction in lending slows
the growth of euro area GDP. Using data from ten EMU member states for
1999Q1−2010Q4, Rondorf (2012) finds strong evidence that changes in loan supply cause output fluctuations in the euro area. Moreover, Cihak & Brooks (2008)
10
Acta Wasaensia
and Calza & Sousa (2005) have showed that a cutback in loan supply is likely to
have a negative impact on real economic activity in the euro area. Based on the
estimated effects on real economic activity, Cappiello et al. (2010) also point to
the potential negative impacts of euro area banks’ losses and balance sheet deleveraging on euro area real GDP. Their results indicate that a 5 % decrease in euro
area credit growth below the euro area average would result in a long-run real
output reduction of 1.6%. Using data on 35 European countries Buch &
Neugebauer (2011) find that changes in lending by large European banks have a
significant effect on GDP growth. The negative shock explains about 16% of the
short-run, cyclical variation but less than 1% of long-run growth differences between countries. Regarding individual country results in Europe, the significance
of bank loans on output has been proven by Anari et al. (2002) for Finland.
Acta Wasaensia
11
3 FINANCIAL CRISES
Financial crises have a long history, starting in early 1600 with events such as the
Tulipmania and South Sea Bubble. Despite of advanced technology, new economic theories and increasing knowledge of market participants, the 20th century
has also witnessed many new crises, including the stock market crash of 1929,
Nordic banking crisis and the latest financial crisis in the US and in Europe.
(Reinhart & Rogoff 2009a; Kindleberger & Aliber 2011)
The run-up to a financial crisis is often characterized by recognizable features that
are classic telltales of banking crises. Usually, factors such as financial deregulation, abundant refinancing opportunities for banks, over-borrowing of firms and
households, ballooning asset and real estate prices, excessive risk taking, negative
macroeconomic shocks as well as lack of adequate risk management, policy and
supervisory measures have played a role. At the outset of the crisis, confidence
collapses, lenders withdraw and leveraged debtors find it ever more difficult to
roll-over short-term debt. Banks are especially vulnerable for the wholesale run as
they traditionally borrow short-term and lend long-term. At the same time, financial institutions are often compiled to sell their assets at distressed prices (i.e. fire
sales) which nevertheless fail to fulfil the liquidity need. Owing to declining asset
prices and worsening macroeconomic conditions banks' losses start to cascade.
Depositor runs are also not uncommon. To safeguard the functioning of the financial system, governments are forced to step in and provide massive and often very
expensive bailouts, increasing the cost to society as a whole. (Reinhart & Rogoff
2009a; Kindleberger & Aliber 2011)
The following sections shortly recount the story of the crises that form a background for the articles of this doctoral dissertation. The story of the Finnish banking crisis lays foundations for the first article, while the recent global financial
crisis forms a background for the second, third and fourth articles.
3.1
The Finnish banking crisis in the 1990s
The systemic banking crisis in Finland took place in the beginning of 1990s and is
classified as one of the worst banking crises (so-called “Big 5” crises) in postWWII era by Reinhart & Rogoff (2009b). Owing to the crisis Finnish GDP decreased by 10% in 1991–1993. The Finnish crisis shares several common features
with financial crisis in general and with other Nordic banking crises in particular.
(See, for instance, Heffernan 2005, Llewellyn 2002, Jonung, Kiander & Vartia
12
Acta Wasaensia
2009, Englund 1999, Nyberg & Vihriälä 1994, Honkapohja & Koskela 1999 and
Koskenkylä 1994)
The building blocks for the credit boom were laid in mid-1980 with the deregulation of the Finnish banking sectors that expanded banks' choice set of assets and
liabilities. First, banks were allowed to set lending and deposit rates without any
guidance from authorities. At that time, inflation was often higher than bank lending rates, real interest rates were negative and the demand for credit was high.
Secondly, the interbank market was established in 1986, providing a new funding
source for Finnish banks. As the securities markets had previously been almost
non-existent, banks’ credit supply had been bound by traditional deposit funding.
Henceforth, banks could finance the growing lending stock with market funding
from domestic and foreign sources. From 1980 to the peak year of 1989 the loan
stock of Finnish banks quadrupled. Thirdly, restrictions on capital imports were
eliminated so that the private sector could borrow from abroad. (Vihriälä 1997;
Nyberg & Vihriälä 1994; Kuusterä & Tarkka 2012; Jonung, Kiander & Vartia
2009)
Private sector debt accumulated as real interest rates were low, the real economy
was growing and general optimism increased the loan demand that had been suppressed during the regulation era. The demand was further boosted by tax rules
that allowed a loan’s interest expenses to be deduced from personal taxable income, making borrowing attractive for households. Banks also competed fiercely
over market shares in private sector lending. Especially foreign-denominated
loans were easy to sell because their interest rates were lower than those of markka-denominated loans. Foreign currency lending was further supported by a general trust in the pegged exchange rate regime. (Vihriälä 1997; Nyberg & Vihriälä
1994; Kuusterä & Tarkka 2012; Jonung, Kiander & Vartia 2009)
The credit expansion together with favourable economic conditions fed into asset
(and especially housing) prices, which in turn magnified the demand for loans.
The economy over-heated, inflation rose and wages increased. The weakened
price competitiveness and loss of market shares led to declining exports and a
deteriorating current account. To rein in domestic demand the Finnish government started to tighten fiscal policy and the central bank introduced a special reserve requirement in order to penalise banks' credit growth. The economy slowed
down and real interest rates turned positive, leading to a decrease in private investment. The boom came to an abrupt halt during the second half of 1989. Confidence in the outlook of Finnish economy deteriorated and market interest rates
increased steadily. In addition, stock and housing prices started to fall and the real
estate bubble collapsed. (Kuusterä & Tarkka 2012; Nyberg & Vihriälä 1994)
Acta Wasaensia
13
The overall economic situation was further weakened by the collapse of the Soviet Union, which negatively affected Finnish exports. As a result, output and employment decreased sharply, domestic demand declined, corporate profitability
plummeted and the bankruptcies increased. The change in the economic and financial outlook put the credibility of the pegged exchange rate into question and
the capital inflow was reversed. For some time, authorities tried to defend the
exchange rate but eventually were forced to first devaluate the Finnish markka in
November 1991 and then let the currency to float in September 1992. Raising
interest rates, the devaluation and rising unemployment reduced the capacity of
private sector to service its (often foreign-denominated) debt. Banks' traditional
loan losses started to accumulate. In addition, declining asset values meant lower
collateral values, increasing banks’ losses in the case of a default. As banks' income was further squeezed by declining fee income, the first signs of bank distress and negative results for the financial year emerged. (Nyberg & Vihriälä
1994; Jonung, Kiander & Vartia 2009)
The first bank to get into difficulties was Skopbank whose profitability weakened
already in the course of 1989. Together with savings banks, Skopbank’s lending
had increased aggressively during the boom years and it held significant securities
and real estate holdings. It also owned industrial companies, of which Tampella
group was the most important. As the economic climate deteriorated and Tampella and other firms encountered severe profitability problems, the losses on
risky exposures weakened the financial standing of Skopbank. Owing to increasing difficulties, a special restructuring plan for Skopbank was drawn by the authorities, and savings banks that hold a majority share of Skopbank increased the
bank’s equity capital. In addition, Skopbank’s funding had been highly dependent
on the short-term money markets and interbank markets. When Skopbank’s loan
losses soared, markets became highly suspicious of Skopbank’s ability to fulfil its
obligations. The lack of confidence prevailing on money markets increased and
finally Skopbank’s liquidity collapsed in September 1991 when other banks refused to buy Skopbank’s certificates of deposit. To prevent the whole banking
system from collapsing, the central bank took over Skopbank. (Kuusterä & Tarkka 2012; Vihriälä 1997; Nyberg & Vihriälä 1994; Kuusterä 1995)
Overall deterioration of the economy and increasing loan losses placed a heavy
burden also on other major Finnish banks. Worst hit were the savings banks that
had continued to expand their lending even as late as 1991. A significant part of
their lending was denominated in foreign currencies, thus making clients vulnerable to the depreciation of Finnish markka. In addition, the savings banks had substantial investments in failing Skopbank’s shares, which had become virtually
worthless. In the first half of 1992, savings banks that were on the brink of col-
Acta Wasaensia
14
lapse merged into the Savings Bank of Finland (SBF). As loan losses doubled and
the costs of market funding increased SBF’s financial standing continued to deteriorate over the rest of the year. Ultimately, SBF was not able to follow its special
recovery plan and the bank was split into four parts and sold to competitors in
October 1993. The troubled assets of SBF were moved to an asset holding company, Arsenal. (Vihriälä 1997; Jonung, Kiander & Vartia 2009; Kuusterä 1995;
Kuusterä & Tarkka 2012)
To support the faltering banking system the Finnish government bolstered the
capital base of the deposit banks with a large capital injection in early 1992. Nevertheless, bankruptcy loomed for a relatively small commercial bank, STS-bank,
in November 1992. The government took over the bank’s risky assets and the
remaining assets of STS-bank were sold to Kansallis-Osake-Pankki (KOP). To
stem the erosion of confidence in the Finnish banking system, Finnish parliament
guaranteed all financial commitments of the Finnish deposit banks in February
1993. 5 Despite the gradual improvement in the situation, the remaining banks
continued to post substantial losses in 1994 and 1995. Owing to erosion of the
capital base, two large banks, KOP and Unitas, merged to form Merita Bank in
1995. The cooperative banking group also suffered large losses but was eventually able to survive due to their more conservative strategy and the Group's joint
responsibility in dealing with loan losses. (Vihriälä 1997; Jonung, Kiander & Vartia 2009; Kuusterä 2002; Kuusterä & Tarkka 2012)
3.2
3.2.1
The financial crisis from 2007 onwards 6
The building blocks of the crisis
After a relatively long period of financial stability, the collapse of the sub-prime
mortgage market in the US sent shock-waves throughout the banking systems of
many advanced economies and initiated the global financial crisis in 2007. The
crisis had its origins in increasing house prices, abundant liquidity, low interest
rates, mitigation of financial regulation, financial innovation and new financial
5
6
A new authority, the Government Guarantee Fund, was established to support the ailing banking sector. Before, companies such as Arsenal, Solidium, Scopulus and Sponda had already
been established to deal with banks’ problem assets and banks that had been taken into custody.
In addition to the stated references, this section is based on Financial Crisis Inquiry Commission (2011), Brunnermeier (2009), Coeuré (2012) and Kindleberger & Aliber (2011).
Acta Wasaensia
15
products (originate-and-distribute model and securitization). All of these factors
led to a credit boom and households’ excessive debt burden.
The seed for the financial crisis was the granting of home loans to customers who
did not have adequate credit history or had a greater risk of defaulting (e.g. subprime customers). 7 Although subprime customers paid higher interest rates than
better quality borrowers, the loans were still affordable because the prevailing
interest rate level was low, the economy was relatively stable and rising house
prices provided better-quality collateral. Moreover, the loans were often adjustable-rate mortgages (ARMs) with low initial payments (“teaser rate”). When interest rate on the original loan increased, borrowers refinanced it with other ARMs.
Another building block was the originate-and-distribute business model. Housing
loans were now only originated by a bank or a broker, and in the subsequent stage
most of the loans were sold to other (financial) institutions. 8 The financial institutions then issued securities that were backed and guaranteed by a pool of both
prime and subprime mortgages (mortgage-backed securities, MBS) that they had
bought. These securities were subsequently divided into different categories
(“tranches”) that were rated by rating agencies (Moody’s, S&P and Fitch) on the
basis of their riskiness. The higher the risk and the lower the credit rating, the
higher the interest rate on the tranche. Investors worldwide provided a solid demand for MBSs because of the relatively high interest income in a low-interestrate environment.
Despite the high returns, the tranches with the lowest credit ratings were often
hard to sell and therefore kept by the issuing financial institutions. The solution
came in the form of collateralized debt obligation (CDO) which provided a way
of repackaging tranches. Instead of being backed by mortgage loans, they were
now backed by lower-rated MBSs. Owing to claimed diversification effects 9 a
large portion of CDOs got high credit ratings. As markets evolved, more and
more exotic securities were composed such as synthetic or hybrid CDOs, which
contained no actual tranches of mortgage-backed securities or other CDOs.
7
8
9
The sub-prime borrowers were not fulfilling standard credit criteria and had a reduced debtservicing capability owing to, for instance, lack of permanent job, divorce and the like.
In the traditional banking model banks kept the mortgages on their books and therefore had an
incentive to monitor loan performance.
Although subprime mortgages were risky by their very nature, the subprime mortgages from
different geographical areas were assumed to perform, on average, better than individual
loans. If one security went bad, the second had only a very small chance of defaulting at the
same time. The investments were also considered safe due to the good credit ratings.
16
Acta Wasaensia
The final layer was composed of insurance companies that provided insurance in
the form of credit default swaps (CDS). The buyer of a CDS contract would pay a
premium-like payment to the issuer of the CDS who promised to reimburse any
losses on the underlying asset (for instance, MBS or CDO) in case of default.
Such protection made the asset-backed securities attractive for investors because
securities seemed to be almost risk free but offered relatively high returns. At the
same time, the swap enabled banks to neutralize credit risks (related to CDOs and
MBSs that banks had kept themselves) and thereby hold less capital against assets. Because CDSs were not regulated insurance products, the insurers did not
need to hold capital against possible losses either.
During the first half of the 2000s the housing market boomed, and subprime
mortgage lending and securitization grew rapidly in the United States. Many big
American commercial and investment banks, mortgage lenders, money market
and hedge funds, insurers and government-supported enterprises (GSEs) were
involved in the subprime business. Everyone involved had an incentive to keep
the machinery humming as they collected volume-based fees. Securitization was
also viewed as an efficient way to allocate risk to those best able and willing to
bear it. The business was almost always conducted via nonbank subsidiaries,
leaving it beyond regulatory scrutiny. However, the lending standards slowly
eroded during the years and an increasing number of loans were granted for lower
and lower quality customers. At the same time, the share of subprime mortgages
in MBS pools grew, eroding the ultimate quality of the securities. Although the
housing prices peaked in the United States in mid-2006, things remained unchanged for a year or so. Especially the synthetic CDO market ballooned, as it
provided a means to bet for and against the mortgage market. Investors could
make money as long as the MBSs performed, but they stood to make even more
money if the entire market collapsed.
3.2.2
The impact of the crisis in the United States
The financial crisis started in 2007 when the US subprime mortgage market toppled. Housing prices declined and households found it difficult to refinance their
subprime loans. As households were unable to make mortgage payments, delinquencies rose rapidly and borrowers started to default in large numbers across the
US. The collapse of the housing market proved that MBSs were highly correlated
and thus the alleged diversification benefits were virtually non-existent. Owing to
the deteriorating situation, rating agencies downgraded the credit ratings of lowrated securities. The action alarmed investors and the value of all securities started to decline, reflecting the higher probability that investors would not receive
Acta Wasaensia
17
any return as the underlying mortgages defaulted. Due to “mark-to-market” accounting rules 10 the plummeting values of securities induced losses for financial
institutions, investors and MBS and CDO originators that were keeping the instruments on their books.
Market participants became increasingly aware of subprime risks and in spring
2007 the uncertainty cornered two Bear Stearns’ mortgage-focused hedge funds.
As the value of the hedge funds’ portfolios declined, funds’ financiers and (repo)
lenders 11 required more collateral against money lent to the funds (i.e. they made
margin calls). To raise liquidity, funds had to sell bonds and assets at distressed
prices. Simultaneously, funds’ investors began to request redemptions amidst
rising subprime worries. The funds were squeezed from two sides and both of
them filed for bankruptcy in July 2007.
During the second half of 2007 the situation started to unravel and financial institutions reported first losses from their mortgage-related business lines. Owing to
heightened mistrust, market participants wanted nothing to do with mortgagerelated assets and limited their counterparty exposures. Especially lenders that
provided liquidity to the commercial paper and repo markets became unwilling to
fund institutions with significant subprime exposures, and the discrimination
against bad and good companies increased steadily. Disruptions spread quickly to
other money market instruments, and market participants increasingly hoarded
liquidity. The liquidity squeeze especially affected institutions that had relied on
short-term money markets for funding. These institutions were structured investment vehicles (SIVs) and money market funds, but also mortgage lenders such as
Countrywide 12. Due to funding problems, banks were forced to bail out their
money market funds and commercial paper programs, bringing the mortgage assets onto their own balance sheets and transferring losses into the commercial
banking system. To ease the run and to help banks to borrow US dollars the FED
and the European Central Bank (ECB) provided additional liquidity to markets by
means of currency swap lines in December 2007.
10
11
12
These accounting rules required firms to use market values of securities when they valued
their holdings on balance sheets (even though firms had no intention to sell the securities). As
market prices declined, firms had to reflect this loss of value in their financial statements.
Repurchase agreements (repo) are money-market instruments that are used to obtain overnight
funding from wholesale markets. In the deal the borrower sells (government) securities to a
lender and receives cash. Simultaneously, borrower agrees to buy the securities back with a
margin next day.
Bank of America announced the takeover of Countrywide on 11 January, 2008.
18
Acta Wasaensia
One of the first victims was the investment bank Bear Stearns that came under
increased scrutiny by its counterparties. Renewal of the bank’s short-term financing became more and more difficult and Bear experienced a massive fall in its
liquid assets in one week. With depleted liquidity the company was in no position
to continue and on 16 March 2008 Bear Stearns was bought by JP Morgan in a
government-assisted deal. 13 Despite of a brief respite, the signs of strain soon
emerged among government-sponsored enterprises (GSEs) who were large mortgage originators. Owing to declining house prices and rising delinquencies the
mortgage assets were losing value and huge loan losses depleted GSEs’ capital.
IndyMac Bank was closed on 11 July 2008, while Fannie May and Freddie Mac
were taken over by the government on 7 September 2008. 14
After the failure of Bear Stearns and GSEs, market suspicions were directed at the
value of Lehman Brothers' real-estate related investments and its reliance on
short-term funding. Another big concern was the firm’s numerous derivative contracts. Although the company improved its liquidity and capital position throughout the summer 2008, Lehman’s problem was the lack of market confidence. Similarly to Bear Stearns, Lehman’s liquidity dried up. Ultimately, the rescue efforts
failed and Lehman Brothers filed for bankruptcy on 15 September 2008. Meanwhile, the management of investment bank Merrill Lynch had acknowledged the
bank's increasingly difficult position and was afraid that Merrill would be the next
in line of collapsing dominos. A private deal was struck with Bank of America,
which acquired Merrill Lynch on 15 September 2008.
During the intensification of the crisis in fall 2008, mortgage defaults multiplied,
more and more mortgage-related assets were downgraded and losses of financial
institutions skyrocketed. But financial institutions had bought CDSs (i.e. insurances against the losses) from insurance companies. As many insurance companies were operating with very small capital buffers, their ability to honour their
obligations was brought into question. Of greatest worry was AIG, which backstopped the market in CDOs. 15 As a result, AIG had difficulties to refinance itself
from markets during the second week of September. At the same time, it had to
13
14
15
Federal Reserve Board agreed to purchase a part of Bear’s assets to get them off the firm’s
books, while the rest of Bear was sold to JP Morgan.
As the value of shares of existing private shareholders was effectively wiped out in the takeover, the following losses caused many small banks (that held the shares of Fannie May and
Freddie Mac) to fail.
Also monoline insurers provided coverage for MBSs, and some of these institutions had faced
solvency problems already in spring 2008. As a consequence, the monolines’ role as guarantors for auction rate securities (often referring to as long-term municipal bonds) was questioned, and the crisis spread to the previously unimpaired market for municipal bonds.
Acta Wasaensia
19
fund its own commercial paper programs since investors did not want to have
unsecured exposures to AIG. As the situation worsened, AIG and the FED tried to
negotiate a solution, but no deal materialized. When all three rating agencies
downgraded AIG on 15 September, the FED was forced to bail out the firm on 16
September 2008.
After the failure of Lehman Brothers and AIG, a major loss of confidence occurred in financial markets, panic spread and the crisis reached seismic proportions. Many money market funds and other market participants that had held
Lehman’s papers suffered losses. Investors pulled back from every susceptible
fund and also from funds that did not have direct exposures with Lehman. Funds,
in turn, pulled money out of short-term money markets, putting further pressure
on investment banks and financial companies dependent on short-term funding. A
liquidity crunch ensued. Due to the opaqueness of banks’ balance sheets, no-one
really knew how heavily each institution was exposed and to what extent the losses were to materialize. Market participants became uncertain as to the financial
health of their counterparties. As difficulties of a bank could have affected each
and every bank in the interbank network, banks limited their interbank exposures
and even refused altogether to lend to one another.
Investment banks Morgan Stanley and Goldman Sachs as well as savings bank
Washington Mutual Bank (WaMu) were able to withstand the wholesale run by
counterparties, customers and funds for a week. But a massive withdrawal of
funds was about to force them into bankruptcy. On 22 September 2008 Morgan
Stanley and Goldman Sachs became bank holding companies. The change of status allowed them to resort to central bank liquidity support programs. WaMu collapsed on 25 September 2008 and it was seized by the US government. The banking business was sold to JP Morgan, while the holding company (together with
unsecured receivables) filed for bankruptcy. Losses of WaMu’s unsecured creditors created a panic among unsecured creditors of other struggling banks and especially Wachovia. The day after the failure of WaMu, uninsured depositors accelerated the withdrawals and wholesale fund providers withdrew liquidity support from Wachovia. Finally, the bank merged with Wells Fargo. At the height of
the market turbulence, central banks were forced to step in and provide unprecedented liquidity support for the financial system in September-October 2008. 16 In
addition, big banks (Citigroup, JP Morgan, Wells Fargo, Bank of America, Merrill Lynch, Goldman Sachs, Morgan Stanley, BNY Mellon and State Street) re-
16
In addition to liquidity lines, US government announced large support packages such as Troubled Asset Relief Program (TARP) on 3 October 2008.
Acta Wasaensia
20
ceived capital injections from the US government. Citigroup and Bank of America also received additional support when the US government provided a guarantee for banks’ troubled assets. 17
3.2.3
The impact of the crisis in Europe
The shock waves from the US subprime crisis spread quickly throughout the
global financial market during the first part of 2007. As a consequence, European
banks also started to limit their exposures to subprime-related investments and
counterparties with large exposures. One of the first to be directly affected by the
subprime crisis was a German bank, IKB Deutsche Industriebank. IKB's fund,
Rhineland, had specialised in buying structured credit instruments such as CDOs.
Due to large exposures to subprime instruments, Rhineland was no longer able to
get funding from the markets in July 2007. To secure fund's liquidity, IKB provided a credit line to Rhineland. Consequently, IKB's own financial position severely deteriorated, and it had to be bailed out by IKB's largest shareholder, KfW
Bankengruppe. Owing to mounting losses, the value of three investment funds of
a French bank, BNP Paribas, plunged. As a result, BNP Paribas suspended redemption of these funds on 9 August 2007. Together with other central banks'
liquidity operations, the European Central Bank stepped up measures to ensure
the functioning of interbank markets. (Financial Crisis Inquiry Commission 2012;
Cour-Thimann & Winkler 2013)
The emerging shortage of international liquidity put serious pressure on several
European banks that had been reliant on short-term money markets to finance
their business. Especially in the United Kingdom several (mortgage) banks and
building societies faced difficulties. At the same time, mortgage-related losses
increased in the UK. Northern Rock received liquidity support from the Bank of
England on 14 September 2007. As the news broke out, a bank run followed,
forcing the central bank to guarantee all deposits in Northern Rock. The bank was
eventually nationalised on 17 February 2008. Owing to solvency problems, Alliance & Leicester accepted a takeover bid by Santander on 16 July 2008, whereas
HBOS and Lloyds announced a merger on 18 September 2008. In addition, Bradford & Bingley had to be rescued on 28 September 2008. 18
17
18
Government agreed to cover a major part of losses that might arise from banks’ predetermined
assets (mainly loans and mortgage-backed securities).
The bank was partly nationalized as UK government took over the mortgage book, treasury
assets and wholesale business of the bank. Santander bought the bank's savings business and
branch network.
Acta Wasaensia
21
September-October 2008 saw a constant wave of European bank failures owing to
the global liquidity squeeze. The home-grown imbalances, excessive credit
growth and funding mismatches started to unravel. Banks’ earning capacity and
capital were eroded by declining values of subprime-related securities and investments, home-made mortgage related losses as well as high refinancing costs.
Benelux countries were first in the line of fire. On 28 September 2008 Fortis was
rescued in a joint effort by the governments of Belgium, the Netherlands and
Luxemburg. The bank had taken over ABN Amro and as the deal had weakened
Fortis's solvency buffers the bank's ability to finance the acquisition had been
questioned. The takeover had also proved unsuccessful, as the value of ABN Amro declined soon after the deal. Two days later, Dexia received a large bailout
from Belgian, French and Luxembourg authorities. The bank's ability to finance
its long-term municipal lending had been severely hampered. In addition, large
potential subprime-related losses from Dexia’s US subsidiary FSA threatened to
deplete Dexia’s capital. Eventually, Dexia was dismantled into three parts; Belgium bought and nationalised Dexia Belgium, the Luxembourg unit was sold to
private investors and Dexia's French municipal finance operations came under
French state control.
On 29 September 2008, a German lender Hypo Real received a liquidity lifeline
from the German central bank and a consortium of German banks. The bank's
position weakened due to heavy losses from its Irish subsidiary, Depfa Bank 19.
While short-term financing was not available, Hypo did not have sufficient liquidity reserves to bridge the funding gap. As the situation deteriorated further, private sector players withdrew their support and Hypo Real was finally taken over
by the German government in 2009.
Iceland’s banking sector was hit especially hard owing to Icelandic banks’ rapidly
grown (foreign exchange) lending to the private sector, large dependence on foreign and market liquidity as well as inadequate capital to cover losses. As the
banking sector had grown rapidly prior the crisis, the central bank of Iceland was
unable to act as a lender of last resort for the banks and supply the foreign currency that the banks needed. The three main commercial banks (Kaupthing, Glitnir
and Landsbanki) eventually collapsed and were taken under government receivership on 6 and 7 October 2008. (Nielsson & Torfason 2012)
19
In addition to public sector financing, Depfa underwrote US municipal bonds that had their
ratings downgraded during the crisis. Under the terms of the underwriting, Depfa was required
to buy back the securities after the downgrade. Because of the difficulties in obtaining shortterm funding in the markets at that time, Depfa's liquidity became a major concern.
22
Acta Wasaensia
Throughout the rest of the year 2008 European banks continued to lean on government support and to tap new capital from state rescue packages. In order to
facilitate banks’ refinancing, many governments also extended guarantees on
bank bonds. On 13 October 2008 UK government designated a rescue scheme
and injected new capital into Royal Bank of Scotland, HBOS and Lloyds. While
supporting UBS, the Swiss government took responsibility for the bank’s toxic
assets, which were transferred to government owned fund. French government
gave financial support to the country’s largest lenders, including BNP Paribas and
Société Général. Other European banks to receive assistance were institutions
such as Austrian Erste, German Commerzbank, Dutch ING and Belgian KBC
Group. In return, the above-mentioned governments often received shares of
troubled banks.
In 2008, the Irish property boom came to an end and residential property prices
started to fall amidst a steadily deteriorating international financial environment.
Mortgage loans to households, as well as property and construction lending to
developers, had increased manifold during the boom period. With large exposures
to housing markets and declining property values, Irish banks' loan losses started
to materialize and their solvency position deteriorated. At the same time, they
found it ever more difficult to refinance their operations, and liquidity problems
emerged. Government was forced to step in and extend a comprehensive guarantee to all depositors and debtors of Irish banks on 29 September 2008. Despite the
guarantee, the situation of Anglo Irish bank continued to weaken, and it was
eventually nationalised on 15 January 2009. Besides Anglo Irish Bank, Allied
Irish Bank (AIB) and Bank of Ireland were recapitalised in February 2009. Towards the end of 2009, the National Asset Management Agent (NAMA) was formally established to deal with problem loans and toxic assets. (Donovan & Murphy 2013)
Together with the downturn of the global economy the European governments’
bank rescue measures increased the debt burden of already overly indebted European countries. A trigger for the European sovereign debt crisis was the disclosure of the magnitude of Greece’s fiscal deficit at the beginning of 2010. Amid
the escalation of the crisis and downgrading of the Greek sovereign debt rating,
the situation in the international financial markets deteriorated in early May 2010.
The EU/IMF financial rescue package was given to the Greek government on 1
May 2010. As the bank bailout proved to be extremely costly in Ireland, Irish
government also received financial support from EU/IMF on 29 November 2010.
Portugal also received a bailout on 16 May 2011, while Greece received a second
financial package in February 2012. In addition, the European Union granted
funds for capitalisation of Spanish banks in June 2012.
Acta Wasaensia
23
4 SUMMARY OF THE ESSAYS
The purpose of this dissertation is to examine the impact of negative shocks on
the banks and banking system. More specifically, the dissertation disentangles the
effects of credit contagion in Finnish and European interbank markets and analyses how pressures on banks’ capital and liquidity positions have affected euro
area banks’ lending and macro economy. These issues are discussed in four interrelated essays which form the main body of the study. While the essays address
the topic from different angles, a financial crisis and its potential negative repercussions form a common background for all of them. The dissertation contributes
to financial literature by providing evidence on the vulnerabilities of Finnish and
European interbank markets, the importance of network effects for financial stability and deleveraging forces in the euro area banking sector. Furthermore, it
adds to the literature by looking at the macro-financial linkages and shedding
light on the adverse effects of declining lending on economic activity. A more
specific description of the essays and their contributions is in following subchapters.
4.1
Essay 1: Interbank exposures and risk of contagion
in crises: Evidence from Finland in the 1990s and
the 2000s
Financial crises occur from time to time and generally affect negatively the financial stability of the banking sector. Crises are also often extremely costly for the
economy as a whole. From a historical perspective, relatively little emphasis has,
nevertheless, been placed on analysing how crises spread across institutions and
borders, although the recent financial crisis highlighted the importance of the interconnectedness of financial institutions. One of the possible transmission channels for financial shocks is credit contagion (or so-called domino effect) between
financial sector intermediaries in the interbank markets.
The first essay of the dissertation examines the possibility of domestic and foreign
credit contagion via Finnish banks’ interbank exposures during two distinctive
crises, namely the Finnish banking crisis in the 1990s and the financial crisis in
the 2000s. The essay contributes to the literature, firstly, by focusing on two distinctive crisis periods. The Finnish banking crisis has been classified as one of the
“Big 5” banking crises by Reinhart & Rogoff (2009b), while the recent financial
crisis had a truly global reach. Secondly, the analysis is of importance as the role
and the potential impact of contagion in the Finnish banking crisis has not been
previously discussed. The risk assessments have mainly concentrated on individ-
24
Acta Wasaensia
ual institutions and relatively little public information on network effects exist. As
bank bail-outs are often justified by potential negative spillover effects, a deeper
understanding of interbank linkages and transmission channels is therefore desirable to increase the knowledge of system-wide effects. Finally, as public information on network effects of the Finnish banking system, including the implications of foreign-based contagion, is almost non-existent, the essay contributes by
identifying national and cross-border vulnerabilities of the Finnish banking system. The specific case of a small open economy such as Finland is interesting
because of the vulnerability to cross-border risks. The Finnish banking sector is
highly concentrated and nowadays dominated by foreign banking groups, making
Finland a prominent example for other similar banking systems. A deeper understanding of interbank linkages and transmission channels is thus highly desirable.
The credit contagion is analysed, first, by using the method of entropy maximization to estimate interbank relationships between banks and, secondly, by simulating the domino effects with a sequential (or round-by-round) algorithm (see, Upper & Worms 2004; Upper 2011). Entropy maximization denotes the most likely
outcome given a priori knowledge and it has been used to fill in the gaps of data
sets. In the present context, the outcome of the estimations thus corresponds to the
most likely structure of interbank lending given all the a priori pieces of information on the interbank market. In the simulations, the scope of contagion is estimated by letting banks go bankrupt one at a time. If a bank's losses from interbank loans to the failed bank are greater than the lender's own capital, the lender
defaults. Contagion need not be confined to such first-round effects, but a failure
of the first bank can trigger a whole chain of consequent failures (domino effect).
Therefore, both direct and indirect exposures to the failing bank are taken into
account. The methodology has been widely applied, and similar studies are done
for the Swiss, Belgian, English, Dutch, British and Italian interbank markets.
(Sheldon & Maurer 1998; Degryse & Nguyen 2007; Wells 2004; van Lelyveld &
Liedorp 2006; Mistrulli 2011)
The data set covers Finnish deposit banks in 1988–1996 and 2005–2011. For
2005–2011 the analysis is based on balance sheet, counterparty exposure and liquidity risk data, whereas for 1988–1996 only balance sheet data are used, as data
on foreign and domestic counterparties and liquidity risks are not available. As
balance sheets and large exposure data do not give complete information on individual banks' actual counterparty exposures, the entropy maximization methodology has been used. Based on the estimates, Finnish banks’ bilateral exposure matrices are constructed. The danger of contagion and the effects of a bank failure in
the Finnish interbank market are subsequently simulated with the sequential algorithm.
Acta Wasaensia
25
The results suggest that during the banking crisis in the 1990s three banks out of
ten were able to trigger contagion. In 2005–2011, five large and middle-sized
banks were sources of contagion. In terms of average contagion, the fragility of
the banking system increases before the crisis irrespective of the original source
(domestic/international) of the crisis. During the 1990s the contagion would have
affected almost half of the banking system (assuming 100% loss ratio) and thus
the implications for society would have been severe without the authorities’ rescue measures. In 2005–2011, the negative shock caused by a failure of a foreign
bank (with 100% loss-given-default) affects 77% of the total assets of the Finnish
banking sector, while contagion from a Finnish bank impacts 66% of the total
assets of the sector. The sensitivity to foreign bank failures is worrying for a
country such as Finland that has large cross-border exposures with foreign banks.
Finally, the evidence indicates that the higher the concentration of the banking
system, the greater the system’s vulnerability to contagion.
Although the interbank market exhibits higher risk levels in the current crisis than
in the 1990s, a bad outcome has not materialized owing to the absence of a trigger. The macroeconomic shock was milder and more transitory in the 2000s than
in the 1990s, banks’ capital buffers are currently large, interest rates are lower
than in the early 1990s and many borrowers and lenders have learned from the
experience of the 1990s, and so acknowledge the dangers of over-borrowing.
4.2
Essay 2: Contagion in the interbank network: An
epidemiological approach
The first wave of the subprime crisis in 2007 impacted large American investment
banks but soon enough financial institutions worldwide were affected as the highly interconnected modern financial world facilitated rapid transmission of the
shock. Owing to the limited knowledge of counterparty exposures no bank really
knew how heavily each institution was exposed and to what extent losses were to
materialize. Banks’ financial interlinkages in the interbank markets combined
with potentially high counterparty losses led banks to limit their exposures, as
they were unable to distinguish good banks from bad ones. The fear of negative
impacts spread like a disease over the interbank network, ultimately causing the
interbank money markets to freeze.
The second essay studies credit contagion in the European banking sector in 2007
and 2010 by applying an epidemiological model with extensions, generated networks and actual data. The paper adds to the literature by proposing a novel approach to model the transmission and the magnitude of negative spillover effects
26
Acta Wasaensia
with an epidemiological SIR (susceptible – infected – recovered) model by Kermack & McKendrick (1927). Although the similarities between propagation of
epidemics and contagion are striking (See, for instance, May, Levin & Sugihara
2008; Haldane & May 2011; Haldane 2009) and the SIR model has already been
used to analyse the spreading of diseases, macroeconomic expectations and
transmission of economic crisis from one country to another via international
trade (Anderson & May 1991; Bansal et al. 2010; Carroll 2006; Garas et al.
2010), no such analyses, to the best of my knowledge, have been done for the
European interbank markets. While the SIR model provides a framework to analyze the consequences of an idiosyncratic bank default via direct and indirect
counterparty exposures, the model is also extended to take into account the characteristics of financial institutions. Secondly, the paper also contributes to the
literature by introducing an endogenous loss-given-default (LGD) which timedependent.
Thirdly, the essay enriches the literature by examining cross-border contagion in
Europe prior to and during the global financial crisis, as the model is calibrated
with actual data on large European cross-border banks. Fourthly, to provide more
intuition as to driving forces of the contagion process, this essay also disentangles
the importance of individual bank-specific characteristics such as size, financial
strength and position in the network for contagion. The main motivation is to find
leading indicators that are of relevance from the financial stability perspective. In
contrast to previous papers we test a large set of individual indicators. Finally, the
analysis also sheds light on the relevance of central bank actions by assessing
whether central bank interventions are helpful in containing the negative spillover
effects.
The analysis is based on balance sheet data from 51 major European cross-border
banking groups with headquarters in Germany, France, Italy, Spain, the Netherlands, Belgium, Austria, Portugal, Greece, Ireland, the UK, Denmark and Sweden
in 2007 and 2010. We also use information on consolidated banking statistics of
the Bank for International Settlements (BIS) and monetary financial statistics of
the central banks to approximate banks’ interbank exposures. The bank network is
modelled by a scale-free networks model by Barabasi & Albert (1999), as Boss et
al. (2003) and Soramäki et al. (2007), among others, have shown that real-world
interbank banking networks have the properties of scale-free networks. Furthermore, we define endogenous LGDs and bank-specific vulnerability parameters.
Based on the extended SIR model, generated networks and data, we subsequently
simulate credit contagion in the banking system.
Acta Wasaensia
27
The results show how the contagion segments European banks into two categories. A similar situation occurred during the current financial crisis when the European banking sector was divided into “good names” with an access to interbank
lending and “bad names” that were excluded from money markets by means of
larger haircuts and margin requirements. On average, contagion affects negatively
about 40% of the European banks in 2010, but considerable heterogeneity remains owing to the network structure and the characteristics of the first failing
bank. The magnitude of the contagion is almost twice as large in 2007, just before
the onset of the financial crisis. In terms of nationality, French, British, German
and Spanish banks are able to induce widespread contagion, while banks from
Ireland, Greece and Portugal have only limited negative effects on the system.
Regarding the importance of bank-specific factors, a bank's size, its central position in the network, large business volumes and bank clustering are prominent in
explaining the contagion. In particular, the weighted clustering coefficient, betweenness and closeness centrality, connectivity and volume of in-coming interbank loans are significant variables. Finally, central bank liquidity operations and
other central bank measures are effective in alleviating contagion and financial
crisis, although the impact is limited.
4.3
Essay 3: Risk, capital buffers and bank lending:
The adjustment of euro area banks
During the latest financial crisis, banks’ core capital proved to be insufficient to
cover impairment losses arising from loan and security portfolios. The shock to
equity capital was further augmented by new stringent regulatory requirements
(BIS 2010b; EBA 2011). Furthermore, in order to minimize the risk of breaching
the regulatory limit banks usually operate with an additional capital buffer (ECB
2007; Harding, Liang & Ross 2013). This voluntary buffer, together with the regulatory capital, forms banks’ internal capital target, which is not observable to the
general public. In the case of a capital shortfall, banks seek to close the capital
gap and reach their target. As banks may either increase their own funds or reduce
their exposures, the adjustment may weigh negatively on credit supply. Owing to
the financial crisis and shocks on bank capital, the banks' capacity to extend credit
to the private sector has been questioned.
The third essay of this dissertation investigates factors determining euro area
banks’ internal target capital ratios. Moreover, it analyses whether banks’ adjustment towards their targets has an impact on their assets in general and on lending
and security holdings in particular. The paper adds to the literature by analysing
28
Acta Wasaensia
the impact of capital shocks on euro area banks and by providing evidence on the
role and significance of euro area banks’ capital gaps on the credit supply. While
Francis & Osborne (2009), Berrospide & Edge (2010) and Kok & Schepens
(2013) provide evidence on banks’ capital buffers and adjustment towards internal target capital ratios in the US, in the UK and in Europe, no such evidence exist for the euro area. Another novel feature of this essay stems from the estimation
period, covering the latest financial crisis. Previous literature tends to focus on
other geographical areas and the credit crunch of the early 1990s in the US.
The analysis is based on a partial-adjustment model which consists of two separate steps. In the first step, banks' internal time-varying target capital ratios are
estimated with a panel model incorporating bank-specific factors such as loan
losses, expected default frequency (EDF), total assets and retained earnings. The
internal targets are estimated on a bank-by-bank basis. Based on the estimated
parameters, a bank’s time varying capital gap between the desired (unobserved
and internal) target capital ratio and the actual (observed) capital ratio is then
computed for each time period. The capital gap is composed both in terms of the
target Tier 1 capital ratio and the target total capital ratio. In the second step, the
banks' capital gap and macroeconomic variables are used to explain the banking
system's adjustment. A dynamic panel model is estimated for total loans and total
securities.
The data set covers euro area listed banks and country-specific macroeconomic
variables during the most recent financial crisis from the first quarter of 2005 to
the last quarter of 2011. The granular bank data refer to large and listed banks
domiciled in Germany, France, Italy, Spain, Belgium and Austria. Information on
risk weighted assets (RWAs), total assets, retained earnings, return on equity
(ROE), provisioning for loan losses, net loans, security holdings, expected default
frequencies (EDFs) and solvency ratios (Tier 1 capital ratio and total capital ratio)
are extracted for each bank at the consolidated group level. Country-specific macro variables include credit demand, gross domestic product (GDP) and stock prices. In addition, data on banks' credit standards and the expected loan demand of
non-financial corporations are included as available from the bank lending survey
(BLS) of the European Central Bank (ECB).
The results suggest that several bank-specific indicators have a positive impact on
banks’ internal target capital ratios. A substantial part of the movements in internal targets reflects changes in banks’ risks and earnings development associated
with economic conditions. Risk variables impact positively banks' internal targets,
inducing the institutions to strive for higher capital levels. Meanwhile, the coefficients of income indicators are positive but remain insignificant, in line with the
Acta Wasaensia
29
results of Berrospide & Edge (2010). The results hold both for Tier 1 capital ratio
and total capital ratio.
In terms of the derived capital gap for Tier 1 capital ratio, the aggregated euro
area banking system's undercapitalisation is close to 2.0 percentage points (p.p.)
in the middle of 2008. The negative gap diminishes towards the end of 2011 but
the heterogeneity across individual banks increases. Similar results are obtained
for the total capital ratio. Moreover, the paper provides empirical evidence that
undercapitalized banks tend to restrict the provision of loans to the economy. Estimates indicate that the closure of a 1 p.p. capital gap dampens loan growth by
2.0 to 2.3 percentage points in the medium-term. The impact on security holdings
is found to be larger, around 5.8─7.1%, thereby suggesting a pecking order for
deleveraging.
4.4
Essay 4: The impact of risk, funding and sovereign
shocks on euro area banks and economies
The financial crisis fundamentally changed banks’ operating environment and
confronted banks with increasing risks, declining profitability and weakened access to wholesale funding. Together with new capital requirements the shocks
induced banks to modify their balance sheets. External shocks and banks’ adjustment can disturb financial intermediation and reduce banks’ ability to provide
credit to non-financial corporations. The impact can be especially large in the
euro area, where debt markets are relatively small and a large part of firms' external financing is provided by banks. Moreover, Adrian & Shin (2011) have shown
that since the beginning of the financial crises banks have not only been passive
intermediaries, but banks themselves can be a source of disturbance. Indeed, the
crisis brought the role of banks to the centre stage of both policy and research
agendas.
The final essay examines macro-financial linkages in the euro area since the beginning of the financial crisis. It contributes to the literature by estimating how
risk, funding and sovereign shocks affect the total assets, corporate lending and
profitability of the banking sector as well as real economy (GDP) both at the euro
area level and in Germany, France, Italy and Spain. No such analysis on macrofinancial linkages is available for the euro area in the latest financial crisis. Previous academic literature analyses either the impact of different shocks on banks'
lending (see, for instance, Francis & Osborne 2009; Jimenez et al. 2012; Cihak &
Brooks 2009) or the impact of banks' adjustment on the macroeconomy (Buch &
30
Acta Wasaensia
Neugebauer 2011; Cappiello et al. 2010; Cihak & Brooks 2009; Calza & Sousa
2005).
The essay’s contribution also resides in the implemented methodology. We adopt
a panel VAR model, a sign restriction approach and impulse response functions to
estimate, identify and analyze the implications of the shocks. The methodology
enables us to combine individual bank level data to macroeconomic variables.
The use of bank-level data is of importance, as the idiosyncratic shocks to large
firms can explain a large share of fluctuations at the macro-level (Gabaix 2011).
As many European banking sectors are dominated by a few large banks, company-level information is extremely valuable in assessing the impact of idiosyncratic shocks. In addition, individual data provides a micro foundation to aggregate
shocks. Our sign restrictions approach also provides a flexible framework for
analysis of the dynamics and interactions between variables. Another novelty is
the coverage of the financial crisis period, providing evidence on the outcome of
severe stress on banks.
To assess the banking sector’s reactions to unexpected changes in the business
environment, we first estimate a vector autoregression model (VAR) with bankspecific indicators and macro level variables for 2005–2013. Sign restrictions are
subsequently used to identify three granular shocks that relate to increasing riskiness of banks (risk shock), banks' difficulties in obtaining wholesale funding
(funding shock), and the impact of sovereign debt crisis in Europe (sovereign
shock). We then apply impulse response functions (IRFs) in order to analyse the
individual implications of the shocks for endogenous variables and to track the
time paths of nominal shocks. Finally, the historical decompositions of responses
are composed to analyse how much of the variations in banks’ total assets, profitability and corporate lending, and in GDP growth are explained by the shocks.
The bank data set consists of large and listed banking groups that have headquarters in the euro area countries. For each bank in the sample, we extract information on total assets, risk weights, reserves for loan losses, and return on equity
(ROE). In addition, we complement the data set with country-level information
on corporate lending, the volume of bank debt and asset prices. We also add a
credit default swap (CDS) spread variable, defined as a difference between sovereign CDSs and bank CDSs at the country level. Finally, as for the macroeconomic
variables, the dataset includes quarterly real gross domestic product (GDP).
The results show that the time paths of nominal shocks capture the negative repercussions of the crisis in different banking systems and reflect the events of the
financial crisis. More importantly, the risk, funding and sovereign shocks explain
a substantial part of the variations in total assets, profitability, corporate lending
Acta Wasaensia
31
and GDP growth. At the euro area level, three shocks explain about 60 percentage
of the credit slowdown and a third of the decline in GDP in 2009. While risk and
funding shocks explain most of the variation in 2009–2010, the role of the sovereign shock remains subdued. However, the sovereign shock explains approximately 10 percent of the variation in banks’ profitability and GDP growth in
2009. During the latter part of the estimation period, all shocks continue to play a
role, albeit their contribution declines somewhat.
Over the whole estimation period, the euro area average is affected by different
country level dynamics. During the early years of the financial crisis, the contributions of shocks are substantial in Germany and France. In 2012–2013 the contributions of shocks subside in Germany and France, but they become significant
especially in Italy. Moreover, the contribution of three shocks remain relevant in
Spain during the latter part of the estimation period. Italian banks are affected by
the risk shock and Spanish banks face increasing funding pressures. Overall, the
negative implications of shocks at the euro area level are composed of the contributions of German and French banks in 2009–2011 and the contributions of
shocks to Italian and Spanish banks in 2011–2013.
32
Acta Wasaensia
5 CONCLUSIONS
This dissertation studies banks, their resilience and adjustment in the aftermath of
an adverse shock to their operating environment. Owing to banks’ important role
in financial intermediation, such shocks may be multiplied or attenuated, potentially introducing negative repercussions for the whole economy. Thus, the first
and second essays study credit contagion and its implications for the financial
stability in the banking sector. The second essay also looks at the importance of
bank-specific factors for domino effects. Looking the issue from a different angle,
the third and fourth essay shed light on the effects of banks’ adjustment to a negative shock. Finally, evidence on the implications for the macro economy is provided.
To be specific, the findings indicate that in the worst case scenario credit contagion has substantial negative effects. The first essay shows that domestic contagion affects, on average, almost half of the Finnish banking sector in the 1990s
and about 66% of the banking sector in 2005–2011. In the 2000s the failure of a
foreign bank impacts 77% of the total assets of Finnish banks. Cross-border contagion thus increases financial stability risks in a country whose banking sector is
dominated with foreign-owned banks. Similarly, the second essay demonstrates
that the average contagion affects 70% and 40% of European banks’ total assets
in 2007 and in 2010, respectively. Country-level results suggest that French, British, German and Spanish banks are the most contagious ones, whereas banks from
Ireland, Greece and Portugal induce only limited negative effects. Moreover,
bank clustering, large in-coming interbank loans, the bank’s position in the network and banks size are prominent factors in determining the magnitude of the
contagion. Finally, central banks’ interventions reduce contagion only slightly.
Shocks induce euro area banks to reduce their lending. The third essay indicates
that changes in banks’ risks and earnings influence banks’ internal target capital
ratios, and that euro area banks were undercapitalised at the eve of the financial
crisis in 2008. The adjustment towards higher equilibrium capital ratios also affects significantly banks’ assets. The impact is around 5.8─7.1% for security
holdings and 2.0─2.3% for loans, thereby suggesting a pecking order. The findings of the fourth essay confirm that risk, funding and sovereign shocks explain
substantial part of the movements in banks' total assets, profitability, corporate
lending and output growth. In 2009, shock contributions account for around 60
percentage of the decrease in corporate lending and approximately a third of the
decline of the annual GDP growth at the euro area level. While shocks exhibit a
notable impact on Germany and France in 2009–2011, they are significant for
Italian and Spanish banks only towards the end of the estimation period.
Acta Wasaensia
33
References
Acemoglu, D., Ozdaglar, A. & Tahbaz-Salehi, A. (2013). Systemic risk and stability in financial networks. NBER Working Paper 18727.
Adrian, T. & Shin, H.S. (2011). Financial intermediaries and monetary economics. In Friedman, B.M. & Woodford, M. (Eds). Handbook of Monetary Economics. Volume 3. Amsterdam: Elsevier. 601–650.
Aiyar, S. (2011). How did the crisis in international funding markets affect bank
lending? Balance sheet evidence from the United Kingdom. Bank of England
Working Paper 424.
Albert, R. & Barabasi, A.-L. (2002). Statistical mechanics of complex networks.
Reviews of Modern Physics 74, 47–97.
Allen, F. & Babus, A. (2009). Networks in finance. In Kleindorfer, P.R. & Wind,
Y. (Eds). The Network challenge – Strategy, profit and risk in an interlinked
world. Upper Saddle River, New Jersey: Wharton School Publishing.
Allen, F. & Gale, D. (2000). Financial contagion. The Journal of Political Economy 108: 1, 1–33.
Altunbas, Y., Gambacorta, L. & Marques-Ibanez, D. (2010). Bank risk and monetary policy. Journal of Financial Stability 6: 3, 121–129.
Anand, K., Gai, P., Kapadia, S., Brennan, S. & Willison, M. (2013). A network
model of financial system resilience. Journal of Economic Behaviour and Organization 85, 219–235.
Anari, A., Kolari, J., Pynnönen, S. & Suvanto, A. (2002). Further evidence on the
credit view: The case of Finland. Applied Economics 34: 3, 267–278.
Anderson, R.M. & May, R.M. (1991). Infectious diseases of humans: Dynamics
and control. Oxford: Oxford University Press.
Arinaminpathy, N., Kapadia, S. & May, R. (2013). Size and complexity in model
financial systems. PNAS 109: 45, 18338–18343.
Bansal, S., Pourbohloul, B., Hupert, N., Grenfell, B. & Meyers, L.A. (2010). The
shifting demographic landscape of pandemic influenza. PLoS ONE 5: 2, Available at:http://www.plosone.org/article/fetchObject.action?uri=info%3Adoi%2F10.
34
Acta Wasaensia
1371%2Fjournal.pone.0009360&representation=PDF [Last accessed: 2 June
2014].
Bayoumi, T. & Melander, O. (2008). Credit matters: Empirical evidence on US
macro-financial linkages. IMF Working Paper 169.
Barabasi, A. & Albert, R. (1999). Emergence of scaling in random networks. Science 286, 509–512.
Battiston, S., Delli Gatti, D., Gallegati, M., Greenwald, B. & Stiglitz, J.E. (2012).
Default cascades: When does risk diversification increase stability? Journal of
Financial Stability 8: 3, 138–149.
Berger, A. N. & Udell, G. F. (1994). Did risk-based capital allocate bank credit
and cause a “credit crunch” in the United States? Journal of Money, Credit and
Banking 26: 3, 585–628.
Bernanke, B.S. (1983). Nonmonetary effects of the financial crisis in the propagation of the Great Depression. The American Economic Review 73: 3, 257–276.
Bernanke, B.S. & Lown, C.S. (1991). The credit crunch. Brookings Papers on
Economic Activity 2, 205–247.
Berrospide, J.M. & Edge, R.M. (2010). The effects of bank capital on lending:
What do we know and what does it mean? International Journal of Central Banking 6: 4, 5–54.
BIS (2010a). Assessing the macroeconomic impact of the transition to stronger
capital and liquidity requirements. Final report of Macroeconomic Assessment
Group, December 2010, Available at: http://www.bis.org/publ/othp12.pdf [Last
accessed: 2 June 2014].
BIS (2010b). Group of Governors and Heads of Supervision announces higher
global minimum capital standards. Press release of Basel Committee of Banking
Supervision, 12 September 2010, Available at:
http://www.bis.org/press/
p100912.htm [Last accessed: 2 June 2014].
Bordo, M.D. & Haubrich, J.G. (2010). Credit crises, money and contractions: An
historical view. Journal of Monetary Economics 57: 1, 1–18.
Boss, M., Elsinger, H., Summer, M. & Thurner, S. (2004). The network topology
of the interbank market. Quantitative Finance 4: 6, 677–684.
Acta Wasaensia
35
Brewer, E. III, Kaufman, G.G. & Wall, L. D. (2008). Bank capital ratios across
countries: Why do they vary? Journal of Financial Services Research 34: 2-3,
177–201.
Brinkmann, E. J. & Horvitz, P. M. (1995). Risk-based capital standards and the
credit crunch. Journal of Money, Credit and Banking 27: 3, 848–863.
Brunnermeier, M.K. (2009). Deciphering the liquidity and credit crunch 2007–
2008. Journal of Economic Perspectives 23: 1, 77–100.
Buch, C.M. & Neugebauer, K. (2011). Bank-specific shocks and the real economy. Journal of Banking and Finance 35: 8, 2179–2187.
Calza, A. & Sousa, J. (2005). Output and inflation responses to credit shocks. Are
there threshold effects in the Euro area? ECB Working Paper Series 481.
Cappiello, L., Kadareja, A., Kok Sörensen, C. & Protopapa, M. (2010). Do bank
loans and credit standards have an effect on output? A panel approach for the euro
area. ECB Working Paper Series 1150.
Carroll, C.D. (2006). The epidemiology of macroeconomic expectations. In
Blume, L. & Durlauf, S. (Eds). The economy as an evolving complex system, III:
Current perspectives and future directions. Oxford: Oxford University Press.
Cihak, M. & Brooks, P.K. (2009). From subprime loans to subprime growth? Evidence for the Euro area. IMF Working Paper 69.
Coeuré, B. (2012). The importance of money markets. Speech delivered at the
Morgan Stanley 16th Annual Global Investment seminar, on 16 June 2012,
Available
at:
http://www.ecb.europa.eu/press/key/date/2012/html/sp120616.en.html [Last accessed: 2 June 2014].
Cour-Thimann, P. & Winkler, B. (2013). The ECB’s non-standard monetary policy measures – The Role of institutional factors and financial structure. ECB
Working Paper 1528.
Degryse, H. & Nguyen, G. (2007). Interbank exposures: An empirical examination of contagion risk in the Belgian banking system. The International Journal of
Central Banking 3, 123–172.
Degryse, H., Elahi, M.A. & Penas, M.F. (2010). Cross-border exposures and financial contagion. International Review of Finance 10: 2, 209–240.
36
Acta Wasaensia
Donovan, D. & Murphy, A.E. (2013). The fall of the Celtic tiger. Ireland and the
euro debt crisis. Oxford: Oxford University Press.
Driscoll, J.C. (2004). Does bank lending affect output? Evidence from the US
states. Journal of Monetary Economics 51: 3, 451–471.
EBA (2011). 2011 EU Capital Exercise. European Banking Authority (EBA), 8
December
2011,
Available
at:
http://www.eba.europa.eu/documents/
10180/15971/Press+release+FINALv2.pdf/c9046302-c51d-4c7e-9156-8481db
75d036 [Last accessed: 2 June 2014].
ECB (2007). Bank capital in Europe and the US. Financial stability review, December 2007, 155–162.
Elsinger, H., Lehar, A. & Summer, M. (2006). Risk assessment for banking systems. Management Science 52: 9, 1301–1314.
Englund, P. (1999). The Swedish banking crisis: roots and consequences. Oxford
Review of Economic Policy 15: 3, 80–97.
Financial Crisis Inquiry Commission (2011). The financial crisis inquiry report Final report of the national commission on the causes of the financial and economic crisis in the United States. Washington, DC. Available at:
http://www.gpo.gov/fdsys/pkg/GPO-FCIC/pdf/GPO-FCIC.pdf [Last accessed: 2
June 2014].
Francis, W. & Osborne, M. (2009). Bank regulation, capital and credit supply:
Measuring the impact of prudential standards. Bank of England Occasional Paper
36.
Gabaix, X. (2011). The granular origin of aggregate fluctuations, Econometrica
79: 3, 733–772.
Gai, P. & Kapadia, S. (2010). Contagion in financial networks. Proceedings of the
Royal Society A 466, 2401–2423.
Gai, P., Haldane, A. & Kapadia, S. (2011). Complexity, concentration and contagion. Journal of Monetary Economics 58: 5, 453–470.
Gambacorta, L. (2005). Inside the bank lending channel. European Economic
Review 49: 7, 1737–1759.
Gambacorta, L. & Marques-Ibanez, D. (2011). The bank lending channel: evidence from the crisis. Economic Policy 26: 66, 135–182.
Acta Wasaensia
37
Gambacorta, L. & Mistrulli, P.E. (2003). Does banks capital affect lending behaviour? Journal of Financial Intermediation 13: 4, 436–457.
Garas, A., Argyrakis, P., Rozenblat, C., Tomassini, M. & Havlin, S. (2010).
Worldwide spreading of economic crisis. New Journal of Physics 12.
Gropp, R., Lo Duca, M. & Vesala, J. (2009). Cross-border bank contagion in Europe. The International Journal of Central Banking 5, 97–139.
Haldane, A.G. (2009). Rethinking the financial network. Speech delivered at the
Financial Student Association in Amsterdam on 28 April 2009, Available at:
http://www.bis.org/review/r090505e.pdf?frames=0 [Last accessed: 2 June 2014].
Haldane, A.G. & May, R.M. (2011). Systemic risk in banking ecosystems. Nature
469, 351–355.
Hall, B.J. (1993). How has the Basle accord affected bank portfolios? Journal of
the Japanese and International Economies 7: 4, 408–440.
Hancock, D., Laing, A. J. & Wilcox, J.A. (1995). Bank capital shocks: Dynamic
effects on securities, loans and capital. Journal of Banking and Finance 19: 3-4,
661–677.
Hancock, D. & Wilcox, J.A. (1993). Has there been a “capital crunch” in banking? The effects on bank lending of real estate market conditions and bank capital
shortfalls. Journal of Housing Economics 3: 1, 31–50.
Hancock, D. & Wilcox, J. A. (1998). The “credit crunch” and the availability of
credit to small business. Journal of Banking and Finance 22: 6-8, 983–1014.
Harding, J.P., Liang, X. & Ross, S.L. (2013). Bank capital requirements, capital
structure and regulation. Journal of Financial Services Research 43: 2, 127–148.
Heffernan, S. (2005). Modern Banking. Chichester: John Wiley & Sons Ltd.
Helbling, T., Huidrom, R., Ayhan Kose, M. & Otrok, C. (2011). Do credit shocks
matter? A Global perspective. European Economic Review 55: 3, 340–353.
Honkapohja, S. & Koskela, E. (1999). The economic crisis of the 1990s in Finland. Economic Policy 14: 29, 399–436.
Hülsewig, O., Mayer, E. & Wollmershäuser, T. (2006). Bank loan supply and
monetary policy transmission in Germany: An assessment based on matching
impulse responses. Journal of Banking and Finance 30: 10, 2893–2910.
38
Acta Wasaensia
Iori, G., Jafarey, S. & Padilla, F.G. (2006). Systemic risk on the interbank market.
Journal of Economic Behaviour and Organization 61: 4, 525–542.
Ivashina, V. & Scharfstein, D. (2010). Bank lending during the financial crisis of
2008. Journal of Financial Economics 97: 3, 319–338.
Jacques, K. T. (2008). Capital shocks, bank asset allocation, and the revised Basel
Accord. Review of Financial Economics 17: 2, 79–91.
Jiménez, G., Ongena, S., Peydró, J-L. & Saurina J. (2012). Credit Supply and
Monetary Policy: Identifying the bank balance-sheet channel with loan applications. American Economic Review 102: 5, 2301–2326.
Jonung, L., Kiander, J. & Vartia, P. (2009). The great financial crisis in Finland
and Sweden: The Nordic experience of financial liberalization. Cheltenham: Edward Elgar Publishing.
Keeling, M.J. & Eames, K.T.D. (2005). Networks and epidemic models. Journal
of the Royal Society Interface 2, 295–307.
Kermack, W.O. & McKendrick, A.G. (1927). A contribution to the mathematical
theory of epidemics. Proceedings of the Royal Society A 115, 700–721.
Kindleberger, C.P. & Aliber, R.Z. (2011). Manias, panics and crashes – A history
of financial crises. Houndmills, Basingstoke: Palgrave Macmillan.
Kishan, R.P. & Opiela, T.P. (2000). Banks size, bank capital and the bank lending
channel. Journal of Money, Credit and Banking 32: 1, 121–141.
Kishan, R.P. & Opiela, T.P. (2006). Bank capital and loan asymmetry in the transition of monetary policy. Journal of Banking and Finance 30: 1, 259–285.
Kok, C. & Schepens, G. (2013). Bank reactions after capital shortfalls. ECB
Working Paper 1611.
Koskenkylä, H. (1994). The Nordic banking crises. Bank of Finland Bulletin 68,
15–22.
Krause, A. & Giansante, S. (2012). Interbank lending and the spread of bank failures: A network model of systemic risk. Journal of Economic Behaviour and Organization 83: 3, 583–608.
Kuusterä, A. (1995). Aate ja raha, Säästöpankit suomalaisessa yhteiskunnassa
1822–1994. Helsinki: Otava.
Acta Wasaensia
39
Kuusterä, A. (2002). Lähellä ihmistä. Helsinki: Otava.
Kuusterä, A. & Tarkka, J. (2012). Suomen Pankki 200 vuotta – Parlamentin
pankki. Helsinki: Otava.
Llewellyn, D.T. (2002). An analysis of the causes of recent banking crises, The
European Journal of Finance 8: 2, 152–175.
Lown, C. & Morgan, D.P. (2006). The credit cycle and the business cycle: New
findings using the loan officer opinion survey. Journal of Money, Credit and
Banking 38: 6, 1575–1597.
May, R.M., Levin, S.A. & Sugihara, G. (2008). Ecology for bankers. Nature 451,
893–895.
Mistrulli, P.E. (2011). Assessing financial contagion in the interbank market:
Maximum entropy versus observed interbank lending patterns. Journal of Banking and Finance 35: 5, 1114–1127.
Moreno, Y., Pastor-Satorras, R. & Vespignani, A. (2002). Epidemic outbreaks in
complex heterogeneous networks. The European Physical Journal B 26, 521–
529.
Müller, J. (2006). Interbank credit lines as a channel of contagion. Journal of Financial Services Research 29: 1, 37–60.
Newman, M.E.J. (2003). The structure and function of complex networks. SIAM
Review 45, 167–256.
Nielsson, U. & Torfason, B.K. (2012). Iceland’s economic eruption and meltdown. Scandinavian Economic History Review 60: 1, 3–30.
Nier, E., Yang, J., Yorulmazer, T. & Alentorn, A. (2007). Network models and
financial stability. Journal of Economic Dynamics and Control 31: 6, 2033–2060.
Nyberg, P. & Vihriälä, V. (1994). The Finnish banking crisis and its handling (an
update of developments through 1993). Bank of Finland Discussion Papers 7.
Pais, A. & Stork, P.A. (2011). Contagion risk in the Australian banking and property sectors. Journal of Banking and Finance 35: 3, 681–697.
Peek, J. & Rosengren, E. (1995a). Bank regulation and the credit crunch. Journal
of Banking and Finance 19: 3-4, 679–692.
40
Acta Wasaensia
Peek, J. & Rosengren, E. (1995b). Neither a borrower nor a lender be. Journal of
Money, Credit and Banking 27: 3, 625–638.
Peek, J. & Rosengren, E. (1997). The international transmission of financial
shocks: The case of Japan. The American Economic Review 87: 4, 495–505.
Peek, J. & Rosengren, E. (2000). Effects of the Japanese bank crisis on real activity in the United States. The American Economic Review 90: 1, 30–45.
Peek, J., Rosengren, E.S. & Tootell, G.M.B. (2003). Identifying the macroeconomic effect of loan supply shocks. Journal of Money, Credit and Banking 35: 6,
961–946.
Puri, M., Rocholl, J. & Steffen, S. (2011). Global retail lending in the aftermath of
the US financial crises: Distinguishing between supply and demand effects. Journal of Financial Economics 100: 3, 556–578.
Reinhart C. & Rogoff, K. (2009a). This time is different: Eight centuries of financial folly. Princeton: Princeton University Press.
Reinhart C. & Rogoff, K. (2009b). Banking crises: An equal opportunity menace.
CEPR Discussion Paper Series 7131.
Rondorf, U. (2012). Are banks important for output growth? A panel analysis of
the euro area. Journal of International Financial Markets, Institutions and Money
22: 1, 103–119.
Sheldon, G. & Maurer, M. (1998). Interbank lending and systemic risk: An empirical analysis for Switzerland. Swiss Journal of Economics and Statistics 134: 4,
685–704.
Shrieves, R. E. & Dahl, D. (1995). Regulation, recession and bank lending behaviour: The 1990 credit crunch. Journal of Financial Services Research 9, 5–30.
Soramäki, K., Bech, M.L., Arnold, J., Glass, R.J. & Beyeler, W.E. (2007). The
topology of interbank payment flows. Physica A 379, 317–333.
Swiston, A. (2008). A U.S. Financial Conditions Index: Putting credit where credit is due. IMF Working Paper 161.
Takala, K. & Viren, M. (1995). Bankruptcies, indebtedness and the credit crunch.
Bank of Finland Discussion Paper 28.
Acta Wasaensia
41
Upper, C. (2011). Simulation methods to assess the danger of contagion in interbank markets. Journal of Financial Stability 7: 3, 111–125.
Upper, C. & Worms, A. (2004). Estimating bilateral exposures in the German
interbank market: Is there a danger of contagion? European Economic Review 48:
4, 827–849.
van Lelyveld, I. & Liedorp, F. (2006). Interbank contagion in the Dutch banking
sector: Sensitivity analysis. The International Journal of Central Banking 2, 99–
134.
Vihriälä, V. (1997). Banks and the Finnish credit cycle 1986–1995. Bank of Finland Economic Studies E:7. Helsinki: Oy Trio-Offset Ab.
Wall, L. D. & Peterson, D. R. (1995). Bank holding company capital targets in
the early 1990s: The regulators versus the markets. Journal of Banking and Finance 19: 3-4, 563–574.
Wells, S. (2004). Financial interlinkages in the United Kingdom's interbank market and the risk of contagion. Bank of England Working Paper 230.
42
Acta Wasaensia
Journal of Applied Finance & Banking, vol. 3, no. 6, 2013, 45-65
ISSN: 1792-6580 (print version), 1792-6599 (online)
Scienpress Ltd, 2013
Interbank Exposures and Risk of Contagion in Crises:
Evidence from Finland in the 1990s and the 2000s
Mervi Toivanen1
Abstract
By analysing the risk of interbank contagion during two distinctive crises, namely the
Finnish banking crisis in the 1990s and the most recent financial crisis of the 2000s, this
paper provides evidence on negative domino effects in a small open economy with a
concentrated banking system. Simulations based on interbank exposures and maximum
entropy estimations shed light on the magnitude of the contagion and the vulnerability to
cross-border risks. The results show that just before the onset of the Finnish banking crisis
the contagion would have affected almost half of the banking system, indicating that
without the government bailout the implications for society would have been severe. In
the 2000s the domestic contagion peaked after the collapse of Lehman Brothers and amid
the sovereign debt crisis. The analysis suggests that the higher the concentration of the
banking system, the more vulnerable it is to severe contagion. Moreover, strong interbank
linkages with foreign banks increase the domestic risks.
JEL classification numbers: G01, G21, N24
Keywords: Contagion, Interbank Exposures, Banking Crises, Finland, Maximum Entropy
1 Introduction
The history of financial crises extends to the early 20th century and beyond, including
incidences such as the Wall Street Crash of 1929 and the sub-prime crisis. Frequently, the
crises impact negatively on the financial stability of the banking sector and are extremely
costly for an economy as a whole. From the historical perspective, relatively little
emphasis has, nevertheless, been placed on analysing how the crises spread across
institutions and borders, although the recent financial crisis highlights the importance of
the interconnectedness of financial institutions.
The interbank markets, in which banks borrow and lend funds, may act as transmission
1
Senior Economist, Bank of Finland, PO Box 160, 00101 Helsinki, Finland
Article Info: Received : July 17, 2013. Revised : August 26, 2013.
Published online : November 1, 2013
46
Acta Wasaensia
43
Mervi Toivanen
channels for shocks during crises. These linkages are especially vulnerable since banks
can relatively easily reduce interbank lending should their confidence in counterparties
deteriorate. In the worst case scenario, the losses from interbank loans may lead to
contagion (or so-called domino effect), i.e. one bank failure leads to failures of other
banks even if the latter are not directly affected by the initial shock or do not hold open
positions with the first failing bank [1].2
This paper examines the possibility of contagion via banks’ interbank exposures in a
small open economy with a concentrated banking sector during two distinctive crises.
Academic literature is enriched, firstly, from the focus on significant crises periods,
namely the Finnish banking crisis in the 1990s, which is one of the “Big 5” banking crises
[5], and on the recent financial crisis of the 2000s. Insights into similarities and
differences in the two crises and into the patterns of contagion are provided for the
estimation periods. The specific case of a small open economy such as Finland is
interesting because of the vulnerability to cross-border risks, given the dependence on
foreign trade: exports of almost 40% of GDP in 2010. Moreover, Finland’s GDP
decreased by 8% in 2009 and by 10% in 1991–1993, causing a severe stress to the
banking system.
Secondly, the role of contagion in the Finnish banking crisis has not been discussed in
previous literature. The systematic nature of the crisis in the 1990s forced authorities to
bail out banks in order to save the rest of the banking system by limiting the effects of
contagion. The contagion simulations shed light on the magnitude of problems that
society would have faced if banks had been allowed to fail.
Thirdly, there is relatively little public information on network effects of the banking
system, and during the last decade risk assessments have mainly concentrated on
individual institutions. A deeper understanding of interbank linkages and transmission
channels is therefore desirable to increase our knowledge of contagion and to help lessen
the danger of "moral hazard", i.e. excessive risk-taking. Finally, cross-border
vulnerabilities of the Finnish banking system from 2005 onwards are identified. The
Finnish banking sector is highly concentrated and nowadays dominated by foreign
banking groups, making Finland a prominent example for other similar banking systems.
Banks’ bilateral interbank lending is estimated by using the maximum entropy method
and data on banks’ balance sheets, interbank assets and liabilities. On the basis of these
estimates, the effects of a bank failure in the Finnish interbank market are subsequently
simulated.
The results suggest that during the banking crisis in the 1990s three banks were able to
trigger contagion, while indicating five large and middle-sized banks as sources of
contagion in 2005–2011. During the 1990s the contagion would have affected almost half
of the banking system (assuming 100% loss ratio) and thus the implications for society
would have been severe without the authorities’ rescue measures. In 2005–2011, the
negative shock caused by a failure of a foreign bank (with a 100% loss-given-default)
affects 77% of the total assets of the Finnish banking sector, while contagion from a
Finnish bank impacts 66% of the total assets of the sector. In addition, the estimations
show that the higher the concentration of the banking system, the greater the system’s
vulnerability to contagion. This is worrying in terms of a country that has large
2
Other contagion channels include information, sale of illiquid assets or joint macroeconomic
shocks but they are beyond the scope of this paper. (See [2], [3] and [4])
44
Acta Wasaensia
Interbank Exposures and Risk of Contagion in Crises Evidence from Finland
47
cross-border exposures with foreign banks.
In terms of average contagion, the fragility of the banking system increases before the
crisis irrespective of the original source (domestic/international) of the crisis. Although
the interbank market exhibits higher risk levels in the current crisis than in the 1990s, a
bad outcome has not materialized owing to the absence of a trigger. The macroeconomic
shock was milder and more transitory in the 2000s than in the 1990s, banks’ capital
buffers are currently large, interest rates are lower than in the early 1990s and many
borrowers and lenders have learned from the experience of the 1990s, and so
acknowledge the dangers of over-borrowing.
The rest of the paper is organised as follows. The previous literature is reviewed in
section 2, and section 3 describes the Finnish banking sector and the crisis periods.
Section 4 presents the data and method of estimating bilateral exposures and simulating
contagious effects. This section also briefly discusses the simulation parameters. The
results are introduced in section 5 and section 6 concludes.
2 Previous Research
The Finnish banking crisis is dealt with in several papers, describing the boom and
subsequent bust of the Finnish banks and economy in the early 1990s (see, for instance,
[6], [7], [8] and [9]). No single, individual cause for the negative outcome can be
identified, as several factors such as financial deregulation, abundant refinancing
opportunities for banks, over-borrowing of firms and households, excessive risk taking,
lack of adequate risk management, policy and supervisory measures, and negative
macroeconomic shocks all played a role. Although the Finnish crisis shares common
features with other financial crisis in general and with Nordic banking crises in particular
(see [6], [7], [10], [11], [12], [13]), it is one of the worst banking crises (so-called “Big 5”
crises) of the post-WW II era, as listed in [5]. Despite the extensive coverage, the role of
contagion in the Finnish banking crisis has not yet been discussed.
Theoretical evidence on the consequences of the banking sector’s structure for contagion
is twofold. If all banks are connected with each other (i.e. the interbank market is
complete), the initial impact of a financial crisis may be attenuated [14]. But if each bank
is connected with a small number of other banks (incomplete interbank markets), the
crisis may be felt strongly in neighbouring institutions. However, some papers provide
evidence that an incomplete structure renders the banking system less vulnerable to
contagion. [15], [16]
Empirical research finds potential for significant contagion effects but regards as unlikely
a substantial weakening of the whole banking sector ([17], [18], [19], [20], [21], [22], [23],
[24]). Other empirical studies have estimated contagion by considering a wider variety of
risks and factors (see e.g. [3], [25], [26]). These studies support the above findings and
also indicate significant cross-border contagion. Regarding cross-border contagion, [27]
shows that the contagion is more widespread between countries geographically close to
each other. Furthermore, they suggest that the risk of cross-border contagion has
increased over the years.
Acta Wasaensia
Mervi Toivanen
48
3
45
The Finnish Banking Sector and the Crises
3.1 Banking Sector in Finland
In the 1990s the majority of Finnish banking market was dominated by KOP, SYP,
savings banks, cooperative banking group, Post office bank and Skopbank. Of these
institutions, KOP and SYP were the largest ones and were fierce rivals. The third largest
banking group was the savings bank group, which comprised about 250 savings banks
and Skopbank, which served as the group’s central financial institution. OKO Bank
financed the cooperative banks that belonged to the cooperative banking group, and Post
office bank was a government-owned commercial bank. The Finnish banking market was
already then highly concentrated, as the remaining banks were relatively small. ([6], [8])
According to the balance sheets, the main banking groups in Finland are currently:
Nordea Bank Finland, OP-Pohjola Group, Sampo Bank, savings banks (incl. Aktia) and
local cooperative banks. Nordea and Sampo banks are foreign-owned, and the Finnish
banking sector is highly concentrated, as the three main players account for approximately
75% of total lending. All together, there are about 360 individual credit institutions in
Finland, several of which belong to a larger consolidated banking group.
3.2 The Crises in the 1990s and 2000s
The deregulation of the Finnish financial market in the mid-1980s planted the first seeds
of the Finnish banking crisis, as it expanded banks’ choice set of assets and liabilities (for
more details, see [7]). The interbank market was established in 1986, providing a new
funding source for Finnish banks. Banks were no longer bound to traditional deposit
funding but could finance the growing lending stock with market funding. At the same
time, the private sector started to accumulate debt, as low real interest rates, a growing
real economy and general optimism unleashed the demand that had been suppressed
during the regulation era.
Moreover, banks competed fiercely over market shares in private sector lending. During
the second half of the 1980s, Skopbank's and savings banks' lending increased
aggressively, but other banks too were quick to react to the competition. Foreign currency
loans were especially easy to sell owing to interest rate differentials and a pegged
exchange rate regime.
When the overall economic situation weakened, banks' traditional loan losses started to
accumulate and their situation worsened. Finally, the banking crisis was trigged by
steeply rising interest rates, devaluation of the Finnish currency, and the collapse of the
real estate bubble and exports to the Soviet Union. A severe depression followed, and
GDP decreased by 10% in 1991–1993. The Finnish experience with financial
liberalization, lending boom and systemic banking crisis resembles in many ways the
crises that took place in Sweden and Norway in the 1990s although some differences
remain. [6]
Turning to individual banks, Skopbank's strategy had been highly dependent on the
availability of market funding and, as Skopbank’s loan losses soared, the markets became
sceptical as to Skopbank’s ability to meet its obligations. The lack of confidence
prevailing in money markets increased and finally Skopbank’s liquidity collapsed in
September 1991 when other banks refused to buy Skopbank’s certificates of deposit. To
prevent the whole banking system from collapsing, the central bank took over Skopbank.
46
Acta Wasaensia
Interbank Exposures and Risk of Contagion in Crises Evidence from Finland
49
In the first half of 1992, the savings banks that were on the brink of collapse merged to
form the Savings Bank of Finland (SBF), but its financial standing deteriorated during the
year as loan losses doubled and the costs of market funding increased. Ultimately, SBF
was not able to follow its special recovery plan and the bank was split up between four
competitors in October 1993.
The recent global financial crisis started in 2007 when the sub-prime mortgage market
collapsed in the US and the value of mortgage backed securities plummeted, causing large
losses for financial institutions that had invested in these instruments. As the crisis
deepened, panic spread in financial markets and equity values declined. Lehman Brothers
failed in September 2008, after which the financial crisis intensified. Several US and
European banks were either bailed out by governments or merged with other companies.
Iceland’s banking sector was hit especially hard, while Swedish banks booked large loan
losses on lending to Baltic States, and many small banks in Denmark faced difficulties.
[13], [28]
The over-indebtedness of several European countries, along with a downturn in the global
economy, bursting property bubbles, as well as investment and loan losses in the
European banking sector, contributed to an unfolding of the European sovereign debt
crisis. The crisis began at the start of 2010 when the magnitude of Greece’s fiscal deficit
was revealed. Amid fears of crisis escalation and downgrading of Greek sovereign debt,
the situation in the international financial markets deteriorated in early May 2010. Since
then, Ireland and Portugal have also received rescue packages.
Throughout the sovereign debt crisis the international money markets have remained
extremely volatile, although several policy measures have been undertaken. The situation
has remained fragile, and financial markets have been repeatedly hit by renewed worries
related to the debt crisis. The financial markets continue to be divided into weak banks
dependent on public support and strong banks still able to access markets on their own.
With limited exposures to ailing governments’ bonds and low traditional loan losses, the
Finnish banks have been relatively well-placed compared to their European and
Scandinavian peers in recent years.
4 Methodology
4.1 Data
Contagion analyses of the Finnish interbank market in 1988–1996 and 2005–2011 include
the Finnish deposit banks. 3 The analysis for 2005–2011 is based on balance sheet,
counterparty exposure and liquidity risk data, whereas data were not collected on
counterparty exposures and liquidity risk in the 1990s, so that only balance sheet data are
used for the earlier crisis period.
Balance sheet information is based on data collected from banks’ annual reports for the
3
KOP, OKO Bank, SYP, Merita Bank, savings banks, Postbank, Skopbank, STS Bank and Bank of
Åland in 1988–96 and Nordea Bank Finland, Sampo Bank, Pohjola (former OKO), Aktia Savings
Bank, Bank of Åland, Evli, eQ Bank, Tapiola Bank, S-Bank, local co-operative banks and local
savings banks in 2005–2011. Local co-operative banks and local savings banks are each combined
into a separate banking group.
50
Acta Wasaensia
47
Mervi Toivanen
1990s and on data collected by the Finnish Financial Supervisory Authority (FSA) for the
2000s. Yearly data on aggregated interbank loans and receivables vis-à-vis financial
institutions are available for the 1990s; for the 2000s we have quarterly data on interbank
loans and receivables as well as on banks’ bonds and certificates of deposit.4 Table 1
shows the total assets of Finnish banks as well as interbank liabilities relative to banks'
total assets in 1988 and 2006. At a maximum, interbank liabilities were approximately
one fifth of total assets in 2006 although there are differences between institutions. The
share of interbank liabilities has diminished over the years, as there are currently fewer
institutions with exposures exceeding 10% of total assets.
Table 1: Finnish deposit banks’ total assets and share of interbank liabilities in 1988 and
2006
1988
2006
Total assets, Interbank
Total assets, Interbank
EUR million liabilities
EUR million liabilities
over Total
over Total
assets, %
assets, %
KOP
24,322
1.2 %
OKO (Pohjola) Bank
7,375
16.2 %
24,196
4.5 %
Postbank
12,582
0.7 %
Skopbank
10,681
11.5 %
STS Bank
1,832
10.2 %
SYP (Unitas)
22,305
0.5 %
Savings Banks
16,643
14.5 %
5,648
1.0 %
Bank of Åland
462
11.1 %
2,189
2.8 %
Nordea Bank Finland
130,985
22.3 %
Sampo Bank
26,627
1.8 %
Aktia plc
5,492
16.2 %
Evli Bank
698
10.7 %
eQ Bank
627
0.0 %
Tapiola Bank
546
0.0 %
Local co-operative banks
3,467
0.2 %
Source: banks’ annual reports
Counterparty exposure data give accurate quarterly snapshots of interbank business and
provide information on unsecured and secured loans at the group level. However, the
FSA’s data set covers only the 10 largest domestic and foreign counterparties of each
reporting bank and does not shed light on all exposures.
In order to fill in this gap, FSA’s quarterly liquidity risk data are used to clarify the
4
In principle, there is also information on bonds and certificates of deposits in 1990s but this is not
included since breakdown between domestic and foreign items is not available. Foreign exposures
are deducted from all balance sheet items to get a closed system. This is a standard procedure in
the literature owing to the estimation method requiring that exposures of all potential
counterparties should be available for a given time period.
48
Acta Wasaensia
Interbank Exposures and Risk of Contagion in Crises Evidence from Finland
51
bilateral interbank relationship among small Finnish local banks and their central
financial institutions5. Cross-border contagion is assessed by using counterparty data on
Finnish banks’ interbank lending to foreign banks.
According to the counterparty exposure data most of the banks’ exposures are unsecured.
In 2005–2011 the unsecured receivables from both domestic and foreign financial
counterparties fluctuated between EUR 12.0 billion and EUR 19.2 billion, constituting
73–113 per cent of the banks’ total capital. In September 2008, amidst the international
financial crisis, the main counterparties of Finnish banks were domestic ones. Since then
the share of Finnish counterparties have gradually decreased, while the share of foreign
banks has increased.
Based on the available data the Finnish interbank sector does not form a complete
structure in the sense of [14]. All banks are nevertheless connected to each other via
common counterparties. The three largest banks, in the heart of the interbank market,
have room to manoeuvre in either the domestic or international money markets. The
ability to access international capital markets reduces their dependence on the national
interbank market, although they interact with each other and with other Finnish banks.
Middle-sized institutions are also able to raise funding from international markets but also
acquire funding from the largest Finnish banks. Finally, small, local banks use other
Finnish banks as their central financing institutions and thus form ‘satellites’ around these
banks. For example, local savings banks and local co-operative banks use Aktia as their
central financial institution. In a similar fashion, Pohjola finances local co-operative
banks that belong to the OP-Pohjola Group.
4.2 Estimating Bilateral Matrices
As balance sheets and large exposure data do not give complete information on individual
banks' actual counterparty exposures, the method of entropy maximization has been used
to fill the gaps in the data sets. Following [17] and [19], this paper assesses domestic and
foreign contagion in the Finnish interbank market.
The problem of estimating the matrix for banks’ bilateral exposures is posed as: "Given a
matrix C, determine a matrix X that is close to matrix C and satisfies a given set of linear
conditions on its entries" (see [29] and Appendix). Matrix C contains all available
statistical information on the bilateral unsecured exposures among Finnish banks as well
as between foreign and Finnish banks, while balance sheet data on total interbank assets
and liabilities provide the set of linear conditions for the estimation problem. The overall
distribution of interbank loans and deposits (i.e. matrix X) is subsequently estimated by
using the entropy maximization. This problem is easily solved using the RAS algorithm
by [30].
The data permit us to compute two matrices of bilateral exposures. These sub-matrices are
formed for loans and receivables as well as for bonds and certificates of deposit. After
having estimated a bank-to-bank matrix for the sub-categories, these matrices are
combined into the total domestic exposure matrix. This composite matrix is then been
used to test the possibility of contagion.
5
The data set includes information on interbank deposits and loans between Aktia, on one side, and
local co-operative banks and savings banks, on the other side. Similar data exist for Pohjola Bank
and co-operative banks in the OP-Pohjola Group.
52
Acta Wasaensia
49
Mervi Toivanen
4.3 Simulating Contagion
Once the matrix of interbank linkages is in place, the scope of contagion is simulated by
letting banks go bankrupt one at a time and by computing the overall effect on the
banking sector due to direct or indirect exposures to the first failing bank. The simulations
follow a sequential (or round-by-round) algorithm ([2], [31]). At the start, there are
several banks b, b = 1,…,N, in the Finnish banking sector. All these banks have capital cb
as well as an exposure xbb towards another domestic bank. Contagion simulation involves
the following steps:
1. By assumption, bank i fails at t0.
2. A lender defaults if the amount of losses from lending to the failed bank exceeds the
lender's own capital. So, a bank j fails if its exposure towards bank i, x ji, multiplied by
an exogenously given parameter for the loss-given-default (LGD), exceeds the bank
j's capital cj. So, bank j fails if LGD * xji > cj at t1.
3. Contagion need not be confined to such first-round effects, but a failure of the first
bank can trigger a chain of failures (domino effect). A second round of contagion
occurs for any bank k for which LGD * (xki + xkj) > ck at t2. Contagion stops if no
additional banks go bankrupt. Otherwise, a third round of contagion takes place.
The impact of the failure of a foreign bank is successively studied by letting each of the
M foreign banks go bankrupt one at a time and simulating the contagion within the
domestic interbank market with a given LGD.
In the simulations, bank institutions stand alone. In reality this may not always be the case,
since several Finnish banks are members of a larger group. Thus, when facing difficulties,
a parent corporation may provide funding to its banking subsidiary. This funding can
extend the bank's ability to sustain market turbulence and restrain contagion. However,
the recent financial crisis has shown that banks may not have time to react in a crisis. A
sudden drying up of interbank markets and short-term funding or a lack of other forms of
safety nets on which banks could rely in a case of problems may quickly squeeze the bank
out of the interbank markets. Should the analysis take into account all ramifications of a
bank failure such as adjustments by depositors the impact is likely to be even more
devastating.6
Simulations focus on gross exposures and do not take into account netting. As the focus is
on maximum exposure and contagion is assumed to proceed without delays, netting is not
an option. Moreover, in Finland banks cannot net interbank claims that can be used as
collateral for central bank funding. What happens after all contagion rounds and the
bankruptcy of a bank is beyond the scope of this paper.
6
For instance, when prices are allowed to change, the systemic risk may be even larger than
thought previously [32].
50
Acta Wasaensia
Interbank Exposures and Risk of Contagion in Crises Evidence from Finland
53
4.4 The Choice of Parameters
The key parameters in determining the existence of contagion are the loss-given-default
(LGD) ratio and the solvency ratio. The LGD refers to the share of assets that cannot be
recovered in the event of a bankruptcy. The choice of LGD is by no means obvious, as it
can vary significantly. Historical evidence on the failures of international banks such as
Continental Illinois, BCCI and Herstatt indicates that the loss ratio may range between
5–90% depending on the time period when losses are expected to materialize. ([2], [17])
The uncertainty about eventual recoveries suggests that it may not be the actual losses
borne by the creditor banks but rather the expected losses at the moment of a failure that
matter.
The loss ratio also depends on the availability of collateral for interbank claims vis-à-vis
creditors. According to the Finnish counterparty exposure data, collateralized lending by
Finnish banks is almost non-existent. Since the purpose of the study is to find the
maximum negative shock that could hit the market, it is assumed that most of the
interbank loans reported in the balance sheet are indeed unsecured. Given the difficulties
in determining the appropriate loss rate, the possibility of contagion is tested using a
broad range of values for LGD, 25%, 50%, 75% and 100%, which remain constant across
banks.
The solvency ratio forms a requirement for a bank’s equity. The current minimum Tier 2
capital ratio is set at 8% by regulatory authorities. In reality, banks seldom go bankrupt
out of the blue; there are at least some rumours about the difficulties beforehand. If the
institution is too big or too systematic to fail, regulators are likely to take action to address
the issue by closing the bank, by moving doubtful assets to a special financing vehicle or
by providing liquidity for the bank. This kind of policy response was evident during the
Nordic banking crises and during the latest financial crises when authorities bailed out the
majority of significant banks, for instance, in Ireland and the UK. Nevertheless, as the
focus here is on the maximal negative effect and the short-term contagion effects, it is
assumed that regulators do not have time to react.
5 Estimating the Danger of Contagion on the Finnish Interbank
Market
5.1 The Banking Crisis in the 1990s
In 1988–1990 contagion was triggered by savings banks, Skopbank and OKO Bank. The
magnitude of contagion in each case increased steadily. (Figure 1) If savings banks had
failed in 1988, contagion7 would have affected 26% of banking sector assets (assuming a
100% loss ratio) and the negative impact would have been somewhat smaller with lower
LGDs. Two years later, just before the onset of the actual crisis, savings banks’ failure
would have affected 38% of the total assets of the banking sector.
The case of Skopbank is interesting, as it was actually taken over by the central bank in
7
The magnitude of contagion is measured as the percentage of failing banks' assets in the banking
sector's total assets after all banks have encountered the direct and indirect contagion effects. The
assets of the first failing bank are not included.
Acta Wasaensia
51
Mervi Toivanen
54
1991. Simulations show that the bank’s failure in 1988–1990 would have had a more
profound impact on the markets than the failure of the savings banks. In 1988 and in 1989
the negative effect would have caused 31% and 48% of the banking sector to collapse,
respectively. A year before the failure of the bank, contagion would have affected almost
half of the banking system, indicating that without the bailout of the bank the implications
for the society would have been severe. The contagion is somewhat milder with the lower
loss-given-default (LGD) ratios.
Note: The y-axis represents the proportion of Finnish banking sector (measured by
percentage of failing banks’ assets in banking sector's total assets) that will run into
problems as a result of a default of Savings banks, Skopbank or OKO bank, after all
banks in the system have been exposed to the contagion. The extent of the effect is
assessed for four different loss-given-default (LGD) rates. The assets of the first failing
Finnish bank are excluded. A missing bar means that the failing bank does not trigger a
domino effect.
60
25 %
%
50 %
75 %
100 %
50
40
30
20
10
0
Savings Skopbank
banks
1988
OKO
Bank
Savings Skopbank
banks
1989
OKO
Bank
Savings Skopbank
banks
OKO
Bank
1990
Figure 1: Contagion in Finnish banking system in 1998–1990, grouped by LGD
The fact that the analysis identifies OKO Bank as the most severe source of contagion
during 1988–1990 is a new finding. The cooperative banking group did have problems
during the crisis, but it is generally acknowledged that the Group was able to survive due
to their more conservative strategy and the Group's joint responsibility in dealing with
loan losses. The results are likely driven to some extent by the fact that OKO Bank acts as
a central financial institution for the co-operative banking group, acquiring refinancing
from the markets and passing on the funds to cooperative banks. And, market funding
constituted an increasing share of OKO's balance sheet.
Another interesting result is that commercial banks KOP and SYP do not show up as
possible sources of contagion, though they were the largest banks. Although they were
active in the interbank markets their interbank lending relative to their total assets was not
52
Acta Wasaensia
Interbank Exposures and Risk of Contagion in Crises Evidence from Finland
55
as large as in other banking groups (see Table 1). If certificates of deposit, which were
widely used instruments in the Finnish interbank market in the 1980s, are also included in
interbank assets and liabilities, the results indicate that all banks' exposures to short-term
money markets were such that no bank would have survived a sudden drying up of
external funding.
The contagion analysis is replicated with data on the most severe recession year 1992,
followed by the recovery years 1994 and 1996. However, these data points are somewhat
problematic since by that time banks had received substantial subsidies from the
government. Assuming a 100% loss ratio, the contagion would have impacted 14%, 33%
and 53% of the banking sector’s assets in 1992, 1994 and 1996, respectively. Owing to
restructuring of the banking sector, the risk of contagion declined in 1992 but started to
increase after that. During these years saving banks, OKO Bank, Merita Bank and Post
office bank were possible contagion sources. The savings banks were still contagious in
1992, affecting 21% of the banking sector (with 100% LGD), but after the final resolution
the group did not cause contagion in 1994 and 1996. OKO Bank's exposure is due to its
position as a central monetary institution, while Merita Bank was formed in a merger of
two large banks in 1996, and thus constituted a large share of the banking system. It
should be noted that the Post office bank's position was not, in reality, worrisome since it
was owned by the state.
In light of the historical knowledge, the estimations seem to be able to identify banks that
were the most troublesome during the banking crisis. The evidence also indicates that
banks with a significant share of interbank assets are more prominent sources of
contagion than the others.8
5.2 The Recent Financial Crisis
According to simulations for 2005–2011, five out of the ten banks could trigger contagion
in Finland. In addition to the large commercial banks, there are also middle-sized banks
that are capable of producing negative spillover effects. The five banks that are identified
as a starting point for contagion remain the same for whole estimation period.
On average9 and assuming 100% loss rate, 66% of banking sector assets would have been
affected in 2005–2011 (Figure 2). Although the case of the 100% loss-given-default
(LGD) is harsh, it is interesting as a “worst case scenario”, portraying the outcome if
everything goes badly. The result is at the upper end of earlier estimates, which vary from
4% for Belgium to 96% for the Netherlands.
While the worst case scenario might be only a theoretical possibility, the quite plausible
75% and 50% loss ratios in the short-run seem to have already significant effects on the
banking market. Over the estimation period, the average negative impact on total assets is
39% and 19%, respectively.
8
This supports [2] arguing that direct contagion happens only if interbank exposures are large
compared to the capital.
9
A simple average for the banking sector over the estimation period for stated LGD.
Acta Wasaensia
53
Mervi Toivanen
56
Assuming 25 % loss-given-default, the average contagion affects 11% of banking sector
assets.10
The LGD ratio has an obvious effect on the speed of contagion and the outcome. This is
intuitively appealing, since higher values of the ratio have the potential to increase
pressure in the system. At some point, a critical mass of losses is reached and the
interbank market collapses. For instance, the larger the LGD, the quicker the pace of
contagion and the more severe the negative impact on the banking system.
Note: The y-axis represents the proportion of the Finnish banking sector (measured by
percentage of failing banks’ assets in banking sector's total assets) that will run into
problems as a result of a default of a domestic bank, after all banks in the system have
been exposed to the contagion. The extent of the effect is assessed for four different
loss-given-default (LGD) rates. Results for each loss rate and each quarter are based on a
simple average for the individual banks. The assets of the first failing Finnish bank are
excluded.
100
%
25 %
50 %
75 %
100 %
90
80
70
60
50
40
30
20
10
0
Figure 2: Contagion in Finnish banking system in 2005–2011, grouped by LGD
The volume of contagion also depends on the bank that fails first. Only one bank is
extremely contagious in the Finnish banking system, being able to cause mayhem in the
market already with the smallest loss ratio. With 25% LGD, around one half of the
10
The effect of contagion is also estimated by letting local co-operative banks and local savings
banks enter the simulations as individual banks instead of combining them into two representative
banking groups. In this set-up, there are 42 local co-operative banks, 39 local savings banks and 8
commercial banks. The effect on the results is nevertheless negligible and the contagion is
0.1%–2.6% lower depending on the loss rate. However, in reality this difference may prove
important for local communities and individual banks, as local co-operative banks and local
savings banks are not liable for each others' debts.
54
Acta Wasaensia
Interbank Exposures and Risk of Contagion in Crises Evidence from Finland
57
Finnish banking system would collapse due to the problems of this bank. If the loss ratio
is larger, this bank is a source of contagion that affects the whole banking system and
ultimately causes the system to collapse. Of the other four banks identified as a source of
the contagion, two banks are systematically important from June of 2008 onwards and
with higher loss ratios. The contagion from the last two banks is usually limited in nature
albeit some noticeable exceptions remain. Nevertheless, the negative effects imposed by
these banks are almost non-existent if the loss rate is less than 100%. The limited number
of contagious banks portrays the high concentration of the banking sector.
Turning to developments over the years, the aggregated11 domestic contagion intensified
at the beginning of the domestic and international crisis in both the 1990s and the 2000s
(Figure 3). The magnitude of the contagion was relatively mild up to 2007, remaining
under the levels of 1988–1990. For instance, in December 2006 the first failing bank
would have caused around 11 % of Finnish banking sector to collapse. In the run-up to
the banking crisis in 1990s as well as before the collapse of Lehman Brothers, the severity
of contagion increased in Finland. The contagion risk peaked at the end of 2008 after the
collapse of Lehman Brothers, when a first failing bank would have caused, on average,
almost 50% of the banking system to collapse.
After the initial culmination of the crises, the magnitude of contagion decreased.
Nevertheless, the positive development was reversed and the risk of contagion rose
towards the end of 2009. The actual magnitude of Greece’s fiscal deficit was revealed at
the turn of the year 2010, triggering the sovereign debt crisis and raising the contagion
risk in Finnish interbank market above the 50% impact level in June 2010.
After this peak the contagion risk declined until mid-2010 but started to increase again
towards the end of the estimation period, possibly reflecting renewed worries related to
the debt crisis and the changing pattern of interbank linkages. The freezing of money
markets may have negatively impacted cross-border interbank lending, which has been –
at least partially – replaced by lending between domestic institutions. Growing
importance of domestic counterparties naturally increases the magnitude of domestic
contagion.
11
Aggregation is based on a simple average over the individual banks and the loss-given-default
ratios for each individual year.
Acta Wasaensia
55
Mervi Toivanen
58
Note: The y-axis represents the proportion of the Finnish banking sector (measured by
percentage of failing banks’ assets in the banking sector's total assets) that will run into
problems as a result of a default of a bank, after all banks in the system have been
exposed to the contagion. Aggregation for each time period is based on a simple average
for the individual banks and the loss-given-default ratios. The assets of the first failing
Finnish bank are excluded.
60
%
50
40
30
20
10
0
Figure 3: Aggregated contagion in 1988–1996 and 2005–2011
The results concerning banking sector structure and contagion suggest that an incomplete
interbank market with highly concentrated banking sector correlates positively with
contagion. In Finland, the concentration measured by the Herfindahl index 12 and
contagion grew, respectively, from 2,730 and 17% in 2005 to 3,700 and 49% in 2011. The
simple correlation between these two time series was 66% in 2005–2011, suggesting that
there is a positive link between higher contagion and increasing concentration of
incomplete markets.
This vulnerability to severe contagion gets support from previous studies, indicating that
banking sectors dominated by a few large banks (such as the Dutch and Finnish banking
sectors) exhibit high contagion risk. At the same time, contagion seems to have a
somewhat milder effect in countries with two-tier systems and low concentration (such as
Germany and Italy). ([17], [20], [23]) Furthermore, [19] finds that the change from
complete structure towards a more decentralised structure reduces the risk and impact of
contagion.
12
Data for the index from Statistical data warehouse (SDW) of the ECB
(www.http://sdw.ecb.europa.eu/).
56
Acta Wasaensia
Interbank Exposures and Risk of Contagion in Crises Evidence from Finland
59
5.3 Cross-border Contagion
The analysis of this section concentrates on whether a failing foreign bank can trigger a
default of a Finnish bank and whether there is a subsequent domino effect within the
domestic banking sector. As no information on bilateral financial linkages between
foreign banks is available, simulations cannot take into account the overall cross-border
contagion, which hinders the analysis of second-round effects abroad and potential
indirect impacts on Finnish banks after the initial failure of a foreign bank. This limitation
affects all the literature on financial contagion. Only [27] investigates overall contagion
across countries but the paper is limited to aggregate country level data, as it lacks data on
individual banks.
Overall, the default of a foreign bank can trigger contagion in the domestic interbank
market, leading in general to the immediate failure of a few (from zero to four) Finnish
banks. On average13, the instant first-round impact of the failure of a foreign bank
amounts to 8% of the total assets of the Finnish banking sector in 2005–2011. The
magnitude of the effect varies over time, peaking at 17% in June 2007 and amounting to
about 8.5% at the end of the estimation period (Figure 4).
Note: Line shows the share of Finnish banks’ assets that initially go bankrupt in the
first-round due to the failure of a foreign bank. Columns represent the aggregated
percentage of failing Finnish banks’ assets in the banking sector's total assets, after all
banks in the Finnish banking sector have been exposed to the subsequent domestic
contagion rounds after the initial impact. Aggregation for each quarter is based on a
simple average over the individual banks and loss-given-default ratios.
60
%
contagion within Finland
initial cross-border contagion
50
40
30
20
10
0
Figure 4: Contagion triggered by a foreign bank in 2005–2011
13
A simple average over the individual banks, LGDs and quarters.
Acta Wasaensia
57
Mervi Toivanen
60
The failure of a foreign bank impacts large, medium-sized and small banks alike. In
addition to French, British and American banks, the contagion is often triggered by
Swedish and Danish banks. The result thus supports the findings of [27] which showed
that a default of a Scandinavian bank affects the neighbouring banking systems. Nordic
banks are the main international counterparties for Finnish banks and thus they form
potential channels through which international contagion or market disturbances may
spread to Finland.
Within the Finnish banking sector, foreign contagion follows similar patterns as domestic
contagion although the high risk of domestic contagion is not reflected in the negative
spillover effects of a foreign bank’s default in 2009–2010. All in all, contagion caused by
a failure of a foreign bank is slightly more severe than contagion triggered by a Finnish
bank during the estimation period. After all contagion rounds, the contagion from a
foreign bank affects 77% of the total assets of the Finnish banking sector in 2005–2011
and with a 100% LGD, while contagion from a Finnish bank impacts 66% of the total
assets of the sector. Nevertheless, the impact depends on the loss-given-default, as with
lower LGDs the impact from a Finnish bank is more pronounced. The findings are in line
with those of [19] and [23], indicating that the more concentrated the banking system, the
more vulnerable it is for foreign contagion.
5.4 The Crisis in Comparison
The operational environment of banks in the 1990s and in 2005–2011 bears several
similarities. During both periods, the Finnish banking sector was highly concentrated and
there were only a few large players in the market. The Finnish banks started to finance
their growing lending by acquiring short-term funding from money markets at the end of
1980s. Similarly, interbank markets grew in significance in the 2000s, as liquidity was
abundant in the international financial markets, which constrained the cost of financing
and enabled banks to easily refinance themselves. As a consequence, some foreign banks
became dependent on external (short-term) market financing and the growth of interbank
assets increased the risk of contagion.
However, there are also notable differences between the periods. In 2005–2011 the
interest rate level was nowhere near that of the early 1990s, the corporate sector was not
as badly indebted as before and banks’ capital buffers are currently larger. In addition,
many borrowers and lenders are currently more aware of the dangers of over-indebtedness.
In Finland, the macroeconomic shock was also somewhat milder and more transitory in
the 2000s than in the 1990s. Therefore, several negative triggers and factors such as the
banking system’s structural weaknesses and hazardous incentive structures that were
present in the 1990s were missing in the 2000s, and thus removed the initial knock-out
effect. All in all, the current crisis has not eroded Finnish banks’ solvency ratios, so that
banks are now more resilient to domestic contagion, and bank default is a low probability
event.
6
Conclusion
This paper investigates the possibility of financial contagion using data on the Finnish
interbank market and the maximum entropy methodology. First, we compare the pattern
and development of contagion before and during two distinctive crisis periods. These
58
Acta Wasaensia
Interbank Exposures and Risk of Contagion in Crises Evidence from Finland
61
contagion simulations shed light on the magnitude of the problems that society would
face if banks fail. Secondly, as the importance of network effects is recently highlighted,
the analysis provides more information on the importance of interbank linkages and
transmission channels. Thirdly, the paper provides evidence on the domestic and
foreign-based contagion in a concentrated banking system that is dominated by foreign
banking groups and thus vulnerable to cross-border shocks.
The analysis suggests that the contagion increased both in 1988–1990 and in 2005–2011,
irrespective of the original source (domestic/international) of the crisis. The method
identifies five large and middle-sized Finnish banks that are able to cause contagion in
2005–2011, while suggesting that three banks were contagious during the banking crisis
in the 1990s.
Before the onset of the crisis in 1990 the contagion would have affected almost half of the
banking system (assuming 100% loss ratio), indicating that without the bank bailouts the
implications for society would have been severe. In 2005–2011, the negative impact
caused by a failure of a foreign bank (with a 100% loss-given-default) affects 77% of the
total assets of the Finnish banking sector, while contagion from a Finnish bank impacts
66% of the total assets. There are also indications that the more concentrated the banking
system, the more vulnerable it is to severe contagion. Moreover, strong interbank linkages
with foreign banks increase the risk for domestic contagion.
ACKNOWLEDGEMENTS: I would like to thank Panu Kalmi, Hannu Piekkola, Jouko
Vilmunen and Glenn Harma for their helpful comments and suggestions; and Christian
Upper for providing the code for the RAS algorithm. The financial support from Yrjö
Jahnsson Foundation is gratefully acknowledged. All remaining errors and omissions are
the sole responsibility of the author. The views expressed in this paper are those of the
author and do not necessarily reflect those of the Bank of Finland.
References
[1]
[2]
[3]
[4]
[5]
[6]
[7]
[8]
M.Pericoli and M. Sbracia, A Primer on financial contagion, Journal of Economic
Surveys, 17(4), (2003), 571 – 608.
C. Upper, Simulation methods to assess the danger of contagion in interbank
markets, Journal of Financial Stability, 7(3), (2011), 111 – 125.
J. Müller, Interbank credit lines as a channel of contagion, Journal of Financial
Services Research, 29(1), (2006), 37 – 60.
A. Pais and P.A. Stork, Contagion risk in the Australian banking and property
sectors, Journal of Banking and Finance, 35(3), (2011), 681 – 697.
C. Reinhart and K. Rogoff, Banking Crises: An equal opportunity menace, CEPR
Discussion Paper Series 7131, (2009).
L. Jonung, J. Kiander and P. Vartia (eds), The Great financial crisis in Finland and
Sweden – The Nordic experience of financial liberalization, Edward Elgar
Publishing, Cheltenham, (2009).
P. Nyberg and V. Vihriälä, The Finnish banking crisis and its handling (an update of
developments through 1993), Bank of Finland Discussion Papers 7, (1994).
V. Vihriälä, Banks and the Finnish credit cycle 1986–1995, Bank of Finland
Economic Studies E:7, Oy Trio-Offset, Helsinki, (1997).
62
[9]
[10]
[11]
[12]
[13]
[14]
[15]
[16]
[17]
[18]
[19]
[20]
[21]
[22]
[23]
[24]
[25]
[26]
[27]
[28]
[29]
[30]
Acta Wasaensia
59
Mervi Toivanen
S. Honkapohja, E. Koskela, S. Gerlach and L. Reichlin, The economic crisis of the
1990s in Finland, Economic Policy, 14(29), (1999), 399–436.
D. T. Llewellyn, An analysis of the causes of recent banking crises, The European
Journal of Finance, 8(2), (2002), 152–175.
S. Heffernan, Modern banking, John Wiley & Sons, Chichester, (2005).
P. Englund, The Swedish banking crisis: roots and consequences, Oxford Review of
Economic Policy, 15(3), (1999), 80–97.
U. Nielsson and B.K. Torfason, Iceland’s economic eruption and meltdown,
Scandinavian Economic History Review, 60(1), (2012), 3–30.
F. Allen and D. Gale, Financial contagion, The Journal of Political Economy, 108(1),
(2000), 1–33.
S. Brusco and F. Castiglionese, Liquidity coinsurance, moral hazard, and financial
contagion, The Journal of Finance, 62(5), (2008), 2275–2301.
A. Hasman and M. Samartín, Information acquisition and financial contagion,
Journal of Banking and Finance, 32(10), (2008), 2136–2147.
C. Upper and A. Worms, Estimating bilateral exposures in the German interbank
market: Is there a danger of contagion? European Economic Review, 48(4), (2004),
827–849.
G. Sheldon and M. Maurer, Interbank lending and systemic risk: An empirical
analysis for Switzerland, Swiss Journal of Economics and Statistics, 134(4), (1998),
685–704.
H. Degryse and G. Nguyen, Interbank exposures: An empirical examination of
contagion risk in the Belgian banking system, The International Journal of Central
Banking, 3(2), (2007), 123–172.
I. van Lelyveld and F. Liedorp, Interbank contagion in the Dutch banking sector:
Sensitivity Analysis, The International Journal of Central Banking, 2(2), (2006),
99–134.
S. Wells, UK interbank exposures: systemic risk implications, Bank of England's
Financial Stability Review, December 2002, (2002), 175–182.
S. Wells, Financial interlinkages in the United Kingdom's interbank market and the
risk of contagion, Bank of England Working Paper 230, (2004).
P.E. Mistrulli, Assessing financial contagion in the interbank market: Maximum
entropy versus observed interbank lending patterns, Journal of Banking and Finance,
35(5), (2011), 1114–1127.
M. Blåvarg and P. Nimander, Inter-bank exposures and systemic risk, Sveriges
Riksbank Economic Review 2, (2002), 19–45.
H. Elsinger, A. Lehar and M. Summer, Risk assessment for banking systems,
Management Science, 52(9), (2006), 1301–1314.
R. Gropp, M. Lo Duca and J. Vesala, Cross-border bank contagion in Europe, The
International Journal of Central Banking, 5(1), (2009), 97–139.
H. Degryse, M. A. Elahi and M.F. Penas, Cross-Border Exposures and Financial
Contagion, International Review of Finance, 10(2), (2010), 209–240.
Danmarks Nationalbank, Changes in the Danish banking sector in 2008 and early
2009, Danmarks Nationalbank’s Financial Stability 1st half, (2009), 29–30.
Y. Censor and S.A. Zenios, Parallel optimization - theory, algorithms and
applications, Oxford University Press, New York, (1997).
U. Blien, Uwe and F. Graef, Entropy optimization in empirical economic research,
Classification, data analysis and data highways: proceedings of the 21st annual
60
Acta Wasaensia
Interbank Exposures and Risk of Contagion in Crises Evidence from Finland
[31]
[32]
[33]
[34]
[35]
63
conference of the Gesellschaft für Klassifikation e.V. University of Potsdam, March
12-14, 1997, ed. Balderjahn, Ingo et al., Springer-Verlag, Berlin, (1998), 3–15.
G.H. Furfine, Interbank exposures: quantifying the risk of contagion, Journal of
Money, Credit and Banking, 35(1), (2003), 111–128.
R. Cifuentes, G. Ferrucci and H.S. Shin, Liquidity risk and contagion, Journal of
European Economic Association, 3(2–3), (2005), 556–566.
E.T. Jaynes, Information theory and statistical mechanics, Physical Review, 106(4),
(1957), 620–630.
C.E. Shannon, A mathematical theory of communication, The Bell System Technical
Journal, 27, (1948), 379–423.
C.E. Shannon, A mathematical theory of communication (Concluded), The Bell
System Technical Journal, 27, (1948), 623–656.
Acta Wasaensia
61
Mervi Toivanen
64
Appendix
The Method of Maximizing Entropy
The concept of entropy maximization originates in information theory, in which entropy
is a measure of the average information content of a random variable. The greater the
entropy of the message, the greater information content of the message.
Maximizing entropy means setting up probability distributions on the basis of partial
knowledge and thus denotes the most likely outcome given the a priori knowledge about
the event xi. (For more details see [33], [34], [35].) When the probability of the outcome
is maximized, the uncertainty diminishes and the estimates of parameters xi are close to
real values of xi.
x11
X xi1
xN 1
x1 j
xij
xNj
x1N w1N 1 w1M
x1N
xNN wNN 1 wNM
Figure A: Matrix of interbank loans and deposits
Sources: [17] and [19].
Suppose now that there are N Finnish banks that may lend to each other. In this case, the
interbank lending relationships can be presented in an N*N matrix (see left-hand side of
the matrix X in Figure A). [2] As there is usually no knowledge on individual interbank
loans and deposits, individual xij:s are generally unknown. However, a priori data on
actual individual interbank relationships and their magnitudes is gathered into an a priori
matrix C that resembles matrix X. The diagonal of the matrix C is usually set at zero,
since it is assumed that no bank lends to itself.
Balancing the matrix yields a unique estimate of matrix X. Matrix is defined to be
balanced if it satisfies the given set of linear restrictions of the problem. These restrictions
consist of the row sums (ai), i.e. bank i's total claims on other banks, and column sums (lj),
i.e. bank j's liabilities in the interbank market. These sums are obtained from balance
sheet data. More formally, the problem is as follows:
n
Min
xij
i 1
n
x
j 1
ij
log
xij
cij
(1)
s.t.
n
x
i 1
ij
lj
, i = 1, … , n
(2)
Acta Wasaensia
62
Interbank Exposures and Risk of Contagion in Crises Evidence from Finland
n
x
j 1
ij
ai
, j = 1, … , n
xij 0
65
(3)
(4)
In the case of foreign contagion, the same methodology applies, but now X becomes an
(N × (N+M)) matrix (Figure A). This matrix of bilateral exposures presents the interbank
exposures of Finnish banks toward the other (N-1) Finnish banks and the M foreign banks.
The initial estimation problem and linear restrictions remain the same except for
restriction (3), which becomes:
n
w
j 1
ij
fai
, j = 1, … , n
(5)
in which wij represents the gross exposure of Finnish bank i to foreign bank j and fa i
stands for interbank assets of bank i. [19]
Acta Wasaensia
63
CONTAGION IN THE INTERBANK NETWORK:
AN EPIDEMIOLOGICAL APPROACH
Mervi Toivanen*
ABSTRACT
This paper applies a novel interdisciplinary approach to model the spreading of
credit contagion in the interbank network by implementing an epidemiologic
model. In the context of scale-free networks the model is calibrated with actual
data on European banks. The average contagion is shown to affect 70% and 40%
of European banks’ total assets in 2007 and in 2010, respectively. Country-level
results suggest that French, British, German and Spanish banks are the most
contagious ones, whereas banks from Ireland, Greece and Portugal induce only
limited negative effects. Furthermore, the paper sheds light on the importance of
individual banks for financial stability, as it disentangles the leading bank-specific
factors influencing the outcome. Estimations indicate that bank clustering, large
in-coming interbank loans, the bank’s position in the network and the bank’s size
are prominent indicators. Finally, central bank interventions are shown to reduce
contagion only slightly.
JEL codes: G01, G21, C15
Keywords: contagion, banks, Europe, interbank loans, epidemiology, financial
crisis
*I am grateful to Koen Schoors, Simone Giansante, Karlo Kauko, Hannu Piekkola, Panu Kalmi,
Jouko Vilmunen, Ari Hyytinen and Glenn Harma for their useful comments. I would also like to
thank participants and discussants at the Conference held as a part of the XXXV Annual Meeting
of the Finnish Economic Association in Maarianhamina in February 2013; the INFINITI
Conference on International Finance in Science Po Aix-en-Provence in June 2013; the IFABS
conference in Nottingham in June 2013, for helpful suggestions and discussions. The financial
support from OP-Pohjola Group Research Foundation and Yrjö Jahnsson Foundation is gratefully
acknowledged. All remaining errors and omissions are the sole responsibility of the author. The
views expressed in this paper are those of the author and do not necessarily reflect those of the
Bank of Finland or the Eurosystem.
64
Acta Wasaensia
1 INTRODUCTION
The early stages of the financial crisis demonstrated that financial institutions
were to face substantial losses owing to sub-prime exposures and declining asset
values. But due to the opaqueness of banks’ balance sheets and limited
knowledge of counterparty exposures, nobody really knew how heavily each
institution was exposed and to what extent the losses would materialize. At the
same time, banks were tightly connected to each other via interbank lending and
borrowing that form a network through which each and every bank of the network
may be affected by banks in trouble. The uncertainty regarding the financial
health of counterparties and a fear of contagion spread like a disease through the
interbank network, inducing banks to limit their interbank exposures. The highly
interconnected modern financial world thus facilitated the rapid transmission of
the shock. Central banks were forced to step in and provide unprecedented
liquidity support for the banking system. (Brunnermeier 2009; Coeuré 2012)
This paper analyses the transmission and the magnitude of credit contagion that
arises from banks’ counterparty exposures in interbank markets. It contributes to
the literature by proposing a novel interdisciplinary approach to model the credit
contagion with an epidemiological model which is extended to take into account
the characteristics of financial institutions and financial markets. The paper
contributes to the literature by introducing an endogenous loss-given-default
(LGD) which is time-dependent. As the model is implemented in a network
context with actual data on large European cross-border banks, we are also the
first ones to provide evidence on the cross-border contagion in European level
prior and during the financial crisis. So far, most of the credit contagion analyses
with real data have concentrated at the national banking systems.
Although other channels for contagion exist and a variety of shocks (for instance,
common external shocks) has affected the banking sector, credit contagion
continues to be prominent as regards financial stability. For instance, several
financial institutions such as AIG and German IKB have been rescued by
authorities because the risk of credit contagion was assessed to be too high
(Upper 2011). Thus, the paper complements recent work applying network
modelling (see, among others, Krause & Giansante 2012; Anand et al. 2013; Gai,
Haldane & Kapadia 2011).
In this paper, the susceptible – infected – recovered (SIR) model by Kermack &
McKendrick (1927) provides a framework to analyze the consequences of an
idiosyncratic shock for the whole banking system. In the original SIR model the
propagation of contagion depends on the existence of contacts between
Acta Wasaensia
65
individuals and the transmission rate of infection. The analogy to credit contagion
is eminent. The contagion in interbank markets occurs when counterparties are
connected and spillover effects from a contagious bank are greater than healthy
banks' buffers. As the SIR model's dynamics are very similar to the spreading of
negative domino effects in a financial system, it thus can be applied in financial
context. 20 Also Haldane & May (2011) and Haldane (2009) have demonstrated
that the similarities between propagation of contagion and epidemics are striking
as both involve the spread of negative effects that lead to increasing numbers of
affected individuals/institutions, fear of contamination and to outright panics if
things get really bad. 21 Owing to the similarities, the SIR model is well-suited to
describe the contagion in an interbank network.
An important insight of the epidemiological model is that contagiousness follows
a certain course and that each affected individual can have a varying impact on
others depending on the severity of its problems. Using this approach, we are thus
able to model an endogenous loss-given-default which is time-dependent. As time
passes the losses induced by a contagious bank increase. This modelling approach
tracks the repercussions of credit contagion in a realistic manner. At the
beginning of the crisis the bank may still be able to honour a part of its
obligations. But when situation becomes more difficult, bank may default and
create larger externalities to the system. In a sense, the model thus captures the
aspects related to market expectations. As negative market perceptions on the
financial strength of a bank increase, self-fulfilling assumptions often lead to
deteriorating conditions for that specific institution. The more a bank has
borrowed from interbank markets, the more vulnerable it is for speculation.
Finally, the SIR model also provides us additional insights on how the contagion
and systemic risks build up in the banking system as time passes.
To track the negative repercussions of contagion in a realistic manner, the basic
SIR model is extended to incorporate the heterogeneity of banks in terms of
vulnerability to shocks, contagiousness and interbank relationships. Given the
importance of banks’ interconnectedness (see, for instance, Allen & Gale 2000;
Acemoglu, Ozdaglar & Tahbaz-Salehi 2013; Battiston et al. 2012), network
20
21
Other epidemiological models such as SI and SIS models could have also been used for the
analysis. However, these models do not incorporate the "recovery" stage. They thus fail to
recognize the situation in which institution/bank often continues to exist as a legal entity after
its rescue/recapitalization/bankruptcy proceedings.
In addition, Garas et al. (2010) have previously used the SIR model to investigate the transmission of economic crisis from one country to another via international trade. Carroll (2006)
has also used the model to analyze the spreading of macroeconomic expectations in the population over time.
66
Acta Wasaensia
modelling seems an appropriate starting point for the analysis. Therefore, the SIR
model is applied in a network context. Many highly heterogeneous financial and
social systems can be best described by a network in which nodes represent
individuals or organizations (here banks) and links (here interbank exposures)
stand for the interactions between the units. The advantage of network modelling
is that it provides valuable insights into large and complex networks and offers
statistical methods to describe and quantify network properties (Newman 2003).
As many real-world interbank banking networks have the properties of scale-free
networks (see, for instance, Boss et al. 2004; Soramäki et al. 2007), a large set of
networks is simulated with a model by Barabasi & Albert (1999). Based on the
extended SIR model, generated networks and data on 51 European banks, we
simulate credit contagion in banking system.
Finally, to provide more intuition for the driving forces of the contagion, we
analyze to what extent the simulation results are driven by the bank-specific
factors such as size and position in the network. The main motivation is to find
indicators that are of relevance for financial stability. The Basel Committee has
already identified a few indicators for interconnectedness of systematically
important banks, but these indicators refer only to the volume of intra-system
assets, liabilities and securities (BIS 2013). It is of importance to identify
additional indicators that supervisors and regulators could use in their efforts to
safeguard financial stability. Therefore, we disentangle the relationship between
contagion as well as bank characteristics and network properties. In contrast to
previous contributions, we test a large set of individual indicators. The analysis
also sheds light on the relevance of central bank policies by assessing whether
central bank interventions are helpful in containing the negative spillover effects.
The results show how contagion spreads in the European banking system,
segmenting banks into two categories. On average, the contagion affects
negatively about 40% of the European banks in 2010, but considerable
heterogeneity remains between individual simulation outcomes. The magnitude of
the negative spillover effects is almost twice as large in 2007, just before the
onset of the financial crisis. In terms of nationality, French, British, German and
Spanish banks are able to induce widespread contagion, while banks from Ireland,
Greece and Portugal have only limited negative effects on the system.
Regarding the leading factors of contagion, a bank's central position in the
network, banking clusters with large interbank loans, several connections and a
bank’s size are meaningful in explaining the negative spillover effects. In terms of
bank-specific factors, weighted clustering coefficients, centrality measures
(betweenness, eigenvalue and closeness centrality), a bank’s high connectivity, a
Acta Wasaensia
67
bank’s size and volume of in-coming interbank loans are significant factors in
explaining the contagion. Finally, central bank liquidity operations and other
central bank measures are efficient for alleviating contagion and financial crisis,
although the impact is limited.
The rest of the paper is organized as follows: Section 2 overviews the previous
academic literature related to interbank contagion and network analysis. The
analytical framework, with the extended SIR model, model calibration, simulation
parameters and generated networks, is described in section 3. Results of the
contagion analysis are presented in section 4, while section 5 contains the bank
and network indicators, the regression analysis and its results. Section 6
concludes.
2 RELATION TO THE LITERATURE
The number of studies on contagion and networks has increased markedly in
recent years. This paper relates to the following four streams of literature. First,
theoretical models indicate that contagion spreads in the network of banks’
financial linkages and that the network’s structure affects the financial stability of
the banking system in a nonlinear way. The seminal paper by Allen & Gale
(2000) finds that the negative effects depend on the structure of the interbank
markets. Adding further reality to models, for instance, in terms of fire-sales,
heterogeneous banks and network structures, Acemoglu, Ozdaglar & TahbazSalehi (2013), Battiston et al. (2012) and Gai & Kapadia (2010) show that high
interconnectedness of banks may not necessarily be beneficial for financial
stability. While increasing connectivity attenuates contagion via risk sharing and
improves the ability of a banking system to absorb shocks, it also facilitates
spillover effects and can make the system more fragile ("robust-yet-fragile"
tendency).
The second set of papers provides further evidence on the risks of a financial
system by modelling financial connections between banks as networks and
employing simulation techniques to assess the outcomes of a bank failure. (Anand
et al. 2013; Gai, Haldane & Kapadia 2011; Nier et al. 2007; Arinaminpathy,
Kapadia & May 2013; Krause & Giansante 2012; Iori, Jafarey & Padilla 2006)
Based on a set of assumptions, accounting identities and behavioural rules, these
models present a banking sector composed of individual banks with balance
sheets and a transmission mechanism for shocks. The contagion arises when the
losses arising from counterparty exposures or liquidity shortages exceed the net
equity of a bank, inducing a bank failure. An enlargement of interbank liabilities,
68
Acta Wasaensia
high concentration of the banking sector and a shock to a well-connected and big
bank are shown to make the system vulnerable to large systemic risks.
Meanwhile, the higher the capital ratios of banks, the more resilient the system is
to large systemic risks. Finally, the structure and tiering of the network are crucial
for explaining the magnitude of the contagion.
Third, empirical studies based on granular bank-level data analyze credit
contagion at the national banking system level, thus providing insight into the
vulnerabilities of existing networks (Upper 2011; Mistrulli 2011). The domino
effects arise from losses related to interbank lending to the failed bank. Results
point to potentially significant contagion effects, albeit a substantial weakening
remains a tail event.
The fourth set of contributions provides analyses of the characteristics and
structures of real-world networks (so-called network topology) by applying
network metrics. Iori et al. (2008), Boss et al. (2004) and Craig & von Peter
(2010), for example, investigate national interbank markets, whereas Minoiu &
Reyes (2013) study the global cross-border banking network, Markose, Giansante
& Shaghaghi (2012) analyze networks of credit default swaps (CDS) and
Soramäki et al. (2007), among others, look at the payment systems. A typical
financial network is shown to be complex and characterized by a high-level of
tiering. Few banks have large numbers of counterparties; the majority of banks
have only a few linkages. Thus, certain key players act as central hubs that
connect otherwise remote parts of the network. In this paper, network linkages are
modelled so as to replicate these properties. In addition, Minoiu & Reyes (2013)
indicate that the banking network has become more tightly connected over time,
but the number of bank linkages has decreased during the systemic banking
crises.
3 ANALYTICAL FRAMEWORK
The framework consists of the SIR model, generated networks and additional
parameters that are calibrated with data on large cross-border banks in Europe.
First, the SIR model describes the contagion dynamics in the financial networks,
i.e. how the contagion spreads in the system and how a non-affected bank becomes contagious. This approach allows us to model time-dependent loss-given
default rate that is endogenously defined. Second, we generate multiple interbank
networks by using Barabasi & Albert (1999) model as the actual bank-to-bank
linkages are not observable. Finally, we extend the basic SIR model with addi-
Acta Wasaensia
69
tional parameters to reflect banks’ heterogeneity in terms of vulnerability and
contagiousness.
In this paper, the parameters of the model and generated networks are calibrated
with BIS data and information from 51 major European cross-border banking
groups. All banks in the sample were included in the EU-wide stress-test by the
European Banking Authority (EBA) in 2010. 22 Their headquarters are in
Germany, France, Italy, Spain, the Netherlands, Belgium, Austria, Portugal,
Greece, Ireland, the UK, Denmark and Sweden. And the total assets of the banks
in the sample amount to 26.6 trillion euro in 2010 and 25.2 trillion euro in 2007,
constituting approximately 62 % of the whole European banking sector. The
detailed use of data is presented alongside with each parameter.
Once the framework is in place, the contagion simulations are run to test the
fragility of the banking system. In the short-term, these contagion simulations are
based on an algorithm that is similar to the solution used by Furfine (2003).
However, regarding the solution for time dimension we adhere to the approach of
Eisenberg & Noe (2001).
3.1
The basic SIR model
The analysis of contagion is based on a SIR model by Kermack & McKendrick
(1927). In the model, banks are divided into three sub-groups, susceptible (st),
contagious (ct) or recovered (rt), at any point of time t. The number of institutions
is set at N, so that the size of the banking community does not fluctuate over time.
With the number of banks fixed, st + ct + rt = 1 for all t ≥ 0. At the beginning, we
assume that the banking community has not previously encountered a shock, so
that r0=0. When an idiosyncratic shock hits the system, the initial number of
contagious banks is small but positive (i.e. c0=ε). These assumptions lead to the
final initial condition, indicating that in the first place the majority of banks are
susceptible (s0=1-ε). Being susceptible means that a bank is currently nonaffected by the crisis but remains vulnerable to negative domino effects.
While the main parameters of the analytical framework are depicted in table 1, the
following equations define the dynamics of the model.
𝑣𝑡 = −𝜆𝜆(𝑡)𝑐(𝑡)
22
See: http://www.eba.europa.eu/risk-analysis-and-data/eu-wide-stress-testing/2010
(1)
70
Acta Wasaensia
𝛾
∞
𝑐𝑡 = ∫0 𝜆𝜆(𝑡)𝑐(𝑡) − ∫𝛾 𝑐(𝑡)𝑑(𝑡)
∞
𝑟𝑡 = ∫𝛾 𝑐(𝑡)𝑑(𝑡)
(2)
(3)
Equation (1) defines the number of banks that leave the susceptible category at
time t, v(t), by becoming contagious and a target of market speculation owing to,
for instance, a deteriorating capital position or large counterparty exposures. The
term λs(t)c(t) portrays the fact that susceptible banks, s(t), must have contacts
with contagious banks, c(t), so that the contagion can spread, and that the
contamination occurs at a certain transmission rate, λ. The second equation
defines the total number of contagious banks, by subtracting from the number of
𝛾
banks which have become contagious, ∫0 λs(t)c(t) , the number of banks
∞
recovering from the crisis (∫𝛾 𝑐(𝑡)𝑑(𝑡)). Finally, equation (3) defines the total
number of recovered banks.
Table 1. Description of parameters and calibration
Parameter
Description
Calibration
N
s(t)
c(t)
r(t)
γ
λij
Number of banks
Susceptible banks at t
Contagious banks at t
Recovered banks at t
Time to recovery
Contagion transmission rate between
banks i and j
Share of bank j's interbank loans from
bank i in relation to bank j's all
interbank loans
Volume of the interbank funding
Loss-given-default rate of bank i
Vulnerability of bank j
51
Endogenous variable
Endogenous variable
Endogenous variable
3
Depends on EXPij and m
EXPij
m
αit
βj
Exogenous; From BIS data
Exogenous; From BIS data
Endogenous variable
Exogenous; From data on
banks' equity ratios
In this paper, as in Garas et al. (2010), recovery means that a bank (or a part of it)
overcomes the crisis and stops emanating negative externalities in the banking
Acta Wasaensia
71
system until the end of the period. The recovery may occur in many ways: the
bank may be rescued by its owners (via recapitalization, for instance), is rescued
by the authorities or enters the resolution process 23. Regardless the method, a
bank is no longer a cause of concern or under immediate market suspicion and is
again eligible as a counterparty. This assumption is realistic, taking into account
what happened during the latest financial crisis. For instance, banks such as Dexia
and Northern Rock came under a severe stress and were bailed out by
governments but continued to exist for some time. In addition, many banks
received capital injections during the financial crisis. Lately, the restructuring of
Cypriot banks and the case of Banco Espirito Santo in Portugal are examples of
recovery in which the institutions continue to operate in banking system albeit in
somewhat altered form.
The recovery process takes time. In the baseline calibration, the recovery rate of
banks, γ, is set at three time steps. The strict assumption is made for tractability of
the results and can be readily relaxed without affecting the overall results. Once a
bank has reached the final category, its status does not change and it no longer
spreads the contagion.
In the basic SIR model all banks are similar but in reality institutions differ, for
example with respect to vulnerability to shocks, contagiousness as well as number
and volume of interbank linkages. To take into account the variation between
banks, the SIR model is next enhanced with individual heterogeneity.
3.2
Bank-specific contagion transmission rate
First of all, following Garas et al. (2010), a single transmission rate, λ, is replaced
by a set of separate transmission parameters reflecting the properties of banks.
The individual contagion probability (λij) reflects the likelihood that a contagious
bank i transmits the crisis to a previously non-affected bank j. The outcome
depends on the interbank exposure between banks i and j (EXPij) and the size of
the overall interbank market (m) (equation 4).
𝜆𝑖𝑖 = 𝐸𝐸𝐸𝑖𝑖 × 𝑚
23
(4)
The new EU bank recovery and resolution directive (BRRD) entered into force on 1 January
2015. According to the BRRD shareholders and bondholders cover the first losses in the case
of the bank’s insolvency. While the BRRD was not effective in 2007 and 2010, we do not exclude the resolution as a means of recovery in our set up.
72
Acta Wasaensia
The interbank exposure (EXPij) depict the counterparty credit risk. It is defined as
the share of bank i's interbank loans from bank j (expij) relative to the total
amount of a bank j's interbank lending (total expj) (equation 5). This ratio reflects
the vulnerability of the lender bank j to the potential default of borrower bank i.
The larger the share of interbank loans from to bank i, the more likely it is that
bank j will also be negatively affected if bank i encounters difficulties.
𝐸𝐸𝐸𝑖𝑖 =
𝑒𝑒𝑒𝑖𝑖
𝑡𝑡𝑡𝑡𝑡 𝑒𝑒𝑒𝑗
(5)
The interbank exposures are approximated by using consolidated banking
statistics of the Bank for International Settlements (BIS). This statistical source
provides information on banks’ financial claims, covering the cross-border bank
exposures of a country’s banking sector vis-à-vis other countries. As interbank
loans are allocated to the actual lender who will bear the losses in case of
borrower default, the data reflect the actual financial linkages. These data come
closest to approximating the real interlinkages within an interbank network since
public data on actual international bank-to-bank exposures are not available. As
BIS statistics do not include information on outstanding amounts of interbank
lending within a country, the interbank positions of banks within the same
jurisdiction are obtained from the monetary financial statistics (MFI statistics).
These statistics are combined by the European Central Bank (ECB) for euro area
countries and by national central banks and statistics offices for Denmark,
Sweden and the UK.
Overall, BIS data on the cross-border claims of the banking sectors show that
sample banks’ exposures are mainly towards euro-area (EA) banks. Exposures
vary between 95% for the UK and 34% for Sweden in 2010. The five largest EA
countries, Germany, France, Italy, Spain and the Netherlands, constitute the
majority of these cross-border counterparties. Non-euro counterparties are
significant only for Sweden, Greece and Spain. Compared to 2007, the
importance of the counterparties from the largest EA countries and non-euro area
countries has increased while banks’ exposures from other euro area countries
have diminished.
From the BIS statistics, interbank receivables of country J’s banking sector from
country I (expij) are divided by the total amount of country J’s cross-border claims
(total expj). These country level shares are subsequently used as the initial
estimate for cross-border interbank exposures of individual banks. Similarly,
weights for individual banks within a country are obtained from the MFI
statistics. The estimates are likely to differ somewhat from actual interbank
exposures. However, data collections (and cross-border exposures) are usually
Acta Wasaensia
73
governed by large, internationally active institutions similar to those included our
sample. Therefore, the current weights are assessed to be reasonable.
While the bank-specific exposure variable assigns the relative importance for
each counterparty exposure channel between two individual banks at a certain
point of time, it does not reflect the general development of interbank markets
over time. The global volume of the interbank markets has shrunk dramatically
since the onset of the financial crisis, as banks reacted jointly to changes in the
operating environment. This lack of liquidity has been referred to as a funding
liquidity shock by Haldane & May (2011). To account for the overall importance
of interbank markets and to compare contagion results over time, the evolution of
the market must be taken into account. Therefore, a parameter determining the
volume of the interbank markets (m) is added to the model. Based on the BIS
data, the exposures of the banking sectors in the sample were 1.8 times larger in
2007 than in 2010.
3.3
Network generation
Owing to the lack of detailed information on actual bank-level interlinkages at the
certain point of time (s(t)c(t)), we generate interbank networks with the wellknown scale-free network model by Barabasi & Albert (1999). The BarabasiAlbert model is also chosen because it mimics the characteristics of real-world
banking networks such as a power-law distribution for the number of interbank
connections. 24 The size of the network is set at N=51, reflecting the number of the
banks in the sample. In the benchmark case, the scale-free network is composed
by assuming that each bank creates at least six links. 25
Preferential attachment is assumed, meaning that banks have a preference to
connect to institutions that already have a large number of contacts. This is an
intuitive assumption given that banks in interbank markets are more likely to
establish business relationships with renowned banks rather than with less-known
counterparties (or banks with bad reputation) and that trust plays an important
role in money markets. Thus, we assume that the probability of a new bank j
connecting with an existing bank i depends on the connectivity of the bank i (ki),
24
25
In technical terms, the number of banks’ connections (i.e. degrees (x)) that a given bank (i.e.
node) has with other banks in the network follows a power-law distribution, P(x) ~ x-λ, with a
long-tail. (Boss et al. 2004; Soramäki et al. 2007; Craig & von Peter 2010; Iori et al. 2008)
This assumption is relaxed later on.
74
Acta Wasaensia
i.e. π = 𝑘𝑖 / ∑𝑗 𝑘𝑗 . 26 (Barabasi & Albert 1999; Keeling & Eames 2005; Newman
2003) It is noteworthy that although banks create equal numbers of linkages when
entering the network, the final number of individual banks’ linkages differs. Some
banks will have more connections than others. Ultimately, some banks have more
connections in the network than others.
The generated network represents banks’ connections (s(t)c(t)) and is so called
adjacent matrix, ADJij, which is 51*51 matrix and consists of zeros and ones.
Zeros signify that no connection exists between banks, while one means that
banks are interlinked. To combine information on banks’ interlinkages and initial
estimates for cross-border interbank exposures the adjacent matrices are
subsequently weighted with BIS data for 2007 and 2010. 27 In essence, the
generated network linkages (ADJij) are thus weighted with bank-specific
contagion transmission rates (λij) in order to obtain weighted networks (NETij)
and to implement the SIR model in a network context.
To capture the wide range of plausible interbank linkages in the banking system,
we generate 10,000 networks. This approach enables us also to introduce
heterogeneity into banks’ interbank networks. Each realization of the generated
network is independent and has a unique structure.
Figure 1 depicts a realization of the interbank network of European banks in the
sample. In the figure, the circles (or so called nodes) symbolize banks 28 and lines
between the circles are represented by interbank exposures. The darker the line,
the higher is the volume of interbank exposures and the contagion transmission
rate between two banks. Banks with a large number of connections and large
interbank exposures lie in the centre of the network; other banks are on the
outskirts. In other realizations of weighted networks the size of exposures and the
ordering of banks differ.
26
27
28
The probability has the following conditions: πi = [0, 1] and ∑πi =1.
The underlying basic set of realisations for undirected networks remains the same for both
2007 and 2010. Only the weighting of the networks with bank and exposure-specific values
differentiates the directed networks.
In order to track the contagion results in the contagion simulations, nodes also carry information on banks’ vulnerability, loss-given-default rate, volume of total assets and nationality.
Acta Wasaensia
75
Figure 1. Example of a network for European banks
Note: A realization of the Barabasi-Albert (1999) model for the European interbank network.
Each circle represents a bank in the sample, and its size is scaled in proportion to the sum of
interbank exposures of the given bank at the end of 2010. The lines between the circles represent
interbank linkages between individual banks. The darkness of a line reflects the proportional
value of a bilateral exposure.
3.4
Endogenous loss-given-default
The dynamics of the SIR model and the generated interbank networks already
give a basis for the simulations of the credit contagion. However, to add further
reality in the analytical framework we introduce additional variables that govern
the spreading of negative spillover effects.
First, after the bank i is affected by negative spillover effects its own
contagiousness is assumed to depend on time (αit). The loss-given-default of a
bank is thus assumed to evolve in stages and it increases as time passes; the
longer bank i has encountered difficulties, the higher the probability that its
counterparties will also be affected via the interbank network and the higher are
the losses for bank i’s counterparties. This feature is designed to capture the fact
that during the first stages of the crisis, the losses are normally relatively small as
banks are often able to honour their obligations. The aggravation of the crisis
often increases the default rates and bank losses rise. As a result, the overall
negative externalities to the whole banking system also start to mount. The
increasing loss-given-default rate also reflects to some extent the heightened
76
Acta Wasaensia
mistrust and uncertainty in the interbank markets as well as rising suspicions
about counterparties and a reluctance to engage in business relationships with
banks in trouble. Growing expectations concerning banks’ inability to weather the
storm cause direct losses to rise and augment contamination of the banking
system. In a sense, the model thus mirrors the psychological aspects of interbank
contagion.
In the baseline simulations, the loss-given-default rate variable is modelled with a
stepwise function that receives three different values (equation 6).
𝛼𝑖𝑖 = �
0
0.5
1
, 1≤𝑡>2
, 2≤𝑡>3
, 𝑡≥3
(6)
The values of function reflect probabilities of zero, 50% and 100% at the first,
second and third time steps after the initial contact with a beleaguered
counterparty, respectively. While the nominal values of loss-given-default rates
remain uniform for all banks in the sample and equation (6) defines values for all
banks once they are infected, the αit is endogenous as it depends on the spreading
of the contagion. Thus, different banks can receive different values at a given
point in time. It should nevertheless be noted that high contagiousness of bank i
does not necessarily guarantee the propagation of negative effects in the banking
system, as other variables also play a role in the spreading of the contagion. The
assumption regarding the values of equation (6) and the number of steps are
relaxed and tested later on.
3.5
Bank-specific vulnerability
In reality, banks also differ in regard to their financial strength. The importance of
capital buffers for financial stability has also been demonstrated in previous
academic papers (see, for instance, Nier et al., 2007). To incorporate such
heterogeneity into the analytical framework, we introduce a variable (βj) to
measure the vulnerability of bank j to negative spillover effects. Arinaminpathy,
Kapadia & May (2013) take an analogous approach by modelling the health of a
financial institution as a function of the bank’s capital and liquidity positions. In
this paper, the variable (βj) portrays the bank’s financial standing, as it is
dependent on the equity capital of bank j. When the risks materialize, the equity
capital acts as a first line of defence. If the equity ratio is low, the bank is likely to
be more vulnerable than other banks in the system.
Acta Wasaensia
77
To get the parameter values (βj) we first use data on the sample banks’ annual
reports to calculate bank-specific equity ratios by dividing common equity by
total assets. An alternative measure would be the solvency ratio, defined as
regulatory capital over risk-weighted assets. However, the financial crisis has
shown that this ratio may not always be representative. Tier 1 solvency ratios and
core Tier 1 capital ratios are nevertheless used in robustness tests. The equity
ratios of the banking groups differ considerably and stand, on average, at 4.1% for
2007 and 4.6% for 2010. Secondly, based on the observations for the equity ratios
we derive their distributional characteristics. Equity ratios of the banks in the
sample follow the normal distribution in 2010 with mean 4.89 and standard
deviation 1.77 and in 2007 with mean 5.06 and standard deviation 2.07. 29 Finally,
with the mean and standard deviation of normally distributed equity ratios we
obtain the corresponding cumulative distribution. The values of this cumulative
distribution represent the parameter values (βj) for each equity ratio, indicating
the bank’s financial strength.
3.6
Contagion mechanism
Based on the analytical framework and model calibration, we subsequently
simulate the transmission of credit contagion in the banking network. In the shortterm, these contagion simulations are similar to the Furfine (2003) algorithm.
However, regarding the solution for time dimension we adhere to the approach of
Eisenberg & Noe (2001).
In the simulations, contagion starts with an exogenous and idiosyncratic shock
hitting a single bank in the system. Network-specific results are derived by letting
each bank (N=1,...,51) one by one to be a source of the contagion and by exposing
the whole banking system to the effects of direct and indirect contagion. The
probability of being contagious is thus uniform for all banks irrespective of
characteristics such as size and links with other banks. The contagion process is
simulated for each network realization. As we generate 10,000 different networks
and let 51 banks to be the original source of an exogenous shock in each network,
we thus simulate 510,000 cases in a benchmark simulation.
Secondly, the contagion spreads when the losses from contagious bank i are
larger than the financial strength of non-affected (susceptible) bank j (λij(s(t)c(t))
29
Both the Jarque-Bera and Lilliefors tests confirm that the samples for both years are from
normal distributions.
Acta Wasaensia
78
* αit > βj). Thus, the bank fails and negative domino effects spread, if the bank’s
financial strength is too low in comparison to its risks and counterparty exposures
in the interbank market. Finally, the contagion simulations stop when there are no
more contagious banks or when all banks have been exposed to the crisis.
4 PROPAGATION OF THE CRISIS
4.1
European banking sector as a whole
The simulations demonstrate how the contagion spreads in the European banking
system, splitting the banking sector in two parts. A similar thing occurred during
the current financial crisis when the European banking sector was divided into
“good names”, with access to interbank lending, and “bad names” that were
excluded from money markets by means of larger haircuts and margin
requirements.
Based on the results of the benchmark simulation, figure 2 shows the average
total assets of non-affected, contagious and capitalized/liquidated banks at a given
point on the crisis’ timeline. While some banks are strong enough to resist the
crisis and are able to continue their business, the others fall under market
suspicion, transmitting market distress further (contagious banks), and are
ultimately segregated to the group of crisis-stricken banks. At the end of the
benchmark simulation the assets of capitalised/liquidated banks total, on average,
10 trillion euro, constituting around 40% of total assets of banks in the sample. 30
The standard deviation indicates that the variation between different network
structures is relatively small and that the total assets of banks hit by the crisis
hover around 8.2-11.7 trillion euro. Despite the widespread contagion the rest of
the banking system is able to avoid negative spillover effects and the average total
assets of non-affected banks stand at 15.9 trillion euros after 27 time steps.
30
The overall average for total assets is obtained by first calculating the average for each individual network over all banks (N=51) and then averaging these individual network results
over all generated 10,000 networks. The average does not include the total assets of the first
failing bank.
Acta Wasaensia
79
Figure 2. Average total assets of capitalised/liquidated, contagious and nonaffected European banks, benchmark simulation for 2010
Euro trillion
30
25
20
15
10
5
0
1
2
3
4
5
6
7
8
9 10 11 12 13 14 15 16 17 18 19 20 21 22 23 24 25 26 27
Time
Note: The results are based on the benchmark contagion simulation. Average total assets for
each category is calculated over all banks in the sample (N=51) and all generated 10,000
networks. Blue and black lines represent the average cumulative sum of capitalised/liquidated
banks’ and non-affected banks’ total assets at the given point in time, respectively. Red line
represents the average total assets of contagious banks at each point of time. Horizontal axis
represents the time steps. Std. dev. stands for standard deviation. Results do not include the
total assets of the first failing bank.
While the average cumulated sum of capitalized/liquidated banks’ total assets
portrays the combined effect of the contagion on the banking system over time,
the average total assets of contagious banks at each point in time describes the
evolution of the contagion process. Based on the benchmark simulation the
majority of transmission occurs at the beginning of the crisis, as the volume of
contagious banks exhibits an initial increase between the second and eighth time
steps. Without any further shock to the system the force of the contagion then
slowly declines towards the end of the estimation period. The system stabilizes
around the steady state at the 18th time step.
However, the overall average conceals individual differences as the contagion
may be considerable in individual cases. For instance, in a single network the
average 31 total assets of capitalised / liquidated banks constitute up to 16.5 trillion
euros after all banks in the system are exposed to negative domino effects. Thus,
31
The average is calculated over all banks (N=51).
Acta Wasaensia
80
contagion can affect 62% of the banking system in 2010. Moreover, the failure of
a single bank in a network can contaminate up to 82% of the banking system,
corresponding to 21.9 trillion euro in terms of total assets. At the other end of the
spectrum are the networks in which no contagion appears after the initial round of
bank failures.
Figure 3. Average cumulative sum of contagious banks’ total assets at each point
in time, benchmark simulations for 2007 and 2010
2007
25
2010
Std.dev.
EUR trillion
20
15
10
5
0
1
2
3
4
5
6
7
8
9 10 11 12 13 14 15 16 17 18 19 20 21 22 23 24 25
Time
Note: The results are based on the benchmark contagion simulations for 2007 and 2010. Lines
represent the averages for the cumulative sum of contagious banks’ total assets at the given point
in time. Averages are calculated over all banks (N=51) in the sample and all generated 10,000
networks. Horizontal axis represents the time steps of the contagion simulation. Std. dev. stands
for standard deviation. Results do not include the total assets of the first failing bank.
Compared to 2010, the magnitude of the contagion is almost twofold in 2007, just
before the onset of the financial crisis (Figure 3). At the end of all simulation
rounds, the average contagion affects around 70 % of the banks in 2007,
corresponding to 18.4 trillion euro of total assets. Prior to the financial crisis the
European banking system was therefore much more prone to negative shocks than
in 2010. The outcome reflects the increasing equity as well as banks’ efforts to
restrict their exposures in the midst of the financial crisis.
Acta Wasaensia
4.2
81
Contagion at the country-level
In order to shed more light on contagion in the European banking system, Table 2
shows how the contagion depends on the nationality of the first failing bank. 32 At
the end of 2010 Spanish, British, German and French banks are able to induce
widespread contagion, while contagion from other banks is much more subtle
than the average. Spanish banks are the most detrimental to the system, as the
assets of banks affected by the failure of a Spanish bank total 14.5 trillion euro,
corresponding to 56% of the total assets of the system. In contrast, banks from the
program countries (Ireland, Greece and Portugal) have only slightly smaller
impacts on the system than banks from Belgium, the Netherlands, Austria,
Sweden and Denmark.
The country-level results portray the European situation at the end of 2010.
Especially the Greek, Portuguese and Irish banks were facing difficulties in
obtaining funding from the interbank markets and were effectively excluded from
the money markets by the end of 2010. Without sufficiently large interbank
positions with the rest of the European banks they are not able to initiate a
widespread contagion. At the same time, the banks from relatively strong
European countries such as Germany and France were still well-positioned in the
interbank network, rendering them prominent sources of contagion. Throughout
the sovereign debt crisis Germany has had safe-haven status, leading German
banks to have strong linkages with other banks. Also, French banks were
considered relatively strong counterparties in 2010. The heightened suspicion
over French banks’ exposures to Greek debt came into the picture only later in
2011–2012. Meanwhile, British banks have traditionally been large institutions
with multinational business models and extensive connections worldwide.
32
The results are divided according to the nationality of the bank that starts the contagion chain
at the beginning of the simulation. The subsequent contagion may affect any bank in the system irrespective of its home country. The average is calculated over all generated networks
(10,000) and banks that have a headquarters at a given country. It should be noted that the results reflect contagion only via interbank channels included in the model; other channels such
as sovereign-banking sector linkages and trade linkages are excluded.
82
Acta Wasaensia
Table 2. Average country-level contagion according to nationality of the first
failing bank, benchmark simulations for 2007 and 2010
EUR trillion EUR trillion
Change, %
in 2007
in 2010
ES
DE
IT
FR
NL
PT
AT
BE
GR
IE
GB
DK
SE
Average
21.95
20.61
21.34
20.24
20.34
0.31
20.75
19.60
0.07
19.72
20.80
0.45
0.44
18.44
14.48
10.56
0.59
10.39
0.95
0.05
0.53
0.59
0.03
0.49
13.06
0.45
0.46
9.91
-34.0
-48.8
-97.2
-48.7
-95.3
-84.5
-97.5
-97.0
-50.9
-97.5
-37.2
-0.7
4.2
-46.3
Note: The results are based on the benchmark contagion simulation for 2007 and 2010. Contagion
is measured by the average cumulative sum of contagious banks’ total assets at the end of
simulation rounds. To calculate the overall average we first take a bank-specific averages over all
generated 10,000 networks. Secondly, we derive a country-specific averages by averaging the
results of banks that have headquarters in a given country. Thus, the averages are calculated
according to the nationality of the first failing bank. The results do not include total assets of the
first failing bank.
The results for Spanish and Italian banks may seem counter-intuitive at first
glance. But Spanish and Italian problems reached the limelight of the crisis only
in 2011–2012. Although the problems in the Spanish real estate sector were
already evident in 2008, large Spanish banks continued to perform relatively well
in 2010, owing to income from Latin American countries. Spain’s third largest
bank, Bankia, was nationalized only in May 2012, and the country received
financial support in June 2012. Despite the market volatility and uncertainty over
Italy’s debt servicing capacity, Italian banks were not a cause of concern in 2010.
Comparing the country-level results in 2010 to the outcome in 2007 data, the
contagion effects from all countries have decreased except for Sweden (Table 2).
The results reflect banks’ fear of counterparty risks and risk-aversion towards
counterparties in deep trouble during the financial crisis, inducing banks to limit
their exposures to weak market-players to the benefit of strong banks. The danger
of negative spillovers from all countries diminishes, but especially so from
Acta Wasaensia
83
Ireland, Belgium, the Netherlands, Italy and Austria. British, German, French and
Spanish banks remain effective in transmitting the contagion in both periods.
4.3
Robustness tests
Robustness tests with different parameter values and solvency ratios verify the
overall findings presented in section 4.1. In this section, we run robustness tests
by relaxing some of the assumptions regarding the parameters of the analytical
framework and generated networks.
First of all, we vary the parameters defining the bank-specific contagion
transmission rate (λij), namely the size of the interbank markets (m) and exposures
(EXPij). Increasing the value of these parameters subsequently magnifies the
contagion, albeit in a non-linear way. The negative effects build up quickly with
the initial escalation of interbank markets and exposures, but the impact on
contagion abates later on. For instance, increasing the size of the banking system
by multiplying the total volume of the interbank payments by 1.5, the resulting
contagion is 60 percent larger than in the benchmark case. But when the volume
of total interbank payments rises twofold, the total assets of contagious banks
increases only by 92 percent from the benchmark.
Second, the equation (6) can be modified to test the influence of assumptions on
the bank-specific endogeneity (αit). In the benchmark contagion simulation, we
assumed that the contagiousness of a bank evolved in three time steps,
representing loss-given-default rate of zero, 50% and 100% at the first, second
and third time step. We run the robustness tests by lengthening the time period
during which a bank remains contagiousness. At the same time, loss-given-default
rates (LGDs) increase linearly with the number of time steps. For instance, if six
time steps are chosen, LGD rises linearly from zero to 100%, implying the rates
of 0 %, 20%, 40%, 60%, 80% and 100%. 33
We let the number of time steps vary from two to twelve steps. Two steps reflects
a situation in which banks default rapidly and induce immediately large losses for
the counterparties. Similarly, twelve time steps reflect a prolonged financial
crisis. Simulations show that a smouldering crisis is more detrimental to financial
stability than a quickly transmitted one. Compared to the benchmark simulations,
33
Despite the fact that all banks have same number of time steps and loss-given-default rates, it
should be noted that the loss-given-default is determined endogenously in the model as it depends on the spreading of the contagion.
84
Acta Wasaensia
the negative spillover effects of a crisis with a twelve time steps long incubation
period are approximately 16 percent larger in 2010. We also test for the functional
form of the equation (6) and let it follow a Sigmoid function with ten time steps.
In this case, the contagion is around 22 percent larger than in the benchmark case
for 2010.
Finally, regarding the bank-specific vulnerability (βj) we calculate them on the
basis of solvency ratios instead of equity ratios. However, the results do not
change but remain similar both at the European level and at the country level.
Figure 4. Cumulative sum of contagious banks’ total assets, simulations for 2010
Note: The results are based on the contagion simulations for 2010. Horizontal axis represents the
number of links that a bank creates when entering the network (connectivity). Bars represent the
averages for the cumulative sum of contagious banks’ total assets after all simulation rounds.
Average is calculated over all banks (N=51) in the sample and all generated 10,000 networks after
all simulation rounds. Results do not include the total assets of the first failing bank.
In addition to the parameter testing, the impact on contagion of a bank’s
connectivity (i.e. the number of linkages that a bank creates when entering the
network) is analysed. In a benchmark contagion simulation, the bank creates six
links with other banks in the system and the average total assets of contagious
banks is 10 trillion euro (Figure 4). Should a bank create less than six links, the
average contagion descends. With seven or eight created links, the average total
Acta Wasaensia
85
assets of contagious banks is around 10.8 trillion euro. Nevertheless, when the
connectivity increases further, the average total assets of contagious banks starts
to decline. Thus, increasing connectivity first increases the negative spillover
effects in the banking system, but after a certain threshold the contagion declines
and the system’s resilience increases. The effect demonstrates the systemic nature
of connections. When the number of connections increases, the channels for
negative spillover effects multiply and more banks become affected. But as the
number of affected banks rise, the negative impact per individual bank declines.
5 FACTORS DETERMINING THE CONTAGION
The simulation results suggest that the contagion varies depending on the first
failing bank and network, as it is almost non-existent in some cases but in a
worst-case scenario it can be widespread and detrimental to the whole banking
systems. Given the outcome, it is of interest to analyze which bank-specific
characteristics, such as size, solvency and bank’s position in the network, are
important in driving the contagion. We therefore run a set of simple estimations
with the purpose of providing intuition for what is driving the simulation results
and of finding indicators that are of relevance for financial stability.
Furthermore, to support the ailing banking sectors during the financial crisis
central banks worldwide have taken unprecedented actions by providing
emergency liquidity assistance and by launching securities and bond purchasing
programs. For instance, the European Central Bank started to conduct its
monetary policy operations with full allotment and introduced other liquidityproviding operations. One of the reasons given for these operations was the
avoidance of contagion in financial markets. Also Freixas, Parigi & Rochet
(2000) and Georg (2013) indicate that the central bank can improve financial
stability by providing liquidity to financial institutions. Given the magnitude of
the operations, we analyze the impact of central bank actions on contagion by
including two central bank related variables in the estimations. The following first
describes the bank-specific statistical indicators and the estimation methodology,
before turning to the results of the analysis.
5.1
Definitions and data for indicators
The indicators reflect bank-specific idiosyncratic characteristics such as size,
number of counterparties and the bank’s network position.
86
Acta Wasaensia
To begin with, a bank’s size is measured by total assets. Data for total assets of
individual banks is obtained from the sample banks’ annual reports and they are
expressed in levels. The network-related indicators describe banks’ strength as
well as their importance, position, density and clustering in the network. These
indicators are commonly used to depict the topological characteristics of the
network. The indicators are calculated according to formulas in Annex 1 and on
the basis of all generated 10,000 networks (see section 3.3.). The indicator values
are thus averages.
Network metrics include the average distance (i.e. path length), which indicates
how quickly, on average, a bank may reach other banks in the system via the
links. The maximum distance (eccentricity) illustrates how far away the most
distant bank of the network is. We also calculate so-called connectivity of a bank,
which is the probability that two banks are counterparties to each other, defined as
the number of a bank’s existing links over all possible links of the bank.
Betweenness centrality indicates how dependent other banks are on a certain bank
i, and it has also been used as a proxy for a bank’s reputation. Eigenvector
centrality portrays how well connected the bank i is to other central players of the
interbank network. The banks with high eigenvector centrality have multiple links
to other well-connected banks. The clustering coefficient depicts the probability
that two counterparties of a bank are also connected to each other. A similar case
occurs if two friends of a person have a mutual friendship. A volume-based
parameter is deduced from the clustering coefficient by weighing it by the
interbank payments. Finally, we include the number of a bank’s counterparties,
the volume of in-coming and out-going interbank loans as well as the closeness
centrality showing how close banks are each other in the network. (Iori et al.
2008; Soramäki et al. 2007; Minoiu & Reyes 2013; Alves et al. 2013) Depending
on the nature of each indicator, they are expressed either in percentages or in
levels.
To analyse the impact of central bank operations on the transmission of credit
contagion we include two additional variables in the estimations. As the central
bank interventions are first and foremost reflected in their balance sheets, the
variables include a central bank’s total assets and monetary policy operationsrelated lending to local credit institutions. The data are from annual reports of
German, French, Italian, Spanish, Dutch, Belgium, Austrian, Portuguese, Greek,
Irish, British, Danish and Swedish central banks. The variables are calculated at
the national level and they are expressed in annual growth rates. In the analysis,
the country-level central bank data are associated with individual banks of the
sample according to the location of the bank’s headquarters.
Acta Wasaensia
87
Annex 2 contains descriptive statistics for contagion and bank-specific variables
at the end of 2007 and 2010. Based on the data and simulated networks, the
indicators are computed for each bank in the sample. In the case of network
indicators, we take averages over all generated networks. Looking at total assets,
the average bank is somewhat smaller in 2007 than in 2010, but the difference in
size between the largest and smallest bank is more pronounced in 2007.
Based on the network indicators, banks appear to be close to each other, and the
network is compact and dense. The simulated networks thus reflect nicely the
real-world observations on the network of the large European banks. (Alves et al.,
2013) Regarding the concentration and density of the network, the (weighted)
clustering coefficient and betweenness centrality are relatively high, reflecting the
fact that some banks have pivotal roles as hubs in the network. Any given
counterparty of a bank in the system can be reached in less than two steps while
the maximum distance (eccentricity) is no more than three steps. The connectivity
shows that 21% of all possible linkages are utilized on average, but in some cases
a bank’s active links cover almost half of its potential connections. Moreover, a
bank has 10.7 counterparties on average, but the most connected bank can have
up to 24.5 links.
Finally, the extension of central bank liquidity operations is more evident in loans
to financial institutions than in the total assets of central banks, as can be
expected. In 2007, central bank lending to banks increased in all countries but
especially so in Portugal owing to the emergence of financial market turbulence.
The growth of central banks’ total assets varied from -0.7 percent to 21.6 percent,
being often lower than the growth of liquidity assistance. In 2010, liquidity
provision continued to increase heavily in so-called program countries (Portugal,
Greece and Ireland) that received EU/IMF financial support during the crisis. But
loans to financial institutions declined in some countries as in Germany, Sweden
and Belgium.
5.2
Estimation methodology
The main explanatory variables for the level of contagion induced by bank i at
time t, Conti,t, consist of a bank’s size (TAi,t), financial standing (FinRatioi,t) and
network indicators (NetMeasurei,t) as well as the central bank policy of the
country (CB_policyt) (equation 7).
88
Acta Wasaensia
log�𝐶𝐶𝐶𝐶𝑖,𝑡 � = 𝛼𝑖,𝑡 + 𝛿1 𝑙𝑙𝑙�𝑇𝑇𝑖,𝑡 � + 𝛿2 �𝑁𝑁𝑁𝑁𝑁𝑁𝑁𝑁𝑁𝑁𝑖,𝑡 � + 𝛿3 (𝐶𝐶_𝑝𝑝𝑝𝑝𝑝𝑝)
+ 𝜀𝑖,𝑡
(7)
Contagion (Conti,t) refers to the average total losses of the financial system
resulting from the failure of bank i. It is obtained by running benchmark
contagion simulations and letting bank i fail in each generated network. The
individual simulation outcomes are then averaged over all networks to get the
variable. Size is measured by total assets (TAi,t). Network indicators consist of all
indicators listed in the Annex 1. Variables for central bank policies include annual
growth in the central bank’s lending to banks and annual growth in its total assets.
Only total assets and the volumes of in-coming and out-going interbank loans are
expressed in levels; other indicators are in percentages.
Our main motivation for running the estimations is to provide intuition for main
leading factors driving the contagion simulation results. To certain extent, the
estimations may be argued to suffer from the endogeneity problem as the
dependent variable in the regression is the output from simulations and network
measures are linked mechanically to generated networks. However, in the
estimations we use only explanatory variables with no direct effect on simulation
results. 34 While the values of all network indicators are calculated from the
networks, they do not dictate the simulation outcomes per se. They rather portray
the network properties of a bank. Moreover, we hope to find the indicators that
are of relevance for supervisors and regulators, while they try to assess the
vulnerability of the banking sector.
In a similar vein, the central bank related variables may suffer from a different
kind of endogeneity as central bank interventions tended to be largest for banks
that suffered the most during the financial crisis. Nevertheless, the central bank
variables’ correlation with the level of contagion is not evident. For instance, the
correlation is only 15 percent in 2007. Similarly, while the central banks’ loans to
banks decline in Spain, Germany, France, the Netherlands and Austria in 2010,
Spanish, German and French banks induce high contagion but contagion from
Dutch and Austrian banks is low.
34
For instance, we leave out the equity ratio that determines the vulnerability of the bank and
thus correlates significantly with simulation results.
Acta Wasaensia
89
The OLS regression analyses are performed in log-log form 35 for both 2007 and
2010. All banks in the sample (i=51) are included in the estimations. However,
owing to log-transformations the sample is reduced to 48 banks in 2010, as three
banks do not induce contagion. Because the correlations between the values of
individual network variables are high, these variables enter into the estimations
one at a time. The only exception is the weighted clustering coefficient, for which
the correlation coefficients with other network metrics are relatively low.
The coefficients for the size and volume of interbank loans that a bank has taken
from its counterparties are expected to have positive signs, as they contribute
positively to the bank’s fragility and its importance to the system. High centrality,
clustering and connectivity of a bank are also assumed to impact positively on the
contagion, since they reflect the bank’s prominence in the network and thus its
ability to transmit negative spillover effects. In contrast, long distances between
banks (as measured by path length and eccentricity) are expected to impact
contagion negatively, as sparse connections hinder the transmission process.
Central bank operations are most likely to exert a negative impact on contagion.
5.3
Results
As expected, many embedded bank-specific indicators emerge as natural
explanatory factors for credit contagion. The size of a first failing bank and
network indicators affect positively the level of contagion (table 3). According to
the estimates, weighted clustering coefficient, bank’s connectivity, volume of
interbank business as well as betweenness and eigenvalue centralities have
significant and positive coefficients in 2010, indicating the ability of these
indicators to predict contagion. Since the weighted clustering coefficient depicts
the proportional volume of interbank loans held by two interconnected
counterparties of a bank, it highlights the importance of local clusters in the
banking systems. In particular, if these clusters are composed of banks with high
interbank loan volumes, the failure of one such bank can be detrimental to
financial stability. Also, a strong capacity to borrow funds from interbank markets
combined with a relatively large number of counterparties (i.e. connectivity) can
render a bank hazardous to the resilience of the network. In a similar vein, as
shown by the betweenness and eigenvalue centrality measures, a failure of a bank
35
As a robustness test, also log-linear estimations are performed. They, however, produce similar results.
90
Acta Wasaensia
with multiple links to other well-connected banks is apt to affect negatively on the
system’s stability.
Regarding the size of the coefficients, one percentage point growth of a bank’s
total assets in 2010 increases contagion by just 0.4-0.6 percentage point, while a
similar increase in the weighted clustering coefficient of a bank increases
contagion by 80-120%. 36 Moreover, betweenness centrality indicates that if an
important intermediary of the banking system fails, contagion increases by 20%.
Table 3. Estimation results for 2010
Log (total assets)
Weighted clustering
Connectivity
Volume of in-coming interbank
loans
Eigenvalue centrality
Betweenness centrality
Growth in CB's liquidity
support
Constant
R2
No. of observations
Equation 1
Equation 2 Equation 3
Equation 4
0.55
[0.18]***
1.18
[0.09]***
4.00
[1.98]**
..
..
..
..
..
..
- 0.002
[0.001]**
- 4.89
[0.49]***
0.39
[0.16]**
0.82
[0.20]***
..
..
0.86
[0.35]**
..
..
..
..
- 0.002
[0.001]**
- 2.86
[0.92]***
0.54
[0.18]***
1.18
[0.10]***
..
..
..
..
6.79
[3.49]*
..
..
- 0.002
[0.001]**
- 4.91
[0.49]***
0.58
[0.18]***
1.15
[0.10]***
..
..
..
..
..
..
0.20
[0.09]**
- 0.002
[0.001]**
- 4.18
[0.50]***
0.85
48
0.86
48
0.85
48
0.85
48
Notes: Heteroskedasticity-consistent standard errors of the estimates are reported under the point
estimate in the brackets and are calculated according to White procedure. (*), (**), (***) indicate
statistical significance at 10%, 5%, 1%, respectively.
Central bank liquidity operations have a significant and negative effect on
contagion, indicating that central bank policies are efficient in alleviating crises
and negative domino effects in the financial markets. However, the impact is
36
Recall that the clustering coefficient is expressed in percentages. Thus a one-percentage-point
rise in the network variable increases the level of contagion by 100% of the estimated coefficient.
Acta Wasaensia
91
relatively subdued. The liquidity support of central banks in the form of loans to
local financial institutions reduced contagion only by 0.2 % in 2010. The growth
of central bank assets fails to be significant, potentially reflecting the influence of
non-standard measures. The securities market program and covered bond
purchase programme of the European Central Bank were both active in 2010,
increasing central banks’ balance sheets without direct effect on the stability of
the banking system. The outcome might also be driven by the fact that in the case
of the euro area countries the total balance sheet also includes the central bank’s
foreign-currency denominated claims on banks as well as intra-eurosystem
claims, which in some cases proved to be significant in amplifying the total
assets.
Table 4. Results for OLS estimation with 2007 data
Log (total assets)
Weighted clustering
coefficient
Closeness centrality
Path
Volume of in-coming interbank
loans
Growth in CB's liquidity
support
Growth of CB's total assets
Constant
R2
No. of observations
Equation 1
Equation 2
Equation 3
Equation 4
0.59
[0.16]***
0.87
[0.15]***
5.11
[2.56]*
..
..
..
..
- 0.002
[0.00]***
..
..
- 6.39
[2.38]**
0.59
[0.15]***
0.83
[0.15]***
..
..
- 3.80
[1.60]**
..
..
- 0.002
[0.00]***
..
..
6.38
[3.50]*
0.43
[0.13]***
..
..
..
..
..
..
1.71
[0.16]***
..
..
- 0.02
[0.006]***
2.20
[0.32]***
0.48
[0.15]***
1.05
[0.13]***
..
..
..
..
..
..
..
..
- 0.02
[0.006]**
- 1.61
[0.73]**
0.72
51
0.73
51
0.74
51
0.71
51
Notes: Heteroskedasticity-consistent standard errors of the estimates are reported under the
point estimate in the brackets and are calculated according to White procedure. (*), (**), (***)
indicate statistical significance at 10%, 5%, 1%, respectively.
92
Acta Wasaensia
Table 4 presents the estimation results with 2007 data. Overall, the results are
similar to 2010, confirming the positive relationship between contagion, size and
network indicators. In addition, the magnitude of the coefficients in 2007 is in the
similar range as in 2010. Bank clustering and the volume of in-coming interbank
loans continue to be significant variables. But bank connectivity as well as a
bank’s position as a middleman and an important partner for other banks
(betweenness and eigenvalue centralities) lose significance in 2007. However,
another centrality measure – closeness centrality – turns out to be significant.
Because closeness centrality can also be interpreted as a proxy for reputation, the
estimation results suggest that the failure of a bank with high prestige can almost
triple the contagion in the banking system. This is natural, as such a bank can be
expected to be well-integrated in the banking network and its failure would have
far reaching consequences for the system. Furthermore, the results indicate that as
the physical distance between banks (average path length) increases, the resilience
of the banking system increases.
Taken together, the results suggest that local clusters, an increase in a bank’s
connectivity, the central position of a bank in the network, bank reputation, the
size and the volume of its interbank business are the most important factors in
determining the amount of contagion in 2007 and in 2010. It would thereby seem
worthwhile to continue to give prominence to network metrics in a financial
stability analysis and continue to include these indicators in the tool box of micro
and macro prudential supervision. From a system perspective, banks that are "tooconnected-to-fail" are at least as important as “too-big-to-fail” banks.
Similarly to 2010, central bank policies manage to moderate contagion in 2007.
For instance, the results regarding the positive impact of central bank liquidity
operations hold also for 2007, indicating that central bank loans to banks reduce
contagion by 0.2 %. The growth of central bank assets has a somewhat more
pronounced impact, reflecting the influence of non-standard measures. A one
percentage point increase in total assets of central bank mitigates negative
spillover effects by 2.0 %. The growth of central banks’ total assets may have
been more related to specific problems in the banking sector in 2007 than in 2010.
All in all, although central bank policies are useful in restraining contagion, they
do not appear to be very efficient.
6 CONCLUSIONS
The interconnectedness of the modern interbank network enabled the rapid
transmission of the financial crisis by creating a transmission channel for credit
Acta Wasaensia
93
contagion and by exposing all banks in the network to potential losses. This paper
proposes a novel approach to analyze contagion by applying an epidemiological
model with network application and data on European banks. As some banks turn
out to be more contagious than others, we also employ regression analysis to
determine which bank-specific factors explain the negative spillovers.
The simulation results suggest that the crisis divides the banks in two categories:
contagious and healthy banks. On average, approximately 40% of the European
banks are affected negatively by the crisis in 2010, but the average contagion was
almost twofold in 2007. In terms of nationality, French, British, German and
Spanish banks are able to induce widespread contagion, while banks from Ireland,
Greece and Portugal have only limited negative impacts.
Moreover, high clustering of the banking system, a bank’s high connectivity,
large interbank loans, a central position of a bank in the network, and a bank’s
size are shown to explain the vulnerability of the banking system. In terms of
individual indicators, the weighted clustering coefficient, connectivity and
volume of in-coming loans are significant explanatory factors. Also relevant are
the centrality indicators that depict the bank’s position in the network. It seems
useful to include these indicators in the financial stability analyses and continue to
give emphasis to banks' position and significance in the interbank network.
Finally, central bank liquidity operations and other central bank measures are
efficient in alleviating contagion and financial crisis. But as central bank policy
can limit contagion only marginally during a crisis, efforts should be directed at
preventive measures.
94
Acta Wasaensia
References
Acemoglu, D., Ozdaglar, A. & Tahbaz-Salehi, A. (2013). Systemic risk and stability in financial networks. NBER Working Paper 18727.
Allen, F. & Gale, D. (2000). Financial contagion. The Journal of Political Economy 108: 1, 1-33.
Alves, I., Ferrari, S., Franchini, P., Heam, J-C., Jurca, P., Langfield, S., Laviola,
S., Liedorp, F., Sanchez, A., Tayolaro, S. & Vuillemey, G. (2013). The Structure
and Resilience of the European Interbank Market. European Systemic Risk Board
Occasional Paper Series 3.
Anand, K., Gai, P., Kapadia, S., Brennan, S. & Willison, M. (2013). A network
model of financial system resilience. Journal of Economic Behaviour and Organization 85, 219–235.
Arinaminpathy, N., Kapadia, S. & May, R. (2013). Size and complexity in model
financial systems. PNAS 109: 45, 18338–18343.
Barabasi, A. & Albert, R. (1999). Emergence of scaling in random networks. Science 286, 509–512.
Battiston, S., Delli Gatti, D., Gallegati, M., Greenwald, B. & Stiglitz, J.E. (2012).
Default cascades: When does risk diversification increase stability? Journal of
Financial Stability 8: 3, 138–149.
BIS (2013). Global systematically important banks: updated assessment methodology and the higher loss absorbency requirement. Basel Committee on Banking
Supervision, July, Available at: http://www.bis.org/publ/bcbs255.htm [Last accessed: 2 June 2014].
Boss, M., Elsinger, H., Summer, M. & Thurner, S. (2004). The Network Topology of the Interbank Market. Quantitative Finance 4: 6, 677–684.
Brunnermeier, M.K. (2009). Deciphering the Liquidity and Credit Crunch 20072008. Journal of Economic Perspectives 23: 1, 77–100.
Carroll, C.D. (2006). The Epidemiology of Macroeconomic Expectations. In:
Blume, L. & Durlauf, S. (Eds). The Economy as an Evolving Complex System,
III: Current Perspectives and future directions. Oxford: Oxford University Press.
Acta Wasaensia
95
Coeuré, B. (2012). The importance of money markets. Speech delivered at the
Morgan Stanley 16th Annual Global Investment seminar, on 16 June 2012.
Available at: http://www.ecb.int/press/key/date/2012/html/sp120616.en.html
[Last accessed: 2 June 2014].
Craig, B. & von Peter, G. (2010). Interbank tiering and money centre banks. BIS
Working Papers 322.
Eisenberg, L. & Noe, T.H. (2001). Systemic risk in financial systems. Management Science 47, 236–249.
Freixas, X., Parigi, B. & Rochet, J.C. (2000). Systemic risk, interbank relations
and liquidity provision by the central bank. Journal of Money, Credit and Banking 32: 3, 611–638.
Furfine, G.H. (2003). Interbank exposures: quantifying the risk of contagion.
Journal of Money, Credit and Banking 35: 1, 111–128.
Gai, P., Haldane, A. & Kapadia, S. (2011). Complexity, concentration and contagion. Journal of Monetary Economics 58: 5, 453–470.
Gai, P. & Kapadia, S. (2010). Contagion in Financial Networks. Proceedings of
the Royal Society A 466, 2401–2423.
Garas, A., Argyrakis, P., Rozenblat, C., Tomassini, M. & Havlin, S. (2010).
Worldwide spreading of economic crisis. New Journal of Physics 12.
Georg, C-P. (2013). The Effect of the interbank network structure on contagion
and common shocks. Journal of Banking and Finance 37: 7, 2216–2228.
Haldane, A.G. (2009). Rethinking the financial network. Speech delivered at the
Financial Student Association in Amsterdam on 28 April 2009. Available at:
http://www.bis.org/review/r090505e.pdf?frames=0 [Last accessed: 2 June 2014].
Haldane, A.G. & May, R.M. (2011). Systemic risk in banking ecosystems. Nature
469, 351–355.
Iori, G., de Masi, G., Precup, O.V., Gabbi, G. & Caldarelli, G. (2008). A network
analysis of the Italian overnight money market. Journal of Economic Dynamics
and Control 32: 1, 259–278.
Iori, G., Jafarey, S. & Padilla, F.G. (2006). Systemic risk on the interbank market.
Journal of Economic Behaviour and Organization 61: 4, 525–542.
96
Acta Wasaensia
Keeling, M.J. & Eames, K.T.D. (2005). Networks and epidemic models. Journal
of the Royal Society Interface 2, 295–307.
Kermack, W.O. & McKendrick, A.G. (1927). A Contribution to the Mathematical
Theory of Epidemics. Proceedings of the Royal Society A 115, 700–721.
Krause, A. & Giansante, S. (2012). Interbank lending and the spread of bank failures: A network model of systemic risk. Journal of Economic Behaviour and Organization 83: 3, 583–608.
Markose, S., Giansante, S. & Shaghaghi, A.R. (2012). 'Too interconnected to fail'
financial network of US CDS market: Topological fragility and systemic risk.
Journal of Economic Behaviour and Organization 83: 3, 627–646.
Minoiu, C. & Reyes, J.A. (2013). A network analysis of global banking: 19782010. Journal of Financial Stability 9: 2, 168–184.
Mistrulli, P. E. (2011). Assessing financial contagion in the interbank market:
Maximum entropy versus observed interbank lending patterns. Journal of Banking and Finance 35: 5, 1114–1127.
Newman, M.E.J. (2003). The structure and function of complex networks. SIAM
Review 45, 167–256.
Nier, E., Yang, J., Yorulmazer, T. & Alentorn, A. (2007). Network models and
financial stability. Journal of Economic Dynamics and Control 31: 6, 2033–2060.
Soramäki, K., Bech, M.L., Arnold, J., Glass, R.J. & Beyeler, W.E. (2007). The
topology of interbank payment flows. Physica A 379, 317–333.
Upper, C. (2011). Simulation methods to assess the danger of contagion in interbank markets. Journal of Financial Stability 7: 3, 111–125.
Acta Wasaensia
97
Annex 1: Formulas and definitions of network indicators
Indicator
Definition
Number
of
counterparties
(i.e. degree),
k
The number of
counterparties,
k,
(links) of bank i (a
node). ki is set to 1 if
banks are counterparties, zero
otherwise.
Strength (by Sum of the weights,
in-coming
w (volume of the
𝑤,𝑏
interbank loan) of
links),𝑠𝑖
bank i’s in-coming
links.
Strength (by Sum of the weights,
out-going
w (volume of the
𝑤,𝑙
interbank loan) of
links), 𝑠𝑖
bank i’s out-going
links.
Average
The average shortest
shortest path distance, d, from
length, li
node i to other
nodes, j=1,...,N, in
the network.
Eccentricity,
The
maximum
εij
distance, d, from
node i to any other
node j in the
network.
Connectivity, The number of node
pi
i’s existing links, k,
relative
to
the
number of a node i’s
all potential links.
Eigenvalue
The
principal
centrality, λ
eigenvector, v, of
adjacency matrix, A,
that defines the
(internally
connected) network.
Interpretation
Formula
The
more
the
counterparties,
the
more the creditors/
debtors of a bank.
Volume of interbank
loans that bank i has
taken from other
banks,
j=1,...,N.
(bank’s
borrowing
strength).
Volume of interbank
loans that bank i has
given to other banks,
j=1,...,N.
(bank’s
lending strength).
Describes
how
quickly a bank may
reach other banks in
the
system,
on
average.
Describes how far
away the other banks
are in the network.
Unconditional
probability that two
banks are counterparties for each other.
Describes how well
connected the bank i
is to other central
players
of
the
network (i.e. banks
with largest number
of connections)
𝑘 = � 𝑘𝑖
𝑖
𝑠𝑖𝑤,𝑏 = �
𝑠𝑖𝑤,𝑙 = �
𝑙𝑖 =
𝑁
𝑗=1
𝑁
𝑗=1
𝑏
𝑤𝑖𝑖
𝑙
𝑤𝑖𝑖
1
� 𝑑𝑖𝑖
(𝑁 − 1)
𝑖≠𝑗
𝜀𝑖 = 𝑚𝑚𝑚𝑗 𝑑𝑖𝑖
𝑝𝑖 =
𝑘𝑖
(𝑁 − 1)
λv = Av
98
Acta Wasaensia
Indicator
Clustering
coefficient,
ci
Definition
Interpretation
The
connected
neighbours of node
i, ai, relative to all
possible
connections among
these three nodes.
Thus, measures the
number of triangles
in the network.
Weighted
clustering
coefficient,
𝑐𝑖𝑤
Clustering
coefficient
is
weighted by the
volume
of
interbank
payments.
Sum of fractions of
shortest paths, δ,
between two nodes
(s,t)
that
pass
through node i
relative to total
number of shortest
paths
between
nodes s and t.
Unconditional
probability
that
bank
i’s
2
counterparties are 𝑐 =
×
𝑖
(𝑘
𝑘
also connected to
𝑖 𝑖 − 1)
each
other.
(Probability
that
� 𝑎𝑖𝑖 𝑎𝑖ℎ 𝑎𝑗ℎ
my two friends are
𝑗ℎ
also likely to be
friends of each
other.)
Proportion
of
1
𝑤
interbank
loan 𝑐𝑖 = 𝑠 (𝑘 − 1) ×
𝑖 𝑖
volume held by two
counterparties of a
(𝑤𝑖𝑖 + 𝑤𝑖ℎ )
𝑎𝑖𝑖 𝑎𝑖ℎ 𝑎𝑗ℎ
bank that are also �
2
linked to each other 𝑗ℎ
Quantifies
the
number of times a
bank acts as a
bridge along the
𝛿𝑠,𝑡 (𝑖)
shortest
path
𝐶𝑏 (𝑖) = �
𝛿𝑠,𝑡
between two other
𝑠≠𝑡≠𝑖
banks. Shows how
dependent
these
banks are from
bank i.
How
quickly
something that is
flowing through the
network
(i.e.
1
contagion,
𝐶𝑖 =
∑ 𝑙𝑖
liquidity)
is
expected to reach
bank i. Also used as
proxy
for
reputation.
Betweenness
centrality,
Cb(i)
Closeness
centrality, Ci
Inverse of the sum
of the average
shortest distances
from a node i to all
other
nodes,
j=1,...,N, in the
network.
Formula
Sources: Iori et al. (2008), Soramäki et al. (2007), Minoiu & Reyes (2013), Alves et al. (2013).
Note: N stands for the number of nodes (banks) in the network.
Acta Wasaensia
99
Annex 2. Descriptive statistics for indicators in 2007 and
2010
Year Variable
2007 Contagion, EUR bn
Total Assets, EUR bn
Equity, EUR bn
Change of CB's loans to banks, %
Change of CB's balance sheet, %
Volume of in-coming interbank loans that
a bank has taken, EUR bn
Volume of out-going interbank loans that
a bank has given, EUR bn
Weighted clustering coefficient, %
2010 Contagion, EUR bn
Total Assets, EUR bn
Equity, EUR bn
Change of CB's loans to banks, %
Change of CB's balance sheet, %
Volume of in-coming interbank loans that
a bank has taken, EUR bn
Volume of out-going interbank loans that
a bank has given, EUR bn
Weighted clustering coefficient, %
both Number of counterparties
years Shortest path
Eccentricity
Connectivity, %
Betweenness centrality, %
Closeness centrality, %
Eigenvalue centrality
Clustering coefficient, %
Mean
13 182
494
20
153.1
10.3
Std.dev.
9 442
580
24
217.5
6.7
Min
22
23
1
4.5
-0.7
Max
22 386
2 510
125
750.7
21.6
1.63
1.52
0.20
5.67
1.63
3.61
4 892
521
24
-14.3
10.2
1.32
1.77
6 149
569
27
83.0
33.4
0.48
1.05
0
31
1
-99.8
-47.3
5.70
7.19
15 012
1 998
116
155.9
63.4
1.72
1.67
0.13
6.27
1.72
3.66
10.71
1.86
2.78
21.42
1.50
1.08
0.13
31.84
1.36
1.87
4.71
0.14
0.29
9.42
2.21
0.09
0.05
1.35
0.52
0.86
5.97
1.51
2.05
11.94
0.09
0.98
0.07
27.18
6.03
7.42
24.51
2.05
3.00
49.03
9.80
1.33
0.28
33.24
Note: Indicators of banks’ size as well as central banks’ balance sheet and liquidity operations are
based on the annual reports of individual banks and central banks. Bank-level indicators are calculated for all 51 banks in the sample. Network metrics are based on all generated 10,000 networks.
Std.dev. stands for standard deviation and CB for central bank.
100
Acta Wasaensia
• Journal of Banking and Financial Economics 1(3)2015, 113–129
Risk, capital buffers and bank lending:
The adjustment of euro area banks
Laurent Maurin
European Central Bank, Germany
Email: [email protected]
Mervi Toivanen 1
Bank of Finland, Finland
Email: [email protected]
Received: 26 January 2015 / Revised: 27 February 2015 / Accepted: 10 March 2015 / Published online: 7 April 2015
ABSTRACT
This paper estimates euro area banks’ internal target capital ratios and investigates whether banks’
adjustment to the targets affects their credit supply and securities holdings during the financial
crisis in 2005–2011. Based on data on listed banks and country-specific macro-variables, a partial
adjustment model is estimated in a panel context. The results indicate, first, that an increase in
the riskiness of banks’ balance sheets positively influences banks’ target capital ratios. On the
euro area level, we find banks’ undercapitalisation in terms of Tier 1 capital ratio to be close to
2 percentage points in the middle of 2008. While median capital gaps diminish towards the end
of 2011, the heterogeneity across individual banks increases. Second, the adjustment towards
higher equilibrium capital ratios has a significant impact on banks’ assets. The impact is more
sizeable on security holdings than on loans, thereby suggesting a pecking order of bank assets for
deleveraging.
JEL classification: G01; G21
Keywords: banks, euro area, capital ratios, credit supply, partial adjustment model
1. INTRODUCTION
During the latest financial crisis, banks’ core capital was often insufficient to cover impairment
losses arising from both loan and securities portfolios. The increasing vulnerability of the banking
sector and considerable pressures from markets, regulators and policy makers highlighted the
necessity to strengthen banks’ capital base and to reduce their exposure. While new stringent
regulatory requirements for financial institutions call for higher capital levels (BIS, 2010a), banks
usually operate above minimum regulatory solvency ratios with an additional capital buffer in
order to minimise the risk of breaching the regulatory limit (ECB, 2007; Harding et al., 2013).
This voluntary buffer, together with the regulatory capital, forms banks’ internal capital. Target
1
Corresponding author: Mervi Toivanen; Bank of Finland, PO Box 160, FI-00101 Helsinki, Finland, +358 10 831 2883.
© Faculty of Management University of Warsaw. All rights reserved.
DOI: 10.7172/2353-6845.jbfe.2015.1.5
113
Acta Wasaensia
Laurent Maurin, Mervi Toivanen • Journal of Banking and Financial Economics 1(3)2015, 113–129
capital ratios are also entity specific and vary over time, partly reflecting banks’ reaction to
regulatory and market pressures. (Berger et al., 2008; Stolz and Wedow, 2011).
In the case of a capital shortfall, banks seek to close the capital gap and to reach their
internal targets. They do so by increasing their core capital, adjusting their securities portfolios
or decreasing their lending to the economy. In practise, the fastest ways to adjust to the new
situation involve raising capital and selling off securities. As increasing core capital may be
costly, especially during downturns when it is often needed to absorb losses, banks’ adjustment
to target capital ratios is likely to negatively affect their loan supply. The decreasing availability
of credit and higher cost of financing for the economy at large, in turn, exert adverse effects on
economic activity.2 Hence, monitoring banks’ capital gap and the implied deleveraging pressures
is important for policy makers. Although deleveraging has been a popular topic since the financial
crisis and although several policy measures, such as TARP and EU bank capitalisation exercises,
have been implemented to avoid deleveraging, academic evidence of deleveraging in the euro
area is still lacking.
This paper contributes to the literature by analysing the impact of the financial crisis on euro
area banks. The analysis sheds light on two issues: First, what are the determinants of euro area
banks’ internal target capital ratios? Secondly, has the financial crisis affected euro area banks’
balance sheets in general and banks’ lending and security holdings in particular? Banks’ internal
targets are estimated on a bank-by-bank basis by using bank-level data on large and listed euro
area banks, and the banking system's adjustment to target capital ratios is analysed by using
capital targets and country-specific macroeconomic variables and by applying a partial adjustment
model. The data period covers the latest financial crises starting from the first quarter of 2005,
prior to the crisis, and extending to the last quarter of 2011.
Overall, several indicators are shown to have a positive impact on banks’ internal target capital
ratios. We find that a substantial part of the movement in internal targets arises from changes in
banks’ risks and earnings associated with the economic conditions. On an aggregate basis, we find
undercapitalisation in terms of the Tier 1 capital ratio close to 2.0 percentage points (p.p.) in the
middle of 2008. The negative gap prevails at the end of 2010 but vanishes towards the end of the
estimation period. While median capital gaps diminish, the heterogeneity across individual banks
increases. The estimations suggest that more than a half of the individual institutions do not have
a capital shortfall in the beginning of 2011. At the same time, some weak banks continue to lack
adequate capital. Similar results are obtained for the total capital ratio.
Turning to the impact of banks’ adjustment to target capital ratios on assets, the estimates
indicate that closing a 1 p.p. capital gap dampens loan growth by between 2.0 and 2.3 p.p. in the
medium term. The impact on security holdings is found to be larger, approximately 5.8–7.1%,
thereby suggesting a pecking order of bank assets for deleveraging.
The literature supports the analysis approach by showing that bank-specific factors are
important in terms of capital levels and lending. In relation to solvency positions, large banks
have lower capital ratios than smaller banks, while banks maintain higher ratios in countries with
stringent capital requirements, active supervisors and effective corporate governance (Brewer et
al., 2008). Further evidence is provided by Memmel and Raupach (2010), who indicate that banks
with high asset volatility tend to have higher capital ratios. In addition to the importance of entityspecific characteristics, the speed of adjustment towards the desired capital level is shown to vary
across institutions.3 For instance, private commercial banks and banks with a high share of liquid
assets adjust their capital ratios more quickly (Memmel and Raupach, 2010).
2
See BIS, 2010b; Miles et al., 2010; Ötker-Robe et al., 2010.
3
See, for instance, Jokipii and Milne, 2008; Memmel and Raupach, 2010 and Brewer et al., 2008.
© Faculty of Management University of Warsaw. All rights reserved.
DOI: 10.7172/2353-6845.jbfe.2015.1.5
101
114
102
Acta Wasaensia
Laurent Maurin, Mervi Toivanen • Journal of Banking and Financial Economics 1(3)2015, 113–129
Banks’ adjustment towards the desired capital levels may consequently have implications
for banks’ asset composition and lending activity.4 Such an adjustment can be triggered, for
instance, by new regulation, notably the Basel Accords. Empirical papers suggest that in the US,
the Basel I regulatory framework led to slightly decreased lending (particularly with respect to
business lending), and that the risk-based capital standards were a significant factor in explaining
the credit crunch of the early 1990s.5 In addition, using a structural model and data on large US
commercial banks, Furfine (2000) indicates that changes in capital regulation influence banks’
decision making, affect commercial loan portfolios and explain the decline in loan growth.
Similarly, Basel II requirements are shown to increase the volatility of bank lending, especially
for undercapitalised and less liquid banks (Jacques, 2008; Gambacorta and Mistrulli, 2004).
Additionally, analysis regarding the Basel III regulations suggests that the increase in capital
requirement could exert a negative impact on banks’ lending volumes (BIS, 2010b).
In addition to changes in the regulatory environment, bank-specific factors influence the
credit supply. Puri et al. (2011) study German banks that were affected by the US financial crisis
and that endured heavy losses from the subprime exposures and show that these banks rejected
relatively more loan applications and thus restricted their lending to a greater extent than lessexposed banks.6 In a similar vein, Brinkmann and Horvitz (1995) indicate that the loan growth of
poorly capitalised banks is lower than that of better-capitalised competitors owing to reductions in
bank capital. Banks with binding capital constraints also seem to reduce lending more than other
banks in reaction to unanticipated drops in capital (Hancock et al., 1995; Peek and Rosengren,
2000).7 Furthermore, Spanish banks with weaker capital and liquidity ratios as well as European
and US banks with low solvency ratios, large shares of market-based funding and non-interest
income are shown to reduce lending to a greater extent than other banks. (Jimenez et al., 2012;
Gambacorta and Marques-Ibanez, 2011)
An individual bank’s response to changes in capital is also conditioned on the bank’s size.
The results of Puri et al. (2011) are particularly strong for smaller and more liquidity-constrained
banks as well as for mortgage loans. Hancock and Wilcox (1998) also show that small banks
decreased their portfolios considerably more than large banks in response to the decline in their
own bank capital.
Lastly, banks’ capital targets and financial institutions’ adjustment towards these targets
affect banks’ lending (Francis and Osborne, 2009; Berrospide and Edge, 2010). By using partial
adjustment models, estimates on banks’ internal capital ratios and data on UK banks, Francis and
Osborne (2009) show that banks with a surplus (shortfall) of capital relative to their target tend
to record higher (lower) credit growth. Berrospide and Edge (2010) analyse US banks but find
relatively modest effects of bank capital on lending. They indicate that factors such as economic
activity and perceived macroeconomic uncertainty also play a role.
The rest of the paper is organised as follows. Section 2 presents the dataset together with
stylised facts on developments in the euro area banking sector since 2005. The partial adjustment
model and the estimation results are discussed in Section 3, while Section 4 concludes.
4
Disentangling the impact of supply factors (which may be driven by changes in capital requirements) from demand factors is nevertheless
difficult, as both factors contribute to loan growth.
5
See, for instance, Bernanke and Lown, 1991; Hancock et al., 1995; Berger and Udell, 1994; Berger et al., 1995; Wall and Peterson, 1995; Peek
and Rosengren, 1995 and Brinkmann and Horvitz, 1995.
6
Furthermore, Ivashina and Scharfstein (2010) show that banks that were more vulnerable to credit-line drawdowns, that were more reliant on
short-term debt and that had limited access to deposit financing reduced their lending to a greater extent than their counterparts during the latest
financial crisis.
7
The existence of a negative link between the capital gap and lending has also been confirmed by theoretical models. For example, based
on a static model, Thakor (1996) shows that capital requirements linked solely to credit risks raise the cost of lending relatively to alternative
investments, thus increasing credit rationing and reducing aggregate demand.
© Faculty of Management University of Warsaw. All rights reserved.
DOI: 10.7172/2353-6845.jbfe.2015.1.5
115
Acta Wasaensia
103
Laurent Maurin, Mervi Toivanen • Journal of Banking and Financial Economics 1(3)2015, 113–129
2. DATA AND STYLISED FACTS
2.1. Bank data
Our dataset is based on the balance sheets and income statements of euro area listed banks
available from Thomson Reuters Datastream. The dataset includes large and listed banks
domiciled in Germany, France, Italy, Spain, Belgium and Austria. While some observations are
available from 2003 onwards, our estimation period extends from the first quarter of 2005 until
the fourth quarter of 2011 in order to ensure reasonable data coverage. Over the sample period,
the total assets of the banks included in the sample constitute, on average, 60% of the total assets
of credit institutions in the above-mentioned countries.8
Data are collected at the consolidated group level, including banks' foreign subsidiaries
and branches. Although the majority of banks report balance sheets and income statements on
a quarterly basis, some banks publish bi-annual data. In this case, missing quarterly observations
are linearly interpolated in order to ensure a sufficiently large sample. Over the sample period
only 10 percent of all observations consist of interpolated data, on average.
We extract information from Datastream on risk-weighted assets (RWAs), total assets,
retained earnings, provisioning for loan losses, total investments9 and net loans (that is, total loans
excluding inter-bank loans). Data on these variables are subsequently used to compute bankspecific indicators that reflect the riskiness of the assets and earning capacity of the bank. To get
the indicators, we divide the variables with total assets for each bank in the sample. Thus, the
indicators include loan loss provisioning over total assets, total investments over total assets and
risk-weighted assets over total assets (so called risk weights). Retained earnings over total assets
is also calculated but we modify the indicator further and take quarterly growth for it. In addition,
Datastream is used to obtain information on banks’ return on equity (ROE) and solvency ratios10,
both the total capital ratio and the Tier1 capital ratio. ROE and capital ratios are in percentages.
In respect of balance sheets, the total assets of euro area listed banks increased from 2003
to 2008. However, the financial crisis interrupted this increasing trend in 2009, and total assets
started to decline. For instance, total lending declined by approximately 5% per year in 2009 and
2010. While the mean ROE was relatively weak, banks' risk weights remained high in 2005–2001.
(See Table 1 for summary statistics on several bank-specific variables.)
Table 1
Summary statistics of bank-specific variables used in the estimation (2005Q1–2011Q4), %
Return on equity (ROE)
Risk weight
Expected Default Frequency (EDFs)
Tier1 capital ratio
Total capital ratio
Mean
8.67
64.50
0.68
8.57
11.41
Median
9.92
67.41
0.10
7.55
10.76
Note: Return on equity (ROE) as well as Tier 1 and total capital ratios are obtained directly from Thomson Reuters Datastream. Risk weight is
calculated by dividing risk-weighted assets with total assets (both series obtained from Datastream). In case of missing quarterly observations,
authors have interpolated the data. Expected default frequencies are from Moody’s.
Source: Authors’ computations based on Datastream and Moody’s.
8 Data on credit institutions are obtained from balance sheet items (BSI) statistics reported by the ECB. The possibility of using BSI data in
our analysis is limited because it includes neither regulatory concepts, such as risk-weighted assets or solvency ratios, nor income statements.
Moreover, BSI data are only available at the aggregated level for the euro area as a whole and euro area countries; thus information on individual
banks is lacking. Given that the average for a country can reflect many individual combinations of bank-specific variables, bank-level data is
necessary to analyse the adjustment of banks properly.
9 According to the data manual of Datastream, the series includes a bank’s investments in securities such as government bonds, municipal bonds,
securities under repo agreements, trading account securities and mortgage backed securities. Also securities that are available for sale are included.
10
The solvency ratios are defined as regulatory Tier 1 (or total) capital over risk-weighted assets. Banks calculate these ratios according to
supervisory regulations and Thomson Reuters Datastream collects the information from banks’ annual and interim reports.
© Faculty of Management University of Warsaw. All rights reserved.
DOI: 10.7172/2353-6845.jbfe.2015.1.5
116
Acta Wasaensia
104
Laurent Maurin, Mervi Toivanen • Journal of Banking and Financial Economics 1(3)2015, 113–129
Turning to the solvency ratios, both the Tier 1 and the total capital ratios of listed euro area
banks remained relatively stable from 2005 until the end of 2008. Since this time, the solvency
ratios have started to increase (see Figure 1). Over the estimation period, the Tier 1 capital ratio
stood at 8.6%, and the total capital ratio, at 11.4%, on average.
Looking at the distribution among the sample, the capital ratios of the banks in the sample were
rather close to each other until the beginning of the financial crisis, while from 2009 onwards, the
ratios have improved faster for the upper part of the distribution and for an average bank than for
the lower part of the distribution. Nevertheless, throughout the sample period, the banks’ ratios
remained above the regulatory minimum, on average. Given the broadly stable risk-weighted
assets from 2009 onwards, the increases in the banks’ Tier 1 and total capital ratios were mainly
driven by developments on the liability side of the banks’ balance sheets. In addition to the new
capital raised from market sources via the issuance of shares, the banks benefited capital injections
from public authorities and resorted to internal capital accumulation in the form of retained
earnings. Indeed, after having recorded losses in 2008, the listed euro area banks returned to profit
in the second half of 2009. It is only towards the end of the sample period that the importance of
reshuffling assets towards less risky exposures and deleveraging pressures increased.
Figure 1
Tier 1 capital ratio and total capital ratio for listed euro area banks (%)
1
11
Q
1
1
Q
10
Q
09
1
Q
08
Q
05
11
Q
Q
10
Q
09
Q
08
Q
07
Q
06
Q
05
Q
9
07
6
1
10
Q
7
1
11
06
8
1
12
1
9
1
13
1
10
1
14
1
11
1
15
1
Total capital ratio
Tier 1 capital ratio
12
Notes: Individual bank-level capital ratios are collected by the Thomson Reuters Datastream from banks’ annual and interim reports. Banks
calculate the ratios according to supervisors’ regulations and definitions. A capital ratio is defined as the Tier 1 capital ratio or total capital
ratio over risk-weighted assets. In case of missing quarterly observations, authors have interpolated the data. The horizontal line in the bars
represents the median of the distribution, and the blue area, the 95% confidence intervals. The limits of the boxplots indicate the first and third
quartiles of the distribution.
Source: Thomson Reuters Datastream and authors’ calculations
2.2. Other data sources
In addition to the information on banks’ financial statements, other statistical data sources are
used to capture the riskiness of a bank’s balance sheet, the bank’s credit standards, loan demand
factors and the macroeconomic conditions of individual countries. In the estimation, countrylevel data on different indicators and macro-variables are associated with each individual bank
according to the location of the bank’s headquarter.
First, we add expected default frequencies (EDFs) computed by Moody’s for each bank in the
sample. EDFs provide an estimate of the probability that a bank will default within one year, and
therefore represent the market’s perceived riskiness of the institution. From the beginning of the
2000s, the expected default frequencies of euro area listed banks have remained stable at a low
© Faculty of Management University of Warsaw. All rights reserved.
DOI: 10.7172/2353-6845.jbfe.2015.1.5
117
Acta Wasaensia
Laurent Maurin, Mervi Toivanen • Journal of Banking and Financial Economics 1(3)2015, 113–129
level, before increasing abruptly in the wake of the financial crisis. This holds both for the mean
and the distribution measured at the inter-quartile range. The perceived risk increased to a greater
extent for banks in the upper part of the distribution, namely the weakest banks, than for the
strongest banks in the beginning of 2009.
Second, we include country-specific statistics on credit standards available from the Bank
Lending Survey (BLS) compiled by the European Central Bank (ECB).11 In this survey, the
senior loan officers report on the importance of factors such as the perception of risks related to
the industry- or firm-specific outlook, expectations regarding economic activity and the impact
of changes in a bank’s own funding conditions on the bank’s credit standards applied while
approving loans and credit lines to enterprises. Moreover, the loan officers share their views on
the expected and actual loan demand by firms. Since the onset of the financial crisis, aggregate
credit standards and expectations regarding loan demand have co-moved with the macroeconomic
developments in the euro area. The credit standards tightened substantially in 2008−2009, while
demand exhibited cyclical behaviour, increasing in 2005−2007 and declining during the crisis.
The aggregate figures nevertheless mask any notable country differences.
Lastly, to control for macroeconomic conditions, the dataset includes quarterly macroeconomic
variables for each country. Gross domestic product (GDP) is taken from Eurostat in nominal
and real terms.12 The annual growth in stock prices is calculated on the basis of the Euro Stoxx
50 index, reflecting the development of the 50 largest companies in terms of capitalisation, as
available from Thomson Reuters Datastream.
3. ESTIMATION BASED ON A PARTIAL-ADJUSTMENT MODEL
Macroeconomic and bank-specific shocks affect banks’ internal target capital ratios and
banks’ responses, which involve adjusting their asset management strategies, lending policies and
securities holdings. This adjustment process is modelled with a partial adjustment model, which
is developed in two separate steps.13
In the first step, we concentrate on the relationship between bank-specific characteristics
and the target capital ratio. Risk indicators are used to estimate a target capital ratio for each
entity, while controlling for the bank’s capacity to generate income and accounting for certain
structural characteristics, such as bank size. To account for risk, both market evaluation and bank
accounting items are considered. Based on the estimated parameters, a bank’s time-varying capital
gap between the desired (unobserved and internal) target capital ratio and the actual (observed)
capital ratio is then computed for each time period. In the second step, the adjustment of loans and
securities is explained using the estimates on the bank’s capital gap and variables related to the
macroeconomic environment.
3.1. Estimating the target capital ratio
The first step focuses exclusively on the link between a bank’s target capital ratio and the
riskiness of the bank’s balance sheet, the bank’s earning capacity and the degree to which the
bank is exposed to market discipline. Banks’ internal time-varying target capital ratios, k*i,t, which
are not known to the public, are modelled as a function of bank-specific risk indicators, RISKi,t,
and variables that capture the bank’s capacity to accumulate income, INCi,t (see equation 1). Other
11
For more information on the euro area BLS, see http://www.ecb.europa.eu/stats/money/surveys/lend/html/index.en.html.
12
More information on GDP data is available at http://epp.eurostat.ec.europa.eu/portal/page/portal/national_accounts/introduction.
13
Another option would be to model deleveraging process with the partial adjustment model. However, we concentrate on capital as we want to
induce the impact of changing equity on banks’ assets.
© Faculty of Management University of Warsaw. All rights reserved.
DOI: 10.7172/2353-6845.jbfe.2015.1.5
105
118
106
Acta Wasaensia
Laurent Maurin, Mervi Toivanen • Journal of Banking and Financial Economics 1(3)2015, 113–129
119
factors, such as market pressures, the bank’s business model, the bank’s strategy and specificities
of the market in which the bank operates, are included in αi.
k*i,t = αi + θ1RISKi,t + θ2INCi,t
(1)
Owing to market frictions and adjustment costs, it takes several periods for banks to adjust
from their current capital levels towards their internal targets. Hence, a partial adjustment model
is applied to describe how a bank closes the gap between its capital ratio in the previous period,
ki,t–1, and its internal target capital ratio, k*i,t–1. This process is presented in equation (2): the
observed change in publicly disclosed capital ratio, Δki,t , is a function of the gap between the
internal target and (observed) capital ratio (k*i,t–1 – ki,t–1) in the previous period. This gap is closed
at speed λ, which lies between 0 and 1. In addition, an error term, εi,t, captures idiosyncratic
shocks during the adjustment.
Δki,t = λ(k*i,t–1 – ki,t–1) + εi,t ,
0<λ<1
(2)
Substituting (1) into (2) and rearranging the expression gives equation (3).
ki,t = λαi + (1 – λ) ki,t–1 + λθ1RISKi,t–1 + λθ2INCi,t–1 + εi,t
(3)
The equation (3) is estimated using the panel of euro area listed banks over 2005Q1 – 2011Q4
period, constituting 28 quarters per bank. The estimations are run with two-stage least squares
(TSLS) method with cross-sectional fixed effects for both regulatory solvency ratios (Tier 1
capital ratio and total capital ratio) as the dependent variable.14 We apply the TSLS estimation
method because standard OLS estimation may arguably suffer from endogeneity bias.15
By construction, the first lag of capital ratio is incorporated as an explanatory variable to
account for a bank’s lagged adjustment and it is expected to correlate positively with the capital
ratio. Regarding the risk and income indicators, we also include the first lags of these variables
in the equation (3). Several combinations of explanatory variables are tested to account for the
different channels that affect the target capital ratio. Indicators referring to a bank’s income
capacity include return on equity (ROE) and retained earnings over total assets. The coefficients
are expected to be positive, as a bank’s earnings support the capacity to accumulate capital through
retention.16 To reflect the riskiness of a bank, we consider indicators based on balance sheet items,
namely, loan loss provisioning over total assets and total investments over total assets, as well
as indicators based on the market’s view of the bank’s situation, i.e., expected default frequency
(EDF) and log-odds EDFs.17 For all of these indicators, risk is expected to exert a positive impact
on the target capital ratio, as a bank with riskier balance sheet should have a higher capital buffer
to cover its exposures.18
14
For more information on the estimation method, see Baltagi (2008).
15
With endogeneity, the idiosyncratic shocks captured by the error term, εi,t, are correlated not only with dependent variable (target capital ratio)
but also with explanatory variables related to banks’ income capacity and riskiness. Such a bias makes estimated OLS coefficients biased and
inconsistent.
16
In principle, profitability ratios may also exert a negative impact on the capital ratio since they also reflect the implicit cost of capital, in that
part of the profits are paid out to stakeholders. However, as banks usually keep part of their profits as retained earnings, we expect higher net
income to result in a higher capital ratio.
17
Log-odds ratios, LOR, are calculated as LOR = log((EDF)/(1– (EDF)).
18
However, credit risk and market perceptions may exhibit pro-cyclical behaviour. For instance, loan losses tend to increase during economic
downturns, depleting banks’ capital position and solvency ratios. Moreover, EDFs started to increase only at the beginning of the financial crisis.
Hence, these indicators may be negatively correlated with capital ratios. The first lags of capital ratios are introduced in the regressions to reduce
the impact of cyclicality.
© Faculty of Management University of Warsaw. All rights reserved.
DOI: 10.7172/2353-6845.jbfe.2015.1.5
Acta Wasaensia
Laurent Maurin, Mervi Toivanen • Journal of Banking and Financial Economics 1(3)2015, 113–129
The TSLS method requires instrumental variables. We instrument explanatory variables
(ki,t–1, RISKi,t–1 and INCi,t–1) with their corresponding second and third lags (ki,t–2, ki,t–3, RISKi,t–2,
RISKi,t–3, INCi,t–2 and INCi,t–3).19 The idea in using the lagged values of explanatory variables is
that they are less likely to be influenced by current shocks. Theoretically, we have good reasons
to expect that these instruments perform well. From the statistical perspective, instruments are
judged to be valid when they are relevant and exogenous. The selected lags are indeed relevant
as each of the exogenous variables (ki,t–1, RISKi,t–1 and INCi,t–1) is strongly correlated with
its corresponding second and third lag. As for instrument exogeneity, we can use the Sargan
J-test. This test for overidentifying restrictions indicates that the instruments are valid in all our
specifications and the test statistics is reported with the results.
The results for the target capital ratio measured with the Tier 1 capital ratio are presented in
Table 2. Overall, the estimated coefficients are in line with our a priori expectations. The lagged
dependent variable has a positive sign and is statistically significant, consistent with a partial
adjustment model that assumes some delay in the closure of the capital gap.
Regarding the income indicators, return on equity (ROE) and quarterly change in retained
earnings over total assets exert positive effects on capital ratios, although the coefficients are not
statistically significant. This positive (but not significant) correlation between profitability and
solvency ratios is in line with the results of Berrospide and Edge (2010), who report that the bank
holding companies tend to increase capital when profits, measured with return on assets, rise. The
lack of significance for the coefficient may reflect the fact that the income indicators also reflect
banks’ cost of capital, as mentioned by Francis and Osborne (2009).
Table 2
Determinants of the target Tier 1 capital ratio
Equation 1
Equation 2
Equation 3
Lagged capital ratio
0.86
[0.03]***
0.83
[0.03]***
0.77
[0.03]***
Change in retained earnings over total assets
0.07
[0.07]
0.03
[0.07]
0.03
[0.06]
Provisioning over total assets
1.32
[0.40]***
..
..
..
..
Expected default frequency (EDF)
..
..
Log-odds EDFs
..
..
..
..
Change in return on equity
..
..
..
..
Constant
1.05
[0.21]***
0.08
[0.02]***
1.35
[0.23]***
..
..
0.15
[0.02]***
..
..
2.94
[0.38]***
Equation 4
0.86
[0.03]***
..
..
1.38
[0.40]***
..
..
..
..
0.01
[0.01]
1.09
[0.22]***
Number of observations
756
728
728
756
Cross-section
27
26
26
27
5.81
4.98
2.57
Sargan J-test statistics
3.70
(*), (**),
Notes: The estimation period covers 2005:1─2011:4. Standard deviations are reported under the point estimates in brackets.
and (***)
indicate statistical significance at 10%, 5%, and 1%, respectively. The Sargan J-statistic indicates the validity of the model. The critical value
for the Sargan J-test is 40.11 (38.89), with 27 (26) degrees of freedom at a significance level of 5%. As test statistics is below the critical value,
null hypothesis of valid instruments can be accepted.
19
In addition, cross-section fixed dummies also serve as instruments.
© Faculty of Management University of Warsaw. All rights reserved.
DOI: 10.7172/2353-6845.jbfe.2015.1.5
107
120
108
Acta Wasaensia
Laurent Maurin, Mervi Toivanen • Journal of Banking and Financial Economics 1(3)2015, 113–129
Turning to the risk indicators, increasing risk is shown to have a positive effect on banks’
internal targets, inducing the institutions to strive for higher capital levels. The ratio of loan loss
provisions over total assets is statistically significant and positively correlates with the Tier 1
capital ratio.20 Meanwhile, the ratio of total investments over total assets, another measure of risk,
exhibits a positive relationship with the Tier 1 capital ratio. This relationship is not significant
at the 10% level, however. In addition, expected default frequencies (EDFs) are significantly
and positively related to the solvency ratios. This result can be interpreted to indicate markets’
ability to recognise that a bank’s risks call for a higher capital position in the future. Markets’
perceptions regarding a bank’s riskiness and need to raise more capital to cover its risk exposure
are subsequently reflected in the bank’s internal target.
The results obtained for the Tier 1 capital ratio also apply to the total capital ratio to a large
extent (see Table 3). In both cases, the lagged dependent variable and indicators for risk enter the
equations with positive signs. Overall, the positive relationships between the target capital ratios
and the various risk indicators confirm the view that banks with high risk in their balance sheets
also orient themselves towards high capital levels.
Table 3
Determinants of the target Total capital ratio
Equation 1
Equation 2
Equation 3
Lagged capital ratio
0.67
[0.05]***
0.60
[0.05]***
0.52
[0.06]***
Change in retained earnings over total assets
0.15
[0.13]
0.09
[0.13]
0.10
[0.13]
Provisioning over total asset
2.03
[0.76]***
..
..
..
..
Expected default frequency (EDF)
..
..
Log-odds EDFs
..
..
Constant
3.59
[0.51]***
0.18
[0.04]***
..
..
4.50
[0.59]***
..
..
0.28
[0.04]***
7.34
[0.90]***
No. of observations
756
728
728
Cross-section
27
26
26
15.11
10.26
6.41
Sargan J-test statistics
Notes: The estimation period covers 2005:1─2011:4. Standard deviations are reported under the point estimates in brackets. (*), (**), and (***)
indicate statistical significance at 10%, 5%, and 1%, respectively. The Sargan J-statistic indicates the validity of the model. The critical value
for the Sargan J-test is 40.11 (38.89), with 27 (26) degrees of freedom at a significance level of 5%. As test statistics is below the critical value,
null hypothesis of valid instruments can be accepted.
20
Berrospide and Edge (2010) and Francis and Osborne (2009) also show that larger charge-off rates and provisions support higher capital ratios.
© Faculty of Management University of Warsaw. All rights reserved.
DOI: 10.7172/2353-6845.jbfe.2015.1.5
121
Acta Wasaensia
Laurent Maurin, Mervi Toivanen • Journal of Banking and Financial Economics 1(3)2015, 113–129
122
3.2. Deriving the capital gap
Based on the estimated equations for the Tier 1 capital ratio and the total capital ratio,
target capital ratios (k*i,t) are computed for each individual bank by making use of the estimated
parameters of equation (3) in equation (1).21 The capital gap, GAPi,t, for each individual bank i at
time t is subsequently derived as follows:
GAPi, t = 100 ) f
k )i, t
k i, t - 1
- 1p
(4)
where k*i,t represents the bank’s target capital ratio at time t and ki,t–1 is the bank’s actual capital
ratio at time t–1. Equation (4) thus presents the deviation of a bank’s actual capital ratio in period
t–1 from the target at time t in terms of the Tier 1 capital ratio and total capital ratio. A positive
(negative) value of the capital gap represents a capital shortfall (surplus) relative to the long-run
target capital ratio.
Figure 2
Estimates of the capital gap for the banks in the sample (percentage points)
Total capital ratio
Tier 1 capital ratio
4
3
3
2
2
1
1
0
0
1
11
Q
1
1
Q
10
Q
09
1
1
Q
08
Q
07
1
Q
06
Q
05
1
1
11
Q
Q
10
1
Q
09
Q
08
Q
07
Q
06
Q
05
1
-3
1
-3
1
-2
1
-2
1
-1
-1
Notes: The latest observation is 2011Q4. The capital gap is expressed in terms of percentage points (i.e., the needed capital over risk-weighted
assets). A positive value indicates a capital shortfall, indicating that banks’ actual capital ratio is below the target. The horizontal line in the
bars represents the median of the distribution, and the blue area, the 95% confidence intervals. The limits of the boxplots indicate the first and
third quartiles of the distribution.
Source: Authors’ calculations.
Figure 2 presents the capital gap (expressed in percentage points, i.e., the needed capital over
risk-weighted assets) and its distribution across euro area banks over time. The gap regarding
the Tier 1 capital ratio is presented on the left-hand side, and the gap regarding the total capital
ratio, on the right-hand side. Comparing the two set of results, the gaps estimated for both capital
ratios are quite similar. At the beginning of the estimation period, both capital gaps are positive,
indicating that the banks lag behind their internal targets. The analysis thus suggests that the
banks' capital is not adequate to cover the risks that they are accumulating in their balance sheets.
In economic terms, this outcome is logical, as low levels of equity help banks to obtain high
short-term ROE and thus profitability, which is lucrative for investors. Implicit government
guarantees and moral hazard may have further facilitated the omission of prudent standards. The
gaps subsequently start to widen as risks materialise, loan losses increase and the financial crisis
21
Thus, the target capital ratios are bank-specific and vary over time.
© Faculty of Management University of Warsaw. All rights reserved.
DOI: 10.7172/2353-6845.jbfe.2015.1.5
109
110
Acta Wasaensia
Laurent Maurin, Mervi Toivanen • Journal of Banking and Financial Economics 1(3)2015, 113–129
123
deepens in 2007–2008, reaching their highest point of approximately 2.0% in the middle of 2008.
From then onwards, the capital gaps start to slowly narrow as the banks are forced to recapitalise.
While the median gap based on the total capital ratio becomes negative in the beginning of
2010, the median gap based on the Tier 1 capital ratio remains positive until the first quarter of
2011. Although median capital gaps diminish towards the end of 2011, variation across banks
increases and high heterogeneity between banks remain in the euro area banking sector. While
some weak banks continue to lack adequate capital, the estimations suggest that more than a half
of the individual institutions do not have a capital shortfall in the beginning of 2011. This result
is important since banks with a capital shortfall cannot expect banks with a capital surplus to
compensate for their deficit at the sector level. Hence, the situation may be more adverse than the
mean capital gap suggests.
3.3. Estimating the adjustment towards the target capital ratio
Banks have several possibilities to close their capital gap by adjusting the liability side or asset
side of their balance sheets. However, in practise, the fastest way for a bank to balance its capital
position is to issue new equity, to increase retained earnings or to reduce the amount of its loans
and the size of its portfolio. However, as issuing equity can be costly during the time of a crisis,
we assume in this paper that the adjustment operates mainly through deleveraging.
Thus, in the second step of the estimation, we use the obtained capital gap as an explanatory
variable while controlling for macro-variables. A dynamic panel model is estimated for two
different balance sheet items, itemi,t, namely, the total loans and total securities (see equation 5).
The estimations are run with two-stage least squares (TSLS) method with cross-sectional fixed
effects.
Δlog(itemi,t) = β0 + β1Gapi,t–1 + β2 Δlog(GDPj,t–1) + β3Xj,t–1 + β4 Δlog(itemi,t–1) + εi,t
(5)
We specify the model in growth rates as we are interested in the implications of capital gaps
on banks’ balance sheets. The explained variables, loans and security holdings, are expressed in
terms of quarterly change. And the explanatory variables are also expressed in growth rates or
depict a change between two subsequent time periods. The specification also takes into account
non-stationary of the variables.
Regarding the capital gap of a bank, Gapi,t–1, we use the two alternative variables based on the
target Tier 1 capital ratio and the target total capital ratio.22 In both cases, the capital gap, measured
as the difference between the bank’s target and actual capital ratio, is expected to have a negative
impact. If the capital ratio of a bank is below its target, the gap is positive (see equation 4), and
the growth in the balance sheet items should be adversely affected since banks partly deleverage
to increase their solvency ratios.
To control for macroeconomic conditions, the annual growth rate of gross domestic product
(GDPj,t–1) is also included in the model. The variable refers to the economic activity in the country
j in which the bank i’s headquarter is located.23 GDP growth is expected to have a positive impact
on asset growth and loan growth.
22
We use equations 1 and 2 in Table 1 to calculate the Tier 1 capital gap. Similarly, when deriving the capital gap for the total solvency ratio,
equations 1 and 2 in Table 2 are used. These equations incorporate the changes in retained earnings over total assets, expected default frequencies
(EDFs) and loan loss provisioning over total assets as explanatory variables.
23
The combination of the bank-specific capital gap with country-specific macro-variables reflects the lack of publicly available data that would
enable us to consider the geographical dispersion of exposure at the institutional level. Nonetheless, internationally active banks may not be
affected by the developments in the home country alone. Still, an individual bank’s capital gap is defined at the bank group level, representing
a group’s capital shortfall/surplus in relation to its overall risk position (including foreign lending).
© Faculty of Management University of Warsaw. All rights reserved.
DOI: 10.7172/2353-6845.jbfe.2015.1.5
Acta Wasaensia
Laurent Maurin, Mervi Toivanen • Journal of Banking and Financial Economics 1(3)2015, 113–129
Other exogenous variables (Xj,t–1) are incorporated to account for either supply or demand
channels. First, we include information from the ECB bank lending survey. In the survey, banks
reply to questions concerning the perceived changes in loan demand and questions on banks’
own credit standards (indicating supply factors). Loan demand is expected to correlate positively
with loan growth, while a tightening (easing) of credit standards is expected to dampen (increase)
loan growth and thus to correlate negatively with loan growth. Second, we include stock prices
to reflect the overall financing conditions of the economy. Stock prices are expected to correlate
positively with the explained variables. Lastly, the dynamic model also includes the lagged growth
rate of dependent variable (itemi,t–1) as well as an error term.
Regarding the instrumental variables, we use the second and third lags of the explanatory
variables (Gapi,t–1, GDPj,t–1 and Xj,t–1) as instruments.24 However, the lags for the total loans and
total securities (itemi,t) are not included in the instrument list. As the lagged values of explanatory
variables are less likely to be influenced by current shocks, they are expected to perform well.
Indeed, based on the statistical examination, the instruments are valid as they are relevant and
exogenous.
The results for the estimations on balance sheet adjustments are presented in Table 4 (where
the capital gap is calculated on the basis of the Tier 1 capital ratio) and Table 5 (where the capital
gap is based on the total capital ratio). The left-hand side of the tables presents the adjustment
effect for net loans, while the right-hand side of the tables contains the results for the adjustment
of securities portfolio.
Starting with the adjustment of net loans, the capital gap enters the estimations with a negative
sign, as expected, and is statistically significant in explaining the development of the loan
portfolio. Moreover, GDP growth and loan demand by non-financial corporations (NFCs) are
found to be significant in explaining loan growth. The credit standards applied by banks on loans
to NFCs appear to exert a negative impact on loans, reflecting the adverse effect of tightening the
credit supply; however, this effect is not statistically significant.
The estimated adjustment based on the Tier 1 capital ratio target seems to be somewhat
higher than that based on the total capital ratio target. This result reflects the distinct composition
of the capital on which capital ratios are based. While Tier 1 capital is more narrowly defined
and mainly contains equity capital, which is more readily usable to absorb losses, total capital
includes also other capital-like instruments. When risks materialise, Tier 1 equity capital acts as
a first line of defence and is more severely affected, as it buffers against losses. Therefore, the
capital gap between the target Tier 1 capital ratio and the actual Tier 1 capital ratio induces larger
changes in a bank’s balance sheet than the capital gap between the target and the actual total
capital ratios.
24
In addition, cross-section fixed dummies also serve as instruments.
© Faculty of Management University of Warsaw. All rights reserved.
DOI: 10.7172/2353-6845.jbfe.2015.1.5
111
124
112
Acta Wasaensia
Laurent Maurin, Mervi Toivanen • Journal of Banking and Financial Economics 1(3)2015, 113–129
Table 4
Balance sheet adjustments based on the Tier 1 capital gap
NET LOANS
SECURITIES
Capital gap
-2.78
[1.66]*
-8.2
[3.35]**
Lagged nominal GDP growth
0.44
[0.17]***
0.14
[0.13]
BLS credit demand NFCs realised
0.07
[0.02]***
..
..
Annual growth in stock prices
..
..
0.09
[0.05]**
Lagged explained
-0.31
[0.16]**
-0.41
[0.17]**
Constant
6.60
[2.06]***
11.01
[4.00]***
Long run impact of the capital gap
-2.126
-5.816
No. of observations
624
648
Cross section
26
27
Notes: The estimation period covers 2005Q1 to 2011Q4. Standard deviations are reported under the point estimates in brackets. (*), (**), and
(***) indicates statistical significance at 10%, 5%, and 1%, respectively. Net loans exclude interbank loans. NFCs stand for non-financial
corporations. Two dots mean that the variable was not used in the model. For the calculation of long-run impact, see footnote 25.
Turning to the adjustment of securities portfolios, a bank’s capital gap (i.e., a shortfall of
capital with respect to the bank’s target), exerts a negative and significant impact on the bank’s
securities portfolio. Although GDP fails to be statistically significant, its coefficient remains
positive. Banks are likely to rely more on market prices than on demand indicators in deciding on
their investment portfolios. Indeed, the annual growth of stock prices positively correlates with
a bank’s securities portfolio, possibly reflecting that swift changes in the market environment and
investor expectations positively influence a bank’s decision to invest in securities.
Overall, the estimates suggest that the capital gap plays an important role in explaining
loans offered within the euro area banking sector throughout the estimation period. Compared
to a situation in which banks’ actual capital ratios do not deviate from the target, a 1-percentagepoint capital shortfall is estimated to reduce loan growth by 2.0 to 2.3 percentage points over the
long term.25 Given that at the trough of the financial crisis, the capital gap is estimated to have
reached 2 p.p., banks’ adjustment to a higher target capital ratio could have decreased loan growth
by more than 4% in cumulated terms.
25
The long-run impact is computed by dividing the short-term coefficient of the capital gap (β1) by the dependent variable’s speed of adjustment
(λ), which is defined as (1 – β4). (See Francis and Osborne, 2009). While the speed of adjustment (λ) is fixed in this set-up, it would be possible to
experiment with time and bank-specific adjustment speed. This is, however, beyond the scope of this paper.
© Faculty of Management University of Warsaw. All rights reserved.
DOI: 10.7172/2353-6845.jbfe.2015.1.5
125
Acta Wasaensia
Laurent Maurin, Mervi Toivanen • Journal of Banking and Financial Economics 1(3)2015, 113–129
Table 5
Balance sheet adjustments based on the total capital gap
NET LOANS
Equation 1
Capital gap
Lagged annual growth in real GDP
Equation 2
Equation 1
-2.93
[1.23]**
-2.74
[1.05]***
-10.00
[4.04]**
..
..
0.66
[0.25]***
..
..
Lagged nominal GDP growth
0.61
[0.24]**
BLS credit demand NFCs realised
0.06
[0.02]**
Annual growth in stock prices
SECURITIES
..
..
0.08
[0.02]***
0.12
[0.15]
..
..
..
..
..
..
0.13
[0.05]**
Lagged explained
-0.29
[0.16]*
-0.33
[0.17]*
-0.42
[0.19]**
Constant
5.09
[1.05]***
4.98
[0.98]***
5.61
[2.02]***
Long run impact of the capital gap
-2.262
-2.061
-7.050
No. of observations
648
648
648
Cross section
27
27
27
Notes: The estimation period covers 2005Q1 to 2011Q4. Standard deviations are reported under the point estimates in brackets. (*), (**), and
(***) indicates statistical significance at 10%, 5%, and 1%, respectively. Net loans exclude interbank loans. NFCs stand for non-financial
corporations. Two dots mean that the variable was not used in the model. For the calculation of long-run impact, see footnote 25.
Based on the estimations, the long-run elasticity of securities portfolios is higher than that
of net loans. The estimated long-term elasticity for securities varies by approximately 5.8–7.1
percentage points, well above the corresponding elasticity for loans. This result supports the view
that, since the onset of the financial crisis, euro area banks have deleveraged their assets along
a “pecking order”, reducing securities holdings to a greater extent than the loan supply. This
finding can be explained by several factors. First, as the maintenance of customer relationships is
an important part of the prevailing banking business model, credit institutions would be reluctant
to jeopardise important client relationships by refusing to roll-over existing loans or to grant new
ones. Second, the banking sector has received support via a number of government schemes that
include conditions to maintain a minimum level of credit growth to the private sector. Third, loans
are typically rather illiquid assets, and shedding existing loans from the balance sheet is difficult,
particularly during a crisis when the securitisation and syndication markets are at a standstill.
3.4. Robustness
As a robustness test, the second-step estimations are run by defining all the explanatory
variables in levels.26 These estimations confirm the previous results, revealing the capital gap,
GDP, credit supply, demand factors and stock prices as significant variables. Moreover, the longterm impact on securities portfolios is again found to be more pronounced than that on net loans,
with a long-term impact of approximately 3.4 for securities and 2.4−2.8 for net loans.
26
In this case, instead of equation 5, we estimate the following equation: itemi,t = β0 + β1Gapi,t–1 + ∑j = 1 δ1,jGDPt – j + ∑j =1 δ2,j Xt – j + φitemi,t – 1
+ trend + εi,t .
© Faculty of Management University of Warsaw. All rights reserved.
DOI: 10.7172/2353-6845.jbfe.2015.1.5
113
126
114
Acta Wasaensia
Laurent Maurin, Mervi Toivanen • Journal of Banking and Financial Economics 1(3)2015, 113–129
Our estimates suggest that the deleveraging of loans is relatively stronger in the euro area
than in the UK or in the US, as the estimated impact found in this paper is more pronounced
than that reported by Berrospide and Edge (2010) and Francis and Osborne (2009). The former
authors find that a 1-percentage-point increase in the capital ratio of US banks leads to an
increase of 0.7−1.2 percentage points in annualised loan growth in the long term, while the latter
authors suggest that the total effect of changes in the regulatory requirements of UK banks is
approximately 1.2 percentage points. The differences in the results may be partly explained by the
different estimation periods. Francis and Osborne (2009) use British data from 1996 to 2007, and
Berrospide and Edge (2010) analyse the 1992Q1−2009Q3 period in the US, while we examine
the years of the financial crisis, during which most of the deleveraging took place in the euro area.
In addition, although our estimation methodology broadly follows that of Francis and Osborne
(2009) and Berrospide and Edge (2010), some differences remain. Francis and Osborne (2009)
implement GMM to estimate the target capital ratio in the first step and use OLS with fixed
effects in the second step, as there is no lagged dependent variable in the second-step equations.
Berrospide and Edge (2010) estimate OLS with fixed effects for both steps. We apply TSLS with
fixed effects in both steps.
4. CONCLUDING REMARKS
Operating above minimum capital requirements, banks maintain an additional capital buffer,
which, together with the regulatory requirements, composes banks’ internal capital target.
Occasionally, banks’ actual capital ratios may differ from their internal targets, leading to a capital
surplus or deficit vis-à-vis the target. If a bank’s capital position constitutes a deficit, pressures
to close its capital gap and to increase its solvency ratios may trigger an adjustment process. To
restore its capital ratios, the bank may reduce lending or otherwise adjust its balance sheet. Indeed,
the recent financial crisis has highlighted the importance of financial intermediary characteristics
and equity capital as determinants for the provision of credit to borrowers. As a continuous flow
of credit is of vital importance to maintain investment and real activity, banks’ capital gap and
implied deleveraging pressures are important issues for the conduct of monetary policy.
In this paper, we have estimated a partial adjustment model in a panel context using various
indicators to examine the impact of risk in a bank’s balance sheet on the bank’s internal target
capital ratio and to determine the implications of closing the capital gap on the bank’s lending
and securities holdings. Our paper adds to the literature by concentrating on euro area banks and
by providing evidence on the impact of deleveraging pressures during the latest financial crisis,
while previous studies have disentangled the effects in the US and UK banking sectors over
different time periods, during which such pressures may have been more difficult to detect.
We provide empirical evidence that the internal capital targets play a significant role in the
adjustment of euro area banks. Based on the estimates, we find undercapitalisation in terms of
the Tier 1 capital ratio close to 2.0 p.p. in the middle of 2008, and the negative gap remains at the
end of 2010. Movement in internal target capital ratios arises from changes in banks’ risks and
earnings, although the estimated range of the impact remains large. Only from 2010 onwards,
the capital gaps start to narrow as the banking sector is slowly recovering from the crisis. The
heterogeneity across banks nevertheless remains considerable. The results for the total capital
ratio are similar.
As our results show bank undercapitalisation in relation to banks’ risks and earnings just
before the onset of the latest financial crisis, the new Basel III capital and liquidity requirements
as well as new macroprudential policy measures seem well-placed. The purpose of these new
regulatory initiatives is to strengthen banks’ capital and liquidity positions, improve the quality
of the capital and decrease bank leverage. All these measures should reduce the vulnerability of
© Faculty of Management University of Warsaw. All rights reserved.
DOI: 10.7172/2353-6845.jbfe.2015.1.5
127
Acta Wasaensia
Laurent Maurin, Mervi Toivanen • Journal of Banking and Financial Economics 1(3)2015, 113–129
the banking sector and improve financial stability, making the occurrence of financial crisis less
frequent.
The undercapitalised banks tend to restrict the provision of loans to the economy, as the
relatively higher cost of bank equity leads banks to deleverage in order to reach their target capital
ratios. Regarding the banks efforts to close the capital gap, we find evidence for significant impact
on lending in the euro area. The estimates indicate that closing a 1 p.p. capital gap dampens loan
growth by between 2.0 and 2.3% in the long-term. Given that at the trough of the financial crisis,
the capital gap is estimated to have reached 2 p.p., banks’ adjustment to a higher target capital
ratio could have decreased loan growth by more than 4% in cumulated terms. Compared to
loans, the impact on security holdings is found to be more pronounced and to be approximately
5.8−7.1%. The results thereby suggest that euro area banks have deleveraged their assets along
a pecking order.
Acknowledgements
We would like to thank Florian Heider, Koen Schoors, Ari Hyytinen, Hannu Piekkola and
anonymous referees for their insightful comments. We are also grateful to participants and
discussants at the Eurosystem seminar organized by the ECB in June 2011; the Conference held
as part of the XXXIV Annual Meeting of the Finnish Economic Association in Vaasa in February
2012; and the INFINITI Conference on International Finance in Trinity College Dublin in June
2012, for their useful suggestions. All errors in this paper are the sole responsibility of the authors.
The views expressed in this paper are those of the authors and do not necessarily reflect those of
the Eurosystem, the European Central Bank or the Bank of Finland.
References
Baltagi, B.H. (2008) Econometric analysis of panel data, fourth ed. Wiley, Chichester.
Berger, A.N., DeYoung, R., Flannery, M.J., Lee, D., Öztekin, Ö. (2008) How do large banking organisations
manage their capital ratios? Journal of Financial Services Research 34: 2–3, pp. 123–149. DOI: 10.1007/
s10693-008-0044-5.
Berger, A.N., Udell, G.F. (1994) Did risk-based capital allocate bank credit and cause a “Credit crunch” in the United
States? Journal of Money, Credit and Banking 26: 3, pp. 585–628. DOI: 10.2307/2077994.
Berger, A.N., Herring, R.J., Szegö, G.P. (1995) The role of capital in financial institutions. Journal of Banking and
Finance 19: 3–4, pp. 393–430. DOI:10.1016/0378-4266(95)00002-X.
Bernanke, B.S., Lown, C.S. (1991) The Credit crunch. Brookings Papers on Economic Activity 2, pp. 205–247.
Berrospide, J.M., Edge, R.M. (2010) The Effects of bank capital on lending: What do we know, and what does it
mean? International Journal of Central Banking 6, pp. 5–54.
BIS (2010a) Group of Governors and Heads of Supervision announces higher global minimum capital standards.
Press release of Basel Committee of Banking Supervision, 12 September 2010, Available at: http://www.bis.
org/press/p100912.htm [Last accessed: 9 March 2015].
BIS (2010b) Assessing the macroeconomic impact of the transition to stronger capital and liquidity requirements.
Final Report of Macroeconomic Assessment Group, December 2010, Available at: http://www.bis.org/publ/
othp12.pdf [Last accessed: 9 March 2015].
Brewer, E. III, Kaufman, G.G., Wall, L.D. (2008) Bank capital ratios across countries: Why do they vary? Journal of
Financial Services Research 34: 2–3, pp. 177–201. DOI: 10.1007/s10693-008-0040-9.
Brinkmann, E.J., Horvitz, P.M. (1995) Risk-based capital standards and the credit crunch. Journal of Money, Credit
and Banking 27: 3, pp. 848–863. DOI: 10.2307/2077755.
ECB (2007) Bank capital in Europe and the US. Financial Stability Review, December 2007, pp. 155–162.
Francis, W., Osborne, M. (2009) Bank regulation, capital and credit supply: Measuring the impact of prudential
standards. Bank of England Occasional Paper no. 36.
Furfine, C. (2000) Evidence on the response of US banks to changes in capital requirements. BIS Working Paper
no. 88.
© Faculty of Management University of Warsaw. All rights reserved.
DOI: 10.7172/2353-6845.jbfe.2015.1.5
115
128
116
Acta Wasaensia
Laurent Maurin, Mervi Toivanen • Journal of Banking and Financial Economics 1(3)2015, 113–129
Gambacorta, L., Marques-Ibanez, D. (2011) The bank lending channel: evidence from the crisis. Economic Policy
26: 66, pp. 135–182.
Gambacorta, L., Mistrulli, P.E. (2004) Does bank capital affect lending behaviour? Journal of Financial
Intermediation 13: 4, pp. 436–457. DOI:10.1016/j.jfi.2004.06.001.
Hancock, D., Laing, A.J., Wilcox, J.A. (1995) Bank capital shocks: Dynamic effects on securities, loans and capital.
Journal of Banking and Finance 19: 3–4, pp. 661–677. DOI:10.1016/0378-4266(94)00147-U.
Hancock, D., Wilcox, J.A. (1998) The “Credit crunch” and the availability of credit to small business. Journal of
Banking and Finance 22: 6–8, pp. 983–1014. DOI:10.1016/S0378-4266(98)00040-5.
Harding, J.P., Liang, X., Ross, S.L. (2013) Bank capital requirements, capital structure and regulation. Journal of
Financial Services Research 43: 2, pp. 127–148.
Ivashina, V., Scharfstein, D. (2010) Bank lending during the financial crisis of 2008. Journal of Financial Economics
97: 3, pp. 319–338. DOI:10.1016/j.jfineco.2009.12.001.
Jacques, K.T. (2008) Capital shocks, bank asset allocation, and the revised Basel Accord. Review of Financial
Economics 17: 2, pp. 79–91. DOI:10.1016/j.rfe.2007.03.003.
Jiménez, G., Ongena, S., Peydró, J-L., Saurina J. (2012) Credit supply and monetary policy: Identifying the bank
balance-sheet channel with loan applications, American Economic Review 102: 5, pp. 2301–2326. DOI:
10.1257/aer.102.5.2301.
Jokipii, T., Milne, A. (2008) The cyclical behaviour of European bank capital buffers. Journal of Banking and
Finance 32: 8, pp. 1440–1451. DOI:10.1016/j.jbankfin.2007.12.001.
Memmel, C., Raupach P. (2010) How do banks adjust their capital ratios? Journal of Financial Intermediation 19: 4,
pp. 509–528. DOI:10.1016/j.jfi.2009.10.002.
Miles, D., Yang, J., Marcheggiano, G. (2010) Optimal bank capital. Bank of England Discussion Paper no. 31.
Peek, J., Rosengren, E. (1995) Bank regulation and the credit crunch. Journal of Banking and Finance 19: 3–4,
pp. 679–692. DOI:10.1016/0378-4266(94)00148-V.
Peek, J. and Rosengren, E. (2000) Collateral damage: Effects of the Japanese bank crisis on real activity in the United
States. American Economic Review 90: 1, pp. 30–45. DOI: 10.1257/aer.90.1.30.
Puri, M., Rocholl, J., Steffen, S. (2011) Global retail lending in the aftermath of the US financial crisis: distinguishing
between supply and demand effects. Journal of Financial Economics 100: 3, pp. 556–578. DOI:10.1016/j.
jfineco.2010.12.001.
Stolz, S., Wedow, M. (2011) Banks’ regulatory capital buffer and the business cycle: Evidence for Germany. Journal
of Financial Stability 7: 2, pp. 98–110. DOI:10.1016/j.jfs.2009.09.001.
Thakor, A. V. (1996) Capital requirements, monetary policy and aggregate bank lending: Theory and empirical
evidence. Journal of Finance 51: 1, pp. 279–324.
Wall, L. D., Peterson, D. R. (1995) Bank holding company capital targets in the early 1990s: The regulators versus
the markets. Journal of Banking and Finance 19: 3–4, pp. 563–574. DOI:10.1016/0378-4266(94)00139-T.
Ötker-Robe, I., Pazarbasioglu, C., Buffa di Perrero, A., Iorgova, S., Turgut, K., Le Leslé, V., Melo, F., Podpiera, J.,
Sacasa, N., Santos, A. (2010) Impact of regulatory reforms on large and complex financial institutions. IMF
Staff Position Note, November 3, 2010.
© Faculty of Management University of Warsaw. All rights reserved.
DOI: 10.7172/2353-6845.jbfe.2015.1.5
129
Acta Wasaensia
117
THE IMPACT OF RISK, FUNDING AND
SOVEREIGN SHOCKS ON EURO AREA BANKS
AND ECONOMIC GROWTH
Laurent Maurin, Mervi Toivanen*
ABSTRACT
This paper analyses the effects of risk, funding and sovereign shocks on banks
and economic growth in the euro area and in four largest euro area countries.
Bank-level variables and macroeconomic data for 2005–2013 are used to estimate
a VAR model, after which the shocks are identified with sign restrictions. Based
on the impulse response functions and historical decompositions the results show
that three shocks explain the development of banks’ total assets, profitability,
corporate lending and output growth. In 2009, shock contributions account for
around 60 percentage of the decrease in corporate lending and approximately a
third of the decline of the annual GDP growth at the euro area level. Risk and
funding shocks are more prominent than the sovereign shock. While shocks
exhibit a notable impact on Germany and France in 2009–2011, they are
significant for Italian and Spanish banks only towards the end of the simulation
period.
JEL Classification: G01, G21
Keywords: euro area banks, shocks, credit supply, VAR, impulse response functions
* We are grateful to Koen Schoors, Ari Hyytinen and Glenn Harma for their useful comments. We
would also like to thank participants and discussants at the IFABS Conference in Nottingham in
June 2013; and the Conference held as part of the XXXVI Annual Meeting of the Finnish Economic Association in Kuopio in February 2014, for their useful comments. All errors in this paper
are the sole responsibility of the authors. The views expressed in this paper are those of the authors and do not necessarily reflect those of the Eurosystem, the European Central Bank or the
Bank of Finland.
118
Acta Wasaensia
1 INTRODUCTION
Since the beginning of the financial crisis a continuum of shocks has negatively
affected euro area banks’ business environment, implying – among other things –
increasing risks, declining profitability and weakened access to wholesale funding. Together with the implementation of the new regulatory requirements, these
shocks have exerted pressure on banks' balance sheets and liquidity positions. In
addition to the direct effects of the initial shocks, the shocks have continued to
propagate and induce second round effects.
While banks’ adjust to the new environment, potential changes in banks’ credit
supply conditions may influence corporate capacity to finance investments. The
impact can be especially large in the euro area, where debt markets are relatively
small and a large part of firms' external financing is provided by banks. Furthermore, the existence of financial imperfections can amplify the interactions between financial variables and macro economy. The amplification occurs through
the financial accelerator mechanism, which can translate shocks in the credit market into much larger cyclical fluctuations in the real economy. (Bernanke et al.
1999) Adrian & Shin (2011) have also shown that since the beginning of the financial crisis banks themselves can be a source of disturbance. Hence, the adjustment of bank lending is an important channel through which initial shocks
affect the economy. The tensions in credit markets, the availability of bank loans
and, ultimately, the weakening of economic activity have brought the role of
banks to the centre stage of both policy and research agendas.
This paper contributes to the literature by estimating how financial shocks affect
banking sector and economy at the euro area level and in four largest euro area
countries, namely in Germany, France, Italy and Spain. The analysis of macrofinancial linkages is based on the estimation of a vector autoregression model
(VAR) with bank-specific indicators and macro level variables for 2005–2013.
We use sign restrictions to identify three granular shocks that relate to increasing
riskiness of banks (risk shock), banks' difficulties in obtaining wholesale funding
(funding shock), and the impact of sovereign debt crisis in Europe (sovereign
shock). These shocks are also the novelty of this paper as very little previous literature on such shocks exists. We then apply impulse response functions (IRFs)
in order to assess the implications of the shocks for endogenous variables and to
track the time paths of nominal shocks. Finally, the historical decompositions of
responses are composed to analyse how much of the variations in banks’ total
assets, profitability and corporate lending as well as in GDP growth are explained
by the shocks.
Acta Wasaensia
119
The contribution of the paper also resides in our approach as VAR methodology
provides a flexible framework for analysis of the dynamics and interactions between micro and macro variables. The methodology links individual bank level
data to macroeconomic variables in a coherent manner and allows the feedback
effects between banks and the economy. And it does not require any presumption
about the direction of the causal relationship.
The above mentioned technical qualities of the methodology are important in order to disentangle the question at hand. While macro variables are traditionally
used to explain movements in granular firm- and bank-level data, Gabaix (2011)
shows that large micro-level entities can have a sizeable impact on macro variables. Idiosyncratic productivity and growth shocks affecting the largest US firms
can explain about 30 percent of fluctuations in GDP growth. The effect arises
from the uneven distribution of companies as a few large firms dominate the market and a large number of small firms have only a small market share.
Many European banking sectors exhibit similar market structure, highlighting the
importance of large banks. For instance, a sample of about 130 banks in the European Central Bank’s (ECB) comprehensive assessment exercise covers approximately 85 % of euro area bank assets. The high concentration of the banking sector implies that company-level information is extremely valuable in assessing the
impact of idiosyncratic shocks in the euro area. Given the importance of bank
financing in the euro area economy, idiosyncratic bank shocks can have large
impacts on aggregate loan supply, investment financing and ultimately the economic activity. Thus, a proper analysis requires looking at the banking sector
from a micro perspective and combining granular data with macro variables. Individual data provides also a micro foundation to aggregate shocks.
The results show that risk, funding and sovereign shocks have played a significant
role in the development of euro area banks’ balance sheet items. In addition, they
have affected output growth in the euro area and large euro area countries. Overall, the contribution of three shocks in 2009 represents approximately a third of
the decline of the annual GDP growth and around 60 percentage of the decrease
in lending to non-financial corporations at the euro area level. Regarding the individual shocks, the contribution of risk and funding shocks are significant in explaining the development of the variables, while the impact of sovereign shock is
more subdued.
Looking across the largest euro area countries, the shock contributions explain a
substantial part of the country-level variation of total assets, profitability, corporate lending and GDP growth. The time pattern nevertheless differs across countries. While shocks exhibit a notable impact on Germany and France in 2009–
120
Acta Wasaensia
2011, the contributions of shocks became prominent for Italian banks only towards the end of the estimation period. At the same time, the contribution of three
shocks remain relevant in Spain throughout the whole estimation period. Overall,
the negative implications of shocks at the euro area level are composed of the
contributions of German and French banks in 2009–2011 and the contributions of
shocks to Italian and Spanish banks in 2011–2013.
The rest of the paper is organised as follows. Section 2 reviews the academic literature and section 3 presents the dataset. The methodology, together with the
implemented sign restrictions, is presented in section 4. Section 5 contains the
discussion on results, while section 6 concludes. Most of the tables and figures
are in the annex owing to their large scale.
2 REVIEW OF THE ACADEMIC LITERATURE
Our paper is related to two strands of academic literature. While first set of studies examines how different shocks affect banks' lending, other papers disentangle
the impact of banks’ adjustment on macro economy.
Using partial adjustment models, granular data and information on banks’ target
capital ratios, Berrospide & Edge (2010), Francis & Osborne (2009) and Maurin
& Toivanen (2015) examine how banks’ capital targets impact on banks’ lending
in the US, in the UK and in the euro area, respectively. Researchers show that a
capital shortfall relative to the bank’s target exerts a negative impact on credit
growth. In addition, Maurin & Toivanen (2015) find some evidence of pecking
order to bank deleveraging, with the security portfolio being more responsive to
the adjustment than the loan book.
In a similar vein, previous literature on bank-lending channel indicates that the
banks’ financial position and changes in operating environment affect banks’
lending in Europe and in the euro area. 37 After a negative shock the lending of
poorly-capitalised and less-liquid banks declines more than the lending of their
better-capitalised and well-funded competitors. Financially sound banks are in a
better position to shield their loan books than constrained banks whose only adjustment mechanism is to restrict the provision of loans to the private sector.
37
See, for example, Jiménez et al. (2012), Gambacorta & Marques-Ibanez (2011), Altunbas,
Gambacorta & Marques-Ibanez (2010), Gambacorta & Mistrulli (2003), Gambacorta (2005),
Hülsewig, Mayer & Wollmershäuser (2006).
Acta Wasaensia
121
Some papers also suggest that an individual bank’s response is conditional to the
bank’s size as small banks are less able to replace their balance sheet items than
large banks. Furthermore, banks with substantial share of market-based funding
and non-interest income are shown to reduce lending more strongly than other
banks. Similar evidence exists also for the US (see, for instance, Kashyap & Stein
2000; Kishan & Opiela 2000).
Focusing on the impact of the latest financial crisis, Cihak & Brooks (2009) show
that the euro area banks’ loan supply responds negatively to a weakened soundness of banks, measured with capital ratio or deposit to loans ratio. Examining the
effects of US financial crisis on the retail lending of German banks, Puri, Rocholl
& Steffen (2011) also provide evidence on loan supply changes by the affected
institutions. The banks that encountered a capital shock during the crisis rejected
substantially more loan applications than the non-affected banks. The results were
particularly strong for small and liquidity-constrained banks. Also Hempell &
Kok Sörensen (2010) demonstrate that euro area banks’ supply-side constraints
affect overall euro area bank lending activity in general and during the financial
crisis in particular. Furthermore, shocks to banks’ foreign funding has caused
substantial pullback in domestic lending in the UK (Aiyar 2011).
The second set of papers relates to the impact of bank lending on the macro economy and on GDP growth. The impact of bank loans arises from the fact that many
small lenders such as small and medium size enterprises are bank-dependent and
are unable to substitute bank loans with other forms of financing. The evidence
regarding European countries indicates a negative link between lending and GDP
growth. Buch & Neugebauer (2011) indicate that changes in lending by large European banks explain approximately 16 % of the short-run variation in GDP. Similarly, using data for 1999Q1−2010Q4 and for ten EMU member states, Rondorf
(2012) finds strong evidence that loan supply has an impact on growth.
In the case of the euro area, Cappiello et al. (2010), Cihak & Brooks (2009) and
Calza & Sousa (2005) have showed that a cutback of the loan supply is likely to
have a negative impact on real economic activity in the euro area. Cappiello et al.
(2010) also point to the potential negative effects of euro area banks’ losses and
balance sheet deleveraging. Cihak & Brooks (2009) indicate that a 10 percentage
point decline in credit supply is likely to lead to a decrease in real GDP of about 1
percentage point. According to the estimates, the output grows by 0.206 percentage points if bank loans rise by one percentage point above the average.
In a similar vein, recent papers on US macro-financial linkages suggest that
shocks on credit markets and banks’ capital lead to a reduction in credit availability and subsequent fall of GDP. Bayoumi & Melander (2008) estimate that a one
122
Acta Wasaensia
percentage point decline in the capital to assets ratio of US banks leads to a 1.5
percent fall of GDP, while analogous effects are demonstrated by Lown & Morgan (2006) after a tightening of credit standards. Helbling et al. (2011) examine
the importance of credit market shocks in the context of global business cycles
and show that these shocks are important in driving the economic activity especially during global recessions.
3 DATA
Our analysis is based on the following individual bank data and macroeconomic
data which are included in the VAR model. Both data sets cover the period from
the first quarter of 2005 to the last quarter of 2013. All variables are also demeaned.
Data on euro area banks are obtained from Datastream of Thomson Reuters. The
sample refers to large and listed banking groups that have headquarters in the euro area countries, namely in Germany, France, Italy, Spain, Austria, Portugal and
Belgium. Data are collected at the consolidated group level, which excludes intragroup items. To avoid double counting, separately reported foreign subsidiaries of
a banking group are not included in the sample. Although the majority of banks
report balance sheet and income statements on a quarterly basis, some banks publish bi-annual data. In this case, missing quarterly observations are interpolated in
order to ensure a large sample.
The sample mainly consists of banking groups from large countries. From the
total sample, 42 % of banks are French, 23% are German, 17% are Spanish and
11% come from Italy. Over the sample period, the total assets of the banks included in the sample constitute, on average, 51% of the total assets of consolidated banking groups in the above-mentioned countries. The representativeness of
the sample varies across countries. While the sample’s Austrian and Belgian
banking groups constitute around 27% of the total banking sector of these countries, French banking groups in the sample represent around 76% of the whole
French banking sector.
For each bank in the sample, we extract information on total assets, risk weighted
assets, reserves for loan losses, gross lending 38 and return on equity (ROE). We
38
Gross lending includes loans to financial institutions.
Acta Wasaensia
123
derive bank-level variables by calculating annual growth rates for total assets. On
the basis of the data, we also define our own indicator for risk weights by dividing
a bank’s risk-weighted assets with its total assets. In addition, the indicator for
loss accruals is defined as loan loss reserves over gross lending. This reserves for
losses variable reflects the riskiness of banks at an earlier stage than actual loan
loss provisions as the materialization of losses takes some time and reserves are
often booked already against non-performing loans before the actual write-offs.
Risk weights, loss accruals and return on equity (ROE) are expressed in percentages.
We weight each above-mentioned bank variable with the total asset of the individual bank, as a bank’s impact is likely to depend on its size. The weighted variables are subsequently summed according to the nationality of the banks to get
representative figures for the banking sectors of individual countries. As we are
interested in the developments in the four largest euro area countries, the countryspecific bank data refer only to banks resident in Germany, France, Italy and
Spain. In contrast, euro area aggregate is composed by adding up all individual
bank observations in the sample.
As the group-level bank data lacks detailed information on banks’ lending to different economic sectors and on their debt issuance, we complement the data set
with information from official balance sheet items statistics (BSI) of the ECB. 39
This data source refers to all monetary financial institutions (MFIs) in a country.
Bank loans to non-financial corporations (NFCs) contain monetary financial institutions’ lending to euro area firms. In addition, the issued bank debt refers to debt
securities that MFIs had issued and held in the liability side of their balance
sheets. This variable includes both long-term and short-term securities. Both variables are collected at the aggregated level for the whole euro area and the largest
euro area countries. The variables are expressed as annual growth rates.
Furthermore, we use data on bank stock prices and country-level house prices in
order to get information on asset price movements during the estimation period.
In line with the theory of financial accelerator (Bernanke et al. 1999), the inclusion of asset prices helps to disentangle the question at hand. They reflect an important channel through which shocks can impact the macro economy via wealth
effects and collateral values. Moreover, as stock prices adjust quickly, they can
also be interpreted to reflect confidence in financial markets. The stock prices of
individual banks in the sample are taken from Thomson Reuters’ Datastream.
39
See http://www.ecb.europa.eu/stats/money/aggregates/bsheets/html/index.en.html.
124
Acta Wasaensia
After having calculated annual growth rates for the individual bank’s stock price,
we derive country-level data by averaging the observations on the basis of the
banks’ home country. To derive the annual change for house prices, we use residential property price statistics by BIS. Finally, we derive our asset price series by
calculating a simple average over the annual growth rates of national stock and
house prices. 40 A somewhat similar approach to combine stock and house price
growth rates has been taken by Gulan et al. (2014).
We also obtain data on sovereign and bank credit default swaps (CDS) 41. The
CDS prices are taken from market sources and refer to quarterly average quotations. Our CDS variable is calculated by deducting the average price for banks'
credit default swaps in each country from the CDS price of that particular sovereign. The variable is designed to distinguish whether the shock is experienced by
banks or by the sovereign during the crisis. If the financial stress faced by banks
is larger than that of the sovereign, our indicator gets negative values, and vice
versa. The CDS spread indicator is in basis points.
40
41
We have also run the analysis by including as a variable only bank stock prices and only
house prices. This robustness test provides analytically similar results.
Credit default swaps are a kind of insurance contract in which buyer pays a premium. The
buyer receives financial compensation from the seller of the contract in the case of a default of
the company underlying the contract. The higher the price of the insurance fee, the higher is
the probability for the company’s default.
Acta Wasaensia
125
Figure 1. Variables
Note: Total assets, asset prices, GDP growth, bank debt and loans to non-financial corporations (NFCs) are
expressed as annual growth rates, while risk weights, reserves for losses and return on equity (ROE) are in
percentages. The CDS spread indicator is in basis points. The circle represents the median of the distribution.
The vertical bars indicate the quantiles of the distribution at 20% (lower part) and 80% (higher part).
Finally, as for the macroeconomic variables, the dataset includes quarterly real
gross domestic product (GDP) for Germany, France, Italy and Spain as well as for
the euro area. Real GDP growth is computed as an annual growth rate and is taken from Eurostat.
The variables and their distribution are depicted in Figure 1. Since the beginning
of the financial crisis banks’ profitability (measured with return on equity) has
declined, while reserves for loan losses have increased. The issuance of debt also
decreased at the beginning of the crisis, reflecting the worsening of the financial
market conditions and reduced availability of external funding. Debt issuance
nevertheless recovered for a short time period in 2011–2012. In addition, banks’
total assets and risk weights track a general downward trend as banks adapt their
portfolios owing to the financial crisis.
4 METHODOLOGY
This section presents the vector autoregression (VAR) approach, sign restrictions
as well as the impulse response functions (IRFs) that are used to disentangle the
126
Acta Wasaensia
individual banks' responses to shocks as well as the impact of banks’ adjustment
on the macro economy. 42
4.1
Granular approach
As a starting point, consider a multi-bank vector-autoregressive (VAR) model. In
its most general form this model can be written as
𝑥𝑖,𝑡 = 𝛼𝑖 + 𝐴𝑖 (𝐿)𝑋𝑖,𝑡−1 + 𝜀𝑖,𝑡
t = 1, ... , T
(1)
where xi is a n x 1 vector of variables of each of the N banks, i = 1, … N. Xi,t-1 =
(x1,t-1, …,xN,T) contains the lagged values of these parameters, Ai(L) is a lag polynomial with the coefficients and αi is an individual unobservable bank-specific
fixed effect. The error terms, εi,t, have zero mean, country specific variance (σ2i),
and constant covariance matrix (cov(εt)=∑) that comprises the instantaneous relationships between the variables. In essence, the VAR model thus summarizes the
data by describing the endogenous variables, xi, as a linear function of their past
evolution.
In this paper, the each equation of the VAR model contains all bank and macro
indicators described in section 3 and their lagged observations as explanatory variables. Bank-level variables include total assets, risk weights, reserves for loan
losses and return on equity (ROE), while country-specific macroeconomic series
are GDP growth, bank debt issued, bank loans to non-financial corporations
(NFCs), asset prices and CDS spread. The model is estimated with OLS over the
period of 2005Q1–2013Q4 both for the euro area as a whole and for the four largest euro area economies. A lag selection criterion is used to select the number of
lags and two lags are retained. The estimations are performed in levels since differencing generally leads to the loss of information on long-run relationships between the variables.
As we want to study the overall impact of different shocks into the banking system, the residuals of the VAR model, ε, are interpreted as shocks. In order to see
the importance of this notation clearly and to highlight the system's responses to
impulses, the equation (1) can be written in the moving average (MA) form. Using a lag operator to define the matrix polynomial A(L) as B(L) = A1L – ... –
ATLT and after rearranging the terms one gets the following formula.
42
For more information on the methodology, see Uhlig (2005), Fry & Pagan (2011) and Eickmeier, Hofmann & Worms (2009).
Acta Wasaensia
−1
𝑥𝑖,𝑡 = �𝐼 − 𝐵(𝐿)� 𝜀𝑖,𝑡−1 = ∑∞
𝑘=0 𝐶𝑗𝑗,𝑘 ɛ𝑡−𝑘
127
(2)
where Cji,k is the kth period impulse response of variable xi to a unit change in xj.
Thus, an impulse response function, C, tracks the effect of a shock to endogenous
variables at the time of the event and over subsequent periods in time.
However, the estimation results for original error terms, ɛt, are not interesting as
they often lack economic interpretation. To interpret the results in an economically meaningful way, one needs to disentangle the error terms into "structural"
(economic) shocks, et, that are of interest. A solution is to write the original VAR
model in structural form, Axi,t=A(L)xi,t + ɛi,t. Dividing both sides with matrix A
gives xi,t= A(L)A-1xi,t + Aɛt. Now, let us use the notation Aɛt=ei,t. 43 Structural
shocks that we seek to measure are therefore linear combinations of the original
VAR errors weighted with an appropriate set of weights, A.
4.2
Shock identification and sign restrictions
In order to define the structural shocks, ei,t , from the vector of residuals of the
VAR, the weighting matrix needs to be defined. This is done by using an algorithm that produces a set of weights, A, by drawing from a uniform distribution.
The vectors containing the weights must nevertheless be orthogonal so that the
fundamental shocks are uncorrelated and that they produce uncorrelated impulse
response functions. Orthogonality also ensures that an occurrence of one shock
does not lead to the occurrence of shocks in all error terms and create unexplained
causal relationship between variables. The individual impact of a variable on the
system is thus singled out which helps to determine the impulse response functions. However, the orthogonalisation is not straightforward as many different
combinations of weights can produce candidate structural shocks that are uncorrelated. One possibility to solve this identification problem would be to use Choleski decomposition and the standard ordering of shocks that are widely used in
macroeconomic studies. But, to the best of our knowledge, there is no agreed
view in the literature regarding the timing of bank adjustment. As no a priori ordering of shocks exists for banking variables, we resort to identification strategy
that uses sign restrictions (see, for instance, Uhlig 2005; Eickmeier, Hofmann &
Worms 2009).
43
This structural form error term is iid white noise with covariance matrix Σe=A Σ A'.
128
Acta Wasaensia
The main idea of the sign restrictions is, first, to calculate the candidate structural
shocks, ei,t, and, secondly, compare the candidates to sign restrictions. Only those
shocks and impulse response functions that satisfy the postulated sign information
are retained. On the basis of the accepted shocks, we subsequently derive impulse
response functions. Typically there are many different shocks that satisfy the sign
restrictions, thus leading to a shaped distribution of the initial response.
We identify three shocks with sign restrictions, namely a risk shock, funding
shock and sovereign shock. These shocks are quite unique in terms of the previous literature, as only a few papers have previously disentangled the impact of
similar shocks on macro variables. When describing the shocks below, we refer to
the relevant literature. The signs of the contemporaneous effects of the shocks are
summarized in table 1. 44
Table 1. Sign restrictions imposed on the endogenous variables to identify the
shocks
Response to
risk shock
Total asset
Risk weight
Reserves for losses
Asset prices
Return on equity
(ROE)
Bank debt
GDP growth
Loans to NFCs
CDS spread
+
+
?
Response to
funding
shock
?
?
Response to
sovereign
shock
+
?
?
-
?
?
?
-
?
?
?
?
?
?
+
Note: The shocks are listed in the headings of the columns and endogenous variables
are in horizontal rows. The responses of the endogenous variables are presented with
signs. A negative (positive) sign means that an endogenous variable declines (increases) after the shock. The response is left free when no sign is specified.
Risk shock means that a bank's riskiness increases and its asset quality deteriorates
at given macroeconomic conditions. It may be due to changes in risk environ44
While modelling the target liability structure of banks is beyond the scope of the paper, a
decomposition of endogenous bank variables' shock dynamics and the variables' responses to
the macro-financial environment can be drawn from historical regularities with minimal identifying assumptions.
Acta Wasaensia
129
ment, liquidation risk, collateral values or regulatory environment (for instance,
asset quality review, Basel III). The volume of non-performing loans picks up,
leading banks to set aside increasing reserves for impairments and loan losses. As
banks are less willing to take risks, the shock also induces banks’ total assets to
decline. Several factors support this assumption. First, banks’ traditional lending
is likely to decline owing to increasing risks and pressures on equity capital. Such
an effect has been shown by Peersman & Wagner (2015). Based on a model of a
profit maximizing bank they indicate that if the stress at banks increases, lending
declines and it becomes less desirable for banks to hold more risk on balance
sheet. Second, general risk appetite declines, inducing a sell-off of risky investments from banks’ balance sheets. And third, banks start to remove bad loans
from their balance sheets, albeit this process is arguably very slow. The risk
weight indicator is assumed to increase owing to the deteriorating quality of assets and declining total assets.
Owing to short-term inelasticity of banks' other revenues and costs, banks' profitability is likely to be weakened by slowly materializing losses. However, as this
process is delayed we leave the response of banks' return on equity (ROE) free
and do not specify any restrictions for it. The risk shock nevertheless triggers a
decline in the value of assets. As bank’s future prospects and profits decline, investors immediately take a negative view on bank stocks. Mounting risks also
reduce loan supply and increase interest rate spreads, which in turn puts a downward pressure on the house prices. Declining house prices can also reflect the end
of asset exuberance or burst of a bubble. In a way, our risk shock resembles the
outcome of adverse asset price shock of Gulan et al. (2014). Moreover, following
Meeks (2012), we assume that an adverse financial shock increases expected default rates. 45 As the risk shock affects primarily banks, banks' CDSs are increasing more than the sovereign CDS, inducing our CDS spread indicator to decline.
Finally, the responses of bank debt, GDP and corporate lending are left undetermined.
The funding shock is related to deteriorating conditions in financial markets. The
shock may be due to increasing uncertainty, declining risk appetite of investors,
increasing funding costs in terms of rising money market interest rates and risk
premia or a combination of these factors. As a consequence, banks' issuance of
debt securities declines as banks find it increasingly difficult to obtain funding
from money markets. While banks' easy access to short-term funding has often
lead to excessive risk-taking and ballooning balance sheets (see, for instance,
45
Also Helbling et al. (2011) use default rates to identify a credit market shock.
130
Acta Wasaensia
Reinhart & Rogoff 2009), we assume that a funding shock negatively affects
banks' willingness to take risks. As banks' external funding is limited, risk-taking
diminishes, leading to declining risk weights and total assets. Similarly to the risk
shock, asset prices decrease as house prices decline and the expectation on banks’
future earnings are shifted downwards amidst the adverse conditions. The signs of
reserves for loan losses, ROE, GDP growth, corporate lending and CDS spread
indicators are not specified.
The sovereign shock portrays the impact of the sovereign debt crisis. In principle,
the initial direct macroeconomic implications and negative repercussions of a
sovereign shock could have materialized via increasing risk weights of sovereign
bonds and portfolio valuation changes of banks' sovereign debt holdings. However, the large changes in the prices of some government bonds resulted in relatively
limited shifts in the book value of bank assets. The asset values declined only a
little and the initial losses remained low, because a relatively small part of the
sovereign portfolio was held for trading purpose and had to be priced to market
value under supervisory rules. 46 Without an explicit reaction pattern the response
of our risk weight variable cannot be properly defined and it is left ambiguous.
The crisis nevertheless went through other channels such as deteriorating market
confidence impacting negatively on overall business environment. Rising sovereign risk is reported to have a negative impact on banks by pushing up the funding costs and adversely affecting the composition of euro area banks’ funding
(BIS 2011). Furthermore, banks' profitability and asset prices are likely to be
hampered owing to negative circumstances. For instance, Chan-Lau et al. (2012)
document the negative relationship between banks’ stock prices and sovereign
risk. We also assume that our CDS spread indicator increases as sovereign credit
default swaps rise initially more than bank CDSs. Banks' total assets are also set
to increase after the sovereign shock. The reasoning relies to the fact that the sovereign shock impacts primarily countries and its direct immediate impact on
banks is limited. Indeed, data shows that total assets of financial institutions continued to grow in euro area immediately after the Greek sovereign shock in May
2010. Despite of the shock, banks still had to honour their previous engagements
and relied to central bank funding to fund their activities. The responses of other
variables are left undefined.
46
According to Basel II framework, the regulatory risk weight for bonds issued by EU sovereigns may in many cases be set to zero. As a result, evolving sovereign risks are not reflected
in the risk weights and balance sheets of banks.
Acta Wasaensia
131
A nested identification scheme is applied in order to ensure a proper identification. In the first step we introduce simultaneous restrictions for risk shock and
funding shock. And in the second step, further restrictions are added on top of the
previous ones in order to identify the sovereign shock. Following a standard approach in the empirical literature these restrictions are imposed over two quarters
to account for the possibility of lagged adjustment.
Other shocks: In addition to three above-mentioned shocks, the analysis framework contains an unidentified part. It consists of all other possible shocks that are
orthogonal to the identified shocks and may affect the dynamics of the banking
sector and macro variables. Taking into account the significant role of the ECB’s
conventional and unconventional measures to ease the monetary policy stance
during the period under study, one obvious candidate is a monetary policy shock.
Such a shock would be manifested by falling interest rates and increasing liquidity in the banking system. Theoretically, expansionary monetary policy shock
should induce increasing bank lending and low lending rates (via bank lending
and interest rate channel), leading to improving financing conditions for firms and
supporting economic growth (see, for example, ECB 2009). The policy action is
also associated with raising spending, increasing consumption and investments,
higher inflation, higher risk-taking (so called risk-taking channel) and positive
wealth effect. By promoting recovery in the real economy, unconventional monetary policy lowers delinquency and default rates, raises profits and improves solvency. (Chodorow-Reich 2014).
However, the financial crisis affected negatively the functioning of interbank
markets, banks’ funding and financial standing. As a result, monetary policy was
conducted in highly exceptional circumstances. While the ECB’s measures alleviated the situation in financial markets, the pass-through of the monetary policy
shock was hampered by several other factors such as banking and corporate sector
deleveraging, declining loan demand and increasing non-performing loans of the
banking sector. Thus, the impact of the ECB’s accommodative policy stance on
credit supply is not easily determined. For instance, Peersman & Wagner (2015)
leave the impact of monetary policy shock on lending undetermined. It is also
difficult to disentangle the magnitude and timing on other variables. The final
impact of monetary policy shock on our bank and macro variables is thus unclear,
making it difficult to assess the effects of expansionary monetary policy. 47 Nevertheless, our funding shock may to some extent incorporate the monetary policy
47
It is clearly an avenue for future research.
132
Acta Wasaensia
shock as it is a positive mirror image of our negative funding shock. In this sense,
our model partly contains the monetary policy shock.
5 ESTIMATION RESULTS
This section presents the results of the VAR estimations and analyses the responses of the endogenous variables by using impulse response functions (IFRs).
We then study the propagation of these shocks to the economy and the implication of banks' adjustment in the four largest euro area countries and the euro area
as a whole over the estimation period. Finally, we track the effect of the estimated
shocks on banks’ total assets, corporate lending and average return on equity as
well as on GDP growth.
5.1
Responses to shocks
Starting with the estimation results of the VAR model, dependent variables are
mainly explained by their own history (table 1 in the annex). 48 Indicators such as
GDP growth, banks' profitability, CDS spread, bank debt issuance, total assets
and reserves for loan losses are also significant explanatory variables for other
endogenous parameters. As banks' riskiness and funding are often related to exogenous changes in banks' operating environment, their importance as explanatory variables for other bank-level indicators highlights the vulnerability of banks to
external shocks. Overall, the explanatory power of the models varies between
61% and 95%, indicating that they capture a large part of the volatility in the endogenous variables.
On the basis of the VAR estimation results and sign restriction approach, we next
derive banking system's responses to risk, funding and valuation shocks. The estimated responses of the endogenous variables to a one-standard-deviation shock
are depicted with bank-specific orthogonalized impulse response functions
(IRFs). 49 As several IRFs satisfy the given sign restrictions, we report the median
48
49
The VAR model is estimated with OLS. The equation (1) can be estimated efficiently by OLS
for each equation separately. As no restrictions are imposed on the parameters, the estimator
has the usual asymptotic properties of standard estimators. Another option would have been to
use Bayesian VARs. However, Bayesian estimation technique mainly improves out-of-sample
forecasts which is outside the scope of our paper.
In essence, the IRFs trace the long-term effects of a one-time shock (i.e. impulse) to one of the
dynamic system’s endogenous variables. By analysing the IRFs, we are thus able to analyse
Acta Wasaensia
133
of the accepted impulse responses in order to summarize the estimation results
(figures 2-4). 50 Moreover, we include the distribution of IRFs with 20% and 80%
confidence bands. The confidence bands around the median IRFs show some uncertainty regarding the responses, indicating the wide variability of bank responses. Our simulation horizon covers 15 quarters.
A risk shock induces an overall negative impact on banks' income statements and
balance sheets (figure 2). When the shock occurs, reserves for losses rise about 8
basis points during the first two quarters. The accruals continue to increase over
the subsequent periods owing to late materialization of risks. While the loss reserves increase throughout the estimation period, their relative growth rate nevertheless declines towards the end, reflecting the one-off nature of the shock. Owing
to the shock, risk weights increase immediately by 0.8 percentage point and total
assets decline by 1 percentage point. After the initial impact, the risk weights start
to decline after 4 quarters as banks adjust their balance sheets and portfolios. The
adjustment is also reflected in total assets, which continue to decline over the
whole simulation horizon, albeit at the slowing pace. The response of asset prices
is much more pronounced as they instantly decline by 4 percentage point. Asset
prices nevertheless rebound after 4 quarters and recover in the middle of the
simulation period before the response subsides close to zero. In addition, our CDS
spread indicator declines and does not return to positive territory, indicating that
markets continue to consider banks riskier than sovereigns several quarters after
the initial shock.
50
the internal behaviour of the dynamic system and endogenous variables in the case of exogenous disturbances.
The median could also be interpreted as a point estimate of the spatial impulse response (SIR)
at each point in time following the shock.
134
Acta Wasaensia
Figure 2. Impulse responses to a risk shock
Total assets
Risk weights
Loss reserves
Asset prices
CDS spread
Note: The horizontal axis shows the number of quarters after the initial shock. The vertical axis
indicates the response of the relevant variable. Total assets, asset prices and bank debt are expressed as annual growth rates, while risk weights, return on equity (ROE) and reserves for losses
are in percentages. The CDS spread indicator is in basis points. The solid line represents median
impulse response, while the lower and the upper dotted line stand for distribution at 20% and 80%,
respectively.
Turning to funding shock, total assets, risk weights and bank debt issuance exhibit
profoundly negative responses (figure 3). As the market conditions deteriorate,
the annual growth of banks’ debt issuance declines 0.2-0.4 percentage points during the first quarters. After the peak impact, bank debt issuance continues to decline albeit at the slowing pace. The funding conditions improve after seven quarters, when the annual growth rate of bank debt turns positive. In a similar fashion,
total assets decline immediately about 1 percentage point and recover towards the
end of the estimation period. In contrast, risk weights decline steadily after the
initial shock as their impulse responses remain negative after 15 quarters. Finally,
asset prices drop rapidly after a negative funding shock but recover relatively
quickly during the subsequent quarters.
Acta Wasaensia
135
Figure 3. Impulse responses to a funding shock
Total assets
Risk weights
Asset prices
Bank debt issued
Note: See note Figure 2.
The sovereign shock implies an initial negative impact on asset prices and bank
profitability, declining 2 percentage points and 0.7 percentage points, respectively
(figure 4). The response of asset prices is thus larger than that of return on equity.
The negative effects are nevertheless transitory in nature as the response of both
variables turns positive in subsequent quarters. But the responses slowly fade
away as time passes, reaching the baseline at the end of the estimation period. The
annual growth rate of total assets increases by 2 percentage points but the growth
rate subsequently declines to around 0.1 percentage points. The median impulse
response function of our CDS variable increases rapidly after the initial shocks
and remains positive almost throughout the whole estimation period. On average,
the CDS variable stands at around 2 percentage point higher than without the exogenous shock. However, the response is not permanent and fades towards the
end of the simulation period, potentially reflecting the fact that the euro area sovereign crisis affected also the outlook of the banking sector and induced bank
CDSs to rise towards the end of the simulation period.
136
Acta Wasaensia
Figure 4. Impulse responses to a sovereign shock
Total assets
Asset prices
ROE
CDS spread
Note: See note Figure 2. ROE stands for return on equity.
5.2
Time pattern of the shocks
While impulse response functions depict the responses of the endogenous variables to a one-standard-deviation shock, such a shock corresponds to a differentsized impact for each country in the sample. Moreover, the responses may differ
at each point in time. Based on the estimated parameters of the VAR and the identified shocks, we therefore compute historical dynamic effects of the shocks for
each country. The computations are done for each draw that fulfils the sign restriction, and then a simple average from individual outcomes is calculated. The
time paths of median shocks are depicted in figures 1-3 of the annex for euro area
as well as for France, Germany, Italy and Spain. Although the shocks vary considerably over time and across countries, the negative impact of sub-prime crisis
and European sovereign debt crisis can be clearly seen from the time paths of
these nominal shocks.
Starting with the risk shock, its effect is relatively subdued before the beginning
of the global financial crisis (figure 1 of the annex). When the financial crisis
erupted in the United States at the end of 2007, the magnitude of the risk shock is
nevertheless pushed upwards in all countries of the sample. After the initial
shock, the dynamic effects of the shock remain positive in Germany and France
as they were affected by the failures of money market funds in 2008. In addition,
French banks incurred losses from their Greek subsidiaries. At the same time, the
impact of the risk shock is limited in Spain and Italy which did not encounter the
Acta Wasaensia
137
first negative shock waves of the crisis. Towards the end of 2009, the estimated
shocks subsequently decline owing to rescue measures by European governments
and the extraordinary policy measures by the central banks. However, the risk
factor increases again in the middle of 2010 owing to the outbreak of the euro
area debt crisis. Banks were negatively affected by the deteriorating economic
growth and increasing impairments both form traditional lending and holdings of
Greek debt. From the second quarter of 2012 onwards German and French banks
are less affected by the risk shock than Italian and Spanish banks, facing large
write-offs. 51 In 2013, the negative effects abate in all countries, possibly reflecting the brighter prospects of the economy and improving risk outlook.
The funding shock exhibits large volatility over the estimation period (figure 2 of
the annex). In September 2008 the funding shock peaks in all countries owing to
the bankruptcy of Lehman Brothers. Amidst of the constant wave of European
bank failures and severe tensions in money markets, central banks took extraordinary liquidity measures and provided special refinancing operations at the end of
2008. Such measures reduced the impact of estimated funding shock considerably
in 2009. Nevertheless, the shock intensifies again after the magnitude of Greece’s
fiscal deficit was revealed at the beginning of 2010. In early May 2010, the funding shock peaks again as the situation in the international financial markets deteriorated amid the escalation of the crisis and downgrading of the Greek sovereign
debt rating. The shock intensified again in the middle of 2011 when concerns over
the euro area’s debt crisis affected funding conditions negatively. Towards the
end of the estimation period, the effects of the funding shock differ across the
countries in the sample. The relatively good standing of banks abated the estimated shock in Germany, France and in the euro area as a whole, while the distress in
financial markets affected Italian and Spanish banks negatively. The adverse impact on the Spanish banks continues to persist until June 2012, when the negative
effects decline somewhat after European Union granted funds to bank capitalisation.
The nominal path of the sovereign shock reflects in many ways that of the funding
shock, albeit with differences in timing and in magnitude (figure 3 of the annex).
While the sovereign shock affects banks only at the beginning of 2009, banks face
funding shock already in 2008. Similarly, the Greek debt problem increases the
51
One might have expected that the effect of risk shock on Spanish banks would have been
larger. To some extent the results are likely to be affected by our sample of listed banks. In
2010–2011 large Spanish banks benefited from diversification effects and profits from abroad,
while the bursting of the Spanish housing bubble affected mainly small savings banks ('cajas'),
which are not included in the sample.
138
Acta Wasaensia
dynamic effects of the sovereign shock in all countries, but only towards the end
of 2010. In general, the effects of the sovereign shock remain also subdued in
2011–2013. A notable exception is the Spanish banking sector that is adversely
affected by the sovereign shock in mid-2012. It is also of interest that in Germany
the sovereign shock is negative, reflecting actually a favourable impact on German banks. The outcome reflects potentially the country’s safe-haven status amid
the sovereign debt crisis.
5.3
The impact on banks and macro economy
To assess the driving forces of the dynamic evolution and to show the contributions of individual shocks on the variation of the macroeconomic variables, we
calculate the historical decompositions of the shocks. Using historical decompositions we estimate the individual contributions of each shock to the change in total
asset, loans to NFCs, return on equity and GDP. In technical terms, the equation
(2) can be written as follows:
(𝑗)
𝑡
𝑡
𝑥𝑖,𝑡 = ∑𝑡−1
𝑘=0 𝐶𝑗𝑗,𝑘 ɛ𝑗,𝑡−𝑘 + 𝐴1 𝑥0 + … + 𝐴𝑝 𝑥−𝑝+1
(3)
where Cji,k contain the structural impulse responses defined earlier and the Ai are
such that [A1, …, Ap] consists of the rows of the matrix A. In other words, the
model variables at each point in time, xt, can be presented as a sum of each structural shock of the model to the component series of xt, given by x0, …., x-p+1. 52
The figures 5 and 6 as well as figures 4-21 of the annex show how much of the
historical variation in the annual growth rate of banks’ total assets and loans to
non-financial corporations, in banks’ average return on equity (ROE) and in annual GDP growth is due to risk, funding and sovereign shocks. Overall, the identification schemes are successful in capturing the broad interaction among the set
of variables. The responses of the variables, which are not imposed, are also intuitive.
In the case of lending to non-financial corporations (NFCs), the shocks start to
weigh banks' ability to provide financing from 2009 onwards (figure 5). From a
euro area wide perspective, the estimated shocks explain around 60 percentage of
the credit slowdown at the end of 2009. Both the funding shock and risk shock
52
In a way, historical decomposition could be considered as a counterfactual analysis. Each
component shows what the history of xi,t would have been if the j th shock had been the only
one affecting the system.
Acta Wasaensia
139
constitute individually about 20 percentage of the total impact of euro area
shocks. Meanwhile, the contribution of the sovereign shock on banks’ loans to
NFCs has been limited. Risk and funding shocks remain relevant throughout
2009–2010, but the contribution of the funding shocks diminishes from 2011 onwards. Meanwhile, the sovereign shock remains relevant towards the end of the
estimation period.
Figure 5. Estimated contribution; the annual growth of corporate lending in euro
area (%)
10
5
0
-5
-10
05Q1
07Q1
Risk
09Q1
Funding
11Q1
13Q1
Sovereign
Compared to the total contribution of shocks at the euro area level, the total contribution is somewhat larger in Germany and France, but remains smaller in Italy
and in Spain during the first two years of the crisis (figures 4-7 of the annex). The
risk and funding shocks have been a major contributor in German, French and
euro area corporate loan growth. In 2012–2013 the contribution of the risk shock
becomes also prominent in Italy, depressing Italian banks' ability to grant credit.
A similar effect is evident in the case of the Spanish banks, although the risk
shock is relatively subdued and plays a part only from the beginning of 2013 on-
140
Acta Wasaensia
wards. 53 In Spain, the impact of the funding shock is also more pronounced than
that of the risk shock.
While the sovereign shock exhibits mainly negative impact in all countries of the
sample, it is somewhat more relevant in Spain and in Italy. It is of interest that
German banks have actually benefited from the sovereign shock. In Germany the
contribution of the shock was positive in 2011–2012 when German banking sector was shielded by the country’s strong public finances and the safe-heaven status. Moreover, the financial strength of German banks was considered to be relatively stronger than many other European counterparties, leading investors to be
more willing to fund German counterparties than other banks in the euro area
countries. For instance, the Spanish banks continued to face sovereign distress
throughout the whole estimation period. The sovereign shock thus eased the pressures faced by German banks and abated the negative contribution of other
shocks.
Figure 6. Estimated contribution; the annual GDP growth in euro area (%)
3
2
1
0
-1
-2
-3
-4
-5
-6
05Q1
07Q1
Risk
53
09Q1
Funding
11Q1
13Q1
Sovereign
The results reflects the fact that the sample includes only large banks that start to write off bad
loans later than small savings banks (‘cajas’).
Acta Wasaensia
141
The shocks have played a role in a slowdown of annual GDP growth (figure 6
and figures 8-11 of the annex). The contribution of the shocks in 2009 amounts to
about a third of the decline of the euro area GDP. The impact is considerably
larger in Germany, while being of similar magnitude in France. Thus, although
the uncertainty regarding the impact of the micro-level shocks on macro series
remains, shocks’ adverse effect on activity could have been substantial. Overall
and similarly to corporate lending, risk and funding shocks appear to have been
more important contributors to GDP decline than the sovereign shock. Nevertheless, the sovereign shock explains approximately 10 percent of the variation in
GDP growth in 2009. In Spain, the contribution of the sovereign shock remains
even more notable. In 2010–2011, positive development of GDP is supported by
shock contributions. Towards the end of the estimation period the importance of
shock contributions nevertheless varies across the large euro area economies.
While they abate in Germany and France, the risk and funding shocks have a negative impact on Italy and Spain. In 2012–2013 the sovereign shock does not seem
to be major component behind the decline of annual GDP growth.
Regarding balance sheets, the historical decompositions indicate that all shocks
contribute negatively also on the annual growth of banks' total assets (figures 1216 of the annex). Banks reduce their assets at the euro area level, in France and in
Germany due to the impact of the risk and funding shocks in 2009–2010. From
2012 onwards the impact of these shocks is nevertheless limited in Germany and
France. Meanwhile, the risk and funding shocks intensify in Spain and in Italy
during the latter part of the estimation period, inducing the euro area average to
remain unchanged. The sovereign shock has a subdued effect on the annual
growth of total assets during the estimation period. It nevertheless has a small and
temporarily positive effect in Germany and France during the first part of 2009. In
2012–2013, the sovereign shock also induces a limited negative impact on banks’
total assets.
Turning to banks’ average return on equity (ROE), shock contributions on banks’
profitability are significant (figures 17-21 of the annex). Amidst market turbulence and uncertainties at the trough of the financial crisis, in 2009, the average
adverse contribution of three shocks on euro area banks' profitability represents
about 56 percent of the recorded decline. At the country level, German and
French banks are most affected by the shocks in 2009, potentially reflecting the
increasing losses from investments and money market funds owned by the banks.
At the same time, some banks (including Hypo Real) faced difficulties in obtaining wholesale funding. After the initial shock, the impact of shocks on German
banks has declined and became almost non-existent in the latter part of the estimation period. Meanwhile, the profitability of Italian banks was hit heavily by
142
Acta Wasaensia
risk shock in 2011–2013. In 2013, the shock contribution explained about 60% of
variation in the case of Italy. In case of Spain, the contribution of shocks remains
limited.
6 CONCLUDING REMARKS
The recent financial crisis reminded economists and analysts alike of the role and
importance of financial intermediaries. Banks are not only passive intermediaries
through which central bank actions influence the broader economy, but can also
be a source of disturbance. The negative shifts in banks’ business environment
can spillback to overall economy and create negative feedback loops as banks
channel funds to borrowers and changes in banks’ credit supply affect the corporate capacity to finance investments. Banks’ increasing risks, declining profitability and weakened access to wholesale funding can thus have negative repercussions on overall output.
This paper contributes to the literature by estimating the impact of risk, funding
and sovereign shocks on the banking sector and macro economy at the euro area
level and in the largest euro area countries. The analysis is based on the estimation of VAR model with bank-level variables and macroeconomic data for 2005–
2013. First, we identify the shocks by using a sign restrictions approach. Second,
impulse response functions (IRFs) are applied to assess the individual implications of the shocks for endogenous variables. Finally, the historical decompositions of responses are composed to analyse how much of the variation in banks’
total assets, profitability and corporate lending as well as in GDP growth is explained by the shocks.
The results show that the time paths of nominal shocks capture the negative repercussions of the crisis in different banking systems and reflect the events of the
financial crisis. More importantly, the risk, funding and sovereign shocks explain
a substantial part of the variations in total assets, profitability, corporate lending
and GDP growth. At the euro area level, three shocks explain about 60 percentage
of the credit slowdown and a third of the decline in GDP in 2009. While risk and
funding shocks explain most of the variation in 2009–2010, the role of the sovereign shock remains subdued. However, the sovereign shock explains approximately 10 percent of the variation in banks’ profitability and GDP growth in
2009. During the latter part of the estimation period, all shocks continue to play a
role, albeit their contribution declines somewhat.
Acta Wasaensia
143
Over the whole estimation period, the euro area average is affected by different
country level dynamics. During the early years of the financial crisis, the contributions of shocks are substantial in Germany and France. In 2012–2013 the contributions of shocks subside in Germany and France, but they become significant
especially in Italy. Moreover, the contribution of three shocks remain relevant in
Spain during the latter part of the estimation period. Italian banks are affected by
the risk shock and Spanish banks face increasing funding pressures. Overall, the
negative implications of shocks at the euro area level are composed of the contributions of German and French banks in 2009–2011 and the contributions of
shocks to Italian and Spanish banks in 2011–2013.
144
Acta Wasaensia
References
Adrian T. & Shin, H.S. (2011). Financial intermediaries and monetary economics.
In Friedman, B.M. & Woodford, M. (Eds). Handbook of Monetary Economics.
Volume 3. Amsterdam: Elsevier. 601–650.
Aiyar, S. (2011). How did the crisis in international funding markets affect bank
lending? Balance sheet evidence from the United Kingdom. Bank of England
Working Paper 424.
Altunbas, Y., Gambacorta, L. & Marques-Ibanez, D. (2010). Bank risk and monetary policy. Journal of Financial Stability 6: 3, 121–129.
Bayoumi, T. & Melander, O. (2008). Credit matters: Empirical evidence on US
macro-financial linkages. IMF Working Paper 169.
Bernanke, B., Gertler, M. & Gilchrist, S. (1999). The financial accelerator in a
quantitative business cycle framework. In Taylor, J.B. & Woodford, M. (Eds).
Handbook of Macroeconomics. Volume 1C. Amsterdam: Elsevier. 1341–1393.
Berrospide, J. M. & Edge, R. M. (2010). The effects of bank capital on lending:
What do we know and what does it mean? International Journal of Central Banking 6: 4, 5–54.
BIS (2011). The impact of sovereign credit risk on bank funding conditions.
Committee on the Global Financial System Papers 43.
Buch, C.M. & Neugebauer, K. (2011). Bank-specific shocks and the real economy. Journal of Banking and Finance 35: 8, 2179–2187.
Calza, A. & Sousa, J. (2005). Output and inflation responses to credit shocks. Are
there threshold effects in the Euro area? ECB Working Paper Series 481.
Cappiello, L., Kadareja, A., Kok Sörensen, C. & Protopapa, M. (2010). Do bank
loans and credit standards have an effect on output? A panel approach for the euro
area. ECB Working Paper Series 1150.
Chan-Lau, J.A., Liu, E.X. & Schmittmann, J.M. (2012). Equity returns in the
banking sector in the wake of the great recession and the European sovereign debt
crisis. IMF Working Paper 174.
Chodorow-Reich, G. (2014). Effects of unconventional monetary policy on financial institutions. Brookings Papers on Economic Acticity, Spring, 155–227.
Acta Wasaensia
145
Cihak, M. & Brooks, P.K. (2009). From subprime loans to subprime growth? Evidence for the Euro area. IMF Working Paper 69.
ECB (2009). Monetary policy and loan supply in the euro area. ECB Monthly
Bulletin, October.
Eickmeier, S., Hofmann, B. & Worms, A. (2009). Macroeconomic fluctuations
and bank lending: Evidence for Germany and the Euro area. German Economic
Review 10: 2, 193–223.
Francis, W. & Osborne, M. (2009). Bank regulation, capital and credit supply:
Measuring the impact of prudential standards. Bank of England Occasional Paper
36.
Fry, R. & Pagan, A. (2011). Sign restrictions in structural vector autoregression:
A critical review. Journal of Economic Literature 49: 4, 938–960.
Gabaix, X. (2011). The granular origin of aggregate fluctuations. Econometrica
79: 3, 733–772.
Gambacorta, L. (2005). Inside the bank lending channel. European Economic
Review 49: 7, 1737–1759.
Gambacorta, L. & Marques-Ibanez, D. (2011). The bank lending channel: Evidence from the crisis. Economic Policy 26: 66, 135–182.
Gambacorta, L. & Mistrulli, P.E. (2003). Does banks capital affect lending behaviour? Journal of Financial Intermediation 13: 4, 436–457.
Gulan, A., Haavio, M. & Kilponen, J. (2014). Kiss me deadly: From Finnish great
depression to great recession. Bank of Finland Discussion Papers 24.
Helbling, T., Huidrom, R., Ayhan Kose, M. & Otrok, C. (2011). Do credit shocks
matter? A global perspective. European Economic Review 55: 3, 340–353.
Hempell, H.S. & Kok Sörensen, C. (2010). The impact of supply constraints on
bank lending in the Euro area. ECB Working Paper Series 1262.
Hülsewig, O., Mayer, E. & Wollmershäuser, T. (2006). Bank loan supply and
monetary policy transmission in Germany: An assessment based on matching
impulse responses. Journal of Banking & Finance 30: 10, 2893–2910.
146
Acta Wasaensia
Jiménez, G., Ongena, S., Peydró, J-L. & Saurina, J. (2012). Credit supply and
monetary policy: Identifying the bank balance-sheet channel with loan applications. American Economic Review 102: 5, 2301–2326.
Kashyap, A.K. & Stein, J.C. (2000). What do a million observations on banks say
about the transmission of monetary policy? American Economic Review 90: 3,
407–428.
Kishan, R.P. & Opiela, T.P. (2000). Banks size, bank capital and the bank lending
channel. Journal of Money, Credit and Banking 32: 1, 121–141.
Lown, C. & Morgan, D.P. (2006). The Credit cycle and the business cycle: New
findings using the loan officer opinion survey. Journal of Money, Credit and
Banking 38: 6, 1575–1597.
Maurin, L. & Toivanen, M. (2015). Risk, capital buffers and bank lending: The
adjustment of euro area banks. Journal of Banking and Financial Economics 1,
113–129.
Meeks, R. (2012). Do credit market shocks drive output fluctuations? Evidence
from corporate spreads and defaults. Journal of Economic Dynamics and Control
36, 568–584.
Peersman, G. & Wagner, W. (2015). Shocks to bank lending, risk-taking, securitization, and their role for US business cycle fluctuations. CEPR Discussion Paper
10547.
Puri, M., Rocholl, J. & Steffen, S. (2011). Global retail lending in the aftermath of
the US financial crises: Distinguishing between supply and demand effects. Journal of Financial Economics 100: 3, 556–578.
Reinhart C. & Rogoff, K. (2009). This time is different: Eight centuries of financial folly. Princeton: Princeton University Press.
Rondorf, U. (2012). Are banks important for output growth? A panel analysis of
the euro area. Journal of International Financial Markets, Institutions & Money
22: 1, 103–119.
Uhlig, H. (2005). What are the effects of monetary policy on output? Results from
an agnostic identification procedure. Journal of Monetary Economics 52: 2, 381–
419.
Acta Wasaensia
147
Annex. Tables and figures
Table 1. VAR estimation results (equations in columns)
Total
assets
Total assets (t-1)
0.62**
(0.067)
Total assets (t-2)
0.092
(0.241)
Risk weights (t-1)
-0.014
(0.067)
Risk weights (t-2)
0.01
(0.651)
Reserves for losses (t-1) 0.193
(0.193)
Reserves for losses (t-2) 0.172
(0.608)
Asset prices (t-1)
-0.259
(0.177)
Asset prices (t-2)
-0.058
(0.174)
ROE (t-1)
-2.09*
(1.165)
ROE (t-2)
0.164
(0.168)
GDP growth (t-1)
2.996**
(1.211)
GDP growth (t-2)
-0.228
(0.261)
Bank debt issued (t-1)
0.001
(0.045)
Bank debt issued (t-2)
0.207
(0.244)
NFC loans (t-1)
0.014
(0.046)
NFC loans (t-2)
0.035**
(0.018)
CDS spreads (t-1)
0.344
(0.243)
CDS spreads (t-2)
-0.009
(0.018)
Risk
Weights
Reserves
for losses
Asset
prices
ROE
0.064** -0.003 0.217** -0.002
(0.023)
(0.003)
(0.109)
(0.02)
0.042
-0.001
-1.59** -0.127*
(0.084)
(0.012)
(0.394)
(0.072)
-0.029
-0.002
-0.058
0.024
(0.023)
(0.003)
(0.11)
(0.02)
0.003
-0.022
0.414
0.207
(0.227)
(0.032)
(1.066)
(0.193)
0.894** -0.005
0.499*
0.033
(0.067)
(0.009)
(0.316)
(0.057)
0.019
0.01
-2.317** -0.293*
(0.212)
(0.03)
(0.995)
(0.181)
-0.041
0.011 -0.607** -0.055
(0.062)
(0.009)
(0.291)
(0.053)
-0.067
-0.016*
-0.077
0.068
(0.061)
(0.009)
(0.284)
(0.052)
-0.996** 0.532**
0.744
-0.168
(0.407)
(0.057)
(1.908)
(0.346)
-0.001
0.014*
0.395
-0.049
(0.059)
(0.008)
(0.275)
(0.05)
0.379
0.398** 3.344*
0.156
(0.423)
(0.06)
(1.983)
(0.36)
0.039
-0.016
-0.127
-0.007
(0.091)
(0.013)
(0.428)
(0.078)
0.013
-0.001 0.676** 0.022*
(0.016)
(0.002)
(0.073)
(0.013)
0.034
0.015
0.229
0.053
(0.085)
(0.012)
(0.4)
(0.073)
0.018
0
-0.069
0.014
(0.016)
(0.002)
(0.076)
(0.014)
0.007
-0.001 0.057** 0.019**
(0.006)
(0.001)
(0.029)
(0.005)
-0.074
-0.01
1.408** 0.922**
(0.085)
(0.012)
(0.399)
(0.072)
-0.009 0.002**
-0.02
-0.005
(0.006)
(0.001)
(0.03)
(0.005)
GDP
growth
0.002
(0.007)
-0.123**
(0.024)
0
(0.007)
1.065**
(0.066)
0.057**
(0.019)
-0.332**
(0.061)
-0.054**
(0.018)
0.008
(0.018)
-0.041
(0.118)
0.01
(0.017)
0.157
(0.122)
0.042*
(0.026)
0.021**
(0.005)
-0.046*
(0.025)
-0.003
(0.005)
0.001
(0.002)
0.11**
(0.025)
0.002
(0.002)
Bank debt
issued
NFC
loans
CDS
spreads
-0.012
-0.006
0.042
(0.025)
(0.017)
(0.251)
-0.284** -0.051
0.1
(0.089)
(0.061)
(0.906)
0.016
0.032*
-0.152
(0.025)
(0.017)
(0.253)
-0.08
0.18
-0.364
(0.241)
(0.165)
(2.449)
0.07
0.031
-0.904
(0.071)
(0.049)
(0.725)
0.079
0.14
-0.654
(0.225)
(0.154)
(2.286)
-0.051
-0.022
0.921
(0.066)
(0.045)
(0.668)
1.156**
0.062
0.363
(0.064)
(0.044)
(0.653)
0.055
0.134 -14.294**
(0.431)
(0.295)
(4.384)
-0.315** 0.044
-0.132
(0.062)
(0.043)
(0.631)
-0.035
-0.124 10.666**
(0.448)
(0.307)
(4.556)
0.304** 1.047**
-0.14
(0.097)
(0.066)
(0.982)
-0.024
0.004
0.573**
(0.017)
(0.011)
(0.169)
-0.146* -0.297** -0.709
(0.09)
(0.062)
(0.919)
0.022
0.015 -0.451**
(0.017)
(0.012)
(0.174)
0.018**
0.001
0.508**
(0.007)
(0.005)
(0.067)
0.32**
0.082
0.231
(0.09)
(0.062)
(0.916)
-0.005 -0.013** 0.204**
(0.007)
(0.005)
(0.069)
No. of observations
1178
1178
1178
1178
1178
1178
1178
1178
1178
R-squared
72.9
88.82
88.18
69.71
90.21
92.32
94.26
95.29
61.23
Note: Estimations are run with OLS and estimation period covers 2005:1─2013:4. Equations are reported in
columns and explanatory variables in rows. Total assets, asset prices, GDP growth, bank debt and loans to
non-financial corporations (NFCs) are expressed as annual growth rates, while risk weights, reserves for
losses and return on equity (ROE) are in percentages. Standard deviation of the estimate is under the point
estimate in brackets. One (two) asterisk denotes that the coefficient is significant at 10% (5%).
148
Acta Wasaensia
Figure 1. Estimated nominal risk shock 2005Q1–2013Q4
2,0
1,5
1,0
0,5
0,0
-0,5
-1,0
-1,5
05Q1
07Q1
EA
09Q1
DE
FR
11Q1
13Q1
IT
ES
Figure 2. Estimated nominal funding shock 2005Q1–2013Q4
1,2
0,8
0,4
0,0
-0,4
-0,8
-1,2
-1,6
05Q1
07Q1 09Q1 11Q1
EA
DE
FR
IT
13Q1
ES
Acta Wasaensia
149
Figure 3. Estimated nominal sovereign shock 2005Q1–2013Q4
2,0
1,5
1,0
0,5
0,0
-0,5
-1,0
05Q1
EA
07Q1
09Q1 11Q1 13Q1
DE
FR
IT
ES
Figure 4. Estimated contribution; the annual growth of corporate lending in Germany (%)
10
5
0
-5
-10
05Q1
07Q1
Risk
09Q1
Funding
11Q1
13Q1
Sovereign
150
Acta Wasaensia
Figure 5. Estimated contribution; the annual growth of corporate lending in
France (%)
10
5
0
-5
-10
05Q1
07Q1
Risk
09Q1
Funding
11Q1
13Q1
Sovereign
Figure 6. Estimated contribution; the annual growth of corporate lending in Italy
(%)
10
5
0
-5
-10
05Q1
07Q1
Risk
09Q1
Funding
11Q1
13Q1
Sovereign
Acta Wasaensia
151
Figure 7. Estimated contribution; the annual growth of corporate lending in Spain
(%)
25
20
15
10
5
0
-5
-10
-15
-20
-25
-30
05Q1
07Q1
Risk
09Q1
Funding
11Q1
13Q1
Sovereign
Figure 8. Estimated contribution; annual GDP growth in Germany (%)
4
2
0
-2
-4
-6
-8
05Q1
07Q1
Risk
09Q1
Funding
11Q1
13Q1
Sovereign
152
Acta Wasaensia
Figure 9. Estimated contribution; annual GDP growth in France (%)
4
3
2
1
0
-1
-2
-3
-4
-5
-6
05Q1
07Q1
Risk
09Q1
Funding
11Q1
13Q1
Sovereign
Figure 10. Estimated contribution; annual GDP growth in Italy (%)
4
2
0
-2
-4
-6
-8
05Q1
07Q1
Risk
09Q1
Funding
11Q1
13Q1
Sovereign
Acta Wasaensia
153
Figure 11. Estimated contribution; annual GDP growth in Spain (%)
4
3
2
1
0
-1
-2
-3
-4
-5
-6
05Q1
07Q1
Risk
09Q1
Funding
11Q1
13Q1
Sovereign
Figure 12. Estimated contribution; the annual growth of total assets in euro area
(%)
20
15
10
5
0
-5
-10
-15
-20
05Q1
07Q1
Risk
09Q1
Funding
11Q1
13Q1
Sovereign
154
Acta Wasaensia
Figure 13. Estimated contribution; the annual growth of total assets in Germany
(%)
40
30
20
10
0
-10
-20
-30
05Q1
07Q1
Risk
09Q1
Funding
11Q1
13Q1
Sovereign
Figure 14. Estimated contribution; the annual growth of total assets in France (%)
25
20
15
10
5
0
-5
-10
-15
-20
05Q1
07Q1
Risk
09Q1
Funding
11Q1
13Q1
Sovereign
Acta Wasaensia
155
Figure 15. Estimated contribution; the annual growth of total assets in Italy (%)
50
40
30
20
10
0
-10
-20
05Q1
07Q1
Risk
09Q1
Funding
11Q1
13Q1
Sovereign
Figure 16. Estimated contribution; the annual growth of total assets in Spain (%)
50
40
30
20
10
0
-10
-20
05Q1
07Q1
Risk
09Q1
Funding
11Q1
13Q1
Sovereign
156
Acta Wasaensia
Figure 17. Estimated contribution; average return on equity in euro area (p.p.)
10
8
6
4
2
0
-2
-4
-6
-8
-10
05Q1
07Q1
Risk
09Q1
Funding
11Q1
13Q1
Sovereign
Figure 18. Estimated contribution; average return on equity in Germany (p.p.)
15
10
5
0
-5
-10
-15
05Q1
07Q1
Risk
09Q1
Funding
11Q1
13Q1
Sovereign
Acta Wasaensia
Figure 19. Estimated contribution; average return on equity in France (p.p.)
10
5
0
-5
-10
05Q1
07Q1
Risk
09Q1
Funding
11Q1
13Q1
Sovereign
Figure 20. Estimated contribution; average return on equity in Italy (p.p.)
10
5
0
-5
-10
05Q1
07Q1
Risk
09Q1
Funding
11Q1
13Q1
Sovereign
157
158
Acta Wasaensia
Figure 21. Estimated contribution; average return on equity in Spain (p.p.)
10
5
0
-5
-10
-15
05Q1
07Q1
Risk
09Q1
Funding
11Q1
13Q1
Sovereign


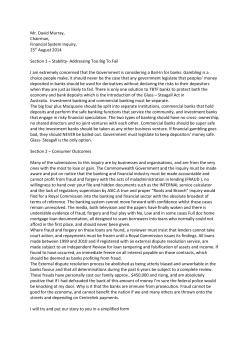


© Copyright 2026