
financing model opportunities for the new logistics in finland
VAT 3
FINAL
FINANCING MODEL OPPORTUNITIES FOR THE
NEW LOGISTICS IN FINLAND
January 2015
FINAL REPORT
1
VAT 3
FINAL
Table of contents
ACKNOWLEDGEMENTS .................................................................. 5
EXECUTIVE SUMMARY ................................................................... 5
INTRODUCTION ........................................................................... 6
BACKGROUND .......................................................................... 6
PROBLEM FORMULATION ............................................................ 6
AIM ....................................................................................... 7
SCOPE OF WORK ...................................................................... 7
FINANCING ALTERNATIVES ............................................................. 8
TRADITIONAL MODELS FOR SHIP FINANCING ..................................... 8
Traditional Bank Finance (70% of funding for shipping industry) ......... 9
PENSION FUNDS AND BONDS ...................................................... 10
Bond Market (15% of funding for shipping) .................................. 11
PRIVATE EQUITY AND HEDGE FUNDS ............................................ 11
LIFECYCLE MODELS ................................................................. 11
Private – Public Partnership (PPP) ............................................ 11
Value of a PPP model ............................................................ 13
Regulated Asset Base (RAB) model ............................................ 14
PUBLIC FUNDING/SUBSIDIES ....................................................... 15
EU’s TEN-T ......................................................................... 15
EU investment package ......................................................... 15
National level ..................................................................... 16
Outlining a model for designing purpose built governance and financing models
....................................................................................... 16
BENCHMARK ............................................................................ 19
E18 KOSKENKYLÄ-KOTKA .......................................................... 19
2
VAT 3
FINAL
Background ........................................................................ 19
Project scope ..................................................................... 19
Project funding ................................................................... 19
Drivers and barriers.............................................................. 20
RANTATIE ALLIANCE PROJECT (TAMPERE) ..................................... 20
Background ........................................................................ 20
Project scope ..................................................................... 21
Project funding and bonus system ............................................ 21
Drivers and barriers.............................................................. 22
FINDINGS, DISCUSSION ................................................................ 22
1.
SOKLI - ROUTE TO MARKET ................................................ 22
General presentation of logistical lane ...................................... 22
Material flows of the logistical lane........................................... 24
Involved parties and stakeholders in the logistical lane .................. 25
Market needs and competitive situation ..................................... 25
Drivers and barriers.............................................................. 26
Preliminary investment costs .................................................. 26
Alternative financing models; innovation, incentives and financers ... 27
Preliminary NPV - calculation, logistics system PPP ....................... 29
2.
RO-RO CONTAINER SHUTTLE, HELSINKI – TALLINNA .................. 30
General presentation of logistical lane ...................................... 31
TEN-T ............................................................................... 31
Material flows of the logistical lane........................................... 33
Involved parties and stakeholders in the logistical lane .................. 34
Market needs and competitive situation..................................... 34
Drivers and barriers.............................................................. 35
Preliminary investment costs .................................................. 35
Alternative financing models; innovation, incentives and financers ... 36
Preliminary NPV-calculation ................................................... 36
3.
SHORT SEA COASTER SYSTEM ............................................. 37
3
VAT 3
FINAL
General presentation of logistical lane ...................................... 38
Material flows of the logistical lane........................................... 38
Involved parties and stakeholders in the logistical lane .................. 38
Market needs and competitive situation ..................................... 39
Drivers and barriers.............................................................. 39
Preliminary investment costs .................................................. 40
Alternative financing models; innovation, incentives and financers ... 41
Preliminary NPV-calculation for alternative 1 .............................. 44
SUMMARY ............................................................................... 45
REFERENCES ............................................................................ 46
INTERVIEWEES / DISCUSSANTS ....................................................... 49
4
VAT 3
FINAL
ACKNOWLEDGEMENTS
This work was financed by the Shipowner’s foundation and FIMECC REBUS program. The
project team members would like to express their gratitude to all companies, organizations
and people who have contributed to this report with their knowledge and opinions. The
following persons have contributed to this report: Professor, Kim Wikström, Åbo Akademi
University, Professor, Kent Eriksson, Stanford University, M.Sc. Annemari Andrésen, PBI
Research Institute, M.Sc. Tomas Arhippainen, PBI Research Institute, M. Sc. Johan
Ingberg, PBI Research Institute, M.Sc. Anu Keltaniemi, Åbo Akademi University.
EXECUTIVE SUMMARY
There is a clear need to renew the logistical chains in Finland in the coming years. This
includes improving the competitiveness of both the importing and exporting industry, which
uses the logistical services, the highways, ports and related activities and especially
shipping, which is subject to significant changes in the environmental regulations. It is
deemed as highly important that organizations who are active in Finland and have Finnish
ownership take on a central role in this development.
It is more a rule than an exception that infrastructure projects exceed initial planned time
and cost, and that the outcome does not reach promised benefits for the project
stakeholders nor the society. Thus there is a clear need to find alternatives for governing
and funding future infrastructure investments.
Traditionally, infrastructure projects have either been funded by the public sector or by the
private sector and in this report we discuss alternative models, where public and private
sectors are more integrated through alliances or other life-cycle models.
There is much evidence that life-cycle models, when applied correctly, are superior in time
and cost in comparison to traditional public-driven projects. From a Finnish perspective, it
seems that the perspective of building life-cycle models points at the main benefit coming
from the possibility to transfer capital costs to service fees and thereby lower the barrier for
starting the infrastructure project. However, this view is too narrow. Evidence from
successful life-cycle model projects shows that the real benefits come from private sector
due diligence and stakeholders with the right competence, as well as incentives that lead to
innovation and a governance model that pushes for not just reaching the promised benefits,
but for delivering more than initially planned.
This report recommends replacing traditional financial investors with institutional investors
that have a more long-term perspective on investments. The challenges with institutional
investors are the ability to handle high risks in environmental and social aspects, but they
can handle market risk.
In this report we want to highlight the need for looking at infrastructure projects from an
overall system point of view, where understanding of the ecosystem and the overall
governance model is important. To give concrete examples of the main arguments, we have
analyzed 3 different logistical systems and present alternative models for financing and
governing these projects in the report.
5
VAT 3
FINAL
INTRODUCTION
BACKGROUND
Infrastructural investments in society are increasingly executed through models engaging
several parties. Financing schemes representing the public and the private sectors, various
alliances and involvement of various types of technology funds are increasingly being
applied. So called PPP- lifecycle models (Public-Private-Partnership) have been applied
already for a long time in the transport-, energy- and construction segments, where the
customer is a public actor who places the order with a private, often purpose-made
company. As an example of such investments in Finland, road construction projects can be
mentioned (for example the Koskenkylä–Kotka highway, opened 1.9.2014).
The reason for the change is the need for new implementation and thereby financing
models. The implementation models should be more efficient cost- and revenue- wise than
public sector projects. So called institutional financers are seen as important future funding
sources. On a global level, in many countries institutional financers such as pension
insurance companies and state investment companies are already involved in important
investments for society.
Previous research projects (“Fairway to the future 1 & 2”1) have outlined the future logistics
environment in Finland, where one important factor is the change in the environmental
regulations taking effect in 2015. The needed investments in the logistics in order to renew
fairways and short sea transportation require a redefinition of financing models. The results
from ”Fairway to the future” have been presented at a financing seminar and also at an
investor forum at Stanford University and based on the feedback, preliminary alternatives
and principles for financing models for the logistical chain have been outlined. The results
have also been presented and discussed in a financing seminar arranged by the Ministry of
Transport and Communications 9.6.2014, with the conclusion that there is a need for further
research regarding alternative financing models for shipping and renewal of the complete
logistical chain.
PROBLEM FORMULATION
There is a clear need to renew the logistical chains in Finland in the coming years. This
includes both the importing and exporting industry, which uses the logistical services, the
highways, ports and related activities and especially shipping, which is subject to significant
changes in the environmental regulations. It is deemed as highly important that
organizations who are active in Finland and have Finnish ownership take on a central role
in this development.
Along with the changing environment and the needed investments to meet the changes,
new models are needed for collaboration in and financing of these projects. The traditional
ways of funding through bank loans and project management based on customer-main
1
Fairway to the future. The future of Shipping in Finland 2015 and beyond. PBI Research Institute & The shipowners’ foundation in Finland. 2013.
6
VAT 3
FINAL
contractor relationships with strict liabilities need renewal. Risks and rewards need to be
shared differently and mutual goals defined. This report deals with these issues.
AIM
The aim of this work is to create proposals for different business models, including the
financing models, for construction and renewal of three logistical lanes from factory to end
customer. The research is conducted based on previous work2, the knowledge published by
Åbo Akademi as part of the FIMECC REBUS project3, as well as interviews with actors
representing the chosen logistical lanes.
The chosen lanes are:
1. Sokli mine route to market
2. Ro-Ro container shuttle, Helsinki - Tallinna
3. Short Sea coaster system
The business models presented in this report include the following elements:
System level presentation of the logistical lane (road, rail, port, shipping etc.)
Material flows
Involved parties and stakeholders (including alternatives)
Market needs and competitive situation
Drivers and Barriers
Preliminary investment costs
Alternative financing models; innovation, incentives and financers
Preliminary NPV-calculation
SCOPE OF WORK
The scope of work is presented below and was conducted through information gathering in
the form of interviews, meetings and desk studies.
1. Outlining different investment models and their implementation
2. Interviews and meetings with stakeholders
3. Analysis and final report including business models for the selected logistical routes
and their financing alternatives
2
Fairway to the future. The future of Shipping in Finland 2015 and beyond. PBI Research Institute & the Shipowners’ foundation in Finland. 2013.
3 http://www.fimecc.com/programs/rebus
7
VAT 3
FINAL
FINANCING ALTERNATIVES
Financing has in recent years become a major obstacle for investments. The banks have
sharpened their loan criteria and raised the margins and some banks have for example
withdrawn from ship financing altogether. Shipping investments are long-term and the risks
are higher than for example with real estate. For example, the slump that was witnessed in
the freight rates due to the overcapacity of vessels after 2008 caused the value of the
vessels to sink significantly. Another problem for obtaining ship financing is that the shipping
customers are reluctant to commit to long-term charter agreements, which the banks would
need as guarantee. Different alternatives for shipping financing and models created in other
countries were presented in the Fairway to the future report4.
However, as these means do not fully meet today’s financing needs, new financing methods are sought. Some models, both traditional and alternative ones, are presented below.
TRADITIONAL MODELS FOR SHIP FINANCING
The traditional models, and their importance, are often divided into pre-finance crisis and
post-financial crisis. The reason for this is that the complete picture changed dramatically in
such a short time. Between 2003 and 2008, new ships worth USD 800 billion were ordered,
with half of the orders being placed during 2007–20085.
The peak in shipping and offshore loans came in 2007 and reached a volume of up to USD
115 billion p.a., with the highest peak in Q3 2007 with over USD 40 billion. During the worst
period of the financial crisis 2008–2010, the annual outgoing volume dropped to around
USD 35 billion p.a.6
Although a recovery has been witnesses since, the traditional financing models still cannot
meet the order book of new building. The development is portrayed in the picture below.
4
Fairway to the future. The future of Shipping in Finland 2015 and beyond. PBI Research Institute & The shipowners’ foundation in Finland. 2013.
5
Stopford M (2010). “A Year of Decisions for Shipping: How Will the Markets Develop?” Presentation made at the Financial Times Deutschland Ship Finance Conference.
6 DNB Markets, Presentation to Shipping forum, 18th October 2012
8
VAT 3
FINAL
Picture 1: Lending to shipping firms7
Traditional Bank Finance (70% of funding for shipping industry)
When talking about “traditional bank loans”, one is often referring to syndicated loans.
Syndicated loans are loans that are offered by a group of lenders (called a syndicate) to a
single borrower. This is done to spread the risk over several lenders. The lenders can be
other banks but also institutional investors like pension funds and hedge funds.
Usually there is one lead bank that may take on a proportionally larger share of the loan,
and perform administrative duties like dispersing cash flows amongst the other syndicate
member. The largest banks arranging syndicated loans in shipping are Nordea Bank, DnB
NOR Bank ASA, ING and Citi.
In 2011 DnB NOR and Nordea, together, were bookrunners in 28.5% of the transactions
and MLAs (Mandated Lead Arranger) in 21.1%. In 1Q 2013 those figures had risen to 33.9%
as bookrunners and MLAs in 23.0%. French and German banks used to be important in ship
finance, as well as UK banks like Lloyds and Royal Bank of Scotland, but with them pulling
back, the vacuum is being filled by bonds and export credit agencies8.
7The Economist, We try harder
8
Marine Money Offshore. Dealogic 3Q 2011 – Will the Numbers Catch-up to the Noise?
9
VAT 3
FINAL
Picture 2: Top ship financing banks9
German banks, HSH Nordbank, Commerzbank and KfW still have the biggest portfolios
when it comes to shipping loans but they have announced that they are increasingly seeking
innovative ways to reduce their shipping portfolios.10 Bank lending is still available but banks
are more critical and careful, and going for “good projects”. Before the finance crisis, banks were ready to lend up to 80% of the cost of the ship. By 2012 that figure had dropped to
around 50%. It is still open how the coming changes in the shipping regulation regarding
emissions will affect the allocation between different financing sources.
Pension funds and bonds
Pension funds have not traditionally been heavily involved in direct shipping financing. Most
financing has been through syndicated loans, arranged by different banks. This way both
the risk and capital used have been minimized. Another channel has been through
specialized funds, led by asset managers that invest in shipping. In Denmark, Danica
Pension, a Pension Fund owned by Danske Bank, have specialized in investing in shipping.
Danica Pension states that the total investment sum for all business sectors involves more
than a billion USD in the years to come, of which the Danish maritime companies constitute
an important part.11
However, pension funds have been attracted to infrastructure investments as they expect
them to produce predictable and stable cash flows over the long term. Infrastructure assets
Lloyd’s list, Focus on Finance
Financial Times, European banks face tough 2014 as ECB focuses on shipping.
11 Shippingwatch, Danish pension fund to invest heavily in shipping
9
10
10
VAT 3
FINAL
can operate in an environment of limited competition as a result of natural monopolies,
government regulation or concessions. Investments can be capital intensive and include a
tangible asset that must be operated and maintained over the long term. This includes port
and other assets in the transportation sector.12
Bond Market (15% of funding for shipping)
Bond issuance is another financing option for shipping companies. In most instances,
smaller shipping companies target the high-yield bond space, paying a relatively higher price
to secure bond financing compared to larger entities that will pay less. Capital markets,
whether debt or equity, are driven predominantly by sentiment and availability is not a given
quantity. Shipping companies that want to access these markets will need time to correctly
prepare well in advance so as to be able to move fast when an opportunity arises 13.
Private equity and hedge funds
Over the past few years, private equity funds, new players to this industry, have been
showing growing interest and gaining momentum in filling the gap of traditional bank finance.
Between 2011 and 2012, private equity funds financed no less than 22 shipping transactions
with an aggregate magnitude of more than $6.4 billion.14
A way to access the shipping finance market has also been by buying old shipping loans
that banks are selling off. An estimated USD 5 billion in shipping loans have changed hands
in the past few years. Examples of recent deals are Davidson Kempner Capital Management
LLC, USD 500 million deal for part of Lloyds Banking Group Plc (LLOY)’s shipping portfolio, Oaktree Capital Management made a 280 million euro deal buying 14 chemical tankers from
Commerzbank AG (CBK) and HSH Nordbank AG, the largest shipping lender, is preparing
to sell a portfolio of shipping loans after a previous package valued at about 300 million
euros failed to attract investors.15
LIFECYCLE MODELS
Private – Public Partnership (PPP)
There are two main types of PPP, remunerated by tolls levied by the private partner or
remunerated by availability payments from the government contracting agency. These entail
rather different risks for the private parties and therefore tend to attract different types of
investors. Transport projects also differ considerably in relation to risk, and demand risk in
particular. Both types of PPP create liabilities for the taxpayer, which need to be contained
by transparent public accounting rules and budget procedures that identify them as on balance sheet commitments.16
12OECD,2011.
Pension funds investment in infrastructure – a survey
The Asset. The changing face of shipping finance
14
Watson, Farley& Williams. Maritime Briefing, February 2013.
15 Bloomberg. Private-Equity Funds Bet $5 Billion on Shipping Rebound
16 OECD, 2013. Institutional investors and infrastructure financing, s.18.
13
11
VAT 3
FINAL
Picture 3: Life-cycle model17
One regulating and enabling factor in designing the PPP model is the type of infrastructure
investment. In investments with high national interest (rail, road, energy) and regarding
national resources (forest, oil, mining) the government mostly takes a leading role in the
PPP model, not necessary as a majority holder but as the initiator and by governing funds
where other institutional investors can be invited to. A central enabler can be investments
with a high potential for technology or business innovation, which again can be partly an
incentive for the involved investors.
One main reason for the government to propose a PPP is the possibility to avoid large capital
cost investments to initiate a new infrastructure project and rather pay a service fee over the
life-cycle of the investment, which is portrayed in the pictures below.
Picture 4: Distribution of Capex and O&M costs in a traditional infrastructure investment project
17
Raitiotiehankkeen toteutusmalliselvitys, Tampereen kaupunki
12
VAT 3
FINAL
Picture 5: Distribution of Capex and O&M costs in a PPP infrastructure investment project
Value of a PPP model
Should the use of PPP to avoid large capital investments by the government in the beginning
of the investment project be seen as the only benefit of the PPP model? The critics of the
PPP model are of the opinion that the government should not need to invite investors with
targets of good returns on own investment to participate in larger infrastructure projects. To
see a PPP model only as a mechanism to transfer costs from capital investment to a service
fee with higher costs over the life- cycle is in our opinion a too limited view.
In a report by Clayton Utz regarding the benefits of PPP models in Australia, it is highlighted
that the transfer of risks to the private sector, the improved project scoping, the life-cycle
cost savings by bundling maintenance services into the contract are indeed beneficial, but
not unique for the PPP model. According to Clayton Utz, the real benefit of PPPs comes
from the rigid due diligence and monitoring of the project, that has a positive effect on the
cost and time performance. It is mentioned that PPPs often are superior in these areas in
comparison to traditional government procurement. 18
In short, when evaluating the value of a PPP model, one needs to look into more than the
financing and transfer of costs from capital investment to service fee and take into account
the increased innovation, better control, as well as economies of scale when taking in a
professional private contractor to lead the construction and maintenance. Also, the
opportunity to involve the parties that benefit from the infrastructure project to take part in
the financing should be seen a possibility to decrease the government share of the
investment. Such parties can be private companies, who either will utilize the logistical
system or who will profit from either the construction or the operation and maintenance of
the system. For the beneficiaries of the logistical system to make an investment into the
PPP, there should be built-in incentives for them to improve own profits by either decreasing
the construction time or designing the system to be more efficient to operate and maintain.
18
Improving the outcomes of public private partnerships. Clayton Utz 2013.
13
VAT 3
FINAL
Picture 6: Building blocks for infrastructure investment governance and financing schemes
Regulated Asset Base (RAB) model
The Regulated Asset Base (RAB) -model was initially developed in England and Wales in
order to finance waterworks and has later been used in Great Britain for investments in the
electrical network, as well as railroads. The RAB-model differs from the PPP-model in that
it requires an external party to oversee that the involved companies act in a sustainable way
for the society.
RAB works best for natural monopolies with limited market risk and works particularly well
where there are large investment requirements over time, as the model’s development
demands a significant amount of planning and structuring from a regulatory perspective. 19
19
KPMG, The rise of the regulated asset based model
14
VAT 3
FINAL
Picture 7: RAB Model20
PUBLIC FUNDING/SUBSIDIES
EU’s TEN-T
In the beginning of the 1990’s, the European Union decided to set up an infrastructure policy
at Community level in order to support functioning of the internal market continuous and
efficient networks in the fields of transport, energy and telecommunications. TransEuropean transport networks, TEN-T, was at the beginning merely perceived as a funding
instrument for major projects but it has now grown into a genuine policy. Nowadays two sets
of funding instruments make financial support available to projects implementing the TENT at the EU: the Connecting Europe Facility and the Cohesion fund and the European
Regional Development Fund. The instruments have a timespan of seven years, to
coordinate with the spending program of the EU budget, from 2014 to 2020. The Connecting
Europe Facility (CEF) co-funds TEN-T projects in the EU Member States. The Connecting
Europe Facility regulation sets out the rules for awarding EU financial support, priority
projects and the maximum limits of EU co-financing per type of project. The aim of TEN-T
is to remove bottlenecks, upgrade infrastructure and streamline cross border transport
operations for passengers and businesses throughout the EU.21 The TEN-T program is
discussed further in connection with the second case in this report.
EU investment package
The EU commission recently announced a 300 billion investment package aimed at
encouraging private investors to make infrastructure investments in Europe. The idea is to
create a new fund, European Fund for Strategic Investments (EFSI), with €5 billion coming from the European Investment Bank and an €8 billion guarantee from existing EU funds
designed to secure a contribution of €16 billion in total from the institutions. The €8 billion 20
21
Alternative ways of financing infrastructure investment: Potential for “Novel” Financing Models, s. 32
Infrastructure - TEN-T - Connecting Europe
15
VAT 3
FINAL
guarantee will come over a three-year period from the Connecting Europe Facility
(€3.3 billion);; Europe’s research program Horizon 2020 (€2.7 billion) and so-called “budget margin”, or unused funds, worth €2 billion. The resulting EFSI fund totaling €21 billion is
expected to generate €240 billion for long-term investments and €75 billion for SMEs and mid-cap firms over the period 2015–2017.
The EFSI funds will serve as credit protection for a range of new activities to be carried
through by the European Investment Bank (EIB).These include long-term debt financing for
higher-risk projects, subordinated loans and a variety of equity financing. These longer-term
financing instruments will be targeted at a range of sectors including transport, energy and
the digital economy. Meanwhile, EFSI funding will also go to the European Investment Fund
(EIF), which in turn will provide credit protection for a range of new activities designed to
benefit SMEs. These include new venture capital injections, loan guarantees, securitizations
and seed financing designed to offer micro-loans to SMEs, to fund start-ups or offer midcap companies venture capital. The €21 billion investment will generate a threefold increase in the instruments available for the EIB and EIF to pass on as investments, and these loans
will in turn “allow other investors to join in and produce a further fivefold multiplying effect,” according to explanatory documentation produced by the Commission, accounting for the
total fifteen fold multiplier.22
The package is supposed to be launched in the summer of 2015 and has already been
criticized for being too limited to have any real impact. 23
National level
The Finnish state can support infrastructure investments either directly through including
them in its budget or through national support programs, in which a sum is allocated for
different applicants to apply for. These programs are often designed to improve the
competitiveness of actors who are facing problems for different reasons and are naturally
subject to EU-approval.
As an example, the 60 M innovation support that was used by for example to part-finance
ship orders can be mentioned (e.g. Viking Grace). Another example is the current support
program for ship-owners aimed at meeting the stricter environmental requirements, though
e.g. upgrading their vessels or constructing new ones, which meet the new requirements.
Outlining a model for designing purpose built governance and financing models
Project financing alternatives are dependent on the specific system infrastructure case and
the selected governance structure. One of the barriers in building financing schemes is that
the governance models and the financing are not integrated and innovated as an integrated
model.
Below is a conceptual model for creating optimal governance and financing structures 24:
22
EurActiv. Juncker’s €315bn investment plan unveiled: fifteenfold leverage and solidarity for the south The Economist (29th November 2014). Fiddling while Europe burns.
24 Designing effective governance structures for large projects. Large Project Governance research report 2013.
23
16
VAT 3
FINAL
1. The challenge, opportunities and the contextual factors are analyzed and detected based on
the specific case. Below is an example for a framework for detecting the optimal governance
structure. The different categories in the figure (roles & responsibilities, contracts,…) are detected by analysing the specific case contextual factors and using them as input for the
choices of who will be responsible of what and which type of contracts are used.
17
VAT 3
FINAL
Roles &
Responsibilities
Contracts
Governance
structure
Supply
management
Project type
Turnkey
Turnkey plus
Subcontract
Coordinator
Main supplier
Owner
Consultant
Risk sharing
Suppliers
Owners
Collective
Level of detail
Standard
Detailed
Contract type
Lump sum
Cost plus
Goal alignment
Low
incentives
High
incentives
Safeguards
Network depth
Long
Medium
Limited
Procurement
approach
Competitive
tendering
Framework
agreement
Supplier
selection criteria
Price
Culture
Fractured
Common
Co-creation
Individual
development
Joint
development
Project
escalation
Lawyers solve
Managers
solve
Communication
Need-to-know
based
Open
Target &
method
Results
Processes
Monitoring
party
Main supplier
Owner
Span
Contract
partners
Everything
Collaboration
Monitoring
Split package
Remeasurement
Supplier & product
attributes
Engineers
solve
Consultants
Customer
Picture 8: Framework for selecting the optimal governance structure25
2. Detailed plan of level of involvement of various actors during the life-cycle of the investment.
Analysis of which actors should be involved and in what way during the various phases
(planning, feasibility, execution and operation) of the investments life-cycle.
3. Based on initial governance structures and roles and responsibilities, alternative financing
schemes are developed
4. Engaging the potential actors and refining the financing schemes
5. Proposing a final governance structure and integrated financing scheme
The five steps above are especially suited for larger system infrastructure investments with
a high degree of uncertainty and when it is important to identify and involve the most relevant
actors, who can contribute to the investment through their knowledge and experience. In
that way the incentives and financing shares can be argued, as well as also the length of
involvement of various actors during the life-cycle of the investment
25
Designing effective governance structures for large projects. Large Project Governance research report 2013.
18
VAT 3
FINAL
BENCHMARK
E18 Koskenkylä-Kotka
Background
Developing of E18 expressway was started in the 1990’s. As a member state of the EU,
Finland has committed to develop the E18 expressway as far as to the Russian border by
2020. Yearly investment demand was so high that there were no possibilities to use budget
funding to build the road, why PPP funding was seen as a solution by the state. At the
tendering phase, tender consortium invited current liabilities’ domestic and foreign financiers to tender. Financiers of the project were selected at the end of the tendering phase.
Project scope
The E18 Koskenkylä–Kotka project scope was turning an expressway into a highway from
Koskenkylä to Loviisa (17 km) and constructing a highway from Loviisa to Kotka (36 km).
Six new interchanges were built for the highway: Loviisa east, Ruotsinpyhtää, Ahvenkoski,
Pyhtää, Siltakylä and Heinlahti. In addition, the interchanges of Loviisa west and Sutela were
improved.
Construction started in March 2011. The highway opened for traffic partly already during
2013 and fully in September 2014, slightly ahead of schedule. The road arrangements will
be fully completed by the end of 2015. The contract for maintenance and financing of the
highway extends until 2026.
E18 Koskenkylä–Kotka-highway project is carried out as a life-cycle model, in which the
Finnish Transport Agency is the client and Tieyhtiö Valtatie 7 Oy is the service provider. In
the model the service provider is responsible for the planning, construction, financing as well
as maintenance of the highway until 2026, after which the highway is transferred under the
control of the Finnish Transport Agency. The cost estimate for the project is approximately
340 million euros. The service contract value is approximately 623 million euros.
Tieyhtiö Valtatie 7 Oy is owned by Meridiam Infrastructure (60%), pension insurance
company Ilmarinen (19.9%), Destia Oy (10.05%) and YIT Rakennus Oy (10.05%).
Project funding
Funding of the project consists of two main components: lending and investments of the
road company owners. Lenders EIB and NIB have already previously participated in lifecycle projects in Finland and road projects are part of their typical funding projects. The third
lender, Pohjola Bank, joined in the project through Tieyhtiö VT7. Consortiums that left a
tender during tendering phase had different commercial banks as financier and Pohjola
Bank was a funder in the winning tender.
Finnish Transport Agency has been marketing the project in Finland and in Brussels. One
important component of the project has been that the project has had enough material in
English. At the beginning of the tendering phase, YIT and Destia were initiative. Meridiam
Infrastructure Projects S.à.r.l and pension insurance company Ilmarinen are risk funders
and owners of the Tieyhtiö Valtatie 7. The original tender consortium looked for systematic
19
VAT 3
FINAL
partners for financing the own capital of the road company. The consortium found Meridiam
and Ilmarinen during the tendering phase. Meridiam has several similar project all over the
world and thus it is a well know actor.
Drivers and barriers
According to the project manager, the drivers of the life-cycle model are:
-
Implementation of the project is fast and efficient
Yearly costs of the project are small in relation to the size of the project
Total optimization in building and maintenance because contract period is long and there
are significant sanctions in case of quality deviations
Administration of the project has been outsourced for a long period
PPP model makes possible projects which are not possible to implement with budget
funding.
Barriers of life-cycle model are:
-
It is possible that funding and administration of the project is expensive
Complex agreement model
At the tendering phase of the project, PPP model ties resources of actors
According to the project manager it would be good to know if it was possible to exploit the
state’s opportunities to get less expensive loans in order to finance PPP-projects.
Rantatie Alliance project (Tampere)
Background
The alliance model is widely used in infrastructure projects in Australia. The main benefit of
the alliance model is that all involved parties participate in making the budget, schedules
and plans, and thereby submit their ideas as well as commit to mutual targets, sharing risks
and gains. Instead of working in silos and typically, fighting about who is to blame for costor schedule overruns, all parties work towards a common goal. The philosophy is “We all win or we all lose” and everything is done based on open-book principle. The model enables
deeper interaction, cooperation and creation of trust than traditional customer-supplier
models. The downside is that it can be difficult to change the mindset and way of working
and expectations do not always meet.
The picture below explains the principles of an alliance model.
20
VAT 3
FINAL
Picture 9: Based on railway project implementation plan, cities of Tampere and Turku
Project scope
The Tampere Rantatie alliance project concerns improving Highway 12 between Santalahti
and Naistenlahti; a stretch of 4.2 km. Highway 12 is moved to a new alignment and a tunnel
with total length of approximately 2,300 m is constructed, which will be the longest tunnel in
Finland. The work has begun and the project should be finished in Q4 2017. The aim with
the investment is to make traffic more smooth, reduce environmental hazards and improve
safety.26 Tampere has overall made plans for large investments for a sum of 2.3 billion euros
during 2014–2019, based on the growth estimate of 115 000 new inhabitants by 2040.27
For realizing the Rantatie project, an alliance organization has been created between the
following parties: Tampere city, Finnish Transport Agency, Lemminkäinen Infra Oy, Saanio
& Riekkola Oy and A-Insinöörit Suunnittelu Oy. The highest decision maker of the Alliance
is the Executive team consisting of 8 persons.28 This project is the Finnish Transport
Agency’s second alliance-model in Finland, as the model was piloted in the LielahtiKokemäki railway project with good results29. Several other alliance projects have been
started in Finland after this.30
Project funding and bonus system
Tampere city bears 67% of the costs of the investment and the state, i.e. The Finnish
Transport Agency bears 33%. The city finances the investment partly by income from sales
26
Tampereen uusi rantatunneli toteutetaan allianssimallilla. Liikenneviraston uutiskirje 3/2012.
Kauppalehti, 4.11.2014, page 11
28
Liikennevirasto, Allianssipäivä 30.11.2011
29 Syyskuun Huippuostaja: Liikenneviraston Mauri Mäkiaho. Tekes.
30 Discussion with project manager Mauri Mäkiaho, Finnish Transport Agency, 3.11.2013
27
21
VAT 3
FINAL
of land and other sources and partly though a loan. The service providers (A-Insinöörit
Suunnittelu, Saanio & Riekkola and Lemminkäinen Infra) invoice the city on a monthly basis,
separating costs and possible bonus payments. The gain share/pain share consists of
bonuses and sanctions relating to 1) the target outcome cost 2) key result areas and 3)
major event modifiers. The target outcome cost is 180.299.106 Euros (0% VAT), including
6.5 M € development phase costs. It has been mutually agreed by all alliance parties and includes the direct costs, risk reserves and fees by the service providers. The key result
areas have been set by comparing the minimum required level with the general performance
level of major infrastructure projects, where bonuses are paid for better and sanctions
charger for lower than minimum level performance. The bonus pool is 2% of the target
outcome cost, increasing with achieved lower target price. The maximum sanction is 5% of
target outcome cost. Major event modifiers refers to major disturbances or accidents, which
if they occur will cause 25% loss of pay and 100% loss of bonus. (Rantatunneli alliance
project, project plan).
Drivers and barriers
According to the project manager, the experience so far has been positive. The project is
on schedule and budget and the team is collaborating closely on solving any issues and
ensuring the best result. Over one year was spent on the development phase to ensure
among other things that proper risk analysis was made and that the right team was formed
for implementing the project. The main barrier is posed by complaints by the public regarding
the massive work, as the inhabitants in the area are affected. 6
FINDINGS, DISCUSSION
1. SOKLI - ROUTE TO MARKET
General presentation of logistical lane
The goal of Yara’s Sokli mine project is to exploit the existing phosphorus deposit through
constructing a mine and possibly a concentration plant at Sokli. The main products are
phosphorus and iron ore. At a later stage it is possible to also extract other minerals, such
as niobium. The estimated excavation amount is 4–10 million tons per year and there is
enough phosphorus-rich ore for production over approximately a 20-year period.
Exploitation of the less phosphorus-rich areas would prolong the utilization of the mine with
decades. The plan is to produce 1.5-2 million tons of phosphorus concentrate and 0.3 million
tons of iron ore concentrate a year.31
The picture below illustrates the planned main logistical lane for the transporting the material
to the market.
31
Soklin kaivoshankkeen vaihemaakuntakaava, s. 12
22
VAT 3
FINAL
Picture 10: Logistical lane for Sokli
The location of Sokli presents a challenge and investments are needed in the infrastructure
in order to transport the materials. The Sokli mine is located 12 km from the Russian border
and approximately 90 kilometers from the closest urban area, Savukoski. The closest
railway is at Kellonselkä Salla, which is approximately 110 kilometers away. The Sokli mine
is located between the Urho Kekkonen national park and the Värriö natural park32 and the
Natura areas of Yli-Nuortti, Ainijärvi and Törmäoja can be found can be found close-by to
the mine. 33
There is a 90 km long road connection to Sokli from Savukoski (road 9671) but the
connection between Martti–Sokli needs improvement due to the traffic caused by
construction and opening of the mine. The amount of traffic will be approximately 110 trucks
per day after opening of the mine. The railway is planned to be one-track, non-electrified,
radio-controlled and with access control. 34
Four different alternatives have been investigated and are illustrated in the picture below:
VE 1 Kelloselkä – Sokli, 104 km
VE 2 Kemijärvi – Pelkosenniemi – Savukoski – Sokli, 166 km
VE 3 Kelloselkä – Naruskajärvi – Sokli, 103 km
VE 4 Kelloselkä – Savukoski – Sokli, 135 km
32
Soklin kaivoshankkeen vaihemaakuntakaava, s. 9
Soklin kaivoshankkeen vaihemaakuntakaava, s. 68
34 www.sokli.fi
33
23
VAT 3
FINAL
Picture 11: Alternative routes for Sokli35
Alternatives 1, 3 and 4 demand an improvement of the existing railway between Kemijärvi
and Kelloselkä, in terms of strengthening the railway structures and vertical alignment.
At least two traffic places are planned for the railway: a loading place in Sokli and a meeting
place for the trains in the new railway part. Service roads will be constructed, as well as
interchanges for the roads with the most traffic.
The Ministry of the Environment accepted the regional stage plan for East Lapland, which
supports alternative VE 1.36 This alternative also supports the implementation of the Barents’ international traffic corridor, presented for the Kemijärvi–Kelloselkä route in Lapland’s regional plan.37
Material flows of the logistical lane
Construction of a railway to and from Sokli is favored by the large amount of concentrated
products that need be transported from the mine. After the first year of mine operation, the
transported amounts are estimated to 1.5–2 million tons per year, which means 2–4 train
35
Soklin vaihtoehdot. 18.1.2014. Finnish Transport Agency
www.sokli.fi
37 Soklin kaivoshankkeen vaihemaakuntakaava, s. 88
36
24
VAT 3
FINAL
pairs daily. 38 It is not realistic to transport such an amount by road, as it would mean
approximately 110 trucks per day in both directions.
Involved parties and stakeholders in the logistical lane
Besides the company responsible for the mine, public railroad company and the Finnish
Transport agency, there are several other stakeholders in the logistical lane. The products
are planned to be shipped through either the port of Kemi, Oulu, Raahe or Kokkola. The
needed port investments are unclear as the ports are reluctant to convey information as they
see each other as competitors, but in the case of Kemi, they would need to build another
quay at a cost of approximately 6 M euros. All ports would need to invest in silos, expected
to cost 2–4 M euros and conveyors at around 1-2 M euros.
A ship-owner/ship-owners are needed to handle the shipments to Norway. Ships in the size
of max. 15 000 tons are needed. At the other end, the ports of Porsgrunn (Grenland havn)
and Glomfjord (Halsa havn) as well as port operators are involved. It is assumed that no
investments are needed in these ports.
In addition to the parties with a direct connection with the logistical lane, there are a number
of other stakeholders who are directly or indirectly influenced by the investment and who
needed to be heard when the regional plan was made. To illustrate the complexity of such
projects, they are listed below:
Land owners: The Forest and Park Service (Metsähallitus), private land owners, real estate units
involved in land division proceedings, joint forests and other land owners for the regional stage planand bordering areas.
Those, whose living-, working- or other conditions are influenced by the logistic route: residents,
tenants, companies and their employees, institutions and their users and employees, owners and
users of water areas.
Authorities: Lapland’s union, Ministry of Employment and the Economy, Radiation and Nuclear Safety Authority (STUK), the Finnish Transport Agency, The Geological Survey of Finland (GTK), Fingrid,
Lapland county administrative board, Lapland’s forestry center, Lapland’s Boarder Guard, Lapland’s Provincial Museum, Lapland’s Rescue department, Lapland’s TE Office, Environment Center of Lapland, The Forest and Park Service/natural heritage services, National Board of Antiquities, Tornio
customs, Military Province of Northern Finland, as well as other authorities belonging to the regionaland central administration.
Communities influenced by the logistical route: Lapland’s’ Nature Conservation district, the Nature Conservation association of Savukoski, the areas’ reindeer grazing association, labor unions,
business associations, forestry associations, museums and local history societies, Savukoski regional
office of Finnish Wildlife Agency, energy companies, waste management companies, fishing area of
Ylikemi, Urho Kekkonen national park, Värriö research station, Lapland border guard district, the
village association of Martti, Savukoski business federation, Salla communities, Birdlife regional office
and Lapland’s traditional building association. 39
Market needs and competitive situation
The world’s population is estimated to grow by 40% by 2050, totaling 9.2 billion persons. The need for food will double by 2050 and food production is estimated to rise by 50%
already by 2030. At the same time the land area per person for growing food will decrease.
Making farming more efficient through using fertilizers is presented as a solution to the
increasing need for food. The effect of fertilizers on improving the crops is based on 3 main
38
39
Rataverkon tavaraliikenne-ennuste 2030, s.30
Soklin kaivoshankkeen vaihemaakuntakaava, s. 67
25
VAT 3
FINAL
nutrients: nitrogen, phosphorus and potassium and using them in an optimized and
balanced way. Yara is a leading producer of nitrogen fertilizers and has made a strategic
decision to expand also into basic production of phosphorus and potassium. As stated
before, the Sokli mine can in the initial phase produce 1.5 million tons of concentrate per
year and is estimated to produce phosphorous-rich ore for 20 years and less phosphorousrich ore for an even longer time period.
Drivers and barriers
The main driver for the mine is presented in the previous chapter, i.e. the increasing need
for fertilizers and the discovered resources at Sokli. Phosphor is necessary for all life and is
one of the most important fertilizers. Its production is estimated to reach its peak by 2035
and the present mines are estimated to be emptied in 50–100 years40. Other drivers are the
effects on employment; according to calculations made by Ruralia-institute and published in
2010, the Sokli project will employ up to 7000 persons full-time equivalent by the end of the
investment and approximately 700 till the end of 2020. The effects would be most visible in
Lapland, and e.g. the tax income of Savukoski were by Ruralia-institute calculated to
increase by 7 M euros during 2011–2020 due to the mining activities.41
Barriers to the mine development are formed by environmental-safety issues. The Ministry
of the Environment’s stress test shows that water management is the main development area for the mines42. Also the long permit processes, planned taxes and the price
development of the raw materials need to be considered, as it is not lucrative to excavate
mines with low-content material when prices are low. The potential mine tax has been
discussed but a suitable model has not yet been found. It would bring a steady income to
the state, but could jeopardize utilization of mines with low-content material.43
The bad-will caused by Talvivaara can also be considering a barrier, in terms of the natural
disasters that have occurred and their impact on the public opinion. There were high hopes
for the mine, but the expectations were not realized due to, among other things, a decrease
in mineral prices and the gypsum pond leakage causing the company damages worth 23
million euros44, finally leading to filing for bankruptcy. For comparison purposes, it can be
mentioned that a 24 km track was constructed between Murtomäki and Talvivaara.
Talvivaara paid the costs initially and the state paid it back after two years of the
investment45.
Preliminary investment costs
There are lengths of information on the investment needs for the route from Sokli to harbor,
as this investment case has been active for years. The biggest investment need is the road
/ railroad transportation between mine and harbor, but also some investments in the harbor
40
Cordell, D., Drangert, J-O., White, S. The story of phosphorus: Global food security and food for thought. Global
Environmental Change 19 (2009) 292-305.
41 Laasanen, J. Soklin kaivoksen vaikutukset Savukosken kuntaan. s. 9.
42 Ympäristöministeriö. Stressitesti löysi kehittämistä kaivosten vesien hallinnassa – viranomaisten tehostettava
yhteistyötä.
43 Taloussanomat: Kaivosverosta tilattiin selvitys – minne se katosi? 3.10.2013
44 Talvivaaran kaivosyhtiön toimintakertomus 31.12.2012 päättyneeltä tilikaudelta. s. 3.
45
YLE Uutiset: Talvivaaran rata siirtyi valtiolle. 2.9.2011.
ja Valtion talousarvioesitys 2007
26
VAT 3
FINAL
are needed. The needed railroad investments are according to information by Ministry of
Transportations and Communications (2014 cost level):
-
Kemijärvi – Kelloselkä track improvements 120 M€
Kelloselkä – Sokli track construction 260 M€
In order to enable the construction of the mine, the road 9671 from Martti to Sokli needs
improvement. When the mine starts operation, the road will be used for transporting
chemicals, fuels and other material needed at the mine. The cost estimate for this is 35
million Euros.46
No exact port investment information is available, but the proportion of the port investment
is small in relation to the land transport infrastructure and it is assumed that it will not present
a barrier, as long as the mine and land logistic part is proceeding. Who will fund the port
investments is unclear, as it is decided very much case by case. Sometimes it is the port,
sometimes the port operator and sometimes the client. At least construction of 20 000 ton
storage facilities is needed.
For the sea transport, there is a need for two ships with maximum 15 000 ton capacity, which
are available in the market and the assumption is that no new ship investments are needed.
Alternative financing models; innovation, incentives and financers
The currently discussed financing alternative is a more traditional model, where Yara and
the Finnish state would share the investment costs for the land route, where the Finnish
state would fund the improvements in the current railroad between Kemi and Kemijärvi and
a 50/50 split of costs between the state and Yara for the new railroad would take place. The
challenge with this financing model is that the Finnish state need to invest close to 300M€ as capital cost to start the project.
Development of the Sokli mine can be done in many different ways. There may be different
actors involved, and the following is an attempt to present a number of alternatives, some
more realistic than others. The presentation can be seen as a way to put many different
options on the table, so that decision-makers can start the discussion around these.
We would like to present an alternative financing model built on a PPP model, where both
alternative investors, contractors, operators and some other benefiting parties of the
logistical system are invited to participate in the project. Considering the phosphate mining
and logistics system as a whole, means that the Sokli mine is not only the interest of the
mine owners, Yara, and local and national Finnish government. It is also in the interest of
the firms that will build the mining and logistics infrastructure, the firms that will operate it,
and the firms that will provide financing for it. Naturally, Yara, the Finnish government, and
citizens are the most important actors, but the actors involved in the whole system can
contribute to facilitate its development in many ways. There are numerous ways in which
creative thinking can be applied.
46
Kauppalehti 31.8.2014. Soklin tieraha oli 35 miljoonaa euroa.
27
VAT 3
FINAL
Financing:
o Private-Public partnership under the leadership of Yara, the State, and
investors. The composition of the partnership may differ over time, so that Yara
and the state are more heavily involved in construction of the phosphate
mining logistics infrastructure, after which operators and investors may take
over. Alternatively the state initiates a fund inviting institutional investors to
participate and thereby taking equity for a minority share.
o Funds are long term investors that can invest in operations with long term
outlook. Examples are Finnish pension funds, international pension funds, and
sovereign wealth funds.
o Bonds can be used for financing. The market for corporate bonds has
increased very much, and can be a way to finance parts of the Phosphate
mining logistics infrastructure.
Governance:
o Private-public partnerships provide an array of governance models that can
be applied for consortia that build and operate. An essential part is the use of
profit sharing between the actors involved, because it will prevent that one
actor reaps excessive demands, and others incur losses.
o Consortia agreements, such as the practice of open book accounting can be
applied.
Construction:
o Rail transport, for transporting phosphate could be done in innovative ways so
that it simplifies loading at the mine, and offloading to ships. Cooperation
between rail cargo makers, the mine, and shipbuilders can generate
innovative solutions that benefit the ecosystem.
o Conveyor belts, can be used for part or the entire transportation of phosphates.
o Road trains, consisting of trucks that are close together, and managed
automatically from the first driver. A truck maker, such as Scania have made
such technology, and could apply it to the Sokli mining logistics system. The
road trains will require innovation in road construction.
o Short-sea shipping is strong area in Finland, and the volume of phosphate
shipping opens for innovations in short sea shipping.
The proposed alternative model is to invite the beneficiaries of the railroad investment to
make equity investments into a PPP company, called e.g. Phosphate Logistics. In addition
to Yara, also the forest companies can utilize the railroad and users. VR track could
participate in building the railroad track, and VR Transpoint can be contracted for handling
the rail transport service. In addition, also some of the East Lapland municipalities could
participate to some extent in the PPP Company, as both the construction, operation and the
whole Sokli mine project will provide new jobs and tax income to these municipalities. This
idea is presented in the picture below.
28
VAT 3
FINAL
Picture 12: PPP model for Sokli case
Preliminary NPV - calculation, logistics system PPP
Revenues for the logistics system:
Yara will pay for the logistics service, both on land, in harbor and at sea. The land logistics
are estimated to be over 30M€ for truck transportation and 15M€ for rail transportation on annual basis. The sea transport is estimated to be between 18M€ - 22M€, depending on the volumes transported to Porsgrunn and Glomfjord, now using an estimate that 70% of the
1,5M ton phosphate is transported to Porsgrunn and 30% to Glomfjord.
The Finnish state has estimated to get return of own investment mainly through taxes.
Two alternatives to the PPP Company are presented in the NPV calculation below, one
alternative having the responsibility of the land logistics with an annual turnover of around
20M€ and one having responsibility of both land and sea logistics with a turnover of over
40M€. For the land logistics company we use as example an investment of 40M€ and for
the land and sea logistics alternative, we use an investment of 80M€, which will lower the capital investment by the state and take in other financiers to participate in the capital
investment.
29
VAT 3
FINAL
Picture 13: Net present value for alternative to have a PPP for the phosphate logistics
In both cases it is assumed that there will be a steady need for transporting phosphate over
the planned 20 years and in both cases the NPV calculation shows a positive cash flow
result after around 15 years into the project. This is a long term investment with a return rate
between 6-8% that can be considered acceptable, taking into account that the risks for
deteriorating revenues are small, when the logistical system is up and running.
2. Ro-Ro container shuttle, Helsinki – Tallinna
The European Commission actively promotes short sea shipping. Short sea shipping is
highly efficient in terms of environmental performance and energy efficiency. 47 The white
paper on transport from the European commission emphasizes the role of shipping in cargo
transportation and the need to shift larger volumes of cargo from land-based infrastructure
to sea.48
Short sea shuttles require ports with functional inland connections, fixed schedules, and
high reliability and departure frequency. For the shuttles, punctuality and frequency are
essential factors, as shuttles allow a transfer of more time-sensitive cargo from land
transport to sea. Short sea shuttles require also high enough cargo flows between ports. 49
It has been predicted in different surveys that cargo traffic between Tallinn and Helsinki will
further increase after the sulphur directive has entered into force in the beginning of 2015,
as an alternative to the route through Sweden. The current passenger traffic is directed to
the city centers, which is not optimal for cargo. Hence the assumption is that there will be a
need for a daily shuttle service concentrating on cargo, directed to the ports outside the city
center with good onwards connections.
47
European Commission. Maritime: Short Sea Shipping.
European Commission. White paper: Roadmap to a Single European Transport Area – Towards a competitive and
resource efficient transport system. COM(2011) 144 Final. 2011. s. 9.
49 Development of the Short Sea Shuttle Concept, s. 3
48
30
VAT 3
FINAL
General presentation of logistical lane
On the Finnish side there are three possible ports for a Ro-Ro Container Shuttle: Hanko,
Helsinki and HaminaKotka. In Estonia possible ports are Tallinn, and mainly the Paldiski
and Muuga ports belonging to the Tallinn port. Based on their existing facilities, location and
EU initiatives enabling support, the main alternatives are Vuosaari port in Helsinki and
Muuga port in Tallinn. The financing scenario is built on the route from Vuosaari to Muuga.
The connection between Helsinki and Tallinn is approximately 80 kilometers i.e. 44 nautical
miles (nm). The Gulf of Finland is one of the heaviest operated sea areas in Europe. There
are three sea routes to Helsinki: 11 meters draught to port of Länsi-Satama, 9.6 meters
draught to port of Etelä-Satama and 11 meters draught to port of Vuosaari. The sea routes
to Helsinki are long: they start from the open sea and run through the archipelago. For
example the sea route to the port of Vuosaari is 17.2 nm long. The sea route to the port of
Tallinn is short and deep (10.8 m).
The picture below illustrates the main actors of the logistical chain.
Picture 14: Ro-Ro-Container Shuttle logistical lane
TEN-T
Finland has two TEN-T Core Network Corridors crossing the country: North Sea – Baltic and
Scandinavian – Mediterranean Corridors. Estonia has one: the North Sea – Baltic Corridor.
The North Sea-Baltic Corridor stretches from the North Sea ports Antwerp, Rotterdam,
Amsterdam, Bremen and Hamburg through Poland to the Belarus border and to the Baltic
countries' ports Klaipeda, Ventspils, Riga and Tallinn, as well as to Helsinki. The key project
is "Rail Baltic(a)", a railway between north-eastern Poland, Kaunas, Riga and Tallinn
(described more in detail below). Sea traffic between Helsinki and Tallinn is part of TEN-T
North Sea – Baltic Sea Corridor and thus it is possible to apply EU co-financing for
developing functions of the corridor. TEN-T co-financing is granted for developing port
interconnections, (further) development of multimodal platforms and their interconnections,
icebreaking capacity and the Motorways of the Seas.50 Core networks receive 85% of
distributed TEN-T financing.51
50
51
European Commission. Infrastructure - TEN-T - Connecting Europe.
Discussion with Director General Kari Ruohonen, Finnish Transport Agency, on 10.10.2014
31
VAT 3
FINAL
Twin port project
As part of the TEN-T program, the Port of Helsinki and the Port of Tallinn are developing
port operations with primary emphasis on cargo traffic. The Twin-Port project focuses on the
development and harmonization of operations at the West Harbour in Helsinki and the Old
City Harbour in Tallinn. The idea is to increase capacity and develop the use of automation
and new technology. The budget for the project for 2012–2015 is 42.7 M EUR for the Port
of Helsinki, 13.1 M EUR for the Port of Tallinn and 0.5 M EUR for indirect costs. EU’s share of this is 20% of the total costs. 52
Rail Baltica
In order to make the Ro-Ro-Container Shuttle from Southern Finland through the Baltic
countries to Central Europe efficient, there is a need to have functional land connections in
addition to efficient sea connection. European Union has planned a railway network, Rail
Baltica, through Baltic countries to Warsaw in Poland with further connections to Germany
(see map below).
Picture 15: Rail Baltica53
Constructing of the railway network is partly in implementation stage. In 2008 it was
estimated that the total costs of Rail Baltica will be 3.2 billion Euros. Rail Baltica should be
fully in use in 2020. By 2030, it will remove bottlenecks, upgrade infrastructure and
streamline cross border transport operations for passengers and businesses throughout the
EU. Its implementation will be pushed ahead by the setting up of 9 major transport corridors
that will bring together Member States and stakeholders and will allow to concentrate tight
resources and to achieve results.
Tunnel option
The idea of constructing a tunnel between Helsinki and Tallinn was presented already in the
1990’s, as an extension of the Rail Baltica. Several studies have been conducted on the
52
53
Port of Helsinki’s development projects Ministry of Transport and Communication of the Republic of Latvia
32
VAT 3
FINAL
subject and the matter has been fiercely debated. Two undersea railway tunnel alternatives
have been presented, both of which links with the Muuga coastal railway on the Narva main
road in Maardu, Estonia. On the Finnish side, two options have been presented: the
Porkkala track and the Pasila track option. The lengths of the tunnel are 58 respectively 73
kilometers.54 The investment is according to a feasibility study by Anttikoski in 2007
estimated to be between 2.3–2.7 billion euros.55
Material flows of the logistical lane
The amount of cargo which is transported between Finland and Estonia shows a significant
increase (average 10% yearly), while the trade between the two countries is quite steady,
showing that this route is increasingly used for Finnish foreign trade56. However, most of the
cargo transport is by trailers as they are a more cost-efficient option to containers. In general,
industrial goods are transported from Finland and consumer goods to Finland. The import
of building materials and food supplies to Finland shows an increase. There are also an
increasing number of Finnish companies using Estonia for subcontracting and subassembly,
which means that goods, e.g. metals and laundry, travel back and forth between the
countries.57
In 2013, around 8300 containers, i.e. 14,500 TEUs were transported between Finland and
Tallinn. Of these, approximately 3,700 containers (6,800 TEU’s) were carrying goods and the rest were transported empty. The share of imports was approximately 5,000 containers,
i.e. 8,300 TEUs. Most of the traffic was directed to Hanko (4,400 containers / 7,700 TEU)
and Helsinki (2,400 containers / 4,600 TEU).58
Overall, the amount of container traffic from Finland in 2013 was 738,426 TEU and to
Finland 733,676. Most of the container traffic is handled by HaminaKotka port today, i.e.
310,100 TEU exports and 310,981 TEU imports. The main receiving ports are Hamburg,
Bremerhaven and Rotterdam (75%), whereas the main ports of dispatch are Hamburg,
Gdynia and St. Petersburg (close to 60%).59
A prerequisite for the proposed shuttle is that parts of the present flows would move to the
Helsinki-Tallinn route and be further transported by Rail Baltic to Eastern Europe and even
Turkey. These would most probably come from the Northern part of Finland by rail, as it is
unlikely that the container traffic from HaminaKotka would be transferred to this route. To or
from the ports of Hanko, Kemi, Oulu, Pori, Raahe and Rauma total 8,800 containers are
transported to or the direction suitable for this route.60 Another development, which may
mean increasing material flows, is the containerization of bulk materials. Assuming that 20%
of current bulk flows would be moved from bulk carriers to containers, it would mean
approximately two million tons more to transport.61
54
Ikävalko, Vähäaho, Suuroja: Soil and bedrock conditions to be expected in Tallinn-Helsinki tunnel construction. Paper
presented at Strait Crossings, Bergen Norway, June 2013.
55 http://baltirail.wordpress.com/kirjoituksia/anttikoski-usko/
56 Sundberg, Posti, Tapaninen: Cargo traffic on the Helsinki-Tallinn route. Publications from the Centre for Maritime
Studies. University of Turku. A 56. 2011
57 Tapaninen, Sundberg, Posti: Short Sea Shipping in the Gulf of Finland- case Helsinki-Tallinn. Short Sea Shipping 2012.
58 Statistics from Martina-database
59
Statistics from Martina-database
60 Statistics from Martina-database
61 Statistics from Martina-database (2013)
33
VAT 3
FINAL
Involved parties and stakeholders in the logistical lane
The main parties and stakeholders of the logistical lane are:
-
Feeder operator
Ports at both sides of the Gulf of Finland
Companies producing terminal and terminal services
Carriers such as DHL, DSV
Railway companies
Infrastructure suppliers
Customers
Paldiski South Harbour is the second cargo port of Tallinn port and is located 45 km west of
Tallinn. Muuga harbor, which is located 17 km east of Tallinn is the main cargo port which
handles around 80% of the total cargo volume of the port in Tallinn. Muuga is amongst the
deepest (up to 18 m) and most modern ports in the Baltic Sea region and has great
expansion possibilities. Muuga handles 90% of the transit cargo through Estonia and is
therefore a free port. 62
The following companies at present have weekly container traffic to and from Estonia, which
goes via Finland63:
Operator:
Route:
MSC
Muuga – Kotka – Hamina – Helsinki (Vuosaari) – Antwerpen – Mon,
Bremerhaven – Muuga
Tue
Tschudi Lines
Sea Finbest
Unifeeder
Service
Arrival: Representative:
Baltic Muuga – Helsinki – Klaipeda-Esbjerg – Immingham – Tue
Rotterdam – Helsinki (Vuosaari) – Muuga
Container Muuga – Bremerhaven – Hamburg – Helsinki (Vuosaari) – Thu
Muuga
X-Press Container Line Muuga – Rotterdam – Kotka – Helsinki – Muuga
Fri
MSC Eesti AS
Tschudi
AS
Logistics
Pirita Marine OÜ
Approve OÜ
Table 1: Regular container lines calling at Tallinn and Helsinki
In Helsinki, the Vuosaari port is specialized in container and Ro-Ro-traffic. The connections
to Vuosaari are good both by road and rail. 64 Vuosaari would be the natural choice for the
container shuttle, as the other terminals are more concentrated of the passenger flows.
There is also Memorandum of Understanding signed by the ports of Helsinki and Tallinn in
May 2014 regarding developing a relevant cargo route between Vuosaari and Muuga,
related to the TEN-T program and TWIN PORT project discussed earlier.65
Market needs and competitive situation
Nowadays there are already good connections between Southern Finland and Estonia.
Three shipping companies offer daily service for wheeled cargo between Helsinki and
Tallinn, besides carrying passengers. Currently cargo is mainly transported by trucks and
62
http://www.portoftallinn.com/muuga-harbour
http://www.portoftallinn.com/regular-cargo-lines
64
http://www.portofhelsinki.fi/tavaraliikenne/vuosaaren_satama
65 http://port-of-helsinki-com.mynewsdesk.com/news/ports-of-helsinki-and-tallinn-sign-a-mou-on-traffic-developmentbetween-vuosaari-and-muuga-harbours-84665
63
34
VAT 3
FINAL
trailers, as they are more cost-efficient than containers, which take long to load by crane.
There is also some container traffic between Hanko and Paldiski, where Navirail offers a 6
days/week ropax service and Transfennica a Ro-Ro/storo service twice a week. In addition,
there are weekly container services calling at Finnish and Estonian ports, among others (see
table above). However, it may prove worthwhile to concentrate container traffic to a certain
port and type of vessel, enabling more efficient container handling through e.g. automation
and better information management systems. As a result, containerized cargo could be
transported faster and cheaper than today, while the current shipping lines could focus on
developing the passenger and trailer traffic.
At the time of writing this report, there is an on-going project named ”Developing short sea RO-RO shipping transportation chains at Helsinki-Tallinn route” (L-RORO), regarding
designing a container shuttle concept. The project should be finalized early 2015 and the
involved parties are the ports of Helsinki and Tallinn, the University of Lappeenranta, and
some companies including shipowners. Different alternatives regarding the vessel and type
of loading are being studied (e.g. conro, mafi, automation).66
Drivers and barriers
The increasing amount of materials transported in containers, even raw materials, can be
seen as a driver for the short sea shuttle traffic. Lots are getting smaller and the delivery
times can be quite short, hence having a vessel with non-stop traffic and sharing cargo
space between many customers is beneficial. The existing vessels are often full and with
the anticipated increasing amount of cargo being directed to the Helsinki-Tallinn route, more
capacity is needed. There is also a need to separate the passenger and cargo traffic more
in the future to reduce the traffic in the city centers. This would also enable slow steaming
of the cargo vessels, as there would be less schedule pressure.
The closeness of the countries and current differences in price level favors collaboration
regarding e.g. services, which has led to companies looking to combine Helsinki and Tallinn
in their service offering. Another driver is the development of Gdansk as a container hub,
which would favor using this route in combination with the Rail Baltica.67
A Ro-Ro Container Shuttle could offers a fast and reliable logistics lane for container
transport and respond to the European Union’s definitions of policy to shift road freight over 300 kilometers to sea and railways. It has been estimated that SECA and new regulations
will increase shipping costs in Baltic Sea countries. Thus the Ro-Ro Container Shuttle could
be a possible way to influence transport costs in Finland. However, it is essential that
hinterland connections from ports are supporting feeder system and the port services are
efficient.
Start-up risk and high costs in port are the weaknesses of Ro-Ro-Container Shuttle between
Southern Finland and Estonia. Also reaching critical volumes for profitability might become
a barrier for the route.
Preliminary investment costs
An optimal size for a vessel used in Ro-Ro Container short sea shuttle is between 350 and
1,000 TEU considering required vessel capacity utilisation, frequency and expected cargo
66
67
Discussion with Managing Director of Helsinki port, Kimmo Mäki, 17.11.2014
Tapaninen, Sundberg, Posti: Short Sea Shipping in the Gulf of Finland- case Helsinki-Tallinn. Short Sea Shipping 2012.
35
VAT 3
FINAL
volumes.68 These size container ships are called feeders and they often find their niche
market by offering a high service level. Price for small, traditional feeder of 1,100 TEU has
lately been approximately 12–16 million Euros69. In the calculations the, the feeder
investment of 14M€ is used.
Introducing a shuttle service would also mean investments in the port, in terms of making
the loading and discharging as fast as possible through increasing automation and investing
in needed equipment. However, according to the managing director of the Helsinki port
these would not be substantial, apart from automation which would cost 1–2 million euros.
Also Muuga has the capability to handle this traffic.70
Alternative financing models; innovation, incentives and financers
The traditional way to finance this project would be for the shipping company who will be
responsible for the route to order a vessel based on a bank loan, whereas the port
investment would be taken care of mainly by the port operator.
However, there are other parties who benefit from this and who could be involved, such as
the railroads in Finland and the Baltic countries, who will get a substantial volume increase
as a consequence. The involved ports will benefit from the increased material flows. The
supplier of the port automation system will benefit. Also the companies whose material flows
are handled through using this route are stakeholders in this picture and could invest in
creating the system, which would in turn allow them to reduce their logistical costs.
An innovative alternative model is forming a consortium, consisting of the shipping company,
ship design company, Muuga and Vuosaari ports, VR and Rail Baltica, Cargotec and a
number of exporting/importing companies, who would develop the concept together, with
the aim to reduce the cost of transportation per container with 50%. An incentive scheme
based on target cost would be set up for the parties to commit to. The involved companies
would commit to certain material flows (x amount of containers/annum) for a 5-year period.
Preliminary NPV-calculation
Assumptions made for the preliminary NPV-calculation
Capex = 14 M€ for a feeder and 2M€ for port automation
WACC = 8%, 20 year investment
Revenue: current cost for shipping a container is around 780€, and in the calculations, the cost of shipping is estimated to be 400€, with a more cost efficient solution and increased volumes, as needed in order for container shipment to be competitive in comparison to trailer
possibility.
Opex = based on conventional ship-operator earning logic for a container route, which is 80%
of the revenue / annum.
Scenarios presented:
Scenario 1 is built on assumptions that 10% of the trailer transport is transferred to this route,
and an annual level of 15 000 containers is reached.
68
Styhre, L. et al. Development of the Short Sea Shuttle Concept, s. 17.
ICAP Shipping. Container Market Report.
70 Discussion with Managing Director of Helsinki port, Kimmo Mäki, 17.11.2014
69
36
VAT 3
FINAL
Scenario 2 is built on assumptions that 15% of the trailer transport is transferred to this route,
and an annual level of 21 000 containers is reached.
Scenario 3 is built on assumptions that 10% of the trailer transport is transferred to this route,
and an annual level of 27 000 containers is reached.
In each scenario, an annual growth rate of 5% (increase in cost of shipping and increase in
volumes) is used, which can be considered modest as the current growth rates are around
10%.
Picture 16: Net Present Value for Ro-Ro container shuttle for different scenarios
The net present calculation clearly shows that there is a possibility to make the Ro-Ro shuttle
route a successful investment, but it requires volumes from trailers to containers, which is
possible when considering the competitive price of shipment with the new innovative
logistics solutions. However, the capital investment need is not that high, that it would require
a PPP or other lifecycle model, and thus it could be handled by a traditional financing
alternative.
3. Short sea coaster system
The third case concerns short sea coaster traffic for transporting general cargo (dry bulk,
project cargo and containers) on the Baltic Sea.
Short sea shipping is by the EU defined as “The movement of cargo and passengers by sea between ports that does not involve an ocean crossing”. It currently accounts for almost 40% of all cargo moved in Europe and shows growing volumes.
37
VAT 3
FINAL
General presentation of logistical lane
In this case the logistical lane is not fixed, but varies depending on the transported cargo.
However, the idea is that the same ports are called at regularly.
The scenario is built on a route where the vessels will visit some main bulk ports in Finland,
such as Kokkola, but also Poland, Sweden, Denmark, Germany, the Baltic countries and
Russia. The exact routes need to be specified based on the industrial companies’ needs. Material flows of the logistical lane
This case builds on the idea of constructing new vessels and combining material flows of
several companies. The bulk transported on the Baltic Sea consists of e.g. wood products,
chemical products such as fertilizers, metal products such as scrap and food products such
as grain. There are some limitations regarding which cargos can be combined, but normally
a proper washing of the cargo space between different cargos is sufficient. In 2013, total
19,172 thousand tons of dry bulk cargo was exported between the Baltic Sea countries. The
largest import flows at the Baltic Sea area were to Denmark, Finland and to Baltic Sea ports
in Sweden. The largest export flows were from Latvia, Denmark and Poland.
Based on a market study within REBUS-research program P271, the lot sizes of the industrial
companies vary significantly, the average size being 3,000 tons. The optimal size vessel for
this traffic would be maximum 7,000 tons. The vessels would need a flexible cargo hold to
enable transportation of different materials for different customers, e.g. through flexible bulk
heads separating the cargo space. This lane would be appropriate for material flows for
which the fast delivery time is not crucial and which are quite predictable, as it would mean
planning well in advance and coordinating the flows to achieve an optimal combination. Also
the vessels would apply slow steaming in order to save bunker cost, which means that the
crossings would take more time than normally.
Involved parties and stakeholders in the logistical lane
The stakeholders in this logistical lane are the shipping company, the industrial customers,
the ports and port operators, railway companies and the road transport companies, as
presented below. The ports may vary depending on the material flows at hand.
71
FIMECC REBUS P2, market study 2014
38
VAT 3
FINAL
Picture 17: Logistical chain for short sea coaster
Regarding the new vessel design, main system suppliers should be involved in the design
of the vessel in order to optimize its performance, e.g. regarding fuel consumption and cargo
handling. The fuel would be LNG, so there is also a need for investing in bunkering terminals
or bunkering vessels. Also for the road transport, we suggest applying LBG or LNG as
bunker, as it is according to PBI’s studies more cost-efficient than diesel in larger
consumption volumes.72. Usage of biogas will not only help the road transport companies
save fuel costs but will also reduce emissions and provide a more environmental-friendly
brand for them.
Market needs and competitive situation
There are both local and foreign ship-owners who have vessel traffic in the area and who
the industry currently uses, but there is a need for a new type of vessel enabling a larger
flexibility, meaning that a combination of different cargos is possible as well as usage of
LNG and/or biogas as fuels to meet the new environmental regulations.
Based on initial calculations on the material flows and taking into account the need for
renewal of fleet, there is a need for between 10 and 15 new vessels to be taken into
operation before 2020.73 The exact market needs are clarified together with the industry
during spring 2015.
Drivers and barriers
Due to the SECA restrictions taking effect in 2015, there is a need for new vessels that meet
the requirements and contribute to optimizing the traffic on the Baltic Sea. There is also a
need to move traffic from road to sea or rail in order to reduce pollution.
As in the previous case, the exporting and importing companies are facing smaller lots and
an imbalance in exports and imports, meaning that they in most cases cannot efficiently
employ a vessel for traffic both ways and would benefit from joint transportations with other
companies. For the same reasons, the trend is from chartering vessels towards spot
deliveries and Contracts of Affreightment. Combining freights would mean a better utilization
rate of the vessels and a better price for the end customer. The main barriers for combining
freights are that the timetables and ports of discharge are not always compatible. There is
72
73
PBI study done in collaboration with biogas producers and transportation companies 2014-2015
Assumptions made based on calculations regarding market needs made in REBUS research projects.
39
VAT 3
FINAL
also some skepticism from the industry regarding how to share costs and benefits and there
is reluctance to share information because of fear that someone else would benefit from it. 74
Other barriers are the complex documentation and administrative procedures in the ports,
as the usage of electronic data interchange systems is underdeveloped.75
Preliminary investment costs
The optimal size vessel for the above purpose is estimated to be maximum 7,000 tons. The
vessel would need a flexible cargo hold to enable transportation of different materials for
different customers, e.g. through flexible bulk heads separating the cargo space. The
investment cost per vessel is estimated around 12M€ to 15M€ depending on size and technology level. For 10 vessels the capex investment need is around 120M€, which is used
in this report for calculating the business case. This investment can be arranged by the
industry together with ship-owners and suppliers.
Looking at the total investment from a system perspective, additional investments are
needed in developing the LNG/LBG bunkering infrastructure and most probably also in the
involved ports for developing the loading, offloading, storage and rail connections. From a
system perspective there are no detailed calculations on investment costs, but it is clear that
there is a need to include state funding.
The discussion regarding constructing an LNG terminal in South Finland or Estonia appears
to have been brought to a solution containing placing the main Gasum terminal in Inkoo
(Porvoo still remains as an alternative) and a smaller one in Paldiski (by Estonian Alexela).
The Inkoo terminal is planned to be 160 000 cubic metres and the whole investment
including the gas pipeline is estimated to be ready in 2020 to a cost of min. 500 million euros,
of which EU would subsidy approximately 20%.76 However, the figures presented in the
press vary somewhat, the exact sum from EU is unclear and the rest of the financing still
seems to be open.
In addition to this, an LNG terminal is planned in Tornio by Manga LNG Oy, a company
formed by Outokumpu, SSAB, Gasum and EPV Energia. Also in Pori Skangass Oy is
constructing an LNG-terminal which should be ready in 2016 and AGA has plans for a
terminal in Rauma in 2017.77 Moreover, Hamina Energia is planning a terminal at
HaminaKotka port to be completed in 2018.
After the Finnish government issued a support program for construction of LNG terminals,
6 applications have been made, of which support has been granted already to The Skangass
terminal in Pori (23.4 MEUR), the Aga terminal in Rauma (8.6 MEUR), the Hamina Energia
terminal (27.7 MEUR) and the largest sum has been granted to Tornio (33 MEUR). The
terminal has received a positive investment support decision from the Ministry of
Employment and the Economy for over 33 M euros.78
Although there are several projects on-going, constructing 1–2 more LNG terminals may be
needed. Alternatively, there may be a demand for an LNG bunkering vessel, which can
74
FIMECC REBUS P2, market study 2014
Styhre, L. et al. Development of the Short Sea Shuttle Concept, p.21
76
Kauppalehti 24.10.2014. Inkoon LNG-terminaali maalissa.
77 Navigator No. 6/2014, p. 32
78 Manga Lng: Työ- ja elinkeinoministeriöltä tukea nesteytetyn maakaasun(LNG) tuontiterminaalille.
75
40
VAT 3
FINAL
move between ports. NYK has recently ordered the first LNG bunkering vessels from Hanjin
Heavy Industries for delivery in 2016, at an approximate cost of 50 MEUR. 79
Investment in biogas solution for road transport
In case the land transport would be handled by trucks using LBG or LNG, investments in
new trucks would be needed, which cost approximately 40 000€ more than the traditional
diesel ones (appr.150 000€ vs. 110.000€ for a 460 hp truck). However, with the savings in
fuel costs the pay-back time could be reached within two years. The transport companies
renew their fleet of trucks approximately every four years, depending on driving distance.
In addition to trucks, investments in gas containers, from which the trucks also can be
fuelled, would be needed to the cost of appr. 230 000€ each. The amount of needed
containers depends on the routes. PBI is researching different alternatives for arranging the
governance of these investments, and they are thus excluded from this report. 80
Alternative financing models; innovation, incentives and financers
The traditional ship financing model would be for the ship-owner, who will order the vessels,
to loan the money for the investment based on some kind of guarantees regarding
employment of the vessels, meaning long-term contracts with the industry. Also some sort
of national or EU-subsidies may apply for the new building (innovation, environment), as we
have seen for example for Viking Grace.
In the “Positioning report” of REBUS research program P2 Logistics cluster81, alternative
models are presented. Traditionally, the ship-owner initially discusses the ship concept with
a design office. The ship-owner is mainly looking for a ship with capabilities to transport
certain cargo with as low a capex investment as possible, whereas the design office
oftentimes uses a previous design as basis. This way of working seldom results in
innovations. Therefore it is argued that a different model should be applied, involving the
system suppliers as well as the end customers more early on and taking on a life-cycle
perspective on the investment.
In the construction phase of the vessels, the system suppliers as well as the shipyard/-s
involved have a large role in designing the concept for an innovative vessel, which will
enable efficient handling of different materials based on end customer needs, low fuel
consumption and meeting environmental regulations. Moreover, the system suppliers can
take part responsibility of the operating costs over the lifecycle of the vessels through
optimizing the maintenance activities and schedules, upgrades etc.
Therefore it is suggested that the shipyard, the system suppliers and the shipowner/operator form an alliance or a consortium and commit to certain target figures
regarding capex, opex and revenues, with incentive schemes for meeting these targets (see
below picture), based on an open book principle. Although this is a bold target, the benefits
would be increased competitiveness and alignment of actors sharing risks and rewards not
only during construction but also during the operational stage. This would mean a changed
79
NYK Line: NYK Orders World's First LNG Bunkering Vessel - Joint Venture Agreed with GDF SUEZ and Mitsubishi
Corporation for Ownership of LNG Bunkering Vessel and Marine LNG-Fuel Sales 80 PBI study done in collaboration with biogas producers and transportation companies 2014-2015
81 Gustafsson et al. 2015
41
VAT 3
FINAL
role especially for the shipyard, whose main responsibility would be coordinating the
interfaces, while the suppliers’ roles would increase.
Picture 18: Traditional and Alliance Model
Below, we present two different financing and governance models: 1) alliance model for the
construction and operation of the new LNG-fleet and 2) a model for the whole logistical
system, including public investment.
Picture 19: Financing need for the ship-building and overall logistical system
42
VAT 3
FINAL
Alternative 1:
In the previous reports, Fairway to the future 1&2, forming a pool between ship-owners was
discussed, in order to enable a larger flexibility, cost savings and risk sharing. Investing in
new vessels of the same type would facilitate forming a pool, as it would make it easier to
distribute the revenues between the ship-owners. However, another alternative for
ownership of the vessels could be a special-purpose company consisting of non-marine
actors, e.g. industrial customers and investors such as pension insurance funds and others,
who would then outsource the operation of the vessels to a ship operator. The incentive for
them to invest in the vessels would be a return on equity equivalent to other investments,
as well as diversifying their investment portfolio (see below picture).
Whether taking on ownership in the vessels or not, the industry should also form some sort
of pool in order to combine their freights with each other and enter into long-term agreements
of 5–10 years with the operators to guarantee employment of the vessels and justify the
investment. The benefit would be reduced logistical costs for all and saved time/resources
as the pool would coordinate and arrange for the transport in collaboration with the
operators.
Public involvement could also be applied through state guaranteed loans or through some
support scheme, such as the LNG-case presented earlier. EU-grants might also apply.
Picture 20: Governance model for the alliance presented for the financing alternative 1
43
VAT 3
FINAL
Alternative 2:
Alternative 2 would mean more involvement from also the public sector. The government
could participate in developing the new logistics system through being a part in a PPPcompany looking after the total investment in both vessels and needed port-, LNG-, biogas,
road- and rail infrastructure investments as a way to support the export industry and secure
national emergency supplies. As a fairly recent example, the National Emergency Supply
Agency has taken over Neste Shipping’s vessels through the company Navidom Oy, owned together with Pension Insurance Company Ilmarinen.82
Other parties in the PPP would be formed by the infrastructure builders and users, as in the
previous example but through expanding the number of involved parties and working out an
incentive scheme that would enable a sufficient IRR to the different stakeholders over a lifecycle of 20 years. This idea is portrayed in the picture below.
Picture 21: Illustration of proposed PPP-company Fennoshipping
Preliminary NPV-calculation for alternative 1
Assumptions made for the preliminary NPV-calculation, ship building
Capex = 120 M€ for 10 vessels
WACC = 8%, 20 year investment
Revenue: 15€/ton, 7000 ton, 70 trips / year 73M€
Opex = based on conventional ship-operator earning logic for a container route, which is 80%
of the revenue / annum.
82
www.laivakuvat.com/neste-oil, Neste Oilin varustamotoiminnan uudelleenjärjestely
44
VAT 3
FINAL
Picture 22: NPV-calculation
The net present calculation shows that when building an environmental friendly and efficient
fleet, there is with current transport prices a possibility to reach 10% return rate for a 20 year
investment.
For alternative 2, the total investments for ports and land infrastructure need to be specified
after determining the material flows and routes and they are therefore not presented in this
report.
Summary
The aim of the case examples is to provide examples on how to build alternative financing
models for infrastructure and logistics systems to ensure the competitiveness of the Finnish
export and import industry. In particular, the model of PPP or other life-cycle models have
been applied. Below a summary is presented of the suitability of a PPP model for the
different logistical systems presented in this report.
Assessment if PPP is a suitable model
The project involves infrastructure and services which are likely to be required
for the duration of the investment time of 20 years
The infrastructure and services are unlikely to change significantly during the
term of the contract (price, volumes etc.)
The project involves risks which cannot be transferred to the private sector
under alternative delivery models
The project is complex or unique
The project is of sufficient size (eg. the capital
cost exceeds $100 million)
There are several stakeholders that can benefit from the infrastructure
There are several stakeholders than can bring new innovations to the project
Sokli
Ro-Ro
Short Sea Coaster
YES
YES
YES
YES
YES
YES
YES
NO
YES
YES
NO
YES
YES
NO
YES
YES
NO
YES
YES
YES
YES
Table 2: Assessment of suitability of PPP model for 3 chosen logistical lanes
45
VAT 3
FINAL
REFERENCES
Aalto University, University of Oulu, Åbo Akademi University. Designing effective governance
structures for large projects. Large Project Governance research report 2013.
Andrésen et al: Fairway to the future. The future of Shipping in Finland 2015 and beyond. PBI
Research Institute & The ship-owners’ foundation in Finland. 2013.
The Asset (26th March 2012). The changing face of shipping finance.
http://www.theasset.com/article/21535.html#axzz3MLM6Mt10
BaltiRail – oikotie Euroopan sydämeen (22th May 2008).
http://baltirail.wordpress.com/kirjoituksia/anttikoski-usko/.
Bloomberg (18th February 2014). Private-Equity Funds Bet $5 Billion on Shipping Rebound.
http://www.bloomberg.com/news/2014-02-18/private-equity-funds-bet-5-billion-on-shippingrebound-freight.html
City of Tampere (22th April 2014). Raitiotiehankkeen toteutusmalliesiselvitys.
http://www.tampere.fi/material/attachments/t/rjaReExvo/raitiotiettoteutusmalliselvitys220414.pdf
Clayton Utz (2013). Improving the outcomes of public private partnerships.
http://www.claytonutz.com/docs/improving_%20outcomes_ppp_2013.pdf
Cordell, Dana, Drangert, Jan-Olof., White, Stuart. The story of phosphorus: Global food security
and food for thought. Global Environmental Change 19 (2009).
http://www.sciencedirect.com/science/article/pii/S095937800800099X.
Della Croce, Raffaele and Yermo, Juan: Institutional investors and infrastructure financing. OECD
Working papers on finance, insurance and private pensions, No: 36. (2013).
http://www.oecd.org/daf/fin/privatepensions/WP_36_InstitutionalInvestorsAndInfrastructureFinancing.pdf.
DNB Markets, Presentation to Shipping forum (18th October 2012)
http://www.shippingforum.no/current-challenges-in-ship-finance-markets-dnb-london-branch-1810-12.5118572-256306.html
The Economist (29th November 2014). Fiddling while Europe burns.
http://www.economist.com/news/leaders/21635017-jean-claude-junckers-investment-packagelaughably-inadequate-fiddling-while-europe-burns.
The Economist (10th May 2014). We try harder. http://www.economist.com/news/specialreport/21601625-without-banks-baggage-shadow-banks-find-it-easier-oblige-customers-we-tryharder
EurActiv (26th November 2014). Juncker’s €315bn investment plan unveiled: fifteenfold leverage and solidarity for the south. http://www.euractiv.com/sections/eu-priorities-2020/junckers-eu315bninvestment-plan-unveiled-fifteenfold-leverage-and.
European Commission. Infrastructure - TEN-T - Connecting Europe.
http://ec.europa.eu/transport/themes/infrastructure/index_en.htm.
European Commission. Maritime. Short Sea Shipping. (4th November 2014)
http://ec.europa.eu/transport/modes/maritime/short_sea_shipping/index_en.htm.
46
VAT 3
FINAL
European Commission (2014). Infrastructure Ten-T Country by Country: Finland Info Sheet.
http://ec.europa.eu/transport/themes/infrastructure/ten-t-guidelines/doc/ten-t-countryfiches/fi_en.pdf.
European Commission. White paper: Roadmap to a Single European Transport Area – Towards a
competitive and resource efficient transport system. COM (2011) 144 Final. 2011. http://eurlex.europa.eu/LexUriServ/LexUriServ.do?uri=COM:2011:0144:FIN:EN:PDF.
Finnish Metals and Engineering Competence Cluster (2014). REBUS program.
http://www.fimecc.com/programs/rebus
FIMECC REBUS project. REBUS market study (2014). http://www.fimecc.com/programs/rebus.
Financial Times (13th January 2014). European banks face tough 2014 as ECB focuses on
shipping. http://www.ft.com/cms/s/0/aa034d9a-6bf1-11e3-a21600144feabdc0.html#axzz3KkFOMSvI
Finnish Transport Agency. Allianssipäivä 30.11.2011.
http://portal.liikennevirasto.fi/portal/page/portal/f/uutiset/tapahtumat/20111129_allianssipaiva/Allian
ssipaiva_30_11.pdf.
Finnish Transport Agency. Soklin vaihtoehdot. 18.1.2014.
Finnish Transport Agency. Tampereen uusi rantatunneli toteutetaan allianssimallilla.
Liikenneviraston uutiskirje 3/2012. http://public.mailem.fi/liikennevirasto/20121001/6840/.
Gustafsson et al. Tilannekatsaus. Analyysi merenkulkualan nykyisestä rakenteesta ja visio
merenkulkualan uudistetusta ekosysteemistä. FIMECC REBUS P2 Logistics Networks. Åbo
Akademi 2015.
ICAP Shipping. Container Market Report (31.10.2014).
Iikkanen, Pekka and Mukula Mikko (2010). Rataverkon tavaraliikenne-ennuste 2030.
Liikenneviraston julkaisuja 37/2010. http://www2.liikennevirasto.fi/julkaisut/pdf3/lts_201037_rataverkon_tavaraliikenne-ennuste_web.pdf.
Ikävalko, Ossi; Vähäaho, Ilkka; Suuroja, Sten: Soil and bedrock conditions to be expected in
Tallinn-Helsinki tunnel construction. Paper presented at Strait Crossings, Bergen Norway, June
2013. https://www.tekna.no/ressurs/filer/sc2013/096-%20Ossi%20Ikavalko%20-%20Tallin%20%20Helsinki%20tunnel.pdf.
Kauppalehti 24.10.2014. Inkoon LNG-terminaali maalissa.
http://www.kauppalehti.fi/etusivu/inkoon+lng-terminaali+maalissa/201410704818. Retrieved
16.12.2014
Kauppalehti 4.11.2014. Miljardikaupalla hankkeita – Tampere rakentaa raivolla.
Kauppalehti (31.8.2014). Soklin tieraha oli 35 miljoonaa euroa.
http://www.kauppalehti.fi/etusivu/soklin+tieraha+oli+35+miljoonaa+euroa/201408696590.
KPMG(12th February 2013). The rise of the regulated asset base model.
http://www.kpmg.com/lu/en/issuesandinsights/articlespublications/pages/theriseoftheregulatedasse
tbasedmodel.aspx.
Laasanen, Juhani. Soklin kaivoksen vaikutukset Savukosken kuntaan. Ruralia-instituutti. 2010.
http://www.helsinki.fi/ruralia/julkaisut/pdf/Raportteja56.pdf.
47
VAT 3
FINAL
Lapin liitto (2010). Soklin kaivoshankkeen vaihemaakuntakaava.
http://www.lappi.fi/lapinliitto/c/document_library/get_file?folderId=18281&name=DLFE-3975.pdf.
Lloyd’s list (2014). Focus on Finance. http://www.lloydslist.com/ll/topic/focus-on-finance
Manga Lng: Työ- ja elinkeinoministeriöltä tukea nesteytetyn maakaasun(LNG) tuontiterminaalille.
http://www.torniomangalng.fi/tyo-ja-elinkeinoministeriolta-tukea-nesteytetyn-maakaasun-lngtuontiterminaalille/ Retrieved 16.12.2014
Marine Money Offshore (2014). Dealogic 3Q 2011 – Will the Numbers Catch-up to the Noise?
http://www.marinemoneyoffshore.com/node/6847
Meaney, Andrew and Hope, Peter. Alternative ways of financing infrastructure investment:
Potential for “Novel” Financing Models. http://www.internationaltransportforum.org/jtrc/DiscussionPapers/DP201207.pdf.
Ministry of Environment (2014). Stressitesti löysi kehittämistä kaivosten vesien hallinnassa –
viranomaisten tehostettava yhteistyötä. http://www.ym.fi/fiFI/Ajankohtaista/Tiedotteet/Stressitesti_loysi_kehittamista_kaivoste%2828233%29.
Ministry of Finance. Valtion talousarvioesitys 2007.
http://budjetti.vm.fi/indox/sisalto.jsp;jsessionid=4FEB92F8932490037F2C5989F6746779?year=20
07&lang=&maindoc=/2007/LTAE2/vmkanta/vmkanta.xml&opennode=0:1:55:261:275.
Ministry of Transport and Communications (2009). Kolarin ja Soklin kaivoshankkeiden
liikennehankkeiden arviointi. Liikenne- ja viestintäministeriön julkaisuja 29/2009.
http://www.lvm.fi/docs/fi/339549_DLFE-7914.pdf.
Ministry of Transport and Communication of the Republic of Latvia. www.sam.gov.lv
Navigator No. 6/2014, p. 32
NYK Line: NYK Orders World's First LNG Bunkering Vessel – Joint Venture Agreed with GDF
SUEZ and Mitsubishi Corporation for Ownership of LNG Bunkering Vessel and Marine LNG-Fuel
Sales – (2nd July 2014). http://www.nyk.com/english/release/3132/003357.html. Retrieved
18.12.2014
OECD (2011). Pension funds investment in infrastructure – a survey.
http://www.oecd.org/futures/infrastructureto2030/48634596.pdf
Port of Helsinki homepage. http://www.portofhelsinki.fi/.
PBI study done in collaboration with biogas producers and transportation companies 2014-2015
Port of Helsinki (14.5.2014). Ports of Helsinki and Tallinn sign a MoU on traffic development
between Vuosaari and Muuga harbours. http://port-of-helsinki-com.mynewsdesk.com/news/portsof-helsinki-and-tallinn-sign-a-mou-on-traffic-development-between-vuosaari-and-muuga-harbours84665.
Port of Helsinki’s development projects. http://satamauudistuu.fi/twin-port-en/41/the-twin-portproject.
Port of Tallinn homepage. http://www.portoftallinn.com.
Tampere city, Finnish Transport Agency, Lemminkäinen Infra Oy, Saanio & Riekkola Oy and AInsinöörit Suunnittelu Oy: Rantatunneli Alliance project, project plan 26.6.2013
48
VAT 3
FINAL
Savukosken kunta. Homepage of Sokli and Savukoski project. http://sokli.fi/.
Shippingwatch (27th June 2014). Danish pension fund to invest heavily in shipping.
http://shippingwatch.com/carriers/article6836197.ece
Stopford, Martin (2010): A Year of Decisions for Shipping: How Will the Markets Develop?
Presentation made at the Financial Times Deutschland Ship Finance Conference. SMM
International Trade Fair, Hamburg, Germany. 6 September.
http://www.clarksons.net/archive/research/freestuff/Martin%20Stopford%20How%20Will%20the%2
0Market%20Develop%20%20Sept%2010%202010%20%28paper%29.pdf
Styhre, Linda; Roso, Violeta; Bergqvist, Rickard; Woxenius, Johan and Lumsden, Kent.
Development of the Short Sea Shuttle Concept. IVL Swedish Environmental Research Institute
Ltd. B2157. 2014.
http://www.ivl.se/download/18.21d4e98614280ba6d9e5cc2/1394706767688/B2157.pdf.
Sundberg, Pekka; Posti, Antti; Tapaninen, Ulla: Cargo traffic on the Helsinki-Tallinn route.
Publications from the Centre for maritime studies. University of Turku. A 56. 2011.
Syyskuun Huippuostaja: Liikenneviraston Mauri Mäkiaho. Tekes. http://www.tekes.fi/nyt/uutiset2014/huippuostajat-uutiset/syyskuun-huippuostaja-liikenneviraston-mauri-makiaho/
Taloussanomat (3.10.2013). Kaivosverosta tilattiin selvitys – minne se katosi?
http://www.taloussanomat.fi/politiikka/2013/10/03/kaivosverosta-tilattiin-selvitys-minne-sekatosi/201313637/12?pos=related.
Talvivaaran kaivosyhtiön toimintakertomus 31.12.2012 päättyneeltä tilikaudelta.
http://www.talvivaara.com/files/talvivaara/EGM%202013%20fi/TOIMINTAKERTOMUS_2012_SUO
MI.PDF.
Tapaninen, Ulla; Sundberg, Pekka; Posti, Antti: Short Sea Shipping in the Gulf of Finland- case
Helsinki-Tallinn. Short Sea Shipping 2012.
Watson, Farley& Williams. Maritime Briefing (February 2013). Private Equity Investments in Ships
and Shipping Companies. http://www.wfw.com/wp-content/uploads/2014/09/WFW-MaritimePrivateEquityGetsInterested.pdf
www.laivakuvat.com (26th May 2014). Neste Oilin varustamotoiminnan uudelleenjärjestely.
www.laivakuvat.com/neste-oil
YLE Uutiset (2.9.2011). Talvivaaran rata siirtyi valtiolle.
http://yle.fi/uutiset/talvivaaran_rata_siirtyi_valtiolle/5416842.
INTERVIEWEES / DISCUSSANTS
Eero Hemming, Logistics Manager, Yara. 9.12.2014
Jukka Hietaniemi, Project Manager, Finnish Transport Agency. 5.11.2014
Kimmo Mäki, Managing Director, Port of Helsinki. 17.11.2014
Mauri Mäkiaho, Deputy Project Manager, Finnish Transport Agency. 3.11.2014.
49
VAT 3
FINAL
Kari Ruohonen, Director General, Finnish Transport Agency. 10.10.2014
Tero Kosonen, Production Manager, VR Transpoint, Rail logistics. 28.11.2014
Managing Director, Private Transport Company. 10.11.2014
Board members of Shipowners’ Foundation in Finland Jan-Erik Stenman, Managing Director, Veritas
50
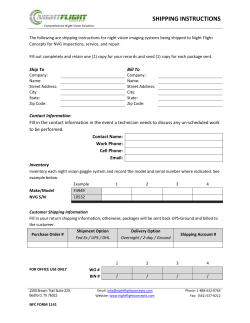

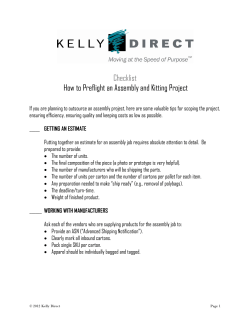


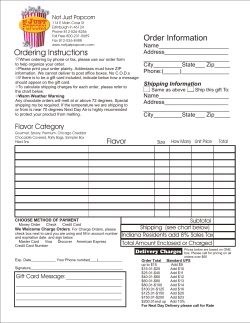
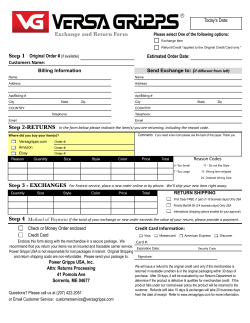


© Copyright 2026