
2014 SEG Annual Meeting Taking the Helm of a Strong Society
D EN VER
PR EVI EW
2014 SEG Annual Meeting
OFFICIAL SHOW DAILY PUBLISHER OF THE SEG INTERNATIONAL EXPOSITION AND 84TH ANNUAL MEETING
Taking the Helm of a Strong Society
Chris Liner will become the latest to take on SEG’s ‘good problems.’
By Rhonda Duey, Executive Editor, E&P
here are bad problems, and there are good
problems.
Bad problems include societies that are losing
members, attracting fewer people to their conferences, losing the confidence of their exhibitors and
generally dying on the vine.
SEG has none of those problems.
In fact, incoming President Christopher Liner,
who holds the Maurice F. Storm chair of petroleum
geology at the University of Arkansas, said the society has the kinds of “problems” that result from
being robust, well r un and g rowing.
Membership numbers are strong, and the number of student members is growing, with more
than 300 student chapters. The SEG staff numbers 100 people, who help manage a $25 million budget. A new SEG building is under
construction at the Tulsa, Okla., headquarters
campus and is scheduled for completion in
mid-2015 to house growing SEG staff and provide lease income. The SEG Foundation, which
funds society programs such as Geoscientists
Without Borders, has an active board and
excellent membership support. And the two
international offices, in China and the Middle
T
2014 Meeting
Boasts New
Features
SEG welcomes delegates with a new look
and feel to the event, registration kiosks,
and a focus on technology advances.
By Mary Hogan, Associate Managing Editor, Special Projects
nown for its warm
hospitality and with
more than 300 days of
sunshine a year, Denver
will play host to the best
and the br ightest in
the geophysics world
during SEG’s International
Exposition and 84th
Annual Meeting, taking
place at the Colorado Bradley Birkelo is SEG’s
Convention Center. The technical program chair.
show is already on track
to sur pass SEG’s previous shows held in
Denver, both in attendance and the number of
technical program sessions. Between 8,000
and 9,000 attendees are expected as well as
close to 400 exhibitors.
“We hope everyone will be pleasantly surprised with the many new features we have
added this year,” said Melanie McGuire, SEG’s
senior manager of conventions and meetings
operations. “There’s a new look and feel to the
entire annual meeting—from printed materials
K
See FEATURES continued on page 31
>>
Christopher Liner is SEG’s
incoming president.
East, are meeting the needs of
members in regions far away
from Tulsa.
If there’s a problem at all, it
could be said that the society
is almost too popular for its
own good. Liner said that a
typical annual meeting gets
more than 1,000 abstracts and
has to reject about 50% of
them, even with a four-day
conference. And many mem-
bers find traveling to the U.S. for the annual meeting to be a challenge.
To that end, SEG and the American Association
of Petroleum Geologists (AAPG) are drafting an
agreement to jointly offer two international conferences per year, one operated by each organization. SEG will participate in next year’s AAPG
International Conference and Exhibition as well
as evolve a new franchise in the other half of
the year.
See SOCIETY continued on page 31
>>
Isometric Sampling and the Pathway to Subsalt
Resolving the overburden will prove key to accessing the presalt.
Contributed by WesternGeco, a Schlumberger company
esternGeco is showcasing several new applications for IsoMetrix marine isometric seismic technology at the SEG Annual Meeting. These
demonstrate step changes in both imaging quality
and acquisition efficiency using towed streamers.
Since its launch, a continuous program of commercial projects has been successfully performed offshore four continents and in six petroleum basins,
demonstrating suitability in a range of operating
conditions and a variety of geological settings.
Survey objectives have spanned the full range of
applications, including reservoir characterization
and E&P.
A typical IsoMetrix survey configuration means
more than 250 million measurements are recorded
each second, from both hydrophones and calibrated
accelerometers. Each datapoint is individually
transmitted from streamer to vessel for digital processing. This represents a huge increase in data volume, and consequently all IsoMetrix vessels are
equipped with powerful computer systems to manage the data flow in an offshore environment.
In f act, the Wester n Tr ident, the second
IsoMetr ix vessel, is now the third largest
Schlumberger data processing center worldwide. This enables key elements of the processing to be perfor med onboard, along with
fast-track products for initial geological interpretation. Amazon Conqueror, the second of a
new class of vessels designed specifically for
seismic operations, will be equipped with
IsoMetrix upon launch in early 2015.
Subsalt plays, increasingly in deepwater environments, continue to attract considerable
exploration interest in areas such as the Gulf of
Mexico, West Africa and Brazil; however, accurate mapping of the hydrocarbon potential in
these complex geological settings presents many
technical challenges. Successfully navigating the
pathway to the subsalt requires paying as much
attention to both the overburden and morphology of the salt bodies as it does to the target
itself. Subsalt imaging solutions require an integrated technology portfolio. WesternGeco has
identified IsoMetrix as a core element in future
subsalt workflows due to its capability to address
aspects of wavefield sampling, 3-D deghosting
and spatial resolution.
The system records separate data from each
sensor in the streamers, providing independent
measurements of acoustic pressure and both the
vertical and crossline pressure gradient. While
pressure and vertical pressure gradient measurements alone might be combined to deliver highquality broadband data in the time domain, it is
the extra crossline measurements that enable spatial wavefield reconstruction and full 3-D
deghosting. This technology delivers records of
the separated upgoing and downgoing notchless
seismic wavefields sampled on a 6.25-m by 6.25m (20.5-ft by 20.5-ft) point-receiver surface grid
for every shot in a seismic survey.
Fine-scale isometric sampling of the seismic
wavefield in turn provides fine-scale characterization of the subsurface and means that 3-D
interpretation attributes can be generated with
confidence, independent of the orientation of
viewing. This translates into more detailed representations of subsurface structures and stratigraphic variations.
Furthermore, IsoMetrix can be used to enable
more efficient acquisition techniques and deeper
tow depths, both of which enhance exploration
efficiency. The combination of 3-D deghosting
and fine wavefield sampling in all three dimensions represents the first-ever truly 3-D broadband measurement of the seismic wavefield
using towed streamers.
IsoMetrix technology enables a new level of
insight into subsurface geology from seabed to
W
Seismic time slice
3-D interpretation attribute
particularly crucial
for helping to avoid
drilling surprises in
environments
where the cost of
sidetracking
or
abandonment can
be extremely high.
Knowledge of shallow geology also is
important in developing
detailed
velocity models that
benefit processes
such as full waveExample of IsoMetrix data aiding overburden resolution: A seismic time slice and equivalent slice from a colored 3-D interpretation form inversion and
volume extracted along a shallow dipping horizon show fine detail in channel systems. (Image courtesy of WesternGeco, a
accurate prestack
company)
Schlumberger
depth migration.
Second, finereservoir. First, understanding the overburden is scale sampling of the reconstructed seismic wavefield
important as the initial step to the subsalt. High-reso- also benefits definition of the salt body geometry and
lution characterization of shallower formations is
See PATHWAY continued on page 28 >>
critical for defining efficient well trajectories and is
E & P DA I LY N E W S | O C T . 2 7, 2 0 1 4 | P R E V I E W
3
DA I LY N E W S
1616 S. Voss Road, Ste. 1000
Houston, Texas 77057
P: +1 713.260.6400
F: +1 713.840.0923
EPmag.com
Editor-In-Chief
MARK THOMAS
SEG
Oct. 26 - 31 • Denver
All events will take place at the Colorado Convention Center, unless otherwise noted.
SUNDAY, OCT. 26
9:20 a.m. to 4:30 p.m.
Technical Program e-Poster Sessions
8 a.m. to 5 p.m.
Continuing Education Courses
9:20 a.m. to 4:30 p.m.
Technical Program Poster Sessions
8 a.m. to 5 p.m.
AAPG Fieldtrip
Departing and returning from Denver
11:30 a.m. to 1:30 p.m.
Near-Surface Geophysics Luncheon
11:30 a.m. to 1:30 p.m.
GAC Latin America/ULG Luncheon
8 a.m. to 5 p.m.
SEG/Chevron Student
Leadership Symposium
Hyatt Regency
11:30 a.m. to 1:30 p.m.
GAC Europe/FSU Luncheon
11:30 a.m.
8 a.m. to 5 p.m.
SEG/ExxonMobil Student
Education Program
Hyatt Regency
Guest/Spouse Program Luncheon
Hyatt Regency
12 p.m. to 1:30 p.m.
Gravity and Magnetics Luncheon
2:30 p.m. to 4:30 p.m.
Guest/Spouse Program:
Behind the Scenes Tour
Meet at Hyatt Regency
Executive Editor/Project Editor
RHONDA DUEY
8 a.m. to 12 p.m.
Group Managing Editor
JO ANN DAVY
Committee Meetings
Colorado Convention Center
and Hyatt Regency
1 p.m. to 3 p.m.
Council Meeting
3 p.m. to 4 p.m.
2 p.m. to 4 p.m.
Faculty Adviser Workshop
Hyatt Regency Downtown,
3rd Floor, Agate
Guest/Spouse Program:
Social Media Seminar
Guest/Spouse Hospitality Suite
4 p.m. to 6 p.m.
Near-Surface Business Meeting
Colorado Convention Center
and Hyatt Regency
Senior Editor
SCOTT WEEDEN
Senior Editor
JENNIFER PRESLEY
Executive Editor, Special Projects
ELDON BALL
Associate Managing Editor,
Special Projects
MARY HOGAN
Associate Managing Editor, E&P
BETHANY FARNSWORTH
Associate Online Editor
VELDA ADDISON
Associate Editor
ARIANA BENAVIDEZ
Corporate Art Director
ALEXA SANDERS
Senior Graphic Designer
JAMES GRANT
Production Director
& Reprint Sales
JO LYNNE POOL
Director of
Business Development
ERIC ROTH
Vice President - Publishing
RUSSELL LAAS
4:30 p.m. to 5:30 p.m.
Honors and Awards Ceremony
6 p.m. to 8 p.m.
Icebreaker and Exposition Preview
Colorado Convention Center,
Exhibition Hall
4:30 p.m. to 6 p.m.
6 p.m. to 8 p.m.
Student Pavilion
Colorado Convention Center, Hall E
International Reception
Student Pavilion,
Colorado Convention Center
7 p.m. to 11 p.m.
6:30 p.m. to 7:30 p.m.
SEP/SLS Alumni Night
Student Pavilion,
Colorado Convention Center, Hall E
Near-Surface Evening
Katie Mullen’s Irish Restaurant and Pub
8 p.m. to 11 p.m.
Presidential Jam
Hyatt Regency
MONDAY, OCT. 27
Editorial Director
PEGGY WILLIAMS
President and CFO
KEVIN F. HIGGINS
Chief Executive Officer
RICHARD A. EICHLER
The E&P Daily News is produced for the
2014 SEG International Exposition and
Annual Meeting. The publication is edited by
the staff of Hart Energy. Opinions expressed
herein do not necessarily reflect the opinions
of Hart Energy or its affiliates.
Copyright © 2014 Hart Energy
WEDNESDAY, OCT. 29
7 a.m. to 8 a.m.
Speaker Orientation Breakfast
Committee Meetings
Colorado Convention Center
and Hyatt Regency
7:45 a.m. to 6:30 p.m.
Committee Meetings
Colorado Convention Center
and Hyatt Regency
9 a.m. to 4:30 p.m.
High Performance Computing Theater
Colorado Convention Center, Booth 1582
8 a.m. to 10:30 a.m.
Women’s Networking Breakfast
8:30 a.m. to 9:30 a.m.
9 a.m. to 9:45 a.m.
Guest/Spouse Program:
Welcome by Visit Denver
Guest/Spouse Hospitality Suite
Guest/Spouse Program:
Zumba Class
Guest/Spouse Hospitality Suite
8:30 a.m. to 5 p.m.
Technical Program Oral Session
9 a.m. to 10 a.m.
Résumé Writing Workshop
Student Pavilion
Colorado Convention Center, Hall E
9 a.m. to 2 p.m.
9 a.m. to 11:30 a.m.
Opening Session and SEG Forum
Guest/Spouse Program:
A Celestial Day in Boulder
Meet at Hyatt Regency
9 a.m. to 6 p.m.
Student Pavilion
Colorado Convention Center, Hall E
9 a.m. to 3:30 p.m.
High Performance Computing Theater
Colorado Convention Center, Booth 1582
11 a.m. to 11:45 a.m.
Guest/Spouse Program: Glass Fusion
Guest/Spouse Hospitality Suite
9 a.m. to 4 p.m.
Student Pavilion
Colorado Convention Center, Hall E
1 p.m. to 3 p.m.
Student Career Panel
Hyatt Regency, 3rd floor,
Centennial Ballroom H
9:20 a.m. to 4 p.m.
Technical Program Poster Session
9:20 a.m. to 4 p.m.
Technical Program e-Poster Sessions
7 a.m. to 8 a.m.
Speaker Orientation Breakfast
7 a.m. to 7 p.m.
Guest/Spouse Program:
Rock ‘n’ Brews Tour
Meet at Hyatt Regency
10 a.m. to 11 a.m.
Applied Science Education Program
10 a.m. to 12:30 p.m.
Guest/Spouse Program: Crochet Seminar
Guest/Spouse Hospitality Suite
1:30 p.m. to 4:30 p.m.
Technical Program e-Poster Sessions
11:30 a.m. to 1:30 p.m.
GAC Pacific/Asia Luncheon
1:30 p.m. to 4:30 p.m.
Technical Program Poster Sessions
11:30 a.m. to 1:30 p.m.
GAC Middle East/Africa Luncheon
1:30 p.m. to 5 p.m.
Technical Program Oral Sessions
12 p.m. to 1:30 p.m.
Development & Production Luncheon
1:30 p.m. to 4:30 p.m.
Guest/Spouse Program:
High Tea Tour
Meet at Hyatt Regency
12 p.m. to 1:30 p.m.
Mining Luncheon
2 p.m. to 3 p.m.
Commencement (SLS and SEP)
Student Pavilion, Colorado Convention Center
2 p.m. to 4:30 p.m.
Guest/Spouse Program:
Crochet Seminar
Guest/Spouse Hospitality Suite
6 p.m. to 9 p.m.
Wednesday Night Event
Denver Museum of Nature and Science
1 p.m. to 5 p.m.
2:30 p.m. to 3:30 p.m.
4
SCHEDULE OF EVENTS
Guest/Spouse Program:
Google Glass Presentation
Guest/Spouse Hospitality Suite
3 p.m. to 6 p.m.
Challenge Bowl Finals
Hyatt Regency
6 p.m. to 8 p.m.
Student Networking Event
Hyatt Regency
8 p.m. to 9:30 p.m.
Open Mic Night
Hyatt Regency
THURSDAY, OCT. 30
TUESDAY, OCT. 28
7 a.m. to 8 a.m.
Speaker Orientation Breakfast
7 a.m. to 6 p.m.
Committee Meetings
Colorado Convention Center
and Hyatt Regency
8:30 a.m. to 9:30 a.m.
Guest/Spouse Program: Yoga Seminar
Guest/Spouse Hospitality Suite
8:30 a.m. to 5 p.m.
Technical Program Oral Sessions
9 a.m. to 5:30 p.m.
High Performance Computing Theater
Colorado Convention Center, Booth 1582
9 a.m. to 6 p.m.
Student Pavilion
Colorado Convention Center, Hall E
7 a.m. to 8 a.m.
Speaker Orientation Breakfast
8:30 a.m. to 12 p.m.
Technical Program Oral Sessions
8:30 a.m. to 12 p.m.
Technical Program e-Poster Sessions
9 a.m. to 12 p.m.
Committee Meetings
Colorado Convention Center
and Hyatt Regency
1:30 p.m. to 5 p.m.
Post-Convention Workshops
7:30 p.m.
Research Committee Dinner
Maggiano’s Little Italy located
in the Denver Pavilions
FRIDAY, OCT. 31
8:30 a.m. to 5 p.m.
Post-Convention Workshops
P R E V I E W | O C T . 2 7, 2 0 1 4 | E & P DA I LY N E W S
HPC Provides Real-Time Access to the Reservoir
HPC vastly expands the user’s processing capabilities and the speed with which algorithms can be run.
Contributed by Schlumberger
rom the oil field to the office, the E&P industry is
driven by data. The ability to use the vast quantities
of reservoir data to guide decision-making during all
phases of field development—from shooting seismic to
drilling and completing a well—has traditionally been
limited by the computational power that users had at
their fingertips.
The majority of petrotechnical computing is still
done on laptops or desktop machines, meaning that any
computation one runs is constrained by the hardware
and processing power of local machines. To provide
insight while the drillbit is still in the hole, these constraints meant that users could not wait hours for an
algorithm to run. Instead, they had to make approximations and compromise on the quality of the answer provided to the driller, often with less-than-ideal results.
F
High-powered solution
The advent of high-performance computing (HPC) in
the petrotechnical arena has now vastly expanded the
user’s processing capabilities and the speed at which algorithms can be run. By taking advantage of the parallel processing power of HPC, complex algorithms
can be run up to 1,000 times faster than with a local
machine without compromising on data quality.
As the industry continues to adopt more complex algorithms to better image complex geologies,
relative compute effort has increased logarithmically to keep pace. This trend is expected to continue in the next decade, and HPC will likely
provide the best computing solution.
Schlumberger has developed a strategy of
advancing its petrotechnical software solutions to
leverage the processing speeds afforded by HPC
and to provide faster and more complete answers to
guide better informed decisions. The company’s
petrotechnical cloud computing strategy combines
advanced software application empowered by HPC
and delivered in a cloud-computing infrastructure
to support real-time workflows and improve the
application of modeling and inversion as well as
earth model building, among other disciplines.
This offering allows for real-time deep reservoir
imaging and complex, fine-scale geosteering to
keep pace with drilling. It also is a scalable and flexible processing solution, allowing users to easily
transition from individual section to whole-trajectory modeling and run multiple scenarios in real
time. The HPC-leveraged cloud computing solution permits prejob and post-job modeling and
analysis and upgrades inversion capabilities from
traditional 1-D to 2-D.
Compared to conventional desktop processing,
HPC-enabled processing offers substantial performance gains. Depth-point inversion is available in
15 seconds vs. 4 minutes to 5 minutes. Peak processing demand requires only eight to10 nodes vs.
the 250 nodes required for noncloud processing.
Figure 1. Enabled by HPC infrastructure, the inversion techniques of the GeoSphere reservoir mapping-while-drilling service provide the depth of investigation
required for mapping the reservoir. (Image courtesy of Schlumberger)
The company’s seismic-guided drilling (SGD) service also has benefited from HPC in a cloud environment. The service uses both surface seismic and
LWD data to provide a 3-D look-ahead velocity
model and predict formation pressures hundreds of
meters ahead of the bit while drilling. By running
this model via HPC, a clearer description of the
geological and geomechanical properties of the
reservoir is afforded in a much shorter turnaround
time. The driller can then make proactive decisions
that limit the risks of abnormal formation pressures
and help ensure greater borehole stability.
The HPC-enabled SGD service has been successfully proven in several blind-test studies. The results of
these blind tests have led operators to implement the
technology as a risk-mitigation measure in several
deepwater HP/HT wells worldwide.
This cloud-based HPC offering allows Schlumberger
to provide high-quality, efficient processing power to
any oil and gas operation worldwide. And for the first
time, operators have access to a complete HPC infrastructure that they can access and use as needed without
having to invest in the infrastructure themselves. For
more information, visit Schlumberger at booth 1319. n
Proving its worth
Schlumberger has added capabilities to its
petrotechnical software platforms Petrel E&P software platform, Techlog wellbore software platform
and Omega geophysics data processing platform to
take advantage of the processing speed and accuracy afforded by HPC in the cloud.
The GeoSphere reservoir mapping-whiledrilling service, for example, has used cloudbased HPC to improve geosteering in narrow
and complex formations. The deep directional
electromagnetic measurements from the tool’s
array of multiple subs in the bottomhole assembly are used as inputs to refine structural and
geological models for the reservoir. Updates to
the model are available up to 25 times faster by
HPC processing in the cloud, a significant
reduction in turnaround time that allows the
driller to make decisions on the fly to accurately
land the well in the target zones and avoid
structural dips and fluid boundaries.
E & P DA I LY N E W S | O C T . 2 7, 2 0 1 4 | P R E V I E W
5
The Gateway to Libra
Experience, knowledge and new broadband coverage offshore Brazil bring insight to the potential of presalt acreage.
Contributed by CGG
n 2013, Brazil had a hat trick of licensing rounds
after a five-year hiatus, which sparked a resurgence
in marine seismic activity in the country. The
excitement of this year’s FIFA World Cup might
have faded, but there is still plenty to get excited
about in 11th licensing round acreage with extensive
tracts of prospective presalt plays to explore.
With 50 years’ experience of local operations and
considerable knowledge of the geological and geophysical challenges in Brazil, CGG was poised to
take advantage of this opportunity as operators
committed to a significant seismic program. As a
result, CGG was awarded four multiclient survey
contracts in the Equatorial Margin and Espirito
Santo and Campos basins totaling 43,130 sq km
(16,653 sq miles).
These new surveys have been acquired with
BroadSeis, CGG’s benchmark broadband solution.
BroadSeis is well suited for Round 11 license areas
since its broad bandwidths can eliminate the need
for compromise in targeting either high frequencies
I
6
for shallow imaging or low frequencies (with
good signal-tonoise down to 2.5
Hz) for deep imaging. BroadSeis’
ghost-free data
make it possible to
deliver the best
images throughout
the section.
So what’s in
store for Round
11 acreage?
In the past, the
main exploration
targets in the
Campos and Santos
basins were within
the shallow postsalt successions, but
since the discovery
New BroadSeis coverage in the Campos Basin highlights presalt potential. (Image courtesy of CGG Data Library)
of the Lula oil field,
interest has turned toward the presalt. Significant
finds have since been made, and the presence of
Lower Cretaceous carbonate reservoirs has been
established in the upper syn-rift and post-rift.
The new BroadSeis surveys have highlighted a
number of megasequences in the presalt, with
the oldest being highly-faulted basement that
influenced the deposition of presalt reservoirs.
Directly above the lacustrine shale and mudstone source rocks are thick syn-rift sequences
that can be easily differentiated on the new
images. The upper syn-rift is important for
exploration in the northern Santos and Campos
basins as it provides the main carbonate coquinas
reservoirs for the Libra and Franco fields. In the
post-rift sequences, nonmarine microbial carbonate potential reservoirs were deposited, as
observed in the Lula Field. All presalt reservoirs
are sealed by a thick sequence of evaporites.
The geology in these basins creates some
interesting imaging challenges that have kept the
geophysicists in CGG’s Rio de Janeiro center on
their toes. As well as deploying an advanced subsalt imaging toolbox including full-waveform
inversion, they have been busy applying new
internal multiple attenuation technology and
using iterative velocity updates to image below
the igneous intrusions.
In the new acreage of the Equatorial Margin,
the westernmost Foz do Amazonas Basin experienced very high sedimentation rates, which led to
the formation of a thick deltaic sequence. Basins in
this region were affected by large gravity slides.
Potential reservoirs in the Foz do Amazonas
include Tertiary deltaic sands, turbidites, fractured
carbonates and talus deposits, which are structurally
and stratigraphically trapped. Paleo-canyons in this
basin proved to be another imaging challenge that
was ably tackled by CGG’s geophysicists.
To the east of the delta, the Barreirinhas Basin
is much less affected by the Amazon sediment
load, but a steep margin led to megaslide complexes forming. This basin is the conjugate to
Ghana and Togo, where large fields already are
producing. Large en-echelon folds, rollovers and
tilted fault blocks provide structural traps, and
marine shales source Late Cretaceous reservoirs,
which are stratigraphically sealed.
Visit CGG at booth 1339 to see its “Gateway
to Libra” display and talk to its multiclient and
new ventures team and Robertson geologists.
The company’s subsurface imaging group also
will present some of the new technology applied
in the SEG technical sessions. The company will
host a Brazil happy hour presentation at 4 p.m.
on Monday at its booth, discussing the subsurface
imaging expertise behind these new displays. n
P R E V I E W | O C T . 2 7, 2 0 1 4 | E & P DA I LY N E W S
Enabling RSS Hole Enlargement
to Total Depth in a Single Run
At-bit reamer system leaves reduced-size rathole in hole-opening applications.
By John Evans, Halliburton
alliburton’s TDReam tool can significantly
reduce the rathole length drilled in rotary
steerable system (RSS) hole-enlargement operations
while making it possible to reach section total depth
(TD) in a single run.
The tool was developed to meet a drilling tender
requirement, which required a reaming-whiledrilling tool that could be run on an RSS and that
could deliver a rathole no longer than 6 m (20 ft).
This saved the time and cost of an extra hole
enlargement run for these sections.
In a traditional reaming-while-drilling bottomhole assembly (BHA), the reamer is placed above the
RSS system and LWD tools, creating a long rathole
up to 37 m (121 ft) long, which requires an extra
trip to enlarge the hole to TD. By contrast, the
TDReam tool is an integrated near-bit tool that
immediately enlarges the rathole left by the RSS and
eliminates the need for a dedicated reamer run.
In operation, the TDReam tool is placed between
the bit and RSS, where it remains dormant as the
section is drilled. With a length of just 1 m (3.3 ft),
the one-piece, solid-body integrated reamer incorporates hydraulic shear pins that maintain the tool in
dormant position during the drilling of the section.
At depth, the BHA is pulled to position by the tool
at the top of the rathole, where a flow increase activates the tool. The pressure drop through the bit
maintains the tool in the open position as it enlarges
the rathole.
The shear pin design prevents tool activation
while drilling out the shoe track, and there are no
locking devices that can inadvertently lock the activation pistons in the open position. When flow
decreases, return springs close the reamer arms.
In the end, instead of 37 m of rathole that needs
to be enlarged, a single trip results in a rathole less
than 1 m long.
H
Halliburton provided a
drilling BHA that combined an advanced polydiamond
crystalline
compact bit with the
TDReam1200 tool, run
with a Geo-Pilot 7600
RSS and Wired XR
Reamer. This assembly
was run in-hole to drill
while reaming to section
TD, where the BHA was
then pulled and positioned inside the enlarged
wellbore. The TDReam
tool was then activated to
ream the last 15 m (49 ft)
of hole, enlarging to 13½
in. The hole was then circulated clean and the
BHA pulled to surface,
after which the 10¾-in.
Halliburton’s TDReam integrated near-bit reaming-while-drilling tool enables an RSS to reach TD in one run, leaving
liner was successfully run
a rathole length of just 1 m. (Image courtesy of Halliburton)
to TD and cemented.
The efficiency improvements afforded by the tool
TDReam tool technology includes an engineered
yield clear benefits in terms of substantial time and
design that seeks to optimize tool dimensions to
cost savings as well as providing additional well
help ensure satisfactory steerability and use of
design flexibility and greater safety. Time savings
advanced propr ietary software to model BHA
alone in this case resulted in estimated savings to the
behavior and steerability during drilling. Extensive
operator of $300,000.
computational fluid dynamics analysis was perIn addition, by allowing casing and cementing
formed in the design phase to optimize hydraulics
operations to be performed without the need for
for improved tool-cleaning efficiency and to help
a dedicated rathole cleanout beforehand, reaming
ensure there is no hydraulic compromise from the
while drilling with the TDReam tool reduced the
internal workings of the tool.
risks inherent with multiple trips downhole and
Initial application in a hard rock directional well
pipehandling operations at the surface. At a spread
offshore Norway was a success. The operator
rate of about $900 per minute, eliminating the
required hole enlargement from 12¼ in. to 13½ in.
cost of an extra trip by using the TDReam tool
using an RSS. The operator also required a solution
could save as much as $2 million compared to a
that would save rig time and reduce the typical 37traditional reamer. n
m length of the rathole drilled.
The Evolution of Seabed Node Technology
Seismic system can provide improved data clarity and geophysical illumination.
Contributed by Seabed Geosolutions
eabed Geosolutions’ Manta seabed seismic
technology can provide a single ocean-bottom
node solution for water depths up to 3,000 m
(9,843 ft). The technology can overcome challenging environments with complex geologies and
deliver improved data clarity through versatility in
survey design. The system was designed to deliver
improved geophysical illumination with flexibility
for dense source grid and full-azimuth and longoffset surveys.
Manta nodes are versatile, efficient and designed
with maximum safety in mind. The flexibility of
the system allows it to go where traditional
streamer seismic often cannot. With a variety of
deployment methods, the system can acquire highresolution subsurface data in challeng ing,
obstructed areas and from both shallow transition
zones and deepwater.
The node is made up of a four-component sensor incorporating three geophones mounted in a
Galperin orientation and one hydrophone. The
integral inclinometer continually records the orientation of the node once it is positioned on the
seafloor. This component configuration, which
includes omnidirectional geophones, can provide a
uniform azimuthal response and can capture the
full wavefield. The technology records the com-
S
8
system with automated
node storage, data download and battery charging
is founded on a transportable modular solution
using available dynamic
positioning vessels.
The company’s R&D
team has combined contemporary microcomponents with recent advances
in rechargeable powerdense battery technology
to create a compact,
lightweight node for
almost all survey locations
and designs. The reduced
node size and stackable
The compact and stackable Manta node goes where traditional streamer seismic often cannot, in depths up
shape help to make the
to 3,000 m. (Image courtesy of Seabed Geosolutions)
most of deck space, allowing for flexibility and optipressional and converted waves’ seismic attributes, mization of node counts. The no-touch handling
which can enable better delineation of hydrocar- system delivers the Manta node in either a traditional dense receiver configuration or by ROV. This
bon zones and subsurface lithologies.
The system has been developed in unison with makes the technology ideal during the production
designed robotics to create a “no-touch” handling phase to understand, monitor and manage the resersystem, thereby seeking to reduce HSE exposure voir across the life of the field.
Visit Seabed Geosolutions at booth 1124 for
while achieving operational efficiency. The entire
concept of the no-touch deployment and recovery more information. n
P R E V I E W | O C T . 2 7, 2 0 1 4 | E & P DA I LY N E W S
Understanding the Subsurface
and Improving Recovery
Microseismic data provide deeper reservoir understanding to enhance production and maximize
field economics for the life of the well.
Contributed by Weatherford
n today’s environment of increasing hydrocarbon
demand and growing reservoir complexity, operators are challenged more than ever to optimize
recovery and improve economics by understanding
the reservoir. Microseismic borehole or subsurface
data that provide a detailed picture of the asset—
including dynamics for both natural and pretreated
fractures—enable operators to make more informed
decisions regarding wellbore design and completion
strategies for the life of the well.
The Weatherford Borehole Seismic Group has
developed a suite of field-proven subsurface microseismic services that provide real-time hydraulic
fracture monitoring and mapping and completion
evaluation capabilities. Mapping services model and
enhance stimulation programs with full geomechanical analysis along with designed pump pressures,
injection rates and injection volumes to stay in the
target zone in every stage. Operators can use the
information to avoid unanticipated subsurface complications, optimize well and fracture trajectories and
bypass nonproductive natural fractures.
Microseismic hydraulic fracture stimulation
diagnostic services include microseismic monitoring that uses stimulation-induced microseismicity
to map fractures. Wireline-deployed geophone
arrays downhole record microseismicity, which
provides data about the length, height, width and
azimuth of a fractured zone; event sequence and
magnitude; and the rock f ailure mechanism.
Diagnostic tools can map a multistage treatment
and measure overlapping fracture growth for multiple horizontal wells.
I
In a unique application in the Barnett Shale, a geophone array was placed in the cased horizontal leg of
a wellbore to monitor the stimulation of a parallel
cased horizontal well. Each zone of the adjacent well
was stimulated, with the zones isolated by temporary
packers set above the perforations after each stimulation. The operation revealed the preferred azimuth of
fracturing along with the degree of overlap of the
fracturing patterns created by each stage.
By mapping the stimulation results of two parallel
horizontal wells, microseismic determined overlapping fracture patterns between stimulation stages in
one well and between adjacent wells, which proved
beneficial in improving production and recovery
rates. This practice of simultaneously stimulating the
perforated zones of two or more adjacent wells with
overlapping fracture zones is now commonly used in
most unconventional plays.
Continuously recording microseismicity
For remote wells less than 610 m (2,000 ft) from a
treatment well, the Weatherford self-contained field
unit facilitates deployment of a three-component
geophone array on standard wireline to continuously record microseismicity before, during and after
hydraulic stimulation. Microseismicity can be processed and mapped in real time or after stimulation.
The seismic mapping data are streamed and displayed on site in the fracturing unit.
Among the new-generation technologies is the
SlimWave with enhanced sensitivity for recording
high-frequency signals and providing high-resolution vertical seismic profiles and microseismic monitoring. For treatment well operations, Weatherford is
using methods based on Microseismic Spear tech-
Using Weatherford’s subsurface microseismic services, operators can see
real-time hydraulic fracture monitoring and mapping to optimize well and
fracture trajectories and avoid unanticipated subsurface complications.
(Image courtesy of Weatherford)
nology developed by ExxonMobil Upstream
Research Co. to record microseismicity when the
absence of nearby observation wells prevents monitoring the stimulation.
The spear array records microseismicity during
pretreatment pad and post-treatment shut-in stages
and maps microseismicity in real time or after stimulation. In cases where wellhead pressure is too great
to let the tool drop from the lubricator, a new e-coil
pushes the tool into the well, increasing the breaking
strain for the head and providing the ability to circulate fluid around the top of the tool should it become
sanded in. The methodology will eventually make it
possible to push the tool horizontally if necessary.
In an area of the Marcellus Shale where saltwater
production has impeded drilling, the three-geophone seismic spear monitoring tool was used to
verify that the fracture design in a vertical pilot well
remained within the Marcellus prior to drilling horizontal wells. The spear was placed in the borehole
during stimulation and recorded the fracturing emissions after the pumps stopped to show the extent of
fracturing. The stimulation design fractured only the
Marcellus, avoiding the underlying saltwater zone.
The user was then able to develop a viable horizontal drilling and stimulation program.
Microseismic mapping is one of the key areas
where the industry is pushing the envelope to maximize recovery and optimize economics in complex
conventional and unconventional fields. n
Taking Seismic Interpretation to New Levels
Software and plug-ins enable more accurate geological models and new ways of analyzing seismic data.
Contributed by dGB Earth Sciences
rom denser sampling in space and time to sophisticated attributes and visualization technologies,
the last few years have seen significant advances in
seismic interpretation and its input to operators’
drilling, well and reservoir management strategies.
Major developments include the introduction of
geologic age into the interpretation process, the fully
interpreted seismic volumes that have resulted and the
advanced workflows that have been built around them.
Fully interpreted seismic volumes have opened
the way to the application of a number of advanced
seismic interpretation workflows, from sequence
stratigraphy, attribute generation and model building to geohazard interpretation. These workflows
enable more geologic information to be extracted
from seismic data and provide unprecedented value
to operators.
Among these new developments is dGB Earth
Sciences’ open-source seismic interpretation software OpendTect—downloaded more than 150,000
times since September 2009—and its commercial
plug-in, HorizonCube.
HorizonCube provides fully interpreted seismic
volumes where horizons are automatically tracked
between a given set of framework horizons and
faults. The tracking is carried out through use of a
seismic dip volume. The plug-in correlates time
lines in this precalculated seismic dip field with the
tracked surfaces stored as a dense set of mapped
horizons called HorizonCubes.
In this way, the plug-in can provide improved
quantitative rock property estimation, enhanced defi-
F
10
OpendTect open-source seismic interpretation software includes improved
display capabilities. (Image courtesy of dGB Earth Sciences)
nitions of stratigraphic traps, more accurate and robust
geological models, and the ability for interpreters to
extract more from their high-resolution seismic data.
During the 2014 SEG Annual Meeting, dGB
will be introducing the latest version of its
OpendTect 5.0 software, which comes with significant advances to HorizonCube and stratigraphic
interpretation capabilities, potentially leading to a
better understanding of structural geologies.
Many of the new features within the software
have emerged out of the dGB-led Sequence
Stratigraphic Interpretation System (SSIS) consortium that includes sponsors Statoil, OMV, MOL
and RocOil.
The software includes a new interactive
HorizonCube tracker workflow for 2-D seismic that
can be used to track single horizons and create 2-D
HorizonCubes through a dip-steered tracker where
the user picks horizons at multiple seed positions in
both the structural and Wheeler domains.
The resulting correlated geologic time lines provide
interpreters with new ways of analyzing seismic data,
help interpreters better understand their depositional
histories and improve the ability to find stratigraphic
traps and build accurate geologic models.
OpendTect 5.0 includes a graphics library with
multitouch interaction capabilities and closer integration with MATLAB, the high-level language
and interactive environment for numerical computation, visualization and programming. This will
open up a huge potential database of easily accessible research code.
The software also includes significant enhancements like the SynthRock plug-in. With
SynthRock, interpreters can combine forward
modeling, rock physics and inversion to create and
use forward models in qualitative and quantitative
seismic interpretation studies. New SynthRock features within OpendTect 5.0 will include the ability
to generate synthetic gathers from input volumes
of density and P- and S-wave velocities.
Meanwhile, post-OpendTect 5.0 developments already have started. The interactive 2-D
HorizonCube workflow developed within the
SSIS consor tium will be the basis of
OpendTect’s next-generation 3-D HorizonCube
algorithm. The same workflow also will form
the basis of an overhaul of dGB’s conventional
amplitude and similarity-based horizon trackers.
This new development is being funded by BG
Group and will be released within the opensource part of OpendTect, enabling all seismic
interpreters to benefit.
Visit dGB at booth 1852 for more information. n
P R E V I E W | O C T . 2 7, 2 0 1 4 | E & P DA I LY N E W S
5% to 8% Recovery? Understand and Account
for Variability and Watch EUR Climb
Workflows connect reservoir characterization and engineering to production with validation through microseismic mapping.
Contributed by SIGMA³
he only thing constant is change. If we’ve learned
anything from that cliché over the past several
years, it’s that unconventional reservoirs seem to delight
in challenging us in an equally paradoxical way. From
Texas to China, Argentina to Kuwait, and North
Dakota to Poland, shale reservoirs remind us that variability is the constant we have to deal with— whether
by reservoir properties, completion, stimulation strategies, microseismic response, IP or EUR.
Some U.S. operators estimate recovery rates of 5%
to 8% due to this challenge, but thanks to step
changes in reservoir characterization modeling, horizontal drilling, new completion techniques and stimulation processes, and accurate microseismic data,
operators can now do more than just scratch the surface of these resource-rich shale reservoirs. Above
all, it is the integration of these discrete technologies
that adds the most value.
T
Manage reservoir
variability through
integration
Successful shale development requires a level
of subsurface understanding that can only
be achieved through an
integrated workflow
that turns key reservoir
properties into a predictive model that precisely targets the areas
that will yield maximum EUR when Integrated reservoir characterization workflows that enable real-time frack data and microseismic events to be processed,
effective completion interpreted and visualized in tandem with the earth models, well geometries and geomechanical properties help operators
and stimulation cam- know where to drill, where to frack and how to frack. (Image courtesy of SIGMA³)
paigns are applied. This
identifies where the bit needs to go and is the frame- hazard avoidance, wellbore azimuth and inclination,
work from which all key decisions—well placement, well spacing to completion technique, fracture spacing, and treatment type—are made.
Since most of the effective permeability in a
shale well is created during hydraulic frack stimulation, which is an engineering activity, integrated technology that addresses geology,
geophysics and geomechanical rock properties
and the role of natural fractures is the key to targeting sweet spots before the fracture spread
arrives at the wellbore.
“Integrated GeoEngineering provides a direct
link between geoscience and engineering needs,
including the ability to predict well performance with a high degree of confidence and
pinpoint the richest targets before drilling
begins and then validate the findings in real
time,” said Jorge Machnizh, SIGMA³ CEO.
“This helps operators optimize costs and
improve the outcome of each well.”
Identify sweet spots, estimate horizontal well production
Using the proprietary CRYSTAL platform,
SIGMA³ has delivered integrated 3-D reservoir models to identify sweet spots and predict
production of blind wells. By leverag ing
reflection seismic with geologic well data, production data and any available reservoir information, SIGMA³ delivers Shale Capacity
models created from key reservoir properties,
including natural fractures, brittleness, total
organic carbon content and porosity, to
demonstrate reservoir heterogeneity and variable well performance. This workflow allows
GeoEngineers to build models that connect
microseismically derived stimulated reservoir
volumes to actual produced volumes in the
context of reflection seismic, geologic and well
log data. This 3-D model helps identify subsurface properties that predict microseismicity,
frack success and ultimately production.
Users have validated the results of the Shale
Capacity models against known production in
other nearby wells and see consistently 80% to
90% confidence factors of the distribution and
variability of the primary geologic drivers controlling production. Seismic- and well logdriven fractured reservoir characterization is
able to significantly increase the probability of
drilling the best producing wells while reducing
the risk of drilling poor producers in both
exploration and field development scenarios.
Meaningful interpretation, optimized engineering
The relevance of microseismic events—how they
can be used as a proxy to qualify the stimulated
rock volume and ultimately production—along
with optimal well and frack design is what transforms average wells into exceptional producers.
See EUR continued on page 28
12
>>
P R E V I E W | O C T . 2 7, 2 0 1 4 | E & P DA I LY N E W S
Improving the Quality of Prestack Seismic Data
Sequentially assembled algorithms aim to preserve the relative AVO relationship.
By Francisco Bolívar, Rock Solid Images
ost seismic data are processed to optimize the
image quality for post-stack qualitative structural interpretation, with little regard to preserving
characteristics needed for successful quantitative
interpretation. Frequently, these kinds of seismic data
might be improved through the application of specialized tools in the prestack time-migrated common depth point gather domain. Beyond the
in-depth science of the algorithms, the quality-control (QC) processes involved after each step ensure
that the results from the final workflow form a
robust and reliable input for analyses such as amplitude vs. offset (AVO)/amplitude vs. angle, amplitude
variation with angle and azimuth, and seismic amplitude inversion.
In the past, seismic processors would have minimal
information about the geology of the survey area.
Today, integration of geophysical, geological, petrophysical and rock physics components with signal
analysis plays a fundamental role in successful geoscience studies with E&P goals.
M
14
FIGURE 1a. Full-stack well tie and comparison data between input, conditioned
and synthetic gathers are shown. (Images courtesy of Rock Solid Images)
A standard conditioning sequence begins with a
noise analysis step to identify random and coherent
noise that should be removed and other defects in
the gathers such as residual moveout or undesirable
amplitude or frequency behavior. The multiples are
modeled by a high-resolution, laterally/vertically
variable parabolic radon transform and are subtracted
from the input data. AVO extractions, amplitude
spectrum comparison and differencing seismic data
FIGURE 1b. Before application of the AVATAR workflow, interpretation
of AVO gradient would be challenging (left panel). Once the seismic
data have been conditioned, the AVO gradient response at the well
location is clearer, and interpretation of surrounding AVO gradient
anomalies is possible.
before and after this process ensure the preservation
of the primaries.
A residual normal moveout (RNMO) analysis is
then carried out. The goal is to minimize the AVO
gradient assuming that the gradient due to improperly aligned events is much greater than the gradient due to fluid effects. After this correction,
RNMO volumes are visualized to examine
trends in the moveout corrections and verify
patterns. It is extremely important to compare
synthetic gathers side by side with actual gathers for any residual velocity analysis or flattening algorithm. Rock physics analysis provides
the analyst information about the expected
AVO class(es) in the area so that any special
considerations can be taken into account to
preserve them.
In the example shown in Figure 1a, spectral
balancing followed by random noise removal
was applied at the end of the workflow. GaborMorlet joint time-frequency analysis is used to
separate the frequency spectra of each gather
trace into a user-specified number of subbands, calculated using a running Gaussianshaped window that yields a slowly varying
amplitude profile of each sub-band. Then each
sub-band spectrum is balanced against that of
the pilot trace.
Comparison between far angle stacks before
and after the process demonstrates the
improvement and impact of this step, but a
simple amplitude spectrum analysis provides a
clear metric of the results. The last step consists of applying an offset domain signal-tonoise (S/N) enhancement routine that
preserves any AVO effects in the gathers. It
takes into account the spatial dip of coherent
reflections so that frequency and continuity
are preserved.
The conditioning sequence is completed
with a final QC analysis at the top of the
reser voir. Hor izon amplitude extractions
from seismic gathers and stacks and their correlation with geological features before and
after the entire workflow, crossplot analysis of
synthetic and actual par tial angle stacks
before and after the conditioning, and S/N
ratio compar ison will help to gauge the
improvement made to the seismic data
(Figure 1b).
This example demonstrates the impact
AVATAR can have on seismic, applied
prestack or post-stack. Figure 1b illustrates the
improvement in AVO gradient after application of the AVATAR gather conditioning
workflow. Cleaner, clearer data per mit
improved and more rapid manual or semiautomated interpretation of reservoir architecture,
superior well ties, more robust inversion for
reservoir properties and improved property
prediction. AVATAR conditioning also seeks
to be a cost-effective alternative to new acquisition or full reprocessing.
Visit Rock Solid Images at booth 2538 for
more information. n
P R E V I E W | O C T . 2 7, 2 0 1 4 | E & P DA I LY N E W S
Seismic Facies Analysis Using
Generative Topographic Mapping
Using pattern recognition to study the shape and character of seismic waveforms can reveal seismic facies variation at the target level.
By Satinder Chopra, Arcis Seismic Solutions,
and Kurt J. Marfurt, University of Oklahoma
he shape and character of the seismic waveform
often is used to characterize reservoir quality.
Such a seismic waveform carries information about
the phase, frequency and amplitude; any variation in
these parameters is a function of the lateral variations
in lithology, porosity and fluid content. If the shape
and character of seismic waveforms in a given target
zone can be studied using some type of pattern
recognition process and then displayed in a map
view, the display would indicate seismic facies variation at the target level.
One approach to pattern recognition is with the use
of neural networks to compare seismic waveforms
within the interval of interest with a series of synthetic
traces. These synthetic traces are generated according to
the user-defined number of groups that best represent
the different shapes in the interval.They are arranged in
a progression (assigning numbers to these traces), which
is examined to get a feel for the shapes of the waveforms. Next, each trace in the interval is compared
with the different synthetic traces. Those traces that
have maximum correlation with a given synthetic trace
are classified into a group. The resulting map is essentially a facies map or a similarity map of the actual
traces to the different synthetic traces. This technique is
commonly referred to as a self-organizing map (SOM)
waveform classification, originally introduced by
Kohonen and subsequently extended into 2-D and 3D subspace. Using seismic attributes such as amplitude
envelope, bandwidth, impedance, amplitude vs. offset
slope and intercept, dip magnitude and coherence,
attempts have been made to project them into 2-D
latent space and plot the results with a 2-D color bar.
More recently, a 3-D SOM multiattribute application has been developed to generate a 3-D seismic
T
A team from Arcis Seismc Solutions
and the University of Oklahoma
applied GTM to a 3-D seismic volume from central Alberta, Canada,
where the focus was on the Mannville
channels that are filled with interbedded units of shale and sandstone at a
depth of 1,150 m to 1,230 m (3,773 ft
to 4,035 ft). On the 3-D seismic volume, these channels show up at a
mean time of 1,000-plus ms or minus
Stratal slice at a level close to a horizon picked at 1,020 ms from (a) coherence volume computed
50 ms. The team used the sweetness,
using the energy ratio algorithm, (b) GTM1, (c) GTM2 and (d) cluster points from the cross-plot of
GTM1 and GTM2 attributes within two polygons—one in red and the other in green—that are projected gray-level co-occurrence matrices
(GLCM) energy, GLCM entropy,
onto the coherence stratal slice, highlighting different channels. (Image courtesy of Arcis Seismic
GLCM homogeneity, peak frequency,
Solutions and the University of Oklahoma)
peak magnitude, coherence and
impedance attributes and derived GTM1 and GTM2
facies volume. The different mathematically indepenoutputs. These attributes provide the cluster locations
dent input attributes determine the dimensionality of
(projection of the mean posterior probability of the
the latent space. The input data vectors are first nordata vectors) along the two axes in the latent space to
malized and then projected into the 2-D latent space
be used in the cross-plotting that follows.
using principal component analysis (PCA) in the form
Figure 1a shows a coherence stratal slice distinctively
of eigenvalues and eigenvectors. As part of the training
exhibiting the different channels. Figures 1b and 1c show
process, each vector is chosen at random and comthe equivalent displays for GTM1 and GTM2 attributes.
pared to all the other vectors on the 2-D latent space
Breaking the 2-D latent space into two components
grid in a neighborhood radius, and the vectors with
allowed the team to use modern interactive cross-plotgood correlation are updated. Next, smaller neighborting tools. While GTM1 shows the definition of the
hoods around the correlated vectors are also updated,
edges very well for the channels, GTM2 exhibits the
and gradually the neighborhood radius is shrunk iteracomplete definition of the channels along with their fill
tively. If there are five attributes and a 2-D latent space
in red and blue. In a narrow zone passing through the
is being used, the initial PCA plane is deformed into a
center of the channels, the GTM1 and GTM2 attributes
2-D nonplanar manifold (or surface) in 5-D space that
were cross-plotted. Then, by assigning red and green
best fits the data. Colors are assigned to the vectors
polygons on two clusters (not shown), the team noticed
according to their distance from the center of a given
how the enclosed points were projected back on the
cluster of points. In this way a 3-D volume of facies is
coherence displays shown in Figure 1d. The two clusters
generated. The generative topographic mapping
highlight the fill of the channels differently. Similar appli(GTM) algorithm is a nonlinear dimension-reduction
cations of GTM analysis to other datasets from Alberta,
technique that provides a probabilistic representation
Canada, have shown encouraging results. n
of the data vectors in latent space.
Wikithon 2014: Advancing the Future
of the Science of Geophysics
SEG gathering seeks to connect those who are passionate about applied geophysics on a wiki forum.
By Isaac Farley, SEG
s the manager of the SEG Wiki, I have challenging and fulfilling work that fills my day. Luckily,
I am sur rounded by a great team within SEG
Publications (most notably Andrew Geary, SEG Wiki
editor) to help meet the goals of connecting those
passionate about the science of applied geophysics,
providing the necessary tools to make lasting contributions and advancing the mission of SEG. Beyond
the core wiki team, our volunteers transform our
work into an exceptional community asset. We’re all
lucky to have the support of John Stockwells, Karl
Schleichers and Matt Halls, who invest so much into
the resource.
If you have visited the wiki to read a biography
(wiki.seg.org/wiki/biographies) of a former SEG award
winner, you should thank John Stockwell. He’s poured
hundreds of hours of time and energy into these pages.
If you have found a useful open dataset
(wiki.seg.org/wiki/open_data) for your research, stop Karl
Schleicher at the annual meeting in Denver and shake
his hand. If you’re enjoying the The Leading Edge geophysical tutorial series (wiki.seg.org/wiki/geophysical_tutorials) or need access to the newly launched, freely
available book “Seismic Data Analysis” in the wiki
(wiki.seg.org/wiki/seismic_data_analysis), let Matt Hall
know—he’s been instrumental in both and, like
Stockwell and Schleicher, so much more at wiki.seg.org.
A
16
“Our community needs this resource,” Hall said.
“Now it’s up to us to increase the momentum and
build an open, collaborative resource that will benefit
all geophysicists for decades to come.”
I invite you to join us at the 2014 SEG Wikithon
this week. The second annual wikithon will be held
daily from 12 p.m. to 2 p.m. and from 5 p.m. to 6
p.m. Sunday, Oct. 26 to Wednesday, Oct. 29 in room
708 of the Colorado Convention Center. Visit
wiki.seg.org/wiki/wikithon_2014 for more information
about the event.
What’s a wikithon?
Perhaps I should take a step back. If my previous wikirelated conversations are any indication of what you
are currently thinking, the two most popular questions
among readers might very well be: Wait, what’s a wiki?
And: Did you say wikithon? Those are perfectly valid
questions and the type that we welcome at
[email protected] or during the 2014 SEG Wikithon.
Ward Cunningham, the developer of the first wiki
software, used the Hawaiian word “wiki,” meaning
“quick,” to convey his vision for building the simplest form of a working database. Today, in the digital
sense, a wiki refers to an online application that is
maintained collaboratively by people through content modifications (oftentimes quick contributions)
as an asset for a larger community. If you’ve yet to
benefit from the wiki collaboration of Stockwell,
#WIKITHON14
Goal
To connect those passionate about the science of applied geophysics and provide the
necessary tools to make a difference
Who
All SEG members and participants at the
annual meeting, regardless of wiki experience
Location
Room 708, Colorado Convention Center
Time
12 p.m. to 2 p.m. and 5 p.m. to 6 p.m. from
Oct. 26 to 29
Schleicher, Hall and others, I invite you to take a
look. If we are missing entries or entire topics that
you believe would be an asset to your community,
there is the wikithon. There is the wiki. Join us!
The wikithon, purposefully designed as a participant-driven meeting, is a physical gathering of likeminded SEG members joining to advance individual
See WIKI continued on page 28
>>
P R E V I E W | O C T . 2 7, 2 0 1 4 | E & P DA I LY N E W S
Second-generation System Provides
‘Maximum Value and Minimum Effort’
Rock physics information management system has been installed at two of the world’s supermajors and is being deployed by other companies on a global basis.
By Paul O’Brien, Ikon Science, and Rachel Blackman, Fuse IM
n many settings, rock physics information tends
to be stored either in an ad hoc fashion or in
proprietary formats, making it complicated and
inefficient to archive, query, retrieve or share with
others. The Ikon MetaStore is a complete rock
physics information management system designed
to mitigate these inefficiencies.
Jointly developed by Ikon Science and FUSE IM,
the system has a web-based front end and can run
either on a company’s intranet or as a fully enabled
cloud system that can be accessed by any webenabled device.
In its first year, the MetaStore already has been
installed at two of the world’s supermajors and is
being deployed by other companies on a global basis.
The system is designed to store a wide variety of
rock property data as well as many other data types,
allowing users to investigate information from a rich
variety of sources. The system also has the capability to
handle complete projects and data from other applications, allowing companies and users to search and
access all geospatially located data assets from a single
online repository using a detailed map interface.
Martyn Millwood Harg rave, CEO of Ikon
Science, said, “The current version provides safe
storage for all RokDoc project data as well as data
from lots of other sources and allows users to search
both geographically and geologically for data in a
flexible and customizable way, giving our customers
a really new and innovative way of engaging with
their data for maximum value and minimum effort.”
The system allows administrators to enable configurable levels of access for selected groups or indi-
I
Standardized rock physics format
Rock properties are stored by lots
of companies in various formats
(Excel, PDF, CSV, XML and propr ietar y databases). There is a
widespread desire to move toward a
more standardized format, which
would at least be partially accomplished by moving properties to a
single database, and the Ikon
MetaStore is well positioned to
facilitate this process.
MetaStore 2.0 will introduce the
The Ikon MetaStore cross-plotter delivers understanding of regional trends. (Image courtesy of Ikon Science) ability to manage and load rock
properties data from a wide variety
of data sources, including company internal spreadvidual users for security and governance purposes.
sheets, documents, text files and databases. It also will
This provides users with an overview of available
include enhanced searching, visualization and analytidata within a specified geographical location,
cal tools (e.g. matrix cross-plots, rose diagrams and
domain, asset or other variable parameters.
well trajectory plots with markers) for working with
Data can be uploaded from documents (.pdf, .doc,
data across projects in a global operating environment.
.ppt, .xls) as well as vector and geomechanical data
It also will store the managed data in an industry stanand can be associated with the correct assets, wells,
dard cor porate database based on the public
fields and basins.
petroleum data model (PPDM).
In the same way that many mass consumer sites
“PPDM is an important foundation component in
operate, users have the ability to quickly identify and
XStreamline, our open, integrated E&P data managelocate data based upon specific search criteria and
ment environment,” said Jamie Cruise, FUSE IM
then export those data as LAS or other format files
director of products and technology and solution archifor input into other systems like RokDoc or
tect. “It has a strong community and is constructed
Schlumberger’s Petrel using a “shopping basket”
largely from generic commodity infrastructure.We supcheckout approach.
plement PPDM with our tools to deliver the specialist
The system provides automated workflows to
upstream functionality that the industry needs to fulfill
generate reports and guided workflows to make it
demands for vendor-neutral standardization.”
easy to both upload and retrieve data, with audit
trails captured on previous versions of projects and
the ability to retrieve old projects if necessary.
See SYSTEM continued on page 30 >>
Multiattribute Seismic
Analysis Platform Can
Reduce Exploration Risk
Updates to a multiattribute seismic analysis platform include a new and
larger geoscience workspace and enhanced well-loading performance.
Contributed by Geophysical Insights
eophysical Insights has released the commercial availability of Paradise 2.0,
the multiattribute seismic analysis platform, which will be announced at
SEG 2014.
Some of the more significant changes in Paradise 2.0 include:
• New and larger geoscience workspace, providing space for future workflows;
• Easily customizable themes and backgrounds;
• Horizon ghosting—move a shape of the horizon in time or depth;
• Horizon stratal slices—create a slice between two horizons and move it in
time or depth;
• 2-D color bar support for self-organizing maps (SOM) on horizons
and grids;
• Principal component analysis (PCA) on attributes delimited by horizons;
• Running an SOM over a larger area than the PCA sample area;
• Saving arbitrary lines as 2-D lines; and
• Enhanced well-loading performance.
“The concept of analyzing multiple attributes simultaneously and thereby gaining greater insights from the seismic response is being widely received by the
industry,” said Tom Smith, president and CEO of Geophysical Insights. “Paradise
2.0 is a major advancement for the platform, positioning the technology to host
many new geoscience workflows and capabilities we have planned for 2015. I
invite interpreters to drop by our booth and find out why Paradise is unique in
the application of advanced pattern recognition methods and how these methods
can be used to reduce exploration risk and field development cost.”
Geophysical Insights will have a series of presentations daily at booth 2163 by
geoscientists and interpretation software specialists. Printed schedules of presentations are available at the booth. n
G
18
P R E V I E W | O C T . 2 7, 2 0 1 4 | E & P DA I LY N E W S
Building Better, More Accurate
Earth Reconstructions
Seismic inversion algorithm can be applied to post-stack and prestack data to recover rock properties.
By Dave McCann, ION Geophysical
hen ION Geophysical embarked on the task of
building a new inversion algorithm that would
more accurately reconstruct the Earth, the company
went back to first principles. This meant looking at
the various depositional environments and the distributions of impedance contrasts. What was determined
was that commercially available inversion algorithms
assume a Gaussian distribution that does not adequately represent the broad range of impedance contrasts observed in geology. A different approach was
needed. Based on that realization, the company developed its new inversion algorithm, PrecisION.
In every geologic province, obtaining an understanding of the rock properties is essential for successful operations. Unfortunately, there is a significant
difference between what can be predicted from seismic data and what can be seen in a well. Built with
insights derived from actual earth and physics data,
PrecisION is a novel seismic inversion technique
W
that can be applied to post-stack and prestack seismic data to recover rock properties.
When compared to commercial software, the new
algorithm can provide superior earth reconstructions
with greater accuracy and resolution. This is very
helpful in clearly identifying layer boundaries necessary for prospect evaluation, drill planning and reservoir modeling. The inversion algorithm performs its
analysis in the Eigen domain, a province in which
usable information is easily separated from noise to
produce very stable inversion results.
Within the Eigen domain, independent signals are
naturally segmented into various Eigen vectors. Due
to algorithmic parameterization, the Eigen vectors
are inverted are for Vp, Vs and density. This approach
is advantageous because the algorithm determines
whether or not the offsets and signal-to-noise ratio
will allow for the successful inversion of Vs and density. It also yields an uncertainty volume associated
with each of the parameters that can be inverted.
This uncertainty volume also can be used to quality-
Figure 1. Inverted shear impedance (top) and its 95% confidence range
(bottom) are shown. (Image courtesy of ION Geophysical)
check the processing and ensure the highest possible
quality. These advantages can be used to aid in the
evaluation of prospect risk and decision-making.
Figure 1 shows the inverted shear impedance from
one of ION’s studies. The impedance values range
from a low of 12,000 to a high of 44,000. Below the
shear impedance image, a related image can be seen
that identifies the uncertainty of the inversion. For
See EARTH continued on page 30
>>
Gathering
Seismic
Data Using
Hybrid Radio
Telemetry
A seismic recording system can deliver
uninterrupted seismic crew productivity
and effective data storage.
Contributed by Wireless Seismic Inc.
odern seismic recording instruments fall
into two camps: cabled and cablefree.
Cabled systems have long been the default system of choice, recording data in real time and
allowing operators to continuously gauge and
control the condition of the spread.
M
A screenshot of the RT System 2 Central shows WRUs in green collecting data in real time. The blue WRUs designate lost radio connectivity while continuing to record and store data to flash memory.
Production continues with no data loss. (Image courtesy of Wireless
Seismic Inc.)
This choice comes at a price. The cables that
enable instant data transmission are cumbersome
to move around and need to be in perfect condition to function. The difficulties in transmitting high-bandwidth data through miles of
cables and thousands of connectors can result in
significant downtime while troubleshooters
check the spread for problems and make repairs.
This downtime reduces the working day and
crew productivity.
See HYBRID continued on page 30
>>
E & P DA I LY N E W S | O C T . 2 7, 2 0 1 4 | P R E V I E W
19
Seismic Interpretation and Cognitive Cybernetics
Software provides a geological expression approach to seismic interpretation.
Contributed by ffA
n 2014, the E&P industry is expected to spend
about $10 billion on acquiring and processing seismic data, producing about 10 petabytes of new data.
Interpreting such volumes of data is a huge challenge, particularly when correctly identifying and
understanding subtle geological variations can have
such a large impact on prospect risking, production
optimization and strategies for maximizing recovery.
The usual approach to solving such challenges is
automation. However, the essence of interpretation
is to convert incomplete and often ambiguous data
into an accurate understanding of a geological system and then be able to communicate that understanding so that it can be used effectively to guide a
complex decision-making process. Automating this
process fully is extremely difficult since understanding is a human quality that comes from assessing
information in the wider context of a priori knowledge and past experience.
However, the process of gaining geological
understanding from seismic data can be made much
I
20
40% of prime cortical real estate
is devoted to vision. Things that
are taken for granted, such as
the ability to instantly identify
and classify objects—despite
enormous differences in their
morphology, size, color and orientation—are still almost
impossible to mimic using computers. This is a critical factor in
seismic inter pretation, where
there is a need to identify geolog ical features whose realworld and seismic expressions
can vary enormously.
Another important cognitive
GeoTeric from ffA uses an understanding of human cognition to deliver greater subsurface understanding
property is the ability to recogand productivity gains in seismic interpretation. (Images courtesy of ffA)
nize an object through connecting disparate elements in a scene. However, the
more efficient if the way that interpretation techhuman visual system can be fooled, as the number of
nology is designed is informed by the knowledge of
optical illusions testifies. In particular, people’s perhuman cognition.
ception of size, boundary positions and the spatial
In many respects, the human brain is still the
relationship between objects in different scenes is
most powerful information analysis tool, and up to
highly subjective. What this means is that seismic
data need to be presented to interpreters in such
a way that they can use their cognitive abilities
to the full capacity.
For this reason, cognitive cybernetics is at the
heart of the geological expression approach to
seismic interpretation on which ffA’s GeoTeric
software is based.
Using a knowledge of cognitive cybernetics
in designing interpretation software requires
specific attention to be paid to interactivity.
Cognitive cybernetics refers to the feedback
loops that control how people update their
understanding of a situation as they get more
data. This works most efficiently if information is updated at the correct rate. For example, ideally, software needs to work at the same
pace as the cognitive process. Two areas in
which cognitive cybernetics has a major role
to play are in optimizing attribute generation
and object delineation.
There are three data-comparison techniques
that can be used to make the most of visual cognitive abilities: juxtaposition, superposition and
explicit encoding. These three techniques are at
the heart of GeoTer ic’s example-dr iven
approach to seismic noise filtering (noise expression) and fault imaging (fault expression).
In fault expression, juxtaposition is used to
allow side-by-side compar ison of multiple
parameter choices, while superposition is used to
allow the preferred fault image to be compared
to the underlying seismic reflectivity data.
Explicit encoding enables multiple pieces of
fault-related information to be viewed simultaneously, providing a more complete picture of
the imaged fault network. This example-driven
or cognitive cybernetic approach makes it possible to get an optimal fault image in seconds
rather than days or weeks.
Explicit encoding is perhaps the most powerful data-comparison technique available. As a
result, RGB color blending is rapidly becoming
a mainstream element of seismic interpretation
workflows. However, color blending only partially leverages the advantages that can come
from approaching seismic interpretation from a
cognitive cybernetics perspective. For example,
using techniques such as the adaptive geobodies
and facies classification functionality (IFC+) in
GeoTeric makes it possible to construct a 3-D
geological model extremely fast, fully honoring
the information in the seismic data.
Overall, building an understanding of cognitive cybernetics into the software development
process can transform seismic interpretation
and can provide the technology necessary to
turn a mountain of data into a wealth of subsurface understanding. n
P R E V I E W | O C T . 2 7, 2 0 1 4 | E & P DA I LY N E W S
New Crews, New Technology
A deal with CGG will enable Geokinetics to be the largest land seismic contractor in North America.
By Rhonda Duey, Executive Editor
here are deals, and then there are big deals. The
recent announcement that Geokinetics has signed
a binding agreement with CGG for the purchase of
the latter’s North American land seismic contract
acquisition business is a very big deal indeed.
Geokinetics filed for Chapter 11 bankruptcy in
March 2013, emerging from the process one month
later. The move will increase its presence in Canada
and the Lower 48 and give it a presence in Alaska
again, which it moved out of in 2011. CGG will
retain its multiclient land library, but its multiclient
team will use Geokinetics crews exclusively for
acquisition of these datasets for six years.
In return for the “contribution” of its North
American land business, according to CGG, the French
company will retain a 16% equity in Geokinetics.
The deal is considered to be a sweet one by
both companies. It enables Geokinetics to double
the number of marketed land crews in the region
while retaining experienced CGG staff, and it is
part of CGG’s strategy to “refocus and reconfigure
the worldwide perimeter directly operated by
our land business line,” according to CGG
CEO Jean-Georges Malcor. “This combination will offer our North American customers
an unprecedented opportunity to meet their
expectations for performance, technology and
flexibility. As for CGG, I am convinced [the
land group], in its new configuration, will be
able to better seize future opportunities and
to contribute strongly to the group’s continuing success.”
According to David Crowley, Geokinetics
president and CEO, this agreement might seem
to be somewhat contrarian. “The Lower 48
states over the past three years have certainly
shown a decline in land seismic crew activity,”
he said. “Canada has gone through a rough spell
over the last two seasons, and although Alaska
has shown a recent uptick, it’s been reasonably
flat over the past two or three years.
“We emerged from our Chapter 11 filing a
year ago, we’ve looked at what markets we
wanted to invest in and why, and the argument
against North America is that it’s not very consolidated; there’s a lot of competition. But there’s
also ready access to capital, talent and technology in this key market.”
Crowley added that Geokinetics was trailing
some of its competitors in its investment in
cableless equipment, which was affecting its
ability to compete. “We thought that our
knowledge base, the way we design the shoots,
the way we manage contracts and our reputation in the industry are such that if we could get
access to this newer technology and increase our
scale and footprint, we would then compete at a
much higher level.”
The company set forth to acquire the new
nodal systems and managed to access 60,000
from a local manufacturer. Then came the CGG
opportunity, with an additional 35,000 nodes. It
also brought CGG’s brand and reputation.
“They differentiate through technology and
operational excellence,” Crowley said. “For me
the driver was to get critical mass in something
that’s scalable in Canada, get further scale in the
Lower 48 and then reenter the Alaskan market.”
Due to CGG’s joint venture with Fugro owning Seabed Geosolutions, a direct competitor
with Geokinetics in shallow water, the company
can’t take any controlling interest in
Geokinetics, although it does have the option to
increase its stake to 19.5% at a later date. He
likes the relatively low-risk aspect of the transaction as none of the markets are new to
Geokinetics. “We won’t be able to say in the
future how surprised we were and that we didn’t
know the market was like this,” he said. “We live
in these markets.”
T
David Crowley is president
and CEO of Geokinetics.
And though the market is
currently depressed, Crowley
doesn’t expect it to stay that
way. “When equipment is flying off the shelves and you
can’t hire enough people to
stay in business, that may not
be the right time to be making
a significant purchase,” he said.
“We have the viewpoint that
there is a lot more upside for
land seismic in North America
than downside based on cur-
rent activity levels.”
Synergies abound. The two companies have very
complementary client bases in North America, with
CGG bringing the supermajors to the table and
Geokinetics working with medium and large independents. They’re also working with an independent
consulting firm to integrate the teams. “We know
they operate their crews differently than we do, so
we’re investing time and effort at the front end to
bring in both sides and decide whether to adopt one
E & P DA I LY N E W S | O C T . 2 7, 2 0 1 4 | P R E V I E W
method or the other or perhaps meld them into a
hybrid scheme.
“We’re also looking at all of the disciplines: how
we manage assets and people, how we design our
surveys, logistics and project management. It’s not a
white sheet of paper. We’ve all been in the business
long enough.”
So far the integration is going quite well, he
added—in fact, the consultants have commented on
the professionalism expressed by the employees. “I
don’t see the social issues that can really kill a deal,”
he said.
While Crowley doesn’t believe in growing for the
sake of growth, the added scale does have its advantages. Having more crews enables more flexibility.
Being larger gives the company a better seat at the
table when working with suppliers. And client feedback has been extremely positive.
“It is an opportunity for both teams to high-grade
their operations,” Crowley said. “And having
recently met the CGG teams and knowing the
Geokinetics teams I have every reason to believe that
our combined future will be brighter.” n
21
Advanced Seismic Solutions
for Reducing Exploration Costs
Seismic workflow technology can accelerate project turnaround while optimizing decision-making around geological and project constraints.
Contributed by Polarcus
ime is money, and in a fast-moving world the
pressure to make quick and accurate decisions
on key exploration milestones is greater than ever.
Polarcus’ RightFLOW can seamlessly integrate and
accelerate every step of the seismic data acquisition
and processing workflow. This includes everything
from the initial survey design to the delivery of final
data products, with the technology able to tailor the
workflow for any given geologic and geophysical
environment. The result will enable users to make
more informed decisions about potential well commitments earlier in the exploration cycle.
This latest Polarcus offering is the result of a data
processing collaboration between Polarcus and
DownUnder GeoSolutions (DUG) that has taken a
fresh look at the entire seismic workflow. The partnership combines the survey design and acquisition
expertise at Polarcus with the processing and imaging expertise at DUG. As a result of that collaboration, Polarcus is deploying DUG’s Insight software
system onboard its fleet of high-end 3-D seismic
vessels. The software system is powered by SGI-engineered hardware, which will enable the company to
offer companies a processing flow designed in conjunction with each companies’ own experts to
address both the specific geological objectives and
the critical time lines for the project.
At the core of any offering will be onboard quality-control (QC) flows to ensure that seismic data
are recorded well within the tolerance specifications
set by the user. Key modules have been specified by
Polarcus’ own field geophysicists and designed by
DUG software engineers to ensure that a full suite
T
operations per second of processing
capacity designed to interface in real
time with the seismic data recording system. The real-time software environment
is interactive and intuitive, meaning no
scripts are required for onboard QC or
processing. The offline processing toolkit
has been specifically designed to allow
production of full-fold migrated 3-D
volumes, incorporating a suite of multichannel noise attenuation techniques
including shallow-water demultiple, 3-D
surface related multiple elimination,
As the result of a data processing collaboration, DUG’s Insight software system will be
highly interactive velocity picking and
deployed onboard Polarcus’ fleet of high-end 3-D seismic vessels.
QC,
Voronoi area regularization and
courtesy
of
Polarcus)
(Image
prestack time migration.
The offering can itself be structured in different
of QC products are produced in real time on a lineways to suit individual user requirements including
by-line basis and offline during the course of acquicomprehensive onboard acquisition QC followed by
sition to monitor surveywide seismic data quality
full onshore processing; ultrafast advanced onboard
and temporal and spatial continuity.
3-D processing followed by a more complex
A significant component of the onboard processonshore processing sequence; or a combined offing flow is the inclusion of DUG Broad, a deghostshore and onshore flow that passes an onboard proing technology that removes the variable amplitude
cessed intermediate dataset to a DUG onshore
and phase distortion caused by the interference of
processing center for more sophisticated multichansource and receiver side ghosts. Variations in receiver
nel noise attenuation, velocity analysis, regularizadepth, source depth, obliquity, sea state and signaltion, and time and/or depth imaging.
to-noise ratio are all taken into account. This results
Polarcus believes that the “right” processing flow has
in a broadening of the spectrum as frequencies supto be considered as part of the overall 3-D survey
pressed by destructive interference have their amplidesign, acquisition and data delivery effort.The essence
tude (and phase) restored. This means that Polarcus
of the concept is that the right processing flow can be
can deliver high-quality broadband data as either
designed for any given geologic and geophysical enviprestack gathers and/or as part of the processing
ronment to provide very high-level processed products
flow producing prestack-migrated volumes.
in as short a turnaround time as possible.
The hardware systems deployed on the Polarcus
Visit Polarcus at booth 2524 for more information. n
vessels will include up to 172 trillion floating-point
Hydrocarbon Prospect
Delineation and
Seismic Imaging
Broadband processing and TTI migration can lead to improved subsalt imaging.
Contributed by TGS
ne of the major challenges for subsalt
imaging in the Gulf of Mexico is the
poor signal-to-noise ratio and the lack of
signal content in the lower frequencies. For
deeper prospecting, the application of modern de-multiple and de-noise techniques is
very important along with protecting and
enhancing the seismic signal toward the
lower frequency. This might contain subtle
geologic information under the salt, which
can better image the pay zone. Correct lateral and vertical positioning of steeply dipping salt flanks is important to define the
closure near the complex salt overhang for
which an accurate velocity model is
needed. Below, a case study discusses where
both of these challenges were addressed to
improve the subsalt imaging with respect to
the legacy processing.
O
Seismic bandwidth enhancement
In addition to applying appropriate de-noise
and de-multiple techniques, a TGS proprietary workflow known as Clari-Fi was
applied to the seismic data to enhance its
overall bandwidth. Clari-Fi is a multistep
workflow that removes both the source and
receiver ghosts, broadens the bandwidth of
22
Figure 1. A depth slice compares the resolution of legacy
vs. reprocessed data.
Figure 2. An inline comparison shows legacy VTI vs. reprocessed TTI data. (Images courtesy of TGS)
the data on both the low and high ends of
the usable frequency spectrum and accounts
for the Earth’s Q compensation effects. For
this reprocessing effort, Clari-Fi proved beneficial in improving the stability of offset
picking during depth-imaging tomography,
which eventually provides a better subsalt
velocity mode and final migration image.
TTI modeling and migration
In this particular dataset, the sediment and
salt structure are in the moderate to steep
dip range. Correct vertical and spatial imaging of steep salt flanks and the sediment
See IMAGING continued on page 30
>>
P R E V I E W | O C T . 2 7, 2 0 1 4 | E & P DA I LY N E W S
Driving HD Evaluation from Imaging
to Interpretation and Modeling
New technologies extend standard workflows and improve accuracy of production forecasts.
By Indy Chakrabarti, Paradigm
hile seismic data acquisition today is done in
high definition (HD), analysis of HD data has
not traditionally kept pace. This is about to change.
With its latest release, Paradigm seeks to provide
users with a return on their HD seismic acquisition
through the analysis of data in HD. Paradigm 14 HD
capabilities span workflows across seismic data processing and imaging, velocity modeling, and seismic
interpretation and include quantitative analysis and
earth modeling.
Paradigm 14 includes advancements in HD processing and imaging that allow users to visualize the
small features, such as fractures, thin beds and small
faults, that are important in the exploitation of modern reservoirs. The release also includes quantitative
seismic interpretation (QSI) technologies that enable
qualification of amplitude prospects to more accurately identify sweets spots in the reservoir. Now, with
the most recent iteration of the release, the company is moving toward HD earth modeling using
the volume-based SKUA-GOCAD modeling
suite. HD earth modeling facilitates high-fidelity
delineation of the most relevant geological features of the subsurface and improves the accuracy
of production forecasts with geologic models that
are closer to reality. By honoring geology and
seismic, users are able to better quantify uncertainty in their reservoir, resulting in lower-risk
reservoir management decisions and more accurate production planning and forecasting.
For greater efficiency when working with
large data volumes, the Paradigm SeisEarth interpretation and visualization solution suite enables
roaming in rendering mode with volumes larger
than GPU memory. Well planning is tightly coupled with SeisEarth, and platform positioning
optimizations have been introduced. Within
VoxelGeo, users can achieve more precise geobody detection results with extended support for
greater than 8-bit seismic volumes. The interpretation solution also strengthens support for production and engineering data through new
displays for casing, perforations and core property
data, and gridding of time-based production data.
Major additions to QSI include synthetic
workflows for all interpretation and seismic characterization applications. These are enhanced
with improved layouts, new checkshot calibrations and new workflows when working with
depth-migrated data. The release also provides
support for full seismic inversion workflows on
the Windows platform. Prestack gather preconditioning, stacking and inversion are available in
both the SeisEarth 3D Canvas and the new 2D
Canvas to support QSI workflows.
New technologies for modeling unconventional plays have been added to the volume-based
Paradigm SKUA-GOCAD modeling suite. These
include microseismic data analysis, stimulation
path generation for better characterization of
complex hydraulic fracture growth and improved
assessment of stimulated rock volumes in lowpermeability reservoirs.
The new SKUA structural uncertainty modeling module enables geoscientists to assess the
impact of fault position and structural uncertainty
on in-place hydrocarbon estimates and production forecasts to overcome uncertainties and
improve forecasting. A restructured volumetric
interpretation capability provides a full 3-D interpretation of all faults and stratigraphic horizons in
the seismic volume to fast-track interpretation
and interpretation validation in depositional
space. Through the use of 3-D paleo-flattening,
geoscientists can extract stratigraphic features
from seismic data that were undetectable until
now, resulting in enhanced geologic accuracy.
W
Geologic interpretation in the Paradigm StratEarth
well log correlation solution has been enhanced with
improved data communication with the Paradigm
Epos infrastructure and data management system.
Geologic interpretation also includes support for
raster logs and zone track improvements, which can
enhance ease of use and streamline workflows.
Automatic and with no configuration required,
Paradigm 14 product installation is simpler, especially
for single users. Numerous connectivity improvements support convenient coexistence with other
geology and geophysics platforms. It is now easy to
transfer interpretations between the Paradigm Epos
infrastructure and Schlumberger’s Petrel software via
RESQML using a dedicated Petrel plug-in.
Similarly, users can transfer data directly from
Geolog to the Petrel software for improved multiteam collaboration on shared projects. These connectors augment pre-existing support to Halliburton
OpenWorks.
E & P DA I LY N E W S | O C T . 2 7, 2 0 1 4 | P R E V I E W
An integrated display of data in the Barnett incorporates seismic data,
horizons, geobodies, karsts, wells and microseimic data. (Image courtesy
of Paradigm)
In other developments in this release, the
Stratimagic seismic facies classification system is the
first Paradigm application to plug in to the Paradigm
Epic open and integrated platform. Additional workflow efficiencies have been achieved by enabling seismic classification results from Stratimagic to be
visualized and used in the Paradigm SeisEarth and
VoxelGeo interpretation systems.
Visit Paradigm at booth 623 for more information. n
23
Achieving Performance Gains
in Seismic Interpretation
New platforms could potentially enable demonstrable gains to accelerate and enhance interpretation processes.
By Christopher McCoy, Lenovo
hen it comes to seismic interpretation, geophysicists understand that time and accuracy
are everything. Any improvements in the ability to
interpret seismic data can lead to faster project completion, which can make the difference in winning a
contract bid or having additional interpretation time
before project inception.
Stephen Dominguez, software developer and
applications engineer at CGG, understands this.
CGG’s Insight Earth application, which the company added to its software portfolio in January 2014,
is advanced 3-D visualization and interpretation
software that greatly enhances seismic interpretation
systems and provides geophysicists with a guided
tool that can automate the fault extraction process,
precisely define salt bodies, deliver fast depictions of
paleo-depositional environments and enable the
visualization of discrete fracture networks in unconventional plays. Running the application on the
Lenovo ThinkStation D30 workstation using
NVIDIA Quadro K5000 GPU technology,
Dominguez and CGG were able to bring the most
complicated structures into clear definition and
deliver superior results for CGG’s global users.
Dominguez is constantly in search of new technologies that can improve performance of the algorithms, processes and workflows in the Insight Earth
application suite. With Lenovo’s launch of its
ThinkStation P Series workstations and NVIDIA’s
launch of its new Quadro K5200 GPU cards in
August 2014, Dominguez realized that these new
platforms could potentially enable demonstrable
gains to accelerate and enhance interpretation pro-
W
cesses. Lenovo’s ThinkStation P900 is a dual-processor workstation built on the latest Intel Xeon processors and includes a highly expansive
motherboard, a Gen 3 PCI bus and a specially
enabled BIOS that can initialize multiple NVIDIA
GPU accelerators. With this new hardware that
includes the introduction of the NVIDIA Quadro
K5200, Dominguez was determined to put these
advanced offerings to the test and find out just how
they would help geophysicists gain the performance
edge they needed.
Working with Lenovo and NVIDIA engineers,
Dominguez mapped out a comprehensive plan to
determine performance improvements in the new
hardware architecture across three key categories:
CPU, GPU and file I/O (disk processing). This
would illustrate the system’s ability to render accurate visualizations using CGG’s advanced Insight
Earth seismic interpretation workflow. His plan
included multiple configurations of Lenovo
ThinkStation hardware and NVIDIA GPU technology because Dominguez felt it was cr itical to
demonstrate both aspects in isolated performance
benchmarks (Lenovo ThinkStation D30 workstation
running Quadro K5000 cards vs. ThinkStation P
Series running those same cards, and so on) as well
as in comprehensive system performance gains to
get a full picture of the capabilities of the new hardware to provide tangible advancements for seismic
interpretation workflows.
“I wanted to see what this new hardware could
really do,” Dominguez said. “This required testing
for virtually every scenario our customers might
face to get an accurate picture of the realizable
improvements in performance and efficiency.”
With the plan in place, Dominguez set to work on
running the benchmarks. Running the application on
the Lenovo ThinkStation P900 with the NVIDIA
Quadro K5200 GPU technology installed,
Dominguez was able to benchmark an overall 15%
performance improvement (geometric mean of GPU
score, CPU score and the I/O score) in Insight Earth’s
ability to process and render seismic data, meaning that
geophysicists using the solution would be able to
complete projects more than 15% faster than was previously achievable. For example, projects estimated to
take 100 days could now be completed in 85 days,
leaving that extra time for additional interpretation,
risk mitigation and any number of tasks that were
unachievable under previous circumstances.
Companies using the Insight Earth software could
now gain a competitive edge in project bidding by
offering 15% faster completion rates done with greater
attention to characterizing the subsurface structure.
“Previous generation hardware was enough to get
the job done, but it is now mainly utilitarian as geophysicists have pushed the capabilities to the limit,”
Dominguez said. n
SEG Challenge Bowl Finals
The Challenge Bowl Finals are an international test of
students' knowledge in the field of geosciences.
Students who participated in regional competitions all
over the world now come down to this final moment
where only one team will take the ultimate grand prize!
Monday, Oct. 27, 3 p.m. to 6 p.m.
Hyatt Regency Denver, 3rd floor,
Centennial Ballroom E
Are You Managing Your
2-D seismic?
New tool set aims to simplify, facilitate data interpretation.
By Gary L. Jones, IHS
n the seismic interpretation world today, 3-D seismic data is the dominant
tool for reservoir characterization and geologic modeling. However, there are
vast areas where 3-D is too expensive to completely cover all of the study areas,
so 2-D data fills that role. These seismic data are used to connect existing 3-D
surveys, analyze basins, map out regional plays and help define geology on a
much larger scale.
To achieve this coverage, the industry is actively acquiring new 2-D surveys and
repurposing many older 2-D surveys to fill the void. This large accumulation of
seismic data brings with it the challenges of managing and incorporating this data
into existing and new projects. IHS Kingdom has long been a user of 2-D seismic
data and recently introduced a new philosophy and tool set to help bring this data
easily and accurately into the interpreter’s world.
Past experience has shown that 2-D data can pose challenges for the user when
reading and loading the data into the Kingdom project. It was clear that the process
needed to be simplified but understood that the process also needed to handle the
inherent complexity of 2-D data. The result is SeismicDirect, introduced in the
Kingdom 2015 release.
SeismicDirect allows for batch loading of clean, well-documented data with
common attributes while incorporating older data with complex formats and minimal information to guide the usage of the files. Often there is little or no information in the file’s metadata to assist the interpreter or data loading technician in
loading the data into a project. SeismicDirect, along with its new SEG-Y viewer
and editor, SeismicExplore, assists in understanding, preparing and cleaning up the
data so it can be served up to multiple projects for interpretation. Once the simple,
straightforward preparation process is completed, the data can be attached to any
number of projects. Required coordinate conversion and datum shifts are handled
automatically with each project, saving countless hours and even days of effort.
During SEG IHS will be presenting the concepts behind SeismicDirect in several presentations. Come and see how you can manage your old and new 2-D data
efficiently and effectively. n
I
24
P R E V I E W | O C T . 2 7, 2 0 1 4 | E & P DA I LY N E W S
What’s Lurking in the Basement?
Illuminating the basement can reveal key drivers of reservoir performance beyond the shale.
By Craig Beasley, NEOS GeoSolutions
s all geoscientists know, the basement is the
foundation upon which all other sedimentary
layers rest, hence its name. Given its role as the foundation of the geologic column, understanding the
basement often can provide explorationists with
cr itical insights into the relative productivity,
prospectivity and economic potential of shallower
horizons deposited above it, including in the reservoir zone(s) of interest.
Geologic activity in the basement, including fault
reactivation, intrusion emplacement and control on
hydrothermal fluid migration, impacts heat flow in
the overlying sedimentary section and ultimately
affects ther mal matur ity in the hydrocarbon
“kitchens.” Oil is the first hydrocarbon type to be
liberated from kerogen as increasing levels of heat
and pressure are applied in the kitchen; oil generation is followed by the subsequent liberation of wetgas/condensate, dry gas and, when “overcooked,”
CO2 and graphite. Knowing which hydrocarbon
type one will be dealing with is an important factor
in exploration decisions and in project economics, especially in shale plays.
A
ment composition were altering the thermal profile in
an area undergoing development drilling. These
changes were responsible for differences in production
rates and especially the Btu content (i.e., liquids vs. gas)
of the flowstreams obtained from newly drilled wells.
NEOS undertook an analysis of several multiphysics datasets—in particular gravity, magnetics and
electromagnetics—and applied workflows that
included simultaneous joint inversions and Euler
deconvolutions. The results, depicted in Figure 2,
proved the hypothesis of this chief geophysicist:
Compositional changes in the basement are better at
predicting the flow rates and Btu content of newly
drilled wells compared to more widely acknowledged
geological and geophysical factors such as structural
setting (e.g., burial depth or shale thickness) or acoustic attributes (e.g., brittleness or fracture density).
This isn’t to say that structural or acoustic insights
aren’t valuable; they absolutely are. But it does imply
that a multiphysics approach—in which a variety of
geophysical measurements are analyzed at depths of
investigation ranging from the basement to the nearsurface—might provide a more constrained subsur-
Figure 2. Marcellus oil (green spots) and gas (red spots) production
draped on a basement model is shown. Correlations are noted from the
basement to the reservoir.
face model and valuable set of related interpretive
products than an approach that relies on only one or
two geophysical measurements or properties.
These multiphysics projects and others that are
being undertaken in reg ions extending from
Argentina’s Neuquén Basin to onshore Lebanon are
helping explorationists better understand the role
that basement faulting might play in influencing
sweet spot locations in unconventional shale reservoirs as well as the impact basement composition
variations have on the relative liquids vs. gas content
of the flowstreams from newly drilled wells. n
Figure 1. In the D-J Basin, Niobrara oil and gas production is related
to basement features. (Images courtesy of NEOS GeoSolutions)
The conventional wisdom that has prevailed
in the petroleum industry for the last 50 years is
that thermal maturity varies in a straightforward
linear manner with burial depth. The shale
boom of the last decade has dramatically
changed that conventional wisdom, as the most
astute explorers now realize that variations in
basement topography, fault networks and composition can all cause localized distortions in the
burial depth vs. thermal maturity relationship.
For example, a senior technical adviser for
one of the largest pressure pumping companies
in the world said at a Denver Rocky Mountain
Association of Geologists luncheon that one of
the key elements in identifying sweet spots in
the Niobrara Shale play of the Denver-Julesburg
(D-J) Basin was, “identifying the location of
basement faults that have been reactivated and
that, over the course of geologic time, have
acted as conduits for hydrothermal fluids that
affected the thermal maturity of the Niobrara.”
NEOS GeoSolutions recently delivered the
results from a 7,770-sq-km (3,000-sq-mile)
multiphysics survey in the D-J Basin and, among
other things, confirmed that this technical
adviser was right. As Figure 1 shows, basementrelated features—including intrusive complexes
and fault-driven horst structures—appear to
correspond to two of the D-J Basin’s more prolific fields, Hereford and Pony. This same multiclient survey, which is available for license to
other E&P operators, identified at least seven
similar basement-related features that, at present,
do not have significant exploitation or production operations underway.
On another project in the Appalachian Basin
covering the Marcellus and Utica shales in
Pennsylvania, a chief geophysicist at one of
NEOS’s clients speculated that changes in baseE & P DA I LY N E W S | O C T . 2 7, 2 0 1 4 | P R E V I E W
25
Creating Exploration Success in the GoM
Integrating 3-D CSEM data with seismic data can increase discovery rates and lower exploration costs.
Contributed by EMGS
ith well data often scarce, many Gulf of
Mexico (GoM) operators today rely on the
structural images and elastic properties derived from
seismic when evaluating the probability of success
and estimating reserves in their prospective fields.
Yet, while this information is crucial, gaps still
remain in the geological model, particularly in
regard to fluid content information and hydrocarbon
volumes. A complete picture of the subsurface only
can be achieved through combining different complementary data sources.
At SEG this year, EMGS will illustrate how 3-D
controlled-source electromagnetic (CSEM) data,
when integrated with seismic data, can lower exploration costs and increase discovery rates in the U.S.
and Mexican GoM.
3-D CSEM surveys map resistive bodies in the
subsurface where, the larger the resistive body, the
greater the response. Integrating electromagnetic
(EM) data into the exploration workflow allows for
a better classification of prospects in an area by
downgrading or upgrading the probability of finding
hydrocarbons and improving the evaluation of the
size of the accumulation.
Mexican operator Pemex, for example, has found
that the integration of 3-D CSEM data into its
exploration workflow has significantly reduced
uncertainties in the evaluation of prospects in the
Perdido Fold Belt and other areas in the GoM.
Since 2010, EMGS has acquired more than
16,000 sq km (6,178 sq miles) of 3-D CSEM data
W
A Wilcox resistivity map (left) and an improved salt body interpretation
(right) show data from the Daybreak survey in Alaminos Canyon in the
GoM. (Data courtesy of TGS)
for Pemex over more than 40 identified prospects.
The results—proven by the drillbit—were revealing
and highlighted how the integration of 3-D CSEM
data with 3-D seismic data can enhance subsurface
understanding, resolve interpretation ambiguity and
reinforce independent observations.
In one case, Pemex identified a prospect located
about 700 m (2,297 ft) below the mud line where the
top of the reservoir interval presented a seismic bright
spot with two associated flat spots interpreted as gasoil and oil-water contacts. Seismic amplitude analysis
indicated the presence of a likely hydrocarbon-bearing reservoir with the main uncertainty being the
hydrocarbon saturation as it was possible that low gas
saturation was producing the bright amplitudes.
In the 3-D CSEM inversion, an anomaly was seen
at the top of the structure that was consistent with the
uppermost part of the seismic anomaly and the first
flat spot in the structure. Together, the integrated interpretation of seismic and CSEM data was an accumulation in a quality reservoir with high gas saturation
down to the first flat spot and low saturation (fizz gas)
farther downdip. This interpretation was later confirmed by a productive gas and dry appraisal well.
In another example from the same survey area,
wide-azimuth 3-D CSEM data were acquired over
the prospect, and no vertical resistivity anomalies corresponded to the proposed target. Instead, a low-resistivity zone over the crest of the structure was present
with the zone suggesting the presence of high-salinity
brine around the faulting. This resulted in an increase
in seal risk and a decreased probability of success.
Adding 3-D CSEM data to seismic data is a highly
effective exploration strategy that is proven by these
and several other cases in the GoM and will be an
important tool preparing for Round 1 in Mexico.
Looking northward, EMGS completed a 1,850sq-km (714-sq-mile) CSEM survey in the Alaminos
Canyon area of the U.S. GoM earlier this year. The
integrated interpretation of CSEM and seismic data
was a valuable tool for companies participating in
lease sale 238 and will continue to play a key role in
future leasing decisions and well placements.
In addition, the ability of 3-D EM data to map salt
bodies and provide improved velocity models for
more robust seismic imaging without scatter and
refraction issues is of particular benefit in this basin.
The exploration landscape is changing. To find out
how EMGS and CSEM data can help reduce interpretation uncertainty, lower exploration costs and
increase discovery rates, visit EMGS at booth 448. n
Understanding Seismic Energy Release and
Implications for Stimulated Surface Area
Multi-array microseismic data reveal that up to 83% of seismic energy released during hydraulic fracturing might be caused by a handful of larger
magnitude events.
Contributed by ESG Solutions
n hydraulic fracturing operations, well production success depends not only on effective well
placement and treatment design but also on the
inherent characteristics of the reservoir, including
geology, local and regional stress conditions, and
the presence of natural fractures. Maximizing production volume requires the successful generation
of complex fracture networks with optimal stimulated surface area, all with good connection pathways back to the well. It is therefore useful to
accurately characterize natural fracture systems and
understand generated fracture behavior within the
formation to optimize operations.
Microseismic, or passive seismic, monitoring has
emerged as a powerful fracture characterization and
production optimization tool for hydraulic fracturing operations. Hydraulic fracturing in naturally
fractured reservoirs is known to generate seismicity
due to the interaction of injected fluids with the
pre-existing fracture network. Typically, the observed
moment magnitudes for such operations are small,
usually with magnitudes less than zero. Microseismic
methods commonly provide information on relative
stimulation volumes and overall fracture dimensions;
however, many advances in acquisition and data processing have provided new ways to visualize and
understand fracture development.
The reliability of typical microseismic geophones
(15 Hz) in accurately detecting larger magnitude
seismicity recently has been questioned, prompting
the addition of lower-frequency geophones to sensor
networks (known as a hybrid configuration) to
accurately characterize events over a wider-magnitude band. The result is a new understanding of the
I
26
total of 4,500 events were
recorded on the downhole
array situated close to the reservoir, ranging in magnitude
from M-1 to M-2.6. The nearsurface network recorded a
total of 28 events ranging from
M-0.4 to M1.4. These events
also were recorded on the
Figure 1. Microseismic events colored by moment magnitude are shown on the left. At right, a microseismic- downhole array; however, the
derived discrete fracture network was obtained using data from a hybrid sensor network. Larger magnitude downhole signals were satuseismic events represent considerably larger fracture surface areas and result in more energy release and
rated and underestimated event
reservoir deformation compared to typical microseismic events. (Image courtesy of ESG Solutions)
magnitude by at least one order
of magnitude.
In the same example, an assessment of seismic
effect of larger magnitude seismicity on reservoir
energy release showed that larger magnitude events
deformation and fracture network development.
detected with the near-surface network accounted for
Figure 1 illustrates the occurrence of seismic
a full 83% of the total seismic energy released during
events between magnitude 0.0 and 0.5 (left image,
the hydraulic fracture stimulations. Additionally, these
red dots) and depicts the resulting discrete fracture
events accounted for another 11,870 sq m (127,768
network generated from the seismic data. Fracture
sq ft) of activated fracture surface area, about 10,295
planes associated with the large-scale seismicity are
sq m (110,814 sq ft) more than would have been estisignificantly larger in diameter (right image, large
mated from the downhole array alone. Overall, the 28
green discs) compared to those associated with typievents as derived from the near-surface network
cal small-scale microseismicity. It is clear that larger
accounted for less than 1% of all the recorded events
seismicity considerably affects the reservoir in terms
but added an additional 4% to the total liberated surof energy release and deformation, often producing
face area when combined with the surface area generfailure planes hundreds of feet in diameter. Accurate
ated by the 4,500 events recorded downhole.
characterization of large events therefore has impliEvaluation of reservoir stimulation over a widercations for understanding stimulated surface areas
magnitude range using the hybrid configuration
and potential fluid connection pathways.
allows for a more accurate assessment of reservoir
Recently, ESG has had multiple opportunities to
deformation and fracturing processes associated with
supplement traditional downhole microseismic
stimulations than would have been achieved using
recording with sparse six- or eight-station near-surtraditional microseismic techniques alone.
face networks consisting of low-frequency sensors
Visit ESG Solutions at booth 2348 for more
during hydraulic fracture stimulations. In one examinformation. n
ple in a North American unconventional shale play, a
P R E V I E W | O C T . 2 7, 2 0 1 4 | E & P DA I LY N E W S
Unlocking the Value of Assets Through
Model-Driven Interpretation
New workflow relies on uncertainty management for reservoir decision-making and can reduce lead times.
Contributed by Emerson Process Management
or all the benefits reservoir modeling has brought
over the last few years, limitations still remain as
to how data are captured and analyzed, the link
between the seismic data and the model, and the difficulties in quantifying uncertainties and improving
reservoir management decision-making.
Too often, there is a focus on just a single reservoir
model despite data supporting different interpretations. There also can be an ambiguity in the seismic
data—especially if only a portion of the earth’s
response is captured within a seismic image or
where there are bandwidth limitations.
Furthermore, the time-consuming nature of the
seismic interpretation and model-building process
(especially with large 2-D and 3-D seismic datasets)
and long lead times in taking the model to simulation can result in delays to reservoir volume estimates
and ultimately to decisions relating to bid valuations,
production estimates and operational plans.
At SEG’s Annual Meeting, Emerson Process
Management will be demonstrating the
potential of reservoir modeling through its
Roxar reservoir management software solution and new Model-Driven Interpretation
(MDI) workflow.
The company’s vision is simple: an integrated,
flexible seismic-to-simulation workflow where
the modeler can move back and forth between
domains (seismic interpretation and structural
modeling, for example), receive instant feedback
on measurements, and capture uncertainty and
increase confidence in reservoir management
decisions from the outset.
In this way, operators can make informed
decisions across the prospect life cycle on crucial
areas such as where to drill, what production
strategies to adopt and how to maximize oil and
gas recovery.
MDI, developed within Emerson’s reservoir
modeling software Roxar RMS, enables modelers to not only create the geological model
while conducting seismic interpretation but, for
the first time, to also capture uncertainty during
the interpretation process.
MDI quantifies geolog ic r isk early and
allows geoscientists to guide and update the
model directly from the seismic and other data.
Rather than creating one model with thousands of individual measurements, the new
workflow enables interpreters to create thousands of models by estimating uncertainty in
their measurements.
Interpreters can use MDI to calculate probabilities for different outcomes with uncertainty
information collected and paired with geologic
features to accurately represent the geologic
structure. Interpreters also can see what parts of
the model are most uncertain and where more
detailed analysis is needed.
So what does the new workflow mean to
reservoir modeling? The benefits can be seen in
the quality of the models and the speeds in
which they are generated.
First, MDI can generate a highly accurate depiction of the geometry and properties within the
reservoir. Geoscientists can guide and update a 3D geologically consistent structural model directly
from the seismic and other data, resulting in a
more complete representation of the reservoir.
A Middle Eastern operator is using MDI to
calculate gross rock volume (GRV) uncertainty
on a high-profile offshore field. MDI is creating
P10, P50 and P90 GRV values that provide
valuable input and reduce risk in future field
appraisal and development plans.
It’s through MDI that early estimates of reservoir volumes can be generated to support future
F
MDI enables users to not only create the geological model while conducting
seismic interpretation but also to capture uncertainty while interpreting.
(Image courtesy of Emerson Process Management)
E & P DA I LY N E W S | O C T . 2 7, 2 0 1 4 | P R E V I E W
commercial decisions. Operators also can make predictions of horizon or fault positions and integrate
these with LWD data and precision steering to
reduce drilling risk.
Secondly, the new workflow can dramatically
accelerate the decision-making life cycle. MDI can
generate a more complete representation of the data
in less time with models updated in real time and
often built on relatively sparse data, with the flexible
but integrated nature of the process ensur ing
increased productivity throughout asset teams.
Leaner asset teams, shorter decision-making
time scales and domain experts are able to quickly
integrate and share knowledge across the prospect
life cycle.
Emerson’s new workflow places uncertainty management at the heart of reservoir decision-making
and can reduce lead times.
Visit Emerson Process Management at booth 759
for more information. n
27
Mile High City Offers Feasting and Fun
Discover all that Denver has to offer from its finest restaurants to its best attractions.
By Ariana Benavidez, Associate Editor, E&P
enver is famous for more than its Mile High
nickname. It’s also known for its breathtaking
scenic beauty, spectacular dining, abundant number
of attractions and the 225-km-long (140-milelong) Rocky Mountains panorama.
Amid the variety of attractions the city offers is
the Denver Museum of Nature and Science, open
daily from 9 a.m. to 5 p.m. at 2001 Colorado Blvd.
Currently, the museum is showcasing its “Whales:
Giants of the Deep” exhibit, which features more
than 20 skulls and skeletons, including that of a 18m-long (58-ft-long) sperm whale. Also on display
is a life-size replica of a blue whale heart that is
equivalent to the size of a car. Admission is $13.
For more information, visit dmns.org.
However, if art better suits your fancy, be sure to
check out the “Matisse and Friends” exhibit at the
Denver Art Museum. The paintings on display are
from the National Gallery of Art in Washington,
D.C., and featured artists include André Derain,
Albert Marquet, Maurice de Vlaminck, Raoul
Dufy, Georges Braque and Kees Van Dongen, in
addition to Henri Matisse. The museum hours are
10 a.m. to 5 p.m. Tuesday through Thursday and 10
a.m. to 8 p.m. on Friday, and it is located at 100 W.
14th Ave. Pkwy. Admission is $13. For more information, visit denverartmuseum.org.
Perhaps after a full day of SEG events, sitting
down to a satisfying gourmet meal sounds like the
more relaxing option. In that case, check out one of
Denver’s top spots for dining: Guard and Grace. This
fine-dining steakhouse located at 1801 California
St. offers more than just succulent beef. Entrees
include Skuna Bay salmon, Hawaiian tuna, Rocky
Mountain trout, prime rib, New York strip, filet
mignon and rack of lamb, among many other
D
The 13th step on the west side of the Colorado State Capitol building is
exactly 1,609 m (5,280 ft) above sea level—one mile high. (Image
courtesy of Dave Falconer and Visit Denver)
The Denver Art Museum is housing a ‘Matisse and Friends’ display on
loan from the National Gallery of Art. (Image courtesy of Steve Crecelius
and Visit Denver)
options. The restaurant is open from 11 a.m. to 10
p.m. Monday through Thursday, 11 a.m. to 11 p.m.
on Friday and 5 p.m. to 11 p.m. on Saturday. See the
full lunch and dinner menus at guardandgrace.com.
If you’d like something with a more casual setting,
try Old Major on 3316 Tejon St. and see why USA
Today named this place one of the 10 best dining
hot spots in Denver. The entrees include a 21-day
dry-aged Colorado rib eye, Block Island swordfish,
lobster, fish and chips, roasted chicken, smoked
country sausage and homemade pasta with clams.
To make a reservation or to view the full menu,
go to oldmajordenver.com.
Want to squeeze in some shopping before leaving the Mile High City? One unique shopping
experience can be had at the Rockmount Ranch
Wear flagship store and museum. Denver’s very
own fashion pioneer Papa Jack Weil invented the
western snap-button shirt and opened his shop in
1946. He sold his shirts to everyone from presidents to rock stars, including Eric Clapton and
Bruce Springsteen. Weil worked daily until he was
107 years old, passing away in 2008. Visit
Rockmount for your very own western-style shirt
souvenir at 1626 Wazee St. in downtown Denver.
Afterward, stroll on over to metro Denver’s No.
1 tourist attraction: 16th Street Mall. The 16-block
mall is packed with restaurants, cafés, public art and
vast shopping options. From bookstores and
charming gift shops to brand name stores, there is
something for everyone. After a long day on the
SEG show floor, shoppers might welcome hopping
on one of the free shuttles that run the length of
the mall. Parking can be expensive and hard to find
due to the popularity of this attraction, so visit
16thstreetmalldenver.com to make online parking
reservations or to retrieve a 16th Street map or
shopping map. n
>> PATHWAY continued from page 3
>> EUR continued from page 12
>> WIKI continued from page 16
intrasalt velocity variations. Inaccuracies in topsalt
interpretation result in errors in positioning base salt,
which in turn degrade the subsalt image. A rugose
topsalt interface demands finer spatial sampling than
is achievable using conventional acquisition techniques—deficiencies that are naturally addressed by
the IsoMetrix system.
Finally, at the subsalt level, reflected waves returning to the surface from deep formations might be
expected to be near vertical. This might question the
need to measure horizontal pressure gradients.
However, modeling studies demonstrate that even
areas of relatively simple subsurface structure and
moderate salt complexity can create strong distortions of the wavefield. Fine-scale isometric sampling
means that such distortions are measured without
spatial aliasing, ensure correct handling through the
data-conditioning stages and can even benefit the
subsalt image directly.
In addition to adequate spatial sampling, it is
well known that azimuth diversity and long offsets
are important elements in ensuring good illumination of subsalt plays. Various acquisition designs
have been used to address this, such as wideazimuth multivessel configurations. Designs based
on the Coil Shooting single-vessel full-azimuth
acquisition technique also are prevalent. These
provide an efficient method of recording fullazimuth data and, when combined with multiple
vessels, also can deliver long offsets. Field trials
performed this summer demonstrate the compatibility of IsoMetrix technology with a wide range
of acquisition techniques to address offset and
azimuth diversity.
WesternGeco is featuring a daily booth theater
presentation highlighting the benefits of IsoMetrix
technology for successfully navigating the pathway
to subsalt plays.Visit Schlumberger at booth 1319 for
more information. n
“Investing in the best downhole acquisition
geometry and leveraging SIGMA3 innovations in
3-D anisotropic velocity modeling and enhanced
signal processing demonstrates high-confidence
event locations delivered in the context of the
earth model,” Machnizh said. “Doing things right
costs money, but it is far more expensive to waste
money on costly nonproductive frack stages by
not implementing a comprehensive integrated science that can be validated in real time.” In partnership with FracGeo, the company is doing
geomechanical modeling that can predict microseismicity before the microseismic data are
acquired and thus can help to better design the
microseismic acquisition and completions engineering to improve success.
When it comes to engineering services integration, determining the best way to complete and
frack is about production response. Operators maximize return on investment by drilling the optimal
number of wells and leveraging their trajectories to
make the most of reservoir properties. SIGMA³
engineers have performed more than 35,000 stages,
including onsite stimulation programs on major producing basins worldwide. Optimized fracturing campaigns lead to fewer costly stages and better recovery.
articles and, in so doing, the shared community
asset. As always, the wikithon is open to all annual
meeting attendees, regardless of wiki experience. Do
you excel at correcting grammar? Are you interested
in connecting SEG entries with one another? Is the
wiki missing photographs (hint: yes)? If you are an
experienced wiki champion, we need you, too.
For several of the wikithon sessions, we will be
joined by staff and researchers representing
Geoscientists Without Borders (GWB). If you are
interested in learning more about their projects or
assisting with launching GWB-specific program
and project wiki pages, we’ll see you in Denver. We
have a good start (wiki.seg.org/wiki/geoscientists_without_borders) but always welcome more help.
If you are reading this and thinking, “Hey, I know
what the wiki really needs,” stop by the wikithon
during the annual meeting and introduce yourself
(or send me an email). I look forward to assisting
you in crafting contributions that advance the science of applied geophysics. If you would like to take
the discussion to the wiki itself, click on the discussion tab on wiki.seg.org/wiki/wikithon_2014. Within
the tab, we appreciate any questions or thoughts you
might have about all things wiki.
28
Manage reservoir variability through integration
Discrete solutions do not address the value of integrated reservoir characterization workflows that
enable real-time frack data and microseismic events
to be processed, interpreted and visualized in tandem
with the earth models, well geometries and geomechanical properties. This is the only way to manage
variability and extract more from shale reservoirs.
SIGMA³ is showcasing Integrated GeoEngineering
workflows, including seismically driven reservoir
characterization, subsurface microseismic, completions and onsite frack engineering, at booth 308. n
Seismic data analysis in the SEG Wiki
Oz Yilmaz’s renowned book “Seismic Data Analysis”
is now fully available as an open-access book in the
SEG Wiki. With its launch, SEG’s two best-selling
books, “Seismic Data Analysis” and “Sher iff ’s
Encyclopedia Dictionary of Applied Geophysics,”
are freely available at wiki.seg.org. I invite you to
evolve, expand and transfor m “Seismic Data
Analysis” to reflect the latest in science and technology via wiki contributions. Join us at the 2014
wikithon in Denver to discuss the new addition of
“Seismic Data Analysis” and the exciting plans we
have for the year ahead. n
P R E V I E W | O C T . 2 7, 2 0 1 4 | E & P DA I LY N E W S
Direct Hydrocarbon Indicators
from Calibrated AVO Stacks
AVO techniques will be integral to the Sergipe Basin exploration cycle.
Contributed by Spectrum
n clastic depositional settings such as the Sergipe
Basin, amplitude vs. offset (AVO) techniques are
important direct hydrocarbon identification tools
for E&P and development teams. Brazil’s National
Petroleum Agency, ANP, recently announced that
the Sergipe Basin will likely be included in Round
13, which suggests there will be considerable
opportunity for additional prospecting in this basin.
AVO analysis will prove to be important as the
exploration cycle expands and progresses to development in this basin.
The Sergipe Basin is a relatively mature hydrocarbon province on the northeast coast of Brazil comprising 44,370 sq km (17,131 sq miles) both onshore
and offshore. Petrobras has made several offshore discoveries since 2010, including the 2010 Barra well
(1-SES-158) and the subsequent Barra 1 appraisal
well (3-SES-165). The wells targeted oil- and gascharged Maastrichtian sandstones that display
readily identifiable AVO anomalies on 2-D seismic profiles.
I
puted by calculating the difference between
the far-angle stack and the near-angle stack
and multiplying the difference by the farangle stack. Angle ranges are used in place of
offset ranges so they are optimized for the
geology and objective depth.
To determine whether AVO attribute stacks
can identify potential hydrocarbon reservoirs,
2-D seismic profiles that tie the Barra discovery
well were analyzed. For each of these profiles
an SPR and FNxF stack were computed, both
of which show visible anomalies for the high An AVO-conditioned stack using 4 degrees to 32 degrees after noise attenuation and
porosity gas-saturated sands found in the Barra residual moveout corrections is shown. The multilegged seismic amplitude anomaly is
bracketed in blue. The projected well path is shown by the green line. (Image courdiscovery well.
Based on the available well data and the 2-D tesy of Spectrum)
profiles covering this basin, AVO anomalies
lower velocity ratios; however, it will highlight
from SPR and FNxF attributes can identify hydroprospective anomalies and cull out leads and
carbon charge in sandstone reservoirs for thick sands
prospects that do not exhibit AVO signatures associwith 18% or higher porosity. This screening process
ated with hydrocarbons. n
will not necessarily eliminate other geologies with
Seismic data
In 2013, Spectrum reprocessed 8,200 km (5,095
miles) of seismic data using modern prestack
time and depth imaging algorithms. The seismic
data were acquired with an 8-km (5-mile)
streamer in 1999, providing a wide range of
reflection angles for quantitative interpretation.
The reprocessing illustrates clear images of
stratigraphic features within the prospective section, and numerous potential AVO anomalies
are evident. Two profiles near the 1-SES-158
Barra discovery well were selected, and the digital logs from this well were incorporated into
the analysis.
Discovery well
The Barra discovery well was drilled in 2010 in
2,341 m (7,680 ft) of water, reaching a depth of
6,510 m (21,358 ft). Porosity and permeability
conditions in the reservoir are excellent at
depths of 4,650 m to 4,750 m (15,256 ft to
15,584 ft), where drillstem tests indicate the
presence of commercial quantities of gas and
condensate. The sandstones encountered in the
Barra well are about 80 m (262 ft) thick, and
well tests indicate a high-porosity gas-charged
reservoir. The accompanying figure shows a
strike line near the Barra 1 well with the AVO
anomaly highlighted by brackets.
AVO attributes
For mid- to high-porosity sandstones encased
in shales or mudstones, gas- and light oil-saturated sandstones can be identified using
AVO techniques with high-quality long-offset seismic data.
Available well data show that the sandstone
in the Barra well has 25% to 33% porosity,
with velocities that are equivalent to or slightly
faster than shale velocities and sand densities
that are less than the shale densities. AVO
modeling indicates a Class 2 to Class 3 AVO
response, depending on the thickness of the
sand modeled. Computed AVO attributes indicate that enhanced gradient (FNxF) and scaled
Poisson’s ratio change (SPR) attributes should
be diagnostic for sands of sufficient thickness.
SPR change is the weighted sum of the
AVO intercept and g radient, where the
weighting is determined by the background
velocity ratio of the geology. The SPR
attribute is a fluid factor AVO attribute that
should illuminate hydrocarbon-saturated
reservoirs and marginalize wet- or brine-saturated reservoirs. The FNxF attribute is comE & P DA I LY N E W S | O C T . 2 7, 2 0 1 4 | P R E V I E W
29
>> SYSTEM continued from page 18
>> EARTH continued from page 19
>> IMAGING continued from page 22
Standardization will allow companies to manage
data for the long term, providing an audit trail of data
loading, identification of data sources, management of
access/entitlements and tagging data quality.
The MetaStore 2.0 beta version includes basic
data management, analytical and visualization capabilities on the PPDM database (supporting both
Oracle and MS SQL Server).
this study, the company displayed uncertainty to
three standard deviations or a 95% uncertainty
range. In this display, the lower values, or red color,
indicate a more reliable value of the inversion. The
yellow color indicates a larger uncertainty, i.e. less
reliable inversion.
A vertical yellow bar to the left of the display also
can be observed—this is an area of limited seismic
coverage, with an associated lower confidence in the
inversion. In addition, for this pass of the processing,
a small degree of residual moveout was left on the
gathers. This can be seen per the uncertainty volume
as yellow spectrum colors that correspond to major
events along the seismic line. This clearly indicates a
need to review the preprocessing of the data.
The key risk in any inversion lies with the quality
of the preprocessing. It’s a simple formula: The
greater the quality, the lower the risk. ION optimizes data quality by embedding a reservoir characterization specialist within the processing team. At
each stage of processing, the parameters selected are
checked to confirm that the resultant data still meet
the stringent criteria necessary for elastic inversion.
By following this rigorous workflow, the company
can reduce the possibility that preprocessing will
yield data inadequate for reservoir prediction. This
would prove a significant risk were the preprocessing done elsewhere.
Through careful preprocessing and the analysis of
uncertainty offered through the PrecisION workflow, ION seeks to improve the reliability of the data
used to predict reservoir properties and related
prospect and/or field economics. n
truncation against the complex salt overhang are very
important to increase confidence while prospect mapping. Analysis of the legacy vertical transverse isotropic
(VTI) dataset showed mis-ties at key well locations
along dipping salt flanks, which established the need
for a tilted transverse isotropic (TTI) approach during
model building. Major steps in the depth-modeling
workflow included calibration of the existing model
with checkshot information, estimation of epsilon and
delta parameters using an automated focusing analysis
and multiple iterations of grid-based tomography for
sediment definition to solve for both the short and
long wavelength features of velocity anomalies in the
model. Both Kirchhoff migration and reverse time
migration (RTM) were used for salt body interpretation and modeling. Broadband processing helped
improve the low-frequency signal in the subsalt, which
generated good-quality picks on the migrated gathers.
For subsalt velocity and model updating, both conventional tomography and RTM-based delayed image
time (DIT) scans also were used.
The future is open
The Metastore has been designed as a fully flexible,
open system with an open door policy to allow vendors to either write data access routines or provide an
API such that any vendor’s data or proprietary rock
property data may be stored, queried and accessed in
the system.
Giving companies the ability to create comprehensive and accessible repositories of their data
assets using open technology shifts the emphasis
away from data management as a passive task and
encourages active engagement with end users.
Demos of the Ikon MetaStore will run daily at
booth 1208. n
Exhibition Hours
Sunday, Oct. 26 (Icebreaker)........6 p.m. to 8 p.m.
Monday, Oct. 27 ..............................9 a.m. to 6 p.m.
Tuesday, Oct. 28..............................9 a.m. to 6 p.m.
Wednesday, Oct. 29.......................9 a.m. to 4 p.m.
>> HYBRID continued from page 19
The advent and adoption of autonomous cablefree systems in recent years has circumvented
many of the cable systems’ problems. These
autonomous nodal systems tend to be lower in
weight and volume than cable systems.
Operators simply deploy them in the field and
leave them to acquire data, trusting that data are
being recorded and that the spread remains
within specification (e.g., noise levels, quality of
geophone coupling, etc.). As the electronics of
these systems are reliable, this choice is often a
safe bet. Contractors don’t have to wait on the
recording system status to start shooting, so productivity is limited by the energy source, not by
the recording system.
Since autonomous nodes are blind, the user has
no idea if they are recording or are still in place.
They have no real-time quality control, making it
impossible to monitor the state of the spread. Data
30
have to be harvested from the nodes by bringing
them back to the camp or by harvesting the data in
situ using complex field terminals. The contractor
has to invest in and mobilize large transcription
trailers to house the expensive computers needed
to carry out this work. The user has to wait for
days or weeks to see the data produced by skilled
technicians in the field, which often leads to delays
in making informed decisions on the ongoing survey parameters.
Up to 20% extra units are needed in the field
with some nodal systems since they need to be
taken off the line for harvesting and battery
recharging. At the end of the survey, all of the
nodes are brought back to camp, resulting in a
huge backlog as they wait to be harvested.
Wireless Seismic’s RT System 2 is an alternative
system that seeks to offer the best of both worlds.
The system architecture is best imagined as a
cable system, where the cables are replaced by
high-bandwidth radios that transmit data wire-
Image comparisons
The reprocessed data showed better overall resolution due to the Clari-Fi processing that had been
applied. In particular, the major and subtle fault features are more interpretable as visible on the depth
slice. In addition to better ties at the well locations
along the steep flanks due to well calibration and
TTI modeling, the signal below salt and subsalt
truncations are now better focused due to usage of
RTM and DIT.
Visit TGS at booth 825 for more information. n
lessly in real time between wireless remote units
(WRUs). The system works by digitizing the analog input data from the geophones and storing
them in the WRU’s memory. The data are then
streamed through the telemetry system to the
central recording system. As the transmission distance between WRUs is small, the system is not
subject to the limitations of other radio architectures. RT System 2 is free from the drawbacks of
cabled systems and offer s the benefits of
autonomous nodes.
The system features a hybrid radio telemetry
system so that if a WRU loses radio connectivity,
its internal GPS turns on and continues to record
seamlessly, storing data into its large flash memory.
When radio connectivity is restored, the buffered
data are transmitted wirelessly to the central
recorder, as telemetry bandwidth permits, and the
internal GPS switches off to extend battery life.
Visit Wireless Seismic at booth 908 for more
information. n
P R E V I E W | O C T . 2 7, 2 0 1 4 | E & P DA I LY N E W S
>> SOCIETY continued from page 1
“We find that there are areas that are not served
by our national meetings,” Liner said. “We feel like
we need to get out there.”
SEG and AAPG also are collaborating on the
journal Interpretation, which launched in 2013.
Interpretation is a peer-reviewed journal for advancing the practice of subsurface interpretation. “That’s
a cooperative effort with AAPG,” he said. “We
alternate between editors that are SEG members
and AAPG members.”
SEG is expanding in other ways as well.
Recently the society brought a near-surface geophysics group from Germany into the fold. Liner
said that a large segment of the membership is
involved with near-surface issues, and it already had
a section, so it brought a pre-existing society on
board that wanted to join the larger organization.
The topic of near-surface geophysics is becoming
increasingly important as geophysicists become
involved with environmental issues and production
seismic, he said.
“One of the things we’re trying to do is bring
together all of these different constituencies and
emphasize that they’re working on the same thing,”
he said. “It’s also an area where we have nonseismic. There’s a lot of work done on conductivity,
gravity, magnetics and other methods. Those things
are front and center in the near surface.”
Taking the reins of a thriving society might seem
like an easy task, but Liner said there are always challenges ahead. For one thing, the industry as a whole
is enjoying a sustained period of high commodity
prices. “That really sets the tone in everything we
do,” he said. “If that were to change, we could have
pressure on our membership like everyone else.”
Now is the time, he added, to build up reserves and
put things in place to handle that kind of shock.
“We realize right now that things are pretty
good, and we just want to fine-tune everything to
where it’s sustainable. Growth for its own sake is
sort of a zero-sum game.”
And while students are always a strong focus for
the society, SEG isn’t ignoring its baby-boomer
members. Liner doesn’t expect many of these older
members to retire and spend their days golfing or fly
fishing; they’re more likely to become consultants
and stay active members. “We do want to be aware
of them as a group, though,” he said. Outgoing
President Don Steeples has created a volunteer registry for people who want to become more active
within the society. It has already proven its value.
“We had someone ask about one of our foundation projects, and we had to dig very deep to find
out who to talk to about it,” he said. “We will soon
have a button on the SEG web page that simply says,
‘volunteer.’ You click that, give your information,
which committees you’re interested in and what
kinds of projects, and that gets pushed out to the
appropriate person on staff and the volunteer base.
“Once you get to be this size—30,000 members,
100 employees—it’s about lines of communication
within your organization staying open,” he added.
So what’s on Liner’s agenda for his upcoming
presidency? “Well, now, isn’t that an interesting
question?” he quipped. “I’m not coming in with a
big, audacious project in mind.” Easy for him to say.
One of his hopes is to mend fences with the
European Association of Geoscientists and
Engineers, which used to co-sponsor some of
SEG’s initiatives but has not been as involved
recently. Liner is good friends with the incoming
president of the association, Mohammed Al-Faraj,
and hopes to leverage that into a stronger intersociety relationship.
“We have what I consider to be an historic
opportunity to make it a good working relation-
ship that helps our joint membership,” he said. “We
have a significant overlap in membership. There’s
no sense in us not cooperating.”
He’s also continuing the work of previous presidents in terms of enabling more members to have
access to the annual meeting, even if they can’t
attend in person. Concepts like digital posters and a
pay-as-you-go ability to listen to a session on a
computer would reach many members who aren’t
able to travel. Liner said that even though these
conventions attract up to 10,000 people, not all are
members, and the annual meeting only represents
8% to 10% of SEG worldwide membership.
“With 65% of our membership outside the
United States, there are many remote members out
there who would like to sit in on a session of their
interest and hear the talks as they’re presented,” he
said. “We don’t have that capability now. But we’re
definitely working on it.”
Denver attendees will also enjoy the benefits of a
streamlined registration process, he said. “The question is how you scale things up,” he said. “Our
meetings have been getting progressively larger
each year. You never have a quantum jump where
you just say, ‘We’ve got to do something different,’
but after a while it builds up to say, ‘Surely there’s
something we can do better.’”
Liner also is tasked with leading the search for a
new executive director to replace Steven Davis,
who will be leaving the society when his contract
expires. “We look forward to finding the right person to lead SEG going forward.” The hope is to
have a new director in place in mid-2015.
Overall, the goal going forward is to continue to
give the members what they want and expect from
a professional society. “We want SEG to be an association of choice for people doing applied geophysics, to reinforce that brand,” Liner said. “And
we want to do it well.” n
sion to rock properties estimation from reflection seismic
data. The common thread for
these applications is the desire to
use our geophysical data to provide more quantitative information about the subsurface.”
The program addresses the
recent trend of geophysical applications targeting unconventional
Melanie McGuire is senior
oil and gas reservoirs. The nearmanager of conventions and surface mining and geothermal
meetings operations.
geophysical communities also
will present work applying similar techniques toward engineering and groundwaterrelated problems.
Many members attend the meeting for the knowledge-sharing that takes place, and the benefits of
attending the technical program are just as great.
“For researchers, the technical program represents an
opportunity to share their work with their colleagues and receive feedback directly from their fellow researchers,” Birkelo said.
The material presented in the technical program
often serves to inspire and guide others’ research
efforts. As such, many SEG members look to the technical program for the latest ideas and innovations that
they can apply to their daily jobs. “Nowhere else will
you find such a concentrated collection of applied
geophysics ideas,” Birkelo added. “Our student members often use the SEG Annual Meeting as their first
opportunity to present their work to a group of their
professional peers outside of their institution. No matter who you are, staying abreast of the latest geophysical developments pays you dividends for your career.”
The technical program will include several special
sessions built around topics of heightened interest to
members, including a session dedicated to invited
papers from the 2013 Unconventional Resources
Technology Conference (URTeC). “The URTeC
papers highlight interdisciplinary collaboration with
geophysics, geology and engineering all contributing
to an integrated understanding for unconventional
reservoirs,” Birkelo explained.
Other special sessions will focus on hydrogeophysics,
marine seismic acquisition environmental issues and
what microseismic data can say about fluid flow.
“Embedded in the near-surface technical program
are a number of papers relating to projects funded by
the SEG Foundation program, Geoscientists Without
Borders,” Birkelo said. “These papers document and
highlight the applied geophysical work being done to
improve the lives of people throughout the world.”
The special session “Recent Advances and the
Road Ahead” will provide a look into the future of
applied geophysics. The technical program also features a special session with papers from this year’s
highlighted global region, Asia-Pacific.
The number of submitted abstracts was a record at
1,634. From these abstracts, the technical program
committee created a program of 984 presented
papers. In addition, the technical program also will
include 72 oral presentations, 15 poster sessions and
36 oral discussion (e-poster) sessions. New this year,
each oral discussion session will take place in its own
room to eliminate any cross-talk. “We are giving
authors the same 15 minutes for their presentations,
but we have extended the discussion time afterward
to 10 minutes to allow additional discussion between
the author and the audience,” Birkelo said.
The technical program is scheduled to contain 21
post-convention workshops focused on topics
including induced seismicity, the use of geophysics
in reserves estimation, reservoir and caprock
integrity modeling, rock physics of unconventional
reservoirs, and full waveform inversion. “The postconvention workshops represent an opportunity to
look at the various topics in more focused detail
with an opportunity for greater interaction with the
presenters,” Birkelo said.
Because it can be challenging for members to
attend all of the presentations that might be of interest to them, SEG will be electronically recording
presentations for playback the following day at one
of the on-demand viewing stations. SEG also will be
live-streaming the presidential address, the forum on
disruptive technologies and the “Recent Advances
and the Road Ahead” special session. n
>> FEATURES continued from page 1
and signage to special new events including a members-only reception, students’ open mike night and a
sneak peek of New Orleans 2015. This is also the
first year we have provided child care for our attendees, an initiative brought by the SEG Women’s
Networking Committee.”
SEG seeks to bring the most up-to-date trends and
technologies to delegates and exhibitors during this
year’s show. Major changes include faster registration,
with delegates able to scan the QR code found on
their confirmation email at self-serve kiosks at the
convention center and select conference hotels. In
addition, exhibitors can visit the exhibitor rebooking
booth to view an online live digital floor plan of SEG’s
2015 New Orleans event and book their booth.
The Denver event will kick off with an opening
state-of-the-society address by SEG President Don
Steeples, followed by the forum “Threats and
Opportunities: Disruptive Innovation in Oil and
Gas” by Rutt Bridges. The show also will include a
special session on the Asia-Pacific region, student
programs that offer the chance to interact with seasoned professionals and a Wednesday night wrap-up
party at Denver’s Museum of Nature and Science.
“We hope that this year’s annual meeting offers
attendees the chance to connect with more than 350
companies from around the world, people from
more than 85 countries and the industry’s most
qualified professionals,” McGuire said. The show also
offers the chance for attendees to be inspired by the
latest technological advances, to network and, with
more than 120 educational sessions, propel their
careers and industry knowledge.
The technical program reflects the annual meeting’s
theme of “connect, inspire, propel, climb” and is at the
heart of the event, according to Bradley Birkelo, SEG
AM technical program chair. This year’s technical program, which is roughly the same size as last year’s,
encountered a record number of abstract submissions
that required the addition of sessions to accommodate
the increased demand for presentation slots.
“SEG’s Annual Meeting Technical Program reflects
the relevant geophysical problems of our day,” Birkelo
said. “These problems range from full waveform inver-
E & P DA I LY N E W S | O C T . 2 7, 2 0 1 4 | P R E V I E W
31
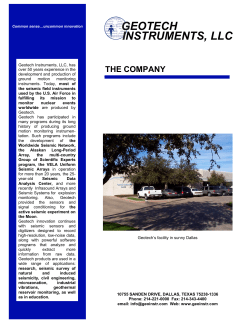


© Copyright 2026