
Shameek Vats UPCYCLING OF HOSPITAL TEXTILES INTO
Shameek Vats
UPCYCLING OF HOSPITAL TEXTILES INTO FASHIONABLE
GARMENTS
Master of Science Thesis
Examiner: Professor Pertti Nousiainen
and university lecturer Marja Rissanen
Examiner and topic approved by the
Council, Faculty of Engineering Sciences on 6 May 2015
i
ABSTRACT
TAMPERE UNIVERSITY OF TECHNOLOGY
Master‘s Degree Programme in Materials Engineering
VATS, SHAMEEK: Upcycling of hospital textiles into fashionable garments
Master of Science Thesis, 64 pages, 3 Appendix pages
July 2015
Major: Polymers and Biomaterials
Examiner: Professor Pertti Nousianen and University lecturer Marja Rissanen
Keywords: Upcycling, Textiles, Cotton polyester fibres, Viscose fibres, Polymer Fibers,
Degradation, Life Cycle Assessment(LCA), Recycling, Cellulose fibres, Waste Hierarchy,
Waste Management, Downcycling
The commercial textile circulation in Finland works that a company is responsible for supplying and maintenance of the textiles. The major customers include
hospitals and restaurants chains. When the textiles are degraded and unsuitable
for use, a part of it is acquired by companies, like, TAUKO Designs for further
use. The rest part is unfortunately sent to the landfills.
We tried to answer some research questions, whether the waste fabrics show
the properties good enough to be used to manufacture new garments. If the properties of the waste textiles are not conducive enough to be made into new fabrics,whether or not other alternatives could be explored. A different view of the
thesis also tries to reduce the amount of textile waste in the landfills by exploring different methods. This was done by characterizing the waste for different
properties. The amount of cellulose polyester fibres was calculated along with
breaking force and mass per unit area. These tests were conducted from different
parts, center and corner, of the samples. The results were then compared with the
values of the unused samples.
The result of the research suggests that, not all the fabrics are degraded equally
and hence, it is difficult to determine the exact degradation value. However, there
are other applications for the waste textiles, which would reduce the amount
ending up in landfills. The thesis work concludes with a direction for further
research in the future.
ii
PREFACE
The research work reported in this thesis was conducted at the Department of
Materials Science,Tampere University of Technology (TUT), Finland during October 2014 – May 2015. It is a culmination of my master’s degree program at the
university.
I would like to thank TAUKO Designs and Päijät-Hämeen Tekstiilihuolto for
giving me the opportunity to carry out my research thesis. I would like to express
my deep gratitude to Professor Pertti Nousiainen and university lecturer Marja
Rissanen to supervise and provide directional guidance throughout this research.
I am grateful to Teija Joki for her kind assistance with the experiments.
I would like to acknowledge my parents, family and friends for supporting
and motivating me during this period.
Tampere, 02 July 2015
SHAMEEK VATS
iii
CONTENTS
1. Introduction
1
2. Waste Flow and its Management
2.1 Waste Management . . . . . . . . . . . . . . . . . . . . . . . . . . . .
2.1.1 Waste Hierarchy in European Union (EU) . . . . . . . . . . .
2.1.2 Downcycling, Recycling and Upcycling . . . . . . . . . . . .
2.2 Textile Waste Flow . . . . . . . . . . . . . . . . . . . . . . . . . . . . .
2.2.1 Textile flow and market in Europe . . . . . . . . . . . . . . .
2.2.2 Textile Waste in Finland . . . . . . . . . . . . . . . . . . . . .
2.2.3 Laundry and sorting waste at Päijät-Hämeen Tekstiilihuolto
2.2.4 Textile upcycling in TAUKO Designs . . . . . . . . . . . . . .
2.3 Fiber degradation during Life Cycle . . . . . . . . . . . . . . . . . .
2.3.1 Fiber degradation during laundry . . . . . . . . . . . . . . .
2.3.2 Chemicals used during the laundry process . . . . . . . . . .
2.3.3 Polyesters and its degradation . . . . . . . . . . . . . . . . .
2.3.4 Cotton and its degradation . . . . . . . . . . . . . . . . . . .
2.4 Framework of research . . . . . . . . . . . . . . . . . . . . . . . . . .
4
4
4
8
10
10
12
14
15
16
16
16
18
21
23
3. Research Materials and Methods
3.1 Empirical Study . . . . . . . . . . . . .
3.1.1 Performance of Empirical study
3.2 Validity and Reliability . . . . . . . . .
3.3 Materials . . . . . . . . . . . . . . . . .
3.4 Methods . . . . . . . . . . . . . . . . .
3.4.1 Composition of fibers . . . . . .
3.4.2 Tensile properties of fabrics . .
3.4.3 Mass per unit area . . . . . . .
3.4.4 Thickness . . . . . . . . . . . . .
3.4.5 Thread count . . . . . . . . . .
.
.
.
.
.
.
.
.
.
.
24
24
24
25
26
27
27
29
30
31
31
.
.
.
.
.
.
.
32
32
32
35
39
41
43
48
.
.
.
.
.
.
.
.
.
.
.
.
.
.
.
.
.
.
.
.
.
.
.
.
.
.
.
.
.
.
.
.
.
.
.
.
.
.
.
.
.
.
.
.
.
.
.
.
.
.
.
.
.
.
.
.
.
.
.
.
.
.
.
.
.
.
.
.
.
.
.
.
.
.
.
.
.
.
.
.
.
.
.
.
.
.
.
.
.
.
4. Results and Discussions
4.1 Results . . . . . . . . . . . . . . . . . . . . . . . . . . .
4.1.1 Sample 1 Blanket cover Cotton-Polyester Blend
4.1.2 Sample 2 Bed sheet Cotton-Polyester blend . .
4.1.3 Sample 3 Bed sheet Cotton Twill . . . . . . . .
4.1.4 Sample 4 Bed sheet Cotton Plain . . . . . . . .
4.2 Discussions . . . . . . . . . . . . . . . . . . . . . . . . .
4.2.1 Charity . . . . . . . . . . . . . . . . . . . . . . .
.
.
.
.
.
.
.
.
.
.
.
.
.
.
.
.
.
.
.
.
.
.
.
.
.
.
.
.
.
.
.
.
.
.
.
.
.
.
.
.
.
.
.
.
.
.
.
.
.
.
.
.
.
.
.
.
.
.
.
.
.
.
.
.
.
.
.
.
.
.
.
.
.
.
.
.
.
.
.
.
.
.
.
.
.
.
.
.
.
.
.
.
.
.
.
.
.
.
.
.
.
.
.
.
.
.
.
.
.
.
.
.
.
.
.
.
.
.
.
iv
4.2.2
4.2.3
4.2.4
New commodities . . . . . . . . . . . . . . . . . . . . . . . . .
Dissolution of Cellulose . . . . . . . . . . . . . . . . . . . . .
Energy Recovery . . . . . . . . . . . . . . . . . . . . . . . . .
48
51
53
5. Conclusions
56
References
58
APPENDIX A. Thickness
65
APPENDIX B. Thread Count
67
v
List of Figures
1.1
Structure and organization of the thesis . . . . . . . . . . . . . . . .
2.1
2.2
2.3
2.4
2.5
2.6
2.7
2.8
2.9
Waste Hierarchy Pyramid . . . . . . . . . . . . .
Interventions used to promote waste prevention
Distribution of textile waste in Finland . . . . . .
Flow of textile waste in Finland . . . . . . . . . .
Units in the laundry . . . . . . . . . . . . . . . . .
Ester group . . . . . . . . . . . . . . . . . . . . . .
Polyester fibers . . . . . . . . . . . . . . . . . . .
Melt Spinning . . . . . . . . . . . . . . . . . . . .
Polyester fibers . . . . . . . . . . . . . . . . . . .
.
.
.
.
.
.
.
.
.
.
.
.
.
.
.
.
.
.
.
.
.
.
.
.
.
.
.
.
.
.
.
.
.
.
.
.
.
.
.
.
.
.
.
.
.
.
.
.
.
.
.
.
.
.
.
.
.
.
.
.
.
.
.
.
.
.
.
.
.
.
.
.
.
.
.
.
.
.
.
.
.
.
.
.
.
.
.
.
.
.
4
5
12
13
14
19
19
19
21
3.1
3.2
3.3
3.4
Materials and experiments used for characterization
Corners and Center . . . . . . . . . . . . . . . . . . .
Microscope used to see dissolved cellulose . . . . .
Tensile Testing Machine . . . . . . . . . . . . . . . .
.
.
.
.
.
.
.
.
.
.
.
.
.
.
.
.
.
.
.
.
.
.
.
.
.
.
.
.
.
.
.
.
.
.
.
.
25
26
28
30
4.1
4.2
4.3
4.4
4.5
4.6
4.7
4.8
4.9
4.10
4.11
4.12
4.13
4.14
4.15
4.16
Blanket cover PES/CO % of polyester left . .
Blanket Cover PES/CO breaking force . . . .
Blanket Cover PES/CO mass per unit area . .
Blanket Cover PES/CO degradation pattern .
Bed sheet PES/CO % of polyester left . . . .
Bed sheet PES/CO breaking force . . . . . . .
Bed sheet PES/CO mass per unit area . . . .
Bed sheet PES/CO degradation pattern . . .
Bed sheet cotton twill breaking force . . . . .
Bed sheet cotton twill mass per unit area . . .
Bed sheet cotton twill degradation pattern . .
Bed sheet cotton plain breaking force . . . . .
Bed sheet cotton plain mass per unit area . .
Bed sheet cotton plain degradation pattern .
Dress 1 . . . . . . . . . . . . . . . . . . . . . .
Dress 2 . . . . . . . . . . . . . . . . . . . . . .
.
.
.
.
.
.
.
.
.
.
.
.
.
.
.
.
.
.
.
.
.
.
.
.
.
.
.
.
.
.
.
.
.
.
.
.
.
.
.
.
.
.
.
.
.
.
.
.
.
.
.
.
.
.
.
.
.
.
.
.
.
.
.
.
.
.
.
.
.
.
.
.
.
.
.
.
.
.
.
.
.
.
.
.
.
.
.
.
.
.
.
.
.
.
.
.
.
.
.
.
.
.
.
.
.
.
.
.
.
.
.
.
.
.
.
.
.
.
.
.
.
.
.
.
.
.
.
.
.
.
.
.
.
.
.
.
.
.
.
.
.
.
.
.
33
34
34
35
37
37
37
38
40
40
41
42
42
43
46
46
.
.
.
.
.
.
.
.
.
.
.
.
.
.
.
.
.
.
.
.
.
.
.
.
.
.
.
.
.
.
.
.
.
.
.
.
.
.
.
.
.
.
.
.
.
.
.
.
.
.
.
.
.
.
.
.
.
.
.
.
.
.
.
.
.
.
.
.
.
.
.
.
.
3
vi
4.17 Re:newcell process . . . . . . . . . . . . . . . . . . . . . . . . . . . .
52
1
2
3
65
66
67
Blanket Cover PES/CO Thickness . . . . . . . . . . . . . . . . . . . .
Bed sheet PES/CO Thickness . . . . . . . . . . . . . . . . . . . . . .
Blanket Cover PES/CO Thread Count . . . . . . . . . . . . . . . . .
vii
List of Tables
2.1
2.2
2.3
2.4
Chemicals used in the laundry . . . . . . .
Chemicals in detergent and their Toxicity
Properties of polyester fibers . . . . . . . .
Properties of cotton fibers . . . . . . . . . .
.
.
.
.
.
.
.
.
.
.
.
.
.
.
.
.
17
18
20
22
3.1
Testing parameters . . . . . . . . . . . . . . . . . . . . . . . . . . . .
29
4.1
4.2
4.3
4.4
4.5
4.6
4.7
4.8
4.9
4.10
4.11
Blanket Cover PES/CO original . . . . . . . . . . . . . . . . . . . .
Blanket Cover PES/CO used or recycled . . . . . . . . . . . . . . .
Sample 2 Bed sheet PES/CO Original . . . . . . . . . . . . . . . . .
Sample 2 Bed sheet PES/CO Used or Recycled . . . . . . . . . . . .
Sample 2.1 Bed sheet PES/CO Used or Recycled . . . . . . . . . . .
Sample 3 Cotton Bed sheet Twill Original . . . . . . . . . . . . . .
Sample 3 Cotton Bed sheet twill used or recycled . . . . . . . . . .
Sample 4 Bed sheet Cotton Plain original . . . . . . . . . . . . . . .
Sample 4 Bed sheet Cotton Plain used or recycled . . . . . . . . . .
Minimum Breaking force requirements for some fabrics . . . . .
Potential use of waste fabrics on the basis of their characterization
32
33
35
36
36
39
39
41
42
47
47
1
2
3
4
Blanket Cover (PES/CO) Thickness . . . . . .
Bed sheet (PES/CO) Thickness . . . . . . . . .
Blanket Cover PES/CO Thread Count Corner
Blanket Cover PES/CO Thread Count Center
65
65
67
67
.
.
.
.
.
.
.
.
.
.
.
.
.
.
.
.
.
.
.
.
.
.
.
.
.
.
.
.
.
.
.
.
.
.
.
.
.
.
.
.
.
.
.
.
.
.
.
.
.
.
.
.
.
.
.
.
.
.
.
.
.
.
.
.
.
.
.
.
.
.
.
.
.
.
.
.
.
.
.
.
.
.
.
.
.
.
.
.
1
1.
INTRODUCTION
The amount of textiles being used is increasing with every passing year, and thus
adding to the amount of waste generated from the textiles. The waste amount
accumulated is slowly but steadily turning into a burning problem. The current
conventional waste management methods are ineffective, and needs improvement. The European Union (EU) has revised its waste legislation asking for strict
regulations against waste disposal methods.
Textile materials being subjected to the effects of many degradation mechanisms deteriorate, during their useful life. Sunlight, weathering, laundering
or dry-cleaning treatments, abrasion, perspiration, and other such unavoidable
sources of fiber damage all exert their toll on physical or chemical properties to
cause changes that can limit useful fabric life.
Physical changes may occur in the dimensions, tensile, tearing, or bursting
strength, stiffness or elasticity, abrasion-resistance, and color of a cloth. In addition, chemical changes involving the permeability to air, water, moisture vapor,
and gas, or the resistance to heat, flame, and electric current can occur. All of these
changes are potentially important in determining whether a fabric can continue
to lead a useful life.
Textiles forms a portion of the total amount of Municipal Solid Waste (MSW)
produced. Textile wastes offer a wide scope of recycling, as almost the entire
amount of them can be recycled or used to produce energy. The European Union
(EU) has revised its directives towards waste treatment, specifically the bio-wastes.
The directive encourages the least amount of textile wastes to end up in landfills [1]. Finland and nearby regions are the key focus of the project and the goal
is to phase out textiles waste from landfill as early as 2016. [2]
This forms a niche and demands for further research to explore the possibilities of the methods to reduce textile waste in landfills. The previous conducted
research by Tojo et al. concludes that the most of the textile waste end up being downcycled instead of recycled or upcycled. The value of the downcycled
waste is less compared to its original product. An improved waste management
system bolsters and reinforces the economy. A different research by Palm et al.
marks a research gap of the insufficient, recycling structure and calls for effective
measures to improve the structure. The same study also concludes that a bet-
1. Introduction
2
ter structure of textile waste recycling can help prevent the depletion of natural
resources, and can save a lot of water used for the production of cotton. [3] [4]
The scope of this thesis tries to build up on such issues and address the problems through upcycling. In simple words, upcycling is the conversion of waste
into products of better quality and environmental use. Throughout the thesis
waste textile materials from hospitals were characterized, and compared their
properties from the original or unused textiles.
Some research questions were tried to answered, including one, whether the
waste fabrics posses the properties good enough to be used to manufacture new
garments. If the properties of the waste textiles are not conducive enough to be
made into new fabrics, whether or not other alternatives could be explored. A
different view of the thesis also tries to reduce the amount of textile waste in the
landfills by exploring different methods. A textile supplying company PäijätHämeen Tekstiilihuolto Oy, was interviewed, to understand better the degradation conditions during the laundry process, as it accounts as one of the main
factors of degradation. TAUKO Designs, a company based in Helsinki uses this
waste to manufacture fashionable garments. There is a sizable amount of waste
generated, in the process of recycling of textile into new products. The best possible methods were analyzed to either cut down the generation of such waste or
a proper disposal system for the waste. Materials from different parts were characterized to question the uniformity of degradation. Several other small issues
like one of sorting was covered as well. A proper sorting structure to reinforce
the current waste management system was studied.
The thesis is spread into different chapters, starting from the Introduction. The
first chapter gives a rough idea and structure of the thesis. The research problems
and approach to these problems are mentioned in the first chapter. It differentiates between the studies conducted relevant to the subject and points out the
research gap. The second chapter titled, Waste Management in Finland, elaborates about the current scenario of textiles wastes and about the European Union
(EU) Regulations. It states the theory related to waste management, the regulations and compares the textile flow with other countries. The idea of upcycling
with contrast to downcycling has been briefed in the second chapter. In addition
to that the flow of textiles from with different companies and the current issues
with recycling have been highlighted. The topic of recycling along with upcycling and downcycling has been expanded in this chapter. The chemicals used
in the laundry process, have been mentioned which helps to decide the degradation factors and is the base for discussion later in the thesis. The textile materials
used in the hospitals are polyester cotton blend or cotton fabrics. Theories on cotton and polyester fibers, their structure and properties have been reported. The
1. Introduction
3
degradation and of these two fabrics are considered and analyzed in the chapter.
The third chapter, titled, Materials and Methods, is about the experiments and
the sample materials used during the course of the thesis. The empirical study
and its performance is stated in this chapter. The validity and reliability of the
methods are also discussed. The fourth chapter, named Results and Discussion
presents the findings of the research. In the later part of the same chapter, the
values of the findings are compared and discussed. The thesis concludes with
the closing chapter, where the entire research is summarized and a direction for
further research is proposed.
The flowchart 1.1 below represents the chapters with their organization and structure through the thesis.
Figure 1.1: Structure and organization of the thesis
4
2.
WASTE FLOW AND ITS MANAGEMENT
2.1
Waste Management
2.1.1
Waste Hierarchy in European Union (EU)
The European Union, has always paid major attention to waste reduction and
recycling, a large number of policies have always been drawn up with that aim.
It believes in the idea that efficient waste management strategies can be useful
to prevent or reduce adverse effects on the environment and human health. The
EU Directive 2008/98/EC introduced in 2008, models a waste hierarchy pyramid,which is a structure of a priority order to best utilize the waste, figure 2.1
shows the model of waste hierarchy pyramid. The Waste Framework Directive
75442/EEC was first introduced in the EU policy in 1975. The Directive focused
on the priority and importance of protection of environment by waste utilization.
The correct implementation of the pyramid prevents the emission of greenhouse
gases, preserves our natural resources and promotes the application of green
technologies [4]. According to data publicly available from Eurostat, the quantity
of waste generated in the EU-27 decreased by around 115 million tonnes between
2004 and 2010 [5].
The pinnacle of the pyramid reads "Avoidance" which should be the most preferred option followed by reuse, recycle, recovery and disposal.
Figure 2.1: Waste Hierarchy Pyramid
[6]
2. Waste Flow and its Management
5
Waste Prevention: Reducing the amount of waste is the first priority according to the pyramid. It accounts for the measures taken before a substance or
product turns into a waste. The principle behind the prevention of the waste
is to reduce the quantity of waste by reusing the product and extending its life
cycle. It also promotes the reduction of the adverse impacts of the waste generated and the content of harmful substance in the waste. A secondary link to the
waste prevention policy is to improve the manufacturing methods and acknowledge consumers to promote, use and demand greener products. The eco-friendly
products are the ones, that uses secondary raw materials without any hazardous
substance present in it. The energy consumption in the utilization processes are
fewer and products are recyclable. The guidelines and definitions to draft the
prevention methods varies by different authorities. The concluding function laid
for "prevention" is reduction in amount of waste and the harmful chemicals in
the waste. [1]
David et al. in their research conclude that there are four approaches to categorize waste prevention - waste minimization, clean operations, green products and
product/service innovation. While the first three of them work practically on both
producer and consumer level, the product innovation deals more with planning
and designing of products. The companies these days focus on improved product development with designing. The products are designed, keeping the waste
and its prevention as one of the factors. The same research also suggests other
practical approaches, to help in the process of waste prevention. The figure, 2.2
demonstrates the alternative interventions used to promote waste prevention. [7]
Figure 2.2: Interventions used to promote waste prevention
2. Waste Flow and its Management
6
Reuse: It can be defined as any operation, where products or components are
used again for the same purpose [1]. The textile clothes can be used as garments
in one form or the other. This prevents the product to end up being waste and
would benefit the environment by making it available for the consumers who
were unable to afford them in the first place. Reuse would also mean the utilization of the product as something new serving a different function. If we consider
an example, a purse or a small could could be made out of waste denims. Reusing
of textiles reduce the amount of waste and will lower the harmful content in the
waste. Although it is listed separately in waste hierarchy, product reuse can be
related to a form of waste prevention as both them intend to reduce the amount of
waste requiring collection. Reusing a product delays or sometimes avoid its entry
in waste collection or disposal system. It can help reduce the waste handling cost
by cutting the expenses for recycling, composting, land filling and combustion.
A research by Julian Clearly, studies the short comings of the municipal bodies
and their policies to promote product reuse. The same study explores the type of
waste prevention policies, divided into seven categories, monitored at different
points of waste cycle. It also mentions the effects on product service and the
presence of an alternative product system to treat the waste for its reuse. Julian, in
his paper concludes, pointing the dearth of awareness, and lack of proper sorting
system. [8]
Recycling: EU Directive 2008/98/EC defines recycling as any recovery operation by which waste materials are reprocessed into products, materials or substances whether for the original or other purposes. It includes the reprocessing of
organic material but does not include energy recovery and the reprocessing into
materials that are to be used as fuels or for backfilling operations. The idea of recycling is that if the waste cannot be prevented, the maximum amount of material
should be utilized by reprocessing or else wise. There is a scarcity of raw materials in Europe and the resources are exhausting swiftly. In such case the waste
could be used as raw materials for the new products. There are several materials classified by the EU, according to their priority attention, for the mentioned
purpose. It has been also pointed out that the producers are also responsible for
the entire life cycle of the products. They are also required to contribute to the
recycling of products [1]. Recycling of blended fabrics poses a significant challenge, because of the inhomogeneous nature of the materials. In order for the
fibers from these fabrics to be reclaimed, effective separation of synthetic fibers
in a blended fabric becomes the first challenge in reclaiming and further reusing
of such fabrics [9].
Recycling allows the material to have extended life in addition to reducing re-
2. Waste Flow and its Management
7
source consumption and avoiding disposal cost. Transportation and collection
adds to the cost of final recycled products which makes it more expensive compared to the virgin materials. Many economic, environmental and social benefits can be extracted from recycling. The reliability on the virgin materials are
reduced, the level of pollution is lowered thus decreasing the pressure on biodiversity. [10]
Recovery: The word recovery in the waste hierarchy pyramid symbolizes energy recovery. Anything on the pyramid below recovery is considered to be a
waste. The material or product here is categorized suitable for recovery only
when it complies by the Directive 2008/98/EC definition of waste, but does not
fit for the requirements of reuse and recycle. These are then used as fuels and
incinerated to produce energy. The Municipal Solid Waste(MSW) is a complex
mixture of several materials different in physical and chemical characteristics as
well as variable in size. The size of the particles plays a major role in time required
for combustion. Therefore the combustion of MSW takes longer than the conventional fuels. The structure and type of the waste is one of the key parameters in
deciding the size of the incineration reactors. [11]
Incineration is aimed at complete oxidation of all the suitable elements encompassed in the waste. However, incomplete burning of waste materials can be
harmful. It can release toxic gases and could have devastating effects on health.
These applications are considered high temperature applications, and have their
specific characteristics that must be take into account. It is therefore necessary to
be extremely cautious while selecting and designing a incinerator. The incineration plants are subjected to burn the wastes completely at sufficient temperatures,
additional measures are applied. The wastes needs to be pretreated before incineration to prevent the formation of harmful gases. EU has set regulations, limits
and guidelines for the incineration plants that are to be followed. [12]
Disposal: Any waste operation that does not meet the criteria of recovery is by
default considered to be disposal. Disposing the wastes in landfill is the most
primitive and least desirable option for treating the waste. The decomposition
of wastes in the landfill can release toxic chemicals increase the pollution level.
Land application of wastes is becoming more widespread as regulatory authorities move to protect water quality by restricting waste disposal into rivers, lakes
and the marine environment. Some of the chemicals are hazardous and can disturb the ecological balance. The production of methane in the absence of oxygen
is likely, and it forms the green house gases, that in turn contributes to global
warming. The Landfill Directive encourages the EU members to reduce the bio-
2. Waste Flow and its Management
8
logical waste in the landfill to 35% by 2016, that would mean the textile waste in
the landfill would be reduced to almost nil [4].
The management of waste in landfills is a challenging task and demands rigorous scientific inputs. The industrial and and MSW contains undesirable materials in the form of heavy metals, toxic organic waste, pathogen salts and or
have variable pH [13]. The decomposition of organic materials under anaerobic conditions leads to the formation of methane gas. Methane is a harmful gas
and considered as a key contributor, in the rise of air pollution more than carbon
dioxide. It is also an explosive gas and can seep through basements of the nearby
localities [14]. However, there are parts of waste which have positive nutrients
and could be used as fertilizers for agricultural purposes. But the lack of sorting
system, for such wastes mixes them with industrial organic and harmful waste.
The same dumping landfills are used for all kinds of waste which restricts the
utilization of functional elements from the mixed waste.
Tojo et al., in their research highlights that most of the textiles, reuses, are the
second hand garments. Most of them are not so desired, and eventually end
up being disposed or incinerated [3]. Though burning them to extract energy
is better than disposing, but it is still not the best alternative. The cost of cotton
textiles are high and combusting them is not a good deal. The course of this thesis
work emphasizes on the idea of upcycling. The upcycling of waste encourages
reuse and strengthens the hierarchy pyramid. The demand for new garments in
the market is more than second hand clothes. Hence, in Finland upcycling is a
very feasible option. In the recent years The EU has revised most of its directives
concerning waste management. EU Waste Framework Directive 2008/98/EC, the
Landfill Directive 1999//31/EC and Waste Incineration Directive 2000/76/EC
aims at reducing the bio-waste in landfill by significant percentage and increasing
the recycling of materials by many folds. Finland and nearby regions are the key
focus of the project and the goal is to phase out textiles waste from landfill as early
as 2016. If the word "recovery" is expanded to the value of the product recovered,
it be fitting to describe upcycling.
2.1.2
Downcycling, Recycling and Upcycling
This section describes the measures taken to recover the value of the materials
has turned into a waste and cannot be reused. In such cases the product is reprocessed into same, higher or lower value than original. Generally there are three
major operations involved in the reprocessing- upcycle, recycle and downcycle.
The waste hierarchy pyramid clubs the three of them to word "recycle". But on
careful consideration and taking the into account the value of the initial and final
2. Waste Flow and its Management
9
products, the section of recycling can be split into three.
Re-cycle: Any recovery operation by which in part or in full a substance or material or an object that has become waste but cannot be reused is reprocessed into
raw materials of the same purpose/value as that of the original. The main proposition of recycle is that the value of final product is equal to the base or original
product. The recycled product can be available in other forms than the main material. In the strictest sense, reusing of a material would create a new supply of
the same material for instance, utilized office paper would be changed over into
new office paper, or utilized frothed polystyrene into new polystyrene [15]. The
nature of recyclates, the raw material for recycling, is perceived as one of the central difficulties that should be tended to for the achievement of a long haul vision
of a green economy and accomplishing zero waste. Recyclate quality is by and
large alluding to how a significant part of the crude material is comprised of target material contrasted with the measure of non-target material and other nonrecyclable material [16].
Down-cycle: Any recovery operation by which in part or in full substance or
material or an object that has become waste but cannot be reused is reprocessed
into raw materials of lower/lesser purpose/value than the original. The worth
of the reprocess material is less than the original material, in the same form or
the other. The properties of the reprocessed products are measured to inferior
than the original product. This can be attributed to many reasons, the prime being degradation. Some materials gather undesirable elements during their life
cycle, which in turn contribute to downcycling. Downcycling intends to avoid
squandering possibly helpful materials, decrease utilization of new crude materials, vitality use, air contamination and water contamination. Its objectives are
likewise bringing down nursery gas emanations (however re-utilization of corrupted poisonous chemicals for different purposes can have the inverse impact)
when contrasted with virgin creation. It is said that downcycling can actually
increase the contamination of biosphere. [17]
Up-cycle: Any recovery operation by which in part or in full a substance or
material or an object that has become waste but cannot be reused is reprocessed
into raw materials of higher purpose/value than the original. Restricting the recovery operation of reprocessing to substances, materials or objects that cannot
be reused may encourage deployment of the measure of reuse before adopting
this potentially less resource effective measure of reprocessing. This operation of
waste management is most encouraged as the value of the reprocessed materials
2. Waste Flow and its Management
10
is more than the base or original material [1]. The upcycled items can be simply
creative, logical, or anything essentially helpful. This manageable choice disposes
of the waste that may some way or another advance toward a landfill or incinerator. Upcycling is additionally an extraordinary approach to make utilization of
reasonable accessible things. Ordinarily, the more inventive the change of an upcycled element, the more marketable it is. Thus, upcycling is a productive change
of waste consolidating money saving advantages and waste reduction [18] [19].
2.2
2.2.1
Textile Waste Flow
Textile flow and market in Europe
In Denmark around 89,000 tons, comparing to 16 kg for every capita of new dress
and family materials, are put on the Danish advertise every year for utilization.
Roughly 41,000 tons are gathered independently by different philanthropy and
private associations every year [3]. Of the independently gathered materials
give or take 23,000 tons are sent out for reuse and reusing and 12,000 tons are
reused (with a little measure of reusing) inside Denmark. The staying 6,000 tons
is burned. [2]
Norway produces constrained measure of materials, the yearly generation clubbed
with the foreign materials adds up to around 72,000 tons for each year. As indicated by Statistics Norway the aggregate sum of material waste was 113,000 tons
in 2011, which is around 22 kg for every capita every year. In any case, these
numbers incorporate all parts, for example, material waste from industry and
not simply families [20]. Around 23,000 tons of the aggregate utilized materials are gathered independently by philanthropies and different associations. As
indicated by yearly reports from the foundations this give or take 1,000 tons is
isolated for reuse in Norway, more or less 21,000 tons of blended utilized materials are traded for reuse and reusing in different nations and the remaining
approximately 1,000 tons of low quality materials are burned [20]. It is expected
that most of the staying utilized materials created every year (approx. 27,000
tons) end in blended metropolitan waste and is for the most part burned with a
little share going to landfill. Laitala et al. (2012) evaluations that 25–35% of the
utilized materials that finishes in the blended civil waste every year could have
been reused. [21] [2]
The sales of new garments and household textiles in Sweden equaled 132,000
tons in 2011 of which 95,000 tons was garments and 37,000 tons was home material. This compares to around 15 kg for every individual every year. Around
20% was gathered by foundations; more than 50% was tossed in blended waste
and the staying 30% is likely a blend of family stockpiling and disposing of at
2. Waste Flow and its Management
11
reusing focuses [22]. Roughly 7,500 tons of the utilized materials gathered by altruistic associations is sold for reuse in Sweden with 19,000 tons sent out for reuse
and/or reusing in different nations. More or less 800 tons is stolen from compartments and the rest of burned in Sweden. The destiny of the assessed 103,000 tons
hole between new materials put available every year and what is independently
gathered after utilization, is not known but rather the greater part is expected to
end in blended family waste closure in incineration however some will likewise
be aggregated in families and not discarded. [2]
In Germany the second-hand costs for one kilo of gathered textiles stock have
fluctuated between EUR 0.3 and EUR 0.6 in the previous year in the market. All
costs for utilized garments change over the seasons, however appear to have
come to a normal level for every single gathered material of around EUR 0.5
for each kilo in Germany in the spring of 2013 despite the fact that the cost for
individual sorted portions can be much higher than this [23]. The nature of German utilized materials is, then again, thought to be preferably lower than that
in Nordic markets, so the normal costs for Nordic materials are thought to be
higher [24]. Because of these memorable high costs in Germany, the business is
overflowed by unlawful authorities of various types [25]. At the same time, the
private and beneficent authorities are presently joined by nearby powers entering
the business sector for gathering of materials, and performers are expressing that
the whole market seems, by all accounts, to be "on the move" [25]. The expanding
quantities of performers are seeking the supply of utilized materials, which is the
reason the costs for gathered materials in Germany have ended up being high for
purchasers the nation over. Thus they report experiencing issues in earning back
the original investment since their price tag is high and expanding, contrasted
with the value they can acquire for their sorted/reused material yields. BIR Textiles Division President Olaf Rintsch of Textile Recycling K&A Wenkhaus GmbH
has cautioned how "troublesome economic situations" and "unjustifiable rivalry"
is unfavorably affecting the conventional utilized materials industry. Costs for
gathered materials has come to "a pinnacle" and purchasers are discovering it
"verging on inconceivable" to make benefits. He underlines that constantly high
costs can bring about a substantial number of lost employments, as reusing organizations close down [23].
The circumstance in the UK is by all accounts very much alike to that of Germany. As per a value explanation from a British reusing news site, the normal
material cost in the UK is around EUR 0.35 for the blend of materials gathered in
reusing centers, EUR 0.61 for shop accumulations, and EUR 0.8 overall for philanthropy clothes in the first 50% of 2013 [26]. Toward the end of 2012 it was
further noticed that the opposition in the business was expanding and that mate-
2. Waste Flow and its Management
12
rial purchasers were battling with the trading as a consequence of the high costs
requested for philanthropy grade material. The expanding costs for gathered materials have implied that more than 10% of the British Textile Recycling Association individuals (British relationship for the materials purchasers) have stopped
exchanging the most recent year, and that more are required to take after because
of the high cost for their inputs not being trailed by expanding costs for their
yields [23] [26].
2.2.2
Textile Waste in Finland
The net annual inflow of new textiles in Finland is about 71,000 ton per year [3].
Most of these, are not separated and either incinerated or end up in landfills.
Some part of the separated ones are considered to be unusable and are dumped
in the landfill. The amount of the textiles in landfill is piling up every year. The
flow chart below gives a better picture of the textile flow in Finland. The demand
for the second hand textiles are less because the product is considered to be inferior in the properties. The difference in the cost of new and old products are
not significant and hence, people tend to go for new textile products. Sometimes
sorting of the waste is improper and useful constituents of the textiles end up
in landfill being mixed with other municipal wastes. According to another estimations, 73% of the textile waste from households end up either in landfill or is
being incinerated, picture 2.3 shows the distribution of the waste [3].
Figure 2.3: Distribution of textile waste in Finland
[2] [3]
Blended fabrics are one of the most used fabrics in the recent times and a major
2. Waste Flow and its Management
13
part of the textile recycling taking place in Finland the use of second-hand clothing garments. When it comes to blended fabrics there are difficulties in identifying specific fabrics which leads to inadequate sorting. There is another concern
with blended fabrics, is that one of the constituents degrade more than the other.
The prices for second-hand used clothes have tripled in the past five years [2].
Recyclers report having difficulties in breaking even since their price is high and
increasing, compared to the price they can obtain for their sorted/recycled material outputs. Recycling facilities located outside Europe seem to be more profitable. One explanation could be that the wages are significantly lower. In return
the quality and the sales value of the output from the recyclers are also perceived
to be lower. [2] [3]
The production and consumption of textile has seen a rise in recent years.
Presently Finland consumes 13.5 kg of textile per capita [2]. The commercial textile circulation in Finland follows a chain, where a company is responsible for
supplying and maintenance of the textiles. Hospitals and health centers are major consumers and textile waste producers. These waste or unsuitable textiles are
then, utilized by smaller companies. When the textiles are degraded and unsuitable for use, many other companies, one such, TAUKO Designs, acquire it for
further use. They trim and crop the textiles, to make fashionable garments. The
process results in formation of sizable amount of waste [2] [3]. The diagram 2.4
below roughly depicts the flow of textile waste in Finland.
Figure 2.4: Flow of textile waste in Finland
2. Waste Flow and its Management
2.2.3
14
Laundry and sorting waste at Päijät-Hämeen Tekstiilihuolto
Päijät-Hämeen Tekstiilihuolto is a textile service company based in Lahti. They
are responsible for textile supply to hospitals, health centers as well as home and
housing services units. According to Ulla Suokas, Textile Manager, the company
deals in commercials as well as personal order of servicing textiles. There has to
special laundry and maintenance conditions for the personal orders. There are
smaller washing machines for customers demanding special washing conditions.
Though it is difficult to ascertain the lifetime of a fabric, because it depends on the
usage and conditions it is used in. However, the personnel at company suggest a
lifetime of 5 years for the bed sheet and 3 years for the working garments, when
microfiber are good. [27]
The processing time for the textiles are 30-35 minutes and then 10-20 minutes
of drying. The textiles are first disinfected depending upon the structure and
formulations. They are sorted according to their color, the temperature required
to wash them. The garments are first pre-washed followed by main washing and
finally they are rinsed. [27]
There are roughly fourteen chambers or units in the continuous washing machine through which the fabrics are subjected to pass to complete the washing
cycle. The washing cycle consists of three major stages - pre-wash, main wash
and rinsing. There are circulating rotors inside the chambers, and the fabrics are
moved with water and detergents inside the chambers. The figure below depicts
the flow of textiles in the laundry. The pH value is kept around 9 for the washing
cycle. The temperature, speed of the rotors and other such parameters are controlled by computer fixed to the machine. After the materials have been washed,
they are subjected to drying. First the excess water is squeezed out by applying
10 bar pressure. The application of the these methods also depend upon the type
and structure of fabrics. There few ways to dry the fabrics- gas operated tumble
dry, iron dry and steam dry. The iron dry method uses a temperature of 180◦ C.
The fabrics are then folded by a robot once they are dried. [27]
Figure 2.5: Units in the laundry
2. Waste Flow and its Management
15
The final materials are then sorted and arranged according to their respective
applications. There is a new method to sort the working garments, using a microchip. The working garments are inserted with microchips and passed through
a continuous line of tunnel drier. There is a scanner at the end of the drier and
it directs the garments to their required pile of stack. Once the materials serve
their lifetime, they are used by recycling companies as raw materials, TAUKO
Designs being one such company. However, there are still a lot of textile waste
generated as all the materials are not fit enough to be used as virgin materials
for products. The company reportedly produces around 5214 kg of textile waste
every year. [27]
Päijät-Hämeen Tekstiilihuolto, has its limits of categorizing the textiles, according to their properties. The used textiles are divided, after their lifetime, into two
different categories chiefly. The first category belongs to the upper part of the
hierarchy pyramid, and can be used as a product. The second class of textiles fall
in the second half of the waste pyramid, termed as waste. The waste are either
sent to the incinerators for energy recovery or in the landfills. The group, product
of the laundry deals in concern with the thesis. [27]
The textiles which are used and discarded from the hospitals and medical clinics are mostly reused and recycled. Though Päijät-Hämeen Tekstiilihuolto, does
not characterize each fabric, but instead apply manual observation and experience. These textiles wastes, are utilized by many small companies for their products, TAUKO Designs being one such company.
The following section exhibits one case example of upcycling of waste textiles.
2.2.4
Textile upcycling in TAUKO Designs
A Helsinki based textile upcycling company TAUKO Designs, accepts the textiles
which can no longer be used in Health Care. There is a big hump of raw materials
from the hospitals, because the textiles are rejected with minor faults, and damages. Since the textiles are made to last long and stay soft throughout, TAUKO
cooperates and collaborates with local textile maintenance companies to produce
high quality fashionable garments. Polyester and cotton fiber textiles are mainly
used for TAUKO’s products. These materials are first refined and disinfected at
textile servicing companies to be made fit for TAUKO’s production. [28] [29]
The fabrics obtained have different color, size, stains, properties, imperfections
and hence each one of them has to be cut separately instead of the conventional
way of piling them in stacks and then trimming into shapes. A section of the production part is out sourced to Estonia, mostly to some small sewing companies.
The dyeing and coloring are carried out at Estonia and Finland both. [28] [29]
Though the process of upcycling of TAUKO prevents the waste to be dumped
2. Waste Flow and its Management
16
in landfills, there are still some waste generated from the materials when they are
cut, trimmed and sewed.
2.3
2.3.1
Fiber degradation during Life Cycle
Fiber degradation during laundry
The life cycle of textile fibers is such that they have to pass through rigorous conditions, which contributes to their degradation. The laundry process of textile
alone accounts to conditions and elements that lead to degradation of the textile
fibers. The fibers are degraded thermally by the heat used in the laundry machines. In the process of cleaning textiles in the laundry, the fibers are subjected
to abrasion, with the machines and other garments, which adds to degradation
process. The cleaning detergents, carry chemicals such as alkalines which cause
rupture to certain fibers. The bleaching chemicals have oxidation potential which
oxidize cellulose and in turn degrade them. When the fibers are dyed and printed
the some chemicals have reacting effects on degradation of the fibers. The later
sections below discuss more about the degradation of textile fibers in the laundry.
When we consider things practically, the textiles cannot be used forever, as
they eventually degrade. Degradation is a common factor which cannot be ignored in the life cycle of the textile fibers. This reduces the scale of recycling with
the textiles, and encourages the idea of upcycling as detailed in the section above.
2.3.2
Chemicals used during the laundry process
The washing of the fabrics in the laundry uses a lot of different chemicals. The
chemicals used by Päijät-Hämeen Tekstiilihuolto are produced by Ecolab. The
data sheet of the list of chemicals has been provided by Ecolab.
The following table 2.1 and 2.2 lists the chemicals which are mixed with the
laundry detergent.
2. Waste Flow and its Management
Name
Elpa Soft
Hygenil Alca
Eddikesyre
Tryplosan
Ozonit
Performance
17
Table 2.1: Chemicals used in the laundry
[30]
Composition
Amount Properties
Fabric Softner
5%
White odorless liquid
Odorless yellowish
Sodium
liquid with flash
25-35%
hydroxide
point >100
pH=13.2-13.6
Clear liquid with pH=1,
Acetic acid
60%
flash point >100
relative density= 1.07
White powder with
odor like chlorine,
Troclosene sodium,
35-50%
pH=9-11,
dihydrate
flash point >100
relative density= 0.98-1.15
Clear pungent liquid with
Peracetic acid
10-25%
pH=0.5-1.5, flash point=72
relative density=1.13-1.15
The laundry detergent is also composed of not one but many different chemicals. In the table, we list about the chemicals in the laundry detergent. Ecolab
was the supplier for the laundry detergent to Päijät-Hämeen Tekstiilihuolto, Lahti
and the data sheet of the chemicals is obtained from the same. The table 2.2 also
illustrates the possible effects of these chemicals on the human body. The need for
proper care and extra precaution is always advisable when working with these
chemicals.
2. Waste Flow and its Management
18
Table 2.2: Chemicals in detergent and their Toxicity
[30]
Concentration Physical Effects
Chemical
Potassium hydroxide
10-20%
C10-C18
Fatty alcohol
ethoxylate
5-10%
Polymer based on
long chain alcohol
C10 ethoxylated
alanine, n,nbis(carboxymethyl),trisodium salt
Sodium cumene
sulphonate
5-10%
Acute toxicity
Skin corrosion
Skin irritation
Serious eye
damage/eye
irritation
Serious eye
damage/
eye irritation:
1-2.5%
Skin irritation
Eye irritation
1-2.5%
Eye irritation
The detergent was cloudy and light yellow and had a strong ammoniac odor.
The emulsion had a pH of 13.4-13.8 with relative density of 1.21-1.29. This water
soluble substance has a viscosity of 961.728 mm2 /s. The disinfectant and chemicals used in the detergent are highly alkaline in nature. Alkalis are considered to
the main cause for degradation of fibers in the laundry. The washing detergent
used by Päijät-Hämeen Tekstiilihuolto, uses peroxides, for bleaching the fibers.
The chemicals provided by Ecolab, contains peracetic acid, which serves the purpose of bleaching, and has a strong oxidizing effects. Troclosene sodium is used
as a disinfectant for the textile fibers, and has a pH of around 9-11, symbolizing its
alkaline nature. The chemical, Eddikesyre, comprise of acetic acid and serves the
purpose of fabric softener and neutralizes after the washing cycle. The sodium
hydroxide present in chemical named Hygenil increases the pH of the solution
during the washing process. [30] [27]
2.3.3
Polyesters and its degradation
Polyesters are the substances containing ester groups, figure 2.6, in their main
chain. They are the most produced synthetic fibers used in textile production.
Polyester fibers provide a great combination of improved strength and resilience
at a reduced cost. Polyester as the basic polymer allows modification of fibers,
both physically and chemically to yield improved results. The normal shape and
2. Waste Flow and its Management
19
structure of fibers can also be changed attain the desirable properties. [31]
Figure 2.6: Ester group
The structure of polyester fibers, figure 2.7 strongly affects its properties and
they deeply influence the pertinence of the fiber. The process parameters have a
big impact in determining the structure of the fibers.
Figure 2.7: Polyester fibers
Polyesters are produced melt spinning, a continuous process where, the material is melted and pumped through a die with multiple holes called a spinneret.
The melt is uniformly distributed through in streams through the holes. Finally
these polyester fibers are twisted into yarns and woven or knitted into fabrics as
per the requirements. The figure 2.8 shows the melt spinning process. The drawing of fibers allow high degrees of orientation and crystallinity. The molecular
structure of the fiber is dependent on heat stabilization and the structure of the
fiber depends considerably on the temperature. [32]
Figure 2.8: Melt Spinning
[32]
2. Waste Flow and its Management
20
Table 2.3: Properties of polyester fibers
[31]
Tenacity
High
Elongation
High
Elastic recovery
High
Abrasion resistance
High
Stiffness
Medium
Resilience
High
Toughness
High
Initial Modulus
High
Moisture content
Low
Cross sectional swelling
Low
Heat of wetting
Low
Oil absorption
Medium
Ease of oil release
Low
Heat resistance
High
Softening and Melting
Medium
Decomposition
High
Combustibility
Medium
Alkali resistance
High
Acid resistance
High
Organic solvent resistance
High
Oxidizing agent resistance
High
UV resistance
High
Micro organism resistance
High
Tenacity
High
Moth and beetle resistance
High
Electrical resistivity
High
Specific gravity
Medium
The variable hot temperature in the laundry may lead to reduction of molecular weight of the polyester fibers. Continuous washing and prolonged exposure
to such the conditions may develop change in coloration of the fabrics [33]. The
extent of degradation due to acids on polyester fibers is comparatively less compared to the cotton fibers. The overall resistance of polyester fibers to alkali is
good. The solvents and chemicals in the detergent used for cleaning of the textile
materials has alkali and oxidizing agent in considerable amount. Polyester fibers
not only show the resilience against alkali but also, shows some stability against
at comparatively high temperature.
2. Waste Flow and its Management
2.3.4
21
Cotton and its degradation
Cotton is arguably the most common and important natural fiber used because
of its desirable properties. It offers a unique combination of good strength with
high absorbency required for the textiles. Around the world there are more than
80 countries producing cotton, and is projected that it grows best in subtropical
conditions. [34].
Cotton fiber have a multi layered lateral structure. The processing and use of
the fibers are particularly influenced by outer surface layer, where holds the most
of non cellulosic part. When observed under microscope, figure 2.9, cotton fibers
looks like twisted ribbons, called convolutions. There are about 60 convolutions
every centimeter throughout the fiber. These convolutions provide an uneven
surface which bolsters the inter fiber interaction, and reinforces the cotton yarns
of adequate strength to be spun. [34]
Figure 2.9: Polyester fibers
Cotton fibers have the tendency to withstand chemicals during processing, still
however given certain conditions, degradation can occur most likely. The agents
most likely to degrade cotton during processing or subsequent use are acids, alkalies, oxidizing agents, heat, radiations, and enzymes. The table 2.4 below lists
the some of the properties of cotton fibers.
2. Waste Flow and its Management
22
Table 2.4: Properties of cotton fibers
[34]
Tenacity
Medium
Elongation
Low
Elastic recovery
Low
Flexibility
Low
Abrasion resistance
Medium
Stiffness
Medium
Resilience
Low
Toughness
Low
Initial Modulus
Medium
Moisture content
High
Cross sectional swelling
Medium
Heat of wetting
Medium
Oil absorption
High
Ease of oil release
High
Heat resistance
Medium
Softening and Melting
High
Decomposition
High
Combustibility
High
Alkali resistance
High
Acid resistance
Low
Organic solvent resistance
High
Oxidizing agent resistance
High
UV resistance
Medium
Micro organism resistance
Low
Moth and beetle resistance
High
Electrical resistivity
Low
Specific gravity
High
The reaction of the cotton fiber to heat is one of the degradation process in the
laundry. It is a function of temperature, time of heating, and other conducive atmosphere for the heating. Heating cotton fiber 110 to 120o C drives off adsorbed
moisture. As long as temperature is maintained below 120o C, there is little change
in the fiber after heating. When the cotton fibers are heated above 140o C the tensile strength and viscosity starts to decrease and complete loss of tensile strength
occurs at or above 200o C. Cotton is frequently treated with alkali in the processes
preparatory to dyeing, and in some parts of the laundry process. Reaction of cotton with alkaline materials and bleaching at high temperature could lead to loss
2. Waste Flow and its Management
23
in weight of the fibers. The formation of oxycellulose due to the oxidising agents
agents present in the detergent, peracetic acid in this case, is a major factor in
the degradation of cotton in laundry. They are characterized by the affinity for
alkalis. [35] [36]
2.4
Framework of research
A research carried out by Palm et al. studied the burning problem of increasing
textile waste in the Nordic region. It gives in depth details about the practices and
methods of working supported by valuable figures. The study created a research
gap, missing on the ways to use the waste textiles. The renewcell technology aims
to develop regenerated cellulose, but the research is still in progress and not been
commercialized. The practice to utilize textile waste and measure their properties
sufficient to be upcycled, remains unexplored. [2] [37]
The textile waste generated from the hospitals are mixed blend and cotton
fabrics. Päijät-Hämeen Tekstiilihuolto have lots of waste textiles, some of which
are utilized by recycling companies. The rest of the waste, a sizable amount ends
up in the landfills. TAUKO Designs, uses these waste textiles from Päijät-Hämeen
Tekstiilihuolto to make new garments. They trim the textiles for different parts to
make separate garments. The properties of the textiles are inhomogeneous and
non-uniform. There are other deformations detected once the textile are dyed
and printed. The strength of the textile materials are suspected to be dissimilar at
different parts.
In this research, the mechanical properties of the waste textiles were evaluated. The values were compared with the original samples. The difference in
values was used to detect the change in properties of textiles after being used.
The amount of fiber content was also calculated from different parts to observe
the quantity degraded. It also derived conclusion on whether the same textiles
are degraded equally or they have different patterns of degradation.
24
3.
RESEARCH MATERIALS AND METHODS
3.1
Empirical Study
This research aims to find out the change in properties of the textile fabrics after
being used and degraded. The results from the experiments were utilized to improve the process of upcycling of the textile waste. The samples were measured
from different parts of the fabrics, mainly corner and center, as the degradation
pattern and properties were dissimilar. The results when compared to the original samples to estimate the extent of degradation of the fibers. The laundry conditions and the chemical were also taken into consideration as they contribute to
the degradation of the textile fibers.
3.1.1
Performance of Empirical study
The values for mechanical properties of the textile fabrics were calculated. The
tests for thread count and thickness of the material were discontinued, after the
initial trials, as the results for the used or recycled fabrics showed similar values in comparison with their original samples. Breaking force for warp and weft
direction were calculated, from corners and centers for each original and used
fabrics. Mass per unit area was also evaluated for different samples from corners and center for original and used samples respectively. Fiber content from
different parts of recycled and original samples helped to predict the disparity in
degradation of the fibers.
The following flowchart 3.1 will explain the materials used and the experiments carried out on those materials.
3. Research Materials and Methods
25
Figure 3.1: Materials and experiments used for characterization
3.2
Validity and Reliability
There two different samples taken for each test, one from the corners and the
other from the center. Furthermore, each sample from corner had two specimens,
one warp and the other weft. The picture 4.13 below demonstrates better the idea
of center and corners. The smaller rectangles in the picture mark the area where
samples are cut out. The figure helps to understand better and gives a clear idea.
A buffer of 20 cm from each side is classified into as corners and the rest falls
in the center region. The specimens were not always cut from the horizontal
direction but also from the vertical direction. Since there were many samples to
be extracted from a single sheet, the area to trim the new samples was reduced
every time.
3. Research Materials and Methods
26
Figure 3.2: Corners and Center
There were 5 different samples tested and it was noticed that, five samples is
not enough to form a conclusion. Moreover, the samples from the corners are not
equidistant, and the results can be affected. The area at the corners was not large
enough to extract both warp and weft samples from the same point. Hence the
warp and weft samples were obtained from different places in the fabric according to the convenience. This can also contribute to the disparity and inconsistency
of the results. Though the composition and application maybe similar, the original and the used fabrics are not from the same lot. Hence, the results may not be
completely accurate.
3.3
Materials
There were three different product materials samples with varying composition
used for this research. The set of samples were provided by TAUKO Designs
and Päijät-Hämeen Tekstiilihuolto. The materials were as follows.
• Blanket Cover (Polyester/Cotton)
• Bed sheet (Polyester/Cotton)
• Bed sheet (Cotton Twill)
• Bed sheet (Cotton Plain)
Two different set of blanket covers were characterized, written as original and
unused or recycled. The structure of both the samples were plain woven. The characterization data of the two samples were compared to draw a better conclusion.
The bed sheet sample was the second sample prepared from the mixture of
polyester and cotton fabrics. The structure of the sample was plain woven like
3. Research Materials and Methods
27
the blanket cover. There were two different samples, original and recycled, used for
the research. There were two used sample of PES/CO bed sheet characterized.
There were two more samples of bed sheet, provided, both manufactured from
cotton fibers. However, the structure of the cotton fibers were different from each
other. The first bed sheet posses a twill structure in comparison to the second one
which followed a plain structured.
The standard composition ratio of polyester/cotton fibers which are to be used
for hospital textiles is 50/50%. This is an authentic value recommended by SUOMEN
STANDARDISOIMISLIITTO (SFS). [38]
There were a set of used and original materials used to help create a comparison of the data between the two. It must be noted that "Mass per unit area" and
"Breaking force" was calculated for all the materials available. Thread count and
Thickness of the materials were calculated only for the first lot of blanket covers
and bed sheets. It was concluded after the first set of experiments that thickness
and thread count does not vary much and hence does not have a significant impact on the properties of used textiles. It should also be pointed out that there are
two sets of used PES/CO bed sheet available to be tested and hence we have two
different data to compare for the blended bed sheets.
3.4
3.4.1
Methods
Composition of fibers
The composition of polyester and cellulose fibers in the fabric was determined by
the method mentioned in the standard [39]. According to the standard the cellulose fibers were dissolved out of a known dry mass. The sample was weighed
before and after dissolution and the amount of polyester fibers left was calculated
using a formula.
The fabric specimen was cut in minute parts and filled in a small glass container. The glass container with the sample was oven dried at a temperature of
105 ± 3 ◦ C for not less than 4 hours and not more than 16 hours. The container
was removed from the ventilated oven after drying and weighed. The weight of
the container with and without the sample was recorded. This determined the
weight of the dry sample. The specimen was kept in the desiccator, containing
self indicating silica gel, for another 4-16 hours. A suitable solution of 75% mass
fraction of sulfuric acid and a dilute solution of ammonia, (ρ 0.880 g/ml) was
prepared. The fabric sample was placed in a conical flask and 200 ml of sulphuric
acid per gram of specimen was added. The flask was corked with a stopper and
put in a temperature of (50 ±5) ◦ C with constant shaking for 1 hour. After an
hour, the cellulose fibers were dissolved, it was verified by observing one fiber
3. Research Materials and Methods
28
under a microscope. The microscope used in this research was Leitz Labourx D,
figure 3.3.
Figure 3.3: Microscope used to see dissolved cellulose
The contents of the flasks were filtered through a glass crucible using suction.
The crucible was drained and washed with fresh sulphuric acid. The residue
was thoroughly washed with cold water and ammonia to neutralize and remove
any traces of sulphuric acid. It was washed again with cold water, to eliminate
ammonia, in the sample. Finally the crucible was drained using suction, and it
was dried in the ventilated oven for another 4-16 hours before being cooled and
weighed. The sample was weighed to an accuracy of 0.0002g. The amount of
polyester left in the sample was calculated using the equation 3.1.
P=
100 × m1 × d
m0
where
P is the percentage of clean dry insoluble component, polyester in this case
m0 is the dry mass of the specimen
m1 is the dry mass of the residue
(3.1)
3. Research Materials and Methods
29
d is the correction factor of the variation in mass soluble component, its value is
1.00 in this case
The tests were carried out for 3 different samples and the mean was recorded as
the determining value.
3.4.2
Tensile properties of fabrics
The tensile property of breaking at maximum force of the fabric was determined
by a technique called strip method. The idea is that the sample of a fixed dimension is prepared and shear force at a constant rate is applied to it. The sample is
extended in a vertical direction until it ruptures. The point at which the sample
breaks is monitored and the tensile parameters such as force and rupture time is
recorded. There were 5 different samples tested and their mean was observed as
the determining value.
Prior to the test, the sample was prepared according to the norms laid by the
Finnish Standards Association (SFS). There were two sets of specimen cut out,
one each in warp and weft with their length parallel to the direction. Each set
had five test samples none of which cut out from within 150 mm of either edge
of the fabric. The test specimen did not have the same longitudinal in the warp
direction and no similar picks in the weft direction. The dimension of the sample
was 50mm ± 0.5mm. The threads were removed from each long edges, approx
0.5mm from the edge of the strip. The following table 3.1 lists other parameters
and functions used in the test. [40]
Table 3.1: Testing parameters
[40]
Test speed
100 mm/min
Width
50 mm
Thickness
1 mm
Pretension
2N
Humidity
65%
Temperature
20◦ C
The desired value data for the test were entered in the field and the equipment
started. The equipment used for this test was Testomeric M500 25kN. The equipment contained two jaws, vertically opposite each other, one movable jaw and the
other fixed. The sample was fixed between the two and the movable jaw, applied
the vertical force on the sample, until it ruptured, figure 3.4. The final result was
calculated in the units "Newton (N)".
3. Research Materials and Methods
30
Figure 3.4: Tensile Testing Machine
3.4.3
Mass per unit area
The term mass per unit area is self explanatory and it means to calculate mass in
grams of a sample over a calculated area. The main principle of the test is that the
specimen is cut of fabric and weighed. The mass per unit area of the sample is
then calculated using a formula. The sample fabric was kept in relaxed state, 65%
humidity and in 20◦ C, for at least 24 hours. The standard suggested that sample
of area 100cm2 should be used. We cut a square specimen of 10cmx10cm each. A
pair of scissors was used to cut the sample with precision. Next the samples were
weighed in the weighing machine, and the data values were recorded. The final
result was calculated using the formula 3.2. [41]
M=
where:
m × 10000
A
(3.2)
3. Research Materials and Methods
31
m is the mass of the test specimen
A is the area of the specimen in the square meters
The test was carried out for 5 different specimens of warp and weft each. The
mean of the samples were considered as the final result and it was used as the
comparing value.
3.4.4
Thickness
The sample used for the mass per unit area, was reused as the sample for the
thickness tests. The conditions for the sample preparation were the same, 65%
humidity and 20◦ C. The sample was put in this condition for at least 24 hours
before being tested. The apparatus for the thickness tests is designed such that,
there is a pressure foot, of an appropriate area. A second plate, called the reference plate, with the upper surface diameter of 50mm or greater is in the equipment. The thickness of the fabric is defined as the perpendicular distance between
two reference plates and exerting a pressure of 1 kPa or less on the fabric. The
principle of the test is, the specimen is pressed between the two plates for a specified amount of time and the value is recorded [42]. There were 5 different samples
tested and their mean value was regarded as the final value.
The first set of fabric samples were tested for their thickness and we reached
a conclusion that, the values were very close for the recycled and the original
sample. This suggested that the thickness does not vary considerably between
the recycled and original sample. The thickness test was not performed for the
next batch of samples. The results of the thickness tests are in appendix chapter
of the thesis.
3.4.5
Thread count
The thread count of the fabrics is defined as the number of threads, per 3 cm of
the textile. The count is taken in both warp direction and weft direction. Thread
count is one of the criteria which determines, how soft the fabric feels. The value
of the thread count, with mass per unit area helps to relate a better condition
of the fabrics. The standard lists 3 different methods to determine the thread
count. The first, named "Method A" was used for this research. The standard
recommends to use this method in case of a dispute. A specified area of specimen
was cut of the fabrics and the number of threads was counted for centimeters.
The result was tabulated for warp and weft direction [43]. Similar to the previous
test, 5 different samples were tested and their mean value was considered to be
adjudicating value. The results of the thickness tests can also be found in the table
in on the appendix chapter of the thesis.
32
4.
RESULTS AND DISCUSSIONS
This chapter describes the experimental results and data. It is divided into two
major sections, result, which tabulates all the values, followed by discussion
raised from the results. First, the data collected from different experiments are
tabulated. The corresponding bar graphs of the respective samples are plotted
and the values are evaluated. The analyzed results and compared with different
samples to form the discussions.
4.1
Results
This is the first of the two sections, first the data for the original samples are
presented. It is then followed by the data for the recycled or used samples. The
values of both the set of fabrics are eventually compared. The results are round
off to the next whole number.
4.1.1
Sample 1 Blanket cover Cotton-Polyester Blend
The tables below 4.1 and 4.2 presents the data for the original and used blanket
cover, comprised of polyester-cotton.
Table 4.1: Blanket Cover PES/CO original
% of PES left
Corner
Center
Mean
Standard Deviation
Mean
Standard Deviation
57
0.7
57
0.15
Breaking Force (N)
Warp
845
37.9
825.5
57.3
Weft
366
85
366
85.3
Mass per unit
area (gm/m2 )
144
3.3
143
1.6
4. Results and Discussions
33
Table 4.2: Blanket Cover PES/CO used or recycled
% of PES left
Corner
Center
Mean
Standard Deviation
Mean
Standard Deviation
54.9
0.5
54.9
0.2
Breaking Force (N)
Warp
718
169.11
842
64.01
Weft
405
56.42
428
29.94
Mass per unit
area (gm/m2 )
151
1.24
151
1.05
The amount of polyester left after the dissolution of cotton is slightly more in the
original samples. This result for the amount of polyester left in the samples, was
same as predicted. The standard deviation of the breaking force at the corner
was measured very high. This can be credited to the fact that the breaking force
is not similar all throughout the corner. The degradation at the corners are not
homogeneous and some parts of the corner are stronger while the other parts are
not. However the mass per unit area of the used or recycled fabric are more than
the original fabric. The Standard suggests that minimum mass per unit area for
a polyester cotton blend should be 130 gm/m2 with a tolerance 10. The same
standard suggests the basic value for breaking force to be 350 N for both warp
and weft [44]. The standard deviation at the corner of the warp sample is high,
which marks the non-uniform degradation in the samples. Since the fabric is not
degraded uniformly, the reliability of the results from one set of sample cannot
be completely trusted.
Figure 4.1: Blanket cover PES/CO % of polyester left
4. Results and Discussions
34
Figure 4.2: Blanket Cover PES/CO breaking force
Figure 4.3: Blanket Cover PES/CO mass per unit area
The graphical pictures above gives us an idea of the comparison value of the
used and original blanket covers from the hospitals. The results are interesting
and some values do not change much while the others change considerably. Standard deviation is marked at the top to show the variation of a set of data values.
The difference between the values of breaking force is not significant at corners
and center. However, there is a change in mass per unit area noticeable. This
could be explained for fact that the fabric might have shrinked due to the laundry
process. The area measured for the original fabric is same but the amount of fibers
had increased in the same area due to shrinking. The degradation pattern of the
blanket cover is depicted in the 4.4.
4. Results and Discussions
35
Figure 4.4: Blanket Cover PES/CO degradation pattern
4.1.2
Sample 2 Bed sheet Cotton-Polyester blend
A polyester cotton blend bed sheet sample set were tested for different properties.
There were two different sets of recycled or used samples of bed sheet tested and
the tables below present the data for the samples. In comparison we have the data
for one original sample. A total of five samples each were tested and the mean
of the values are presented in the tables 4.3, 4.4 and 4.5 below. The standard
deviation is marked below the mean to obtain the consistency of the samples.
Table 4.3: Sample 2 Bed sheet PES/CO Original
% of PES left
Corner
Center
Mean
Standard Deviation
Mean
Standard Deviation
53.5
0.17
54
0.23
Breaking Force (N)
Warp
803
175.55
846
37.64
Weft
559
160.25
656
87.24
Mass per unit
area (gm/m2 )
154
1.66
152
1.82
4. Results and Discussions
Corner
Center
Corner
Center
36
Table 4.4: Sample 2 Bed sheet PES/CO Used or Recycled
Mass per unit
% of PES left Breaking Force (N)
area (gm/m2 )
Warp
Weft
Mean
52.1
487
342
185
Standard Deviation
0.49
42.99
49.19
2.7
Mean
51.5
451
338
180
Standard Deviation
2.17
44.44
44.1
1.42
Table 4.5: Sample 2.1 Bed sheet PES/CO Used or Recycled
Mass per unit
% of PES left Breaking Force (N)
area (gm/m2 )
Warp
Weft
Mean
60.5
681
356
164.29
Standard Deviation
0.74
53.15
38.47
1.03
Mean
61.1
695
445
159
Standard Deviation
0.72
58.17
19.01
2.59
It is very notable that a high value of the standard deviation breaking force is
visible in the original sample of the bed sheet. The strength of the fibers in the
original sample is not uniform throughout the corners. The Standard provides
the official value data that applies to this case. The standard value for breaking
load is 350 N both warp and weft while the value for mass per unit area is 120
gm/m2 [38] [45]. The mass value of the original sample is lower than the recycled
one. The difference in the breaking force between the samples is also significant.
Though both the values are in the limits of the standard value, but the difference
in values is notable. The graph below shows the comparison between the original
and the first recycled fabric.
4. Results and Discussions
Figure 4.5: Bed sheet PES/CO % of polyester left
Figure 4.6: Bed sheet PES/CO breaking force
Figure 4.7: Bed sheet PES/CO mass per unit area
37
4. Results and Discussions
38
The comparison graphs of the two are uneven and less uniform in certain
cases. This suggests that it difficult to predict the amount of degradation. There
were two used sample tested and the results show significant difference. The second used sample, used sample 2, showed values similar to that of the original.
It was used as the reference of comparison. The second table 4.5 is mentioned
to give the idea of the difference in values of the two used samples. A material
with similar composition and application shows different levels of degradation.
Hence it is difficult to determine the age of the used samples, to predict a common
pattern for degradation.
If the two results are analyzed, there is a visible rise in the polyester content after dissolution of cotton fibers. The increased value of polyester also justifies the
higher values of breaking force for the first used sample. It is interesting to note
that the value of mass per unit area at the corner is higher, which is unconventional. A non-uniform distribution of mass along the fabric could lead to increase
in the mass per unit area at the corner. If the second used sample is scrutinized,
a dissimilar pattern is notable. A high percentage of polyester left at the corners
justifies the higher value of breaking force and mass per unit area. If all the values of both used samples are examined, in reference to the original sample, the
following pattern 4.8 is formed.
Figure 4.8: Bed sheet PES/CO degradation pattern
4. Results and Discussions
4.1.3
39
Sample 3 Bed sheet Cotton Twill
A bed sheet manufactured from 100% cotton was tested for its breaking force
and mass per unit area. The bed sheet had twill structure, and the color of the
original sample was white, in contrast with red color for the recycled or used
sample. There were 5 different data generated from the tests and the mean of the
values are mentioned in the table 4.6 and 4.7 below.
Table 4.6: Sample 3 Cotton Bed sheet Twill Original
Mass per unit
Breaking Force (N)
area (gm/m2 )
Warp
Weft
Corner Mean
814
446
251
Standard Deviation 21.73
57.49
1.34
Center Mean
879
503
249
Standard Deviation 47.77
11.05
0.66
Table 4.7: Sample 3 Cotton Bed sheet twill used or recycled
Mass per unit
Breaking Force (N)
area (gm/m2 )
Warp
Weft
Corner Mean
481
311
286
Standard Deviation 99.8
84.8
1.32
Center Mean
562
354
283
Standard Deviation 35.09
40.78
2.27
The value of the breaking force for the original samples were observed more
than the used or recycled ones. There was a major difference spotted in breaking
force for warp direction of the two fabrics. However, the mass per unit area of
the recycled or used fabric was reported to be more than that of their original
counter parts. The mass per unit area of the both the samples were more than the
minimum standard guidelines of 180 with a tolerance level of 20. Interestingly the
value of the breaking for used or recycled cotton sheet was less than the standard
value [46] [47].
4. Results and Discussions
40
Figure 4.9: Bed sheet cotton twill breaking force
Figure 4.10: Bed sheet cotton twill mass per unit area
The orange and blue bars in the graph show major difference in the values for
the two samples. The orange bar denotes the mass per unit area of the used or
recycled fabrics and the difference with the blue is higher. Shrinking could be the
possible explanation for such variable results. If breaking load is observed, the
values for weft samples is less than the warp ones for both original and recycled
fabrics. The difference in the value for warp samples are more than the weft ones.
The predicted degradation pattern of the sample is depicted in figure 4.11.
4. Results and Discussions
41
Figure 4.11: Bed sheet cotton twill degradation pattern
4.1.4
Sample 4 Bed sheet Cotton Plain
There was another set of plain woven cotton bed sheet tested for breaking force
and mass per unit area. Similar to previous tests, the values were calculated for
5 different samples and the mean value was taken as the considering value. The
original set of value was white in color and the used or recycled sample was blue.
The following tables 4.8 and 4.9 presents a neat group of values for the samples.
Table 4.8: Sample 4 Bed sheet Cotton Plain original
Mass per unit
Breaking Force (N)
area (gm/m2 )
Warp
Weft
Corner Mean
477
422
198
Standard Deviation 36.6
93.28
0.87
Center Mean
485
512
197
Standard Deviation 45.21
22.2
2.34
4. Results and Discussions
42
Table 4.9: Sample 4 Bed sheet Cotton Plain used or recycled
Mass per unit
Breaking Force (N)
area (gm/m2 )
Warp
Weft
Corner Mean
365
271
231
Standard Deviation 69.55
47.2
2.24
Center Mean
406
343
227
Standard Deviation 77.29
82.65
0.42
The breaking load for the original samples are more than the recycled ones.
The mass per unit area is lower for the original ones compared to their recycled
counter parts. Though both the values are acceptable as they fall in the threshold
value mentioned in the corresponding standards. Similar trend was observed in
the cotton fabrics with twill structure, but the breaking load value was more than
twill than for the original [46] [47].
Figure 4.12: Bed sheet cotton plain breaking force
Figure 4.13: Bed sheet cotton plain mass per unit area
4. Results and Discussions
43
If the comparison graphs are carefully observed, the difference in mass per
unit area of the two samples are more as in comparison with the twill structure.
The values for breaking force between the warp and the weft are alike and the
difference between the two is not significant. The difference in the mass per unit
area is prominent and it follows the same trend as the twill structure. The change
in mass per unit area of the used sample could be reasoned to shrinking, similar
to the previous samples. The breaking force value for the recycled or used fabrics are higher at both corners and centers. The degradation pattern of the plain
structure is similar to that of its twill structure.
Figure 4.14: Bed sheet cotton plain degradation pattern
4.2
Discussions
The degradation of the textile fibers, cotton and polyester in this case, can be
attributed to many factors, including application area, conditions, time of use.
But one of the important degradation parameters is the laundry process. Through
the course of this research thesis three main elements of the laundry were found
to be the chief contributors for degradation. Apart from the laundry process, the
fabrics tend to undergo through rigorous conditions over the time of their usage.
• Temperature
• Alkali
4. Results and Discussions
44
• Oxidation
• Abrasion (during to use)
The high temperature is produced by the laundry machine, while the other
two factors arise due to the chemical present in the detergent. The degradation
of fibers due to the above mentioned factors have been discussed in the previous
chapters.
Dissolution of cotton A research carried out to study the degradation of cotton from the cotton polyester blended fabrics suggests that 57% of the cotton
will degrade in very rigorous and harsh mechanical conditions [48]. If we calculate the average value of the results from the tests and experiments conducted
throughout this research it shows, around 45% of the cotton is degraded from the
blanket covers and roughly 46% from the blended bed sheets. The degradation
values when compared to their original counterparts advocate that 2-4% of the
cotton degrades from the blend in both cases. Though, it is uncertain to assert the
exact degradation values, since the products do not degrade uniformly and the
samples tested were from different lots. The same study also mentions that 80%
dissolution of cotton can be done on purpose by creating extreme mechanical and
cellulose enzyme conditions. Such conditions are not practically generated in the
life cycle of the textile fibers. The purpose of the study is to investigate the destroying condition of the cotton fibers from the fabrics. We compare our results
with the ones in the study and conclude that the conditions our fabrics are used
will not destroy the cellulose fabrics completely.
If we put our case in reference to the waste hierarchy, this could qualify for
the process of upcycling. The conditions of degradation in the case study is not
similar, but it proposes that cotton from the blend can degrade more in other conditions. In the view point of Päijät-Hämeen Tekstiilihuolto and TAUKO Designs,
both the organizations can utilize this waste and upcycle it for new textiles.
Mass per unit area A study by Vasconcelos and Cavaco, suggests that the maximum amount of weight loss in a cotton fabric, due to mechanical washing is 45%.
The washing conditions in study were extreme, with a 15 disc washer at a high
temperature of 150 ◦ C for six hours [49]. The laundry conditions at Päijät-Hämeen
Tekstiilihuolto are comparatively mild, with the processing time of around 30-35
minutes and temperature of 70 ◦ C. The mass per unit weight of the waste materials reduce less than 20% for both plain and twill cotton blended fabrics.
The Standard mass per unit area value for light suits is 270 gm/m2 and for
shirt/ blouse is 85 gm/m2 . The values obtained from the experiments show
4. Results and Discussions
45
that the mass per unit area used cotton twill bed sheets are roughly around 280
gm/m2 . This qualifies the cotton waste to be upcycled for the manufacture of
shirts and blouses.
Upcycling of twill cotton bed sheets on the basis of their mas per unit area
can be used an option by both the firms, TAUKO Designs and Päijät-Hämeen
Tekstiilihuolto. This viable alternative of using cotton twill bed sheet falls in the
level of reuse and recycle in the waste hierarchy pyramid. The description earlier
already mentions upcyling as a better substitute to recycling and downcycling.
Breaking Force Breaking Force is an important factor to be considered in the
recycling of textile waste. The value of the breaking force for the waste textile of
cotton-polyester blanket cover and bed sheet is calculated to be around 500 N on
the average. The average value of breaking force for cotton bed sheet plain woven
is around 350 N and that of cotton twill is 425 N. The value of breaking force increases for used cotton polyester blend, because the amount of cellulose reduces,
thereby increasing the amount of polyester in the blend. The force required to
break the polyester fibers is more compared to the cotton. In general opinion, the
higher value of a cotton polyester used fabric can be delusional. If we compare
the breaking force for the waste samples we obtained, the values are higher than
the minimum requirement for most of the conventional fabrics. This explores the
viable option of upcycling for both TAUKO Designs and Päijät-Hämeen Tekstiilihuolto.
The possibility of upcyling of the used hospital textiles are wide but there are
a certain hurdles in the chain. During the research work for the thesis, it was
observed that, a uniform degradation pattern can bolster the upcycling process.
If a code or a chip could be planted inside all the textiles to monitor their usage
time and laundry cycle, some amount of degradation can be predicted. Though
it is difficult to determine the exact degradation value but a code or a chip will
help to get improve the productivity of upcyling. Since, the application time of
the textiles are hard to predict, one cannot get same values for the similar textiles.
Hence the quality and property of two similar upcycled product can vary.
An example can help to understand the issue of the case better. Let us consider
three different bed sheets are upcycled to one dress. The bed sheets were used for
different amount of time before being turned into waste. A similar kind of dress
was made from three alike bed sheets but the application time of these sheet
varied. We had two same dress made from six bed sheets of same composition
but usage time. The pictures 4.15 and 4.16 helps to understand better. The usage
4. Results and Discussions
46
time or years have marked in the bed sheet, and the final product is the same.
Figure 4.15: Dress 1
Figure 4.16: Dress 2
The two similar dresses in the picture might vary in their quality and properties, since the usage time for the bed sheet to make the dress are different. This
amounted for different degradation behavior and values of the same bed sheets.
If a method is devised to predict the degradation behavior or monitor the degradation pattern, the upcycling process could be reinforced.
Breaking force of the waste fabric was used as one of the bases to determine
the upcycled products. The table 4.10 below lists the minimum requirement of the
4. Results and Discussions
47
breaking force for some of the fabrics [?]. Since the properties of the bed sheets
vary and the reliability of the data cannot be verified.
Table 4.10: Minimum Breaking force requirements for some fabrics
[50–56]
Fabric
Breaking Force (N)
Light Woven
150
Shirt/Blouse
150
Woven Shirt/Blouse
200
Woven Dress
200
Trouser
400
Woven Suits
300
Light Suits
250
Based in the values of breaking force of the fabrics, a possible application for
the waste fabrics can be suggested. The table 4.11 mentions the potential products
which could made from the material available.
Table 4.11: Potential use of waste fabrics on the basis of their characterization
Fabric
Sample
PES/CO Blanket Cover
PES/CO Bed sheet
Light woven Shirt/Blouse
Cotton Twill Bed sheet
Cotton Plain Bed sheet
PES/CO Blanket Cover
PES/COBed sheet
Woven Shirt/Blouse/Dress
Cotton Twill Bed sheet
Cotton Plain Bed sheet
PES/CO Blanket Cover
Light suits
PES/CO Bed sheet
Cotton Twill Bed sheet
Woven Suits/Overcoats
PES/CO Blanket Cover
Trouser
PES/CO Blanket Cover
The section above discussed the ideas and possibilities of upcycling of the waste
textiles, according to their characterization on the basis of the their properties.
The following sections will explore the idea of either reuse or downcycling of
4. Results and Discussions
48
the textiles. The scope of the thesis is to exploit and analyze the level reuse and
recycling in the waste hierarchy pyramid.
4.2.1
Charity
The first idea to use the waste textile would be as second hand garments. The
practice of charity is a socially accepted and appreciated act. There are various
government and non-government organizations, Red Cross being one of them,
which collect the used textiles and transports it to the under developed countries.
People in certain parts of the world does not have access to the basic clothes and
garments. These organizations help them with such initiatives, thus contributing
in the development of the under privileged. Charity is one common practice
and it does not require the utilization of energy to transform the waste into new
products. Charity promotes the idea of reuse of the waste textiles.
Though charity is a noble act and it is encouraged more. But with the environmental point of view, the clothes end up being waste again, after they are
used. The most probable outcome is that they end up in either landfills, which is
the highest possibility or are incinerated. This does not help the waste hierarchy
pyramid or improve the upcycling process.
4.2.2
New commodities
The waste textiles are turned into new commodities, the process may vary according to the commodity and use. In this section we discuss the application of
textile waste as new commodity with the utilization a low amount of energy. The
functionality of the waste is limited and this section highlights the development
of new commodities from the waste.
Dafecor Oy Dafecor Oy is one of the few commercial companies operating in
Industrial recovery of textiles. They produce products such as wipes for absorbing liquids, covering blankets and wadding. Dafecor receives and sometimes
purchase their raw material from various different places. Many industries and
small centers provide them with textile residues, such as wool and cotton. The
households gather a big amount of textiles waste in the form of sheets, pillow
cases and other similar products. Some new clothes with flaws in the design and
such others are unusable in the households. These wastes are sorted and provided to Dafecor. There are other organizations, some NGOs, like the Red Cross
deliver sorted cotton waste to Dafecor. Some products such as jeans, underwear
and sweat shirts are not used by the company. There is a utilization of about 100200 tonnes of waste textiles each year. The company employs six to 10 people
4. Results and Discussions
49
and since the demand for their product is less, Dafecor does not utilize its full
capacity. [2]
The company kind of reuses the waste textiles, but not upcycle it. The wipes
produced are used places like the automobile service centers. They absorb fuels
and other chemicals which could be harmful if disposed in the environment. In
this research the cotton bed sheets can be used to produce industrial wipes they
show good property to absorb. But the real issue is the disposal of the wipes after
their use. The idea to turn the waste in to wipes is not the best possible alternative
but it can be placed low on the priority list.
Ekocenter Jykatuote Ekocenter JykaTuote is another company which uses waste
textiles to work on social basis. They are active in collecting waste textiles from
the households. They have collection points in localities and residential areas.
Hintikka in his report suggests, there are around 16 containers in residential areas, 2 in supermarkets and they gather around 300 tonnes of waste every year [2].
These collected textiles are sorted into various categories:
• second hand clothes to be sold
• clothes donated to charities
• textiles to be use in their own production line
• waste to be sent to incinerators
The ones which are to be utilized in the company’s own production line are
further sub-categorized and sorted into cotton, light cotton, linen, synthetics and
wool. The textiles are processed according to fibers- cotton is used for industrial
wipes while synthetics are wool and synthetics are processed to be used as flock
materials for felts. The popular products by Ekocenter includes mats, paddings
for packaging and insulation felts. Since there is a scarcity of demands for the
final products, JykaTutoe, like Dafecor, are unable to utilize their full capacity of
the production line. There is a stiff competition for JykaTuote against the products
from the raw materials. They have also reported a notable dip in the supply of
suitable materials and sometimes these materials have to be brought from Estonia
for they are cheaper. The excess textile are sometimes sent to Estonia for free, the
client only bears the transportation cost. [2]
The system to sort the textile waste is beneficial for the contemporary companies. If there is an efficient system to sort the waste, the reuse and recycling
process can be made more swift. If the other associations work with Ekocenter
Jykatuote, the cycle to utilize the waste can be efficient and reduce the amount of
textile waste.
4. Results and Discussions
50
Suomen Poistotekstiilit Ry Suomen Poistotekstiilit Ry is an association for formed
in 2012 for better circulation of textiles, their recovery and reduction of waste in
Finland. They also work on increasing the awareness of the textile recycling,
different methods of reuse and recovery of textiles. The other operations of the
organization is to network well to collect, distribute the exhaust textiles to other
recycling centers. They are also active in holding discussions, making proposals and forming associations with other organizations working in the same field.
Suomen Poistotekstiilit is also keen on carrying out certain campaigns to reinforce
the textile reuse and recovery structure in Finland. [57]
The motive and principle of Suomen Poistotekstiilit Ry, is to create awareness
and expand the information textiles, its applications and waste. This could be
used as a channel for the smaller recycling companies to advertise themselves
and expand their network.
Lovia Collection Lovia Clothing is a small scale start up company which produces clothing and accessories. They utilize small portion of recycled and organic
textiles for their production. They have small group of employees and outsource
some of their business to Estonia. The clothing is made in Finland upon order
and the target is conscious adults, appreciating sustainability and local production. [58]
Lovia is one of the many small scale industry which works in the field of recycling and reusing textiles. The company if collaborate with other such companies
can create a strong and efficient system. Textiles is a portion of the materials used
to produce their product. It can be encouraged further to work in the field of
textile materials. If we refer the status of the company on the waste hierarchy
pyramid, they mostly work in the field of recycling.
Insulation Materials One small scale application of the recycled textile material could be to use it as insulation materials. The cellulose generated from cotton
can be used for thermal or acoustic insulation. The application areas could be
buildings and cars. In a country like Finland, where the difference in temperatures during summers and winters is high, thermal insulation could be a very
feasible prospect. Some studies conducted have compared insulation properties
of cellulose with similar materials and concluded that cellulose cold be a better alternative. The conventional insulating material, polystyrene foams are expensive
and use chloro-flurocarbons which are linked to ozone depletion. Some other
insulation materials such as wool batts used in Denmark, have lower thermal
efficiency than cellulose [59] [60]. Thus using cellulose from the textile wastes
could not only be environmentally beneficial but also comparatively cheaper in
4. Results and Discussions
51
the long run [61].
Termex, a Finnish company operates in the field of cellulose insulation. The
main cellulose extracting material for the company are waste newspapers. If cellulose extracted from the textile waste could be utilized for this purpose, it would
reinforce the textile upcycling structure [62]. There are few other companies in
Finland like Northstar, that use cellulose for insulation.
The use of waste textile as insulation materials is a feasible, good sustainable
prospect. It is hard to measure the prospect on scale of upcycling, recycling and
downcycling. The materials used for insulation is cellulose. In this research,
cotton bed sheets can be used as insulators but the blended fabrics may not be
considered.
4.2.3
Dissolution of Cellulose
In this section we discuss the three main methods to dissolve cellulose and use
it again as regenerated fibers. The process mentioned converts the waste into
new materials or products of better quality and environmental use. The method
to reuse the waste with regenerated fibers be put into the category of upcycling.
The considering factor is that the technologies mentioned in the section are still in
development and novel. The accessibility of these technologies for either TAUKO
Designs or Päijät-Hämeen Tekstiilihuolto might not be readily available yet.
Re:newcell There is a novel textile recovery method devised in Sweden called,
renewcell. The process aims to recycle cellulose textiles into string new viscose
fibers. The process involves treatment with environmentally friendly chemicals
in a closed system. The waste textiles are first cleaned off all the dirt because the
impurities could clog the spinnerets. Cellulose pulp are the intermediate products, which are used as inputs for the production of viscose fibers. [37]
The process seems to be very effective and promising, but there are some short
comings for it too. The strength of primary viscose fibers are low when using
100% recycled cotton. Blending it with virgin materials is a possibility being investigated to reach the optimum strength. The company speculates the supply of
raw materials in abundance and the application of process on a large scale [37].
Method The textiles are first collected, sorted and shredded before the actual
renewcell process. The textile wastes are then chemically pre-treated, and then filtered to separate unwanted materials. Next, textiles are again treated with chemicals to form regenerated cellulose. The waste generated in the process are either
incinerated or sent to water waste treatment plant [63] [37]. A rough flowchart of
the process is depicted in the picture 4.17.
4. Results and Discussions
52
Figure 4.17: Re:newcell process
[63]
Re:newcell suggested in an interview to Gunnarsson in 2013, that an integrated
pulp and fiber production plant is a potential option to address the short comings.
The production plant forms a part of a recirculating system for the effective use
of energy, chemicals and water [64].
The concept of renewcell is really fascinating and beneficial. The process is still
in development and is not yet commercial. There are certain amount of chemicals
used in the process. The exact details and composition of chemicals are not yet
disclosed by the project team. Since the process involves regeneration of fibers,
it can be put in the category of upcycling on the hierarchy pyramid. Once, the
cellulose has been regenerated, it can serve a wide range of applications. Hence
the utilization of waste, gets a wider dimension and larger possibilities.
Ioncell-F An interesting technology, Ioncell-F, is being developed in Finland,
where the cellulose is dissolved in an environment friendly ionic liquid and regenerated by wet spinning. The process is built on lyocell technology and uses
1,5-diaza-bicyclo[4.3.0] non-5-enium acetate ([DBNH][OAc]) instead of the conventional NMMO, used in lyocell process. The advantage of this process is that
the temperature during dissolution and spinning can be maintained at lower
level, which improves the properties of final product [65].
4. Results and Discussions
53
Method The ionic solvent [DBNH][OAc] is first liquefied and and mixed
with the cellulose to form a consistent dope. After a complete dissolution the
solution is filtered by hydraulic press to attain uniformity. The solidified spinning dope was then cut into smaller pieces and fed into spinning cylinder. The
filaments were then bundled out of the extruder to be collected as a bundle. These
were later then produced into yarns and knitted into final products. [65]
The lower processing temperature of [DBNH][OAc] leads to less degradation
of dissolved substrate, thus contributing to the energy savings. However in the
Ioncell-F method, water has to be removed continuously and the ionic liquids
are more expensive compared to NMMO, used in lyocell technology. Though,
NMMO in the beginning was expensive too but the price reduced after its development and commercialization, similar is expected in the case of Ioncell-F. One
of the methods to make Ioncell-F economically viable is to use waste cellulose
from textiles. The development is still being investigated but, textile wastes can
be used as base to build on the research. [65]
The process is in development and researched upon in the laboratories. The
larger picture of the research is unknown but the proceedings look promising.
Cellulose Carbamate Cellulose carbamate is an environmentally friendly renewable process of utilizing cellulose. Cellulose derivatives are reportedly soluble in aqueous sodium hydroxide solution to be used as fibers. In the process,
urea was impregnated into cellulose followed by esterification. The major hurdle
in the process is to control the degree of polymerization and evenly distribute the
carbamate groups. [66–68]
There have been lot of research being carried out at VTT, Finland to develop
the technology. Reports suggests that the chemical efficiency has improved by
leaps. The technology has been tested on a small scale and pilot systems. The
void in the whole chain is the producer of carbamate cellulose [69]. One of the
solutions could be utilizing cellulose from the waste textiles, and have small plant
to produce carbamate from it.
This process like the other cellulose recovery processes are in development.
When the process is made commercial the utilization of waste textiles to produce
cellulose could be a landmark project. The cellulose can be be used for many
purposes, some mentioned in prior sections. This could be a feasible option in
concern with the waste hierarchy pyramid.
4.2.4
Energy Recovery
The utilization of waste for the purpose of energy recovery would be categorized
into the lower half of the pyramid. According to the waste hierarchy pyramid, the
4. Results and Discussions
54
materials used for energy recovery will was classified as waste instead of product.
This could be advised as the secondary option for the both the organizations,
TAUKO Designs and Päijät-Hämeen Tekstiilihuolto. In this section we cover two
different types of energy recovery methods namely, biofuels and incineration.
Biofuels A good alternative use of the textile waste cold be to use for the production of biofuels. Biofuels reduces CO2 emission significantly, encouraging the
research in this area prominent in order to make the conversion process more
efficient and effective [70].
Cotton is probably the only one textile which has a cellulose content higher
than 60% [71]. This makes cotton a very good prospect to be used for biofuels.
Jeihanipour et al in their study suggests that cotton/polyester blend when treated
with a solvent N-methylmorpholine-N-oxide (NMMO) yield methane [72].
One of the advantages of NMMO is that cellulose can be separated from blended
fiber textile waste, polyester/cotton in our case.The cellulose solvent NMMO is
ionic and it makes the cellulose less crystalline and more accessible to enzymes.
The pretreatments of jeans (100% cotton) with NMMO doubled the yield compared to the non-treated ones. The pretreatments has not yet been implemented
on a large scale and is in still in the pilot production. [72] [71] [70]
The use of waste as biofuels is environmentally a feasible option. Cellulose
contains elements which can be easily converted to biofuels, by the use of chemical or other times by the application of enzymes. The waste in this research
contains cotton bed sheet which are rich in cellulose content. If we consider the
waste hierarchy pyramid, the utilization of waste as biofuels will be placed in
the recovery section. But unlike incineration this process is more environment
friendly and sustainable.
Incineration Incineration or burning of waste textiles to produce energy is one
of the alternatives. The main advantage of the incineration plant is that no separation of textiles is necessary and collected waste can be directly burned. The
incineration plant is an expensive affair and it would require lot of wastes to be
burned to balance the capital flow. Moreover it is considered to be hazardous to
the people working in the plant. There are some organic gases released in during
the process which can cause devastating effects to the health. There are emissions
to the air and ashes generated during the process. The US Environmental Protection Agency suggests that there is 15-20 percent bottom ash and 10-20 percent
fly ash generated of the total amount of waste. Studies conducted by Ryu et al.
have shown that polyester and cotton textiles can cause irregular burning and can
leave sizable amount of material unburnt. The non uniform behavior of temper-
4. Results and Discussions
55
ature profile can cause problems in incineration process and even cause fires to
the plant in worst cases [73]. However, the textile wastes can be mixed with cardboards or other Municipal Solid Wastes (MSW) to attain uniform temperature for
incineration [2].
The Vantaa incinerator power plant is one of the recent to be set up in Finland.
The plant has two incinerators which burn 400 cubic meters of waste every second. It produces 920 Gigawatt hours of heat and 600 Gigawatt hours of electricity
which is more than the requirement of city of Vantaa. [74]
This should be the last option for the waste produced in this research. The
cellulose content in the cotton bed sheet are high enough to be used as bio fuels. Using the waste as for incinerator will produce some pollution and will not
strengthen the hierarchy pyramid. There are cases when upcycling process and
product sometimes produces waste which cannot be utilized in other form. In
such situations, the waste can be sent to the incinerators.
56
5.
CONCLUSIONS
This thesis was carried out in cooperation of TAUKO Designs, and the following the characterization of waste, we tried to answer some research questions
through the course of the thesis. The materials for the research were obtained
from the Päijät-Hämeen Tekstiilihuolto Oy. The samples were characterized for
their thickness, thread count, mass per unit area, breaking force, and the amount
of cellulose dissolved. The first two tests, thickness and thread count did not
show a significant difference for the initial samples and hence they were discontinued for the later set of samples. The results from the experiments of characterization of the waste textile samples were interesting and encouraging.
The mechanical properties of the waste textiles was found to be more than that
of minimum required to upcycle them into fashionable garments. The breaking
force at the corners of the bed sheet was more than that at the center. This compliments our expected data as the degradation in the center of the bed sheet was
expected to more than that at the corners. Similar pattern was noticed for bed
sheet made from cotton and from cotton and polyester blend. The breaking force
for the twill cotton bed sheet was found to be more after degradation than of plain
structured fabric. This would qualify the twill bed sheet to be fit manufacturing
woven garments more than plain structured cotton. The cotton polyester blanket
cover showed an expected degradation pattern, with loss of mechanical properties more at the corners compared to the center part. The change in mass per unit
area with loss in the amount of cellulose was predicted, as it increased due to the
amount of polyester content in the waste textiles. However, it was noticed that
the samples were degraded due to continuous use and wash in the laundry. The
waste materials do not follow a uniform pattern of degradation.
The waste can be termed as upcycled once its value is more than that of the
original product. It is interesting to note that the parameters to measure this
"value" of a product or material, is not clearly defined. There can be few ways
to measure the value of the waste to certify them as upcycled. The cost of the
product is one such scale to measure the value. A personal interview with PäijätHämeen Tekstiilihuolto, the laundry company, suggested that the hospital bed
sheets usually take 10-15 years to degrade and turn into waste. If the price of
the product is considered to be a comparing factor, the initial cost of original bed
5. Conclusions
57
sheet 15 years ago should be the adjusted to inflation to the current economy prior
to measurement. The cumulative cost of all the products and processes including the raw materials, processing, dying and finishing should all be included.
Life cycle assessment (LCA) is a tool to measure the value of the original and
reprocessed product to categorize them as upcycled, recycled or downcycled. Interestingly, if for example, a shirt is made from different parts collected from 4
separate bed sheets, it is difficult to determine the value of the shirt compared to
the bed sheets. In such cases, LCA is the tool to determine the best possible value.
Incidentally, there is no tool to predict the degradation of the samples throughout its service life. If the degradation of the fibers can be predicted, sorting could
be easier. The similarly degraded fibers can be sorted together and hence the
utilization and application of the waste can be effective. There is an interesting
phenomenon notice through the research. A major part of the waste management
business is out sourced to Estonia. If taxes are leveraged, and cheaper institutions
can be set up in Finland. This will speed up the waste management cycle.
Further Research The dissolution of cellulose is certainly one field which needs
to be explored for further research. The idea to use the waste materials as regenerated fibers is helpful and would not only prevent the depletion of resources
but also strengthen the waste hierarchy pyramid. This research also points out
an effective system to sort the waste. During the interview with some recycling
companies, it was stressed that a better sorting system could widen the market
for second hand clothing.
There is an interesting research being carried out by a team from KTH Royal
Institute of Technology and Stanford University, to produce elastic high-capacity
batteries from wood pulp. The cellulose from the wood pulp is converted to
nanocellulose, by breaking down the fibers and making them one million times
thinner. These wood based aerosol materials are used for three dimensional
structures. In an another project titled, "Aerowood", researchers at University of
Helsinki are developing aerosols from cellulose extracted from wood. A possibility utilizing the cotton or cellulose fibers from the textile waste as a replacement
for wood based cellulose fibers could be researched upon. [75] [76]
References
58
REFERENCES
[1] M. Gharfalkar, R. Court, C. Campbell, Z. Ali, and G. Hillier, “Analysis of
waste hierarchy in the european waste directive 2008/98/ec,” Waste Management, vol. 39, no. 0, pp. 305 – 313, 2015.
[2] D. Palm, M. Elander, D. Watson, N. Kiørboe, H. Salmenperä, H. Dahlbo,
K. Moliis, K.-A. Lyng, C. Valente, S. Gíslason, et al., Towards a Nordic textile
strategy: Collection, sorting, reuse and recycling of textiles. Nordic Council of
Ministers, 2014.
[3] N. Tojo, N. Tojo, B. Kogg, N. Kiørboe, B. Kjær, and K. Aalto, Prevention of
textile waste: material flows of textiles in three Nordic countries and suggestions on
policy instruments. Nordic Council of Ministers, 2012.
[4] J. Zunft and B. Fröhlig, “Energy from waste–zukunftsmärkte europa,” 14.
Fachtagung Thermische Abfallbehandlung, vol. 14, p. 17, 2009.
[5] E. Union, “Eurostat Statistics database.” http://epp.eurostat.ec.europa.
eu/portal/page/portal/energy/data/database. Online; accessed, 201506-30.
[6] WtERT, “Waste-to-Energy Research and Technology Council.”
http://www.wtert.eu/global/images/doki/5-step_waste_hierarchy_
according_to_EU.PNG. Online; accessed, 2015-04-30.
[7] D. C. Wilson, D. Parker, J. Cox, K. Strange, P. Willis, N. Blakey, and L. Raw,
“Business waste prevention: a review of the evidence,” Waste Management &
Research, vol. 30, no. 9 suppl, pp. 17–28, 2012.
[8] J. Cleary, “The incorporation of waste prevention activities into life cycle
assessments of municipal solid waste management systems: methodological issues,” The International Journal of Life Cycle Assessment, vol. 15, no. 6,
pp. 579–589, 2010.
[9] “Recycling of waste nylon 6/spandex blended fabrics by melt processing,”
Composites Part B: Engineering, vol. 77, no. 0, pp. 232 – 237, 2015.
[10] G. F. Lee, P. DEE, and R. A. Jones, “Municipal solid waste management,”
1991.
[11] “A review of technologies and performances of thermal treatment systems
for energy recovery from waste,” Waste Management, vol. 37, no. 0, pp. 26 –
References
59
44, 2015. Special Thematic Issue: Waste-to-Energy Processes and Technologies.
[12] “Heat exchangers for energy recovery in waste and biomass to energy technologies – i. energy recovery from flue gas,” Applied Thermal Engineering,
vol. 64, no. 1–2, pp. 213 – 223, 2014.
[13] T. R. Crompton, Determination of organic compounds in soils, sediments and
sludges. CRC Press, 1999.
[14] E. Epstein, Disposal and Management of Solid Waste: Pathogens and Diseases.
CRC Press, 2014.
[15] C. Baechler, M. DeVuono, and J. M. Pearce, “Distributed recycling of waste
polymer into reprap feedstock,” Rapid Prototyping Journal, vol. 19, no. 2,
pp. 118–125, 2013.
[16] M. Brown and V. Buranakarn, “Emergy indices and ratios for sustainable
material cycles and recycle options,” Resources, Conservation and Recycling,
vol. 38, no. 1, pp. 1–22, 2003.
[17] W. McDonough and M. Braungart, Cradle to cradle: Remaking the way we make
things. MacMillan, 2010.
[18] V. G. Pol, “Upcycling: converting waste plastics into paramagnetic, conducting, solid, pure carbon microspheres,” Environmental science & technology,
vol. 44, no. 12, pp. 4753–4759, 2010.
[19] M. Martin and A. Parsapour, “Upcycling wastes with biogas production::
An exergy and economic analysis,” in Venice 2012: International Symposium
on Energy from Biomass and Waste, 2012.
[20] S. Norway, “Textile Flow in Norway Figures.” https://www.ssb.
no/en/forside;jsessionid=6E12B5A9BA45328F6EF80BA2541E0E07.
kpld-as-prod04?hide-from-left-menu=true&language-code=en&
menu-root-alternative-language=true. Online; accessed, 2015-06-28.
[21] K. Laitala, I. G. Klepp, N. Morley, T. Meistad, A. Chapman, W. Chen, M. Hebrok, and J. D. og Marthe H. Austgulen, Potensiale for økt materialgjenvinning
av tekstilavfall og andre avfallstyper. Statens institutt for forbruksforskning
(SIFO), 2012.
[22] S. Sweden, “Textile Flow in Sweden Facts and Figures.” http://www.scb.
se/en_/. Online; accessed, 2015-06-28.
References
60
[23] B. of International Recyling, “Bureau of International Recyling Textile flow
Germany.” http://www.bir.org/industry/textiles/?locale=en_US. Online; accessed, 2015-06-28.
[24] D. IPA, “Danish Environmental Protection Agency.” http://eng.mst.dk/.
Online; accessed, 2015-06-28.
[25] E. Wirtschaftsdienst, “Europäischer Wirtschaftsdienst Germany Data and
Figures.” http://www.euwid.de/en/home.html. Online; accessed, 2015-0628.
[26] LetsRecycle, “Distribution of Textile prices in UK.” http://www.
letsrecycle.com/prices/textiles/textile-prices-2013/, 2013. Online;
accessed, 2015-06-28.
[27] S. Ulla, “Päijät-Hämeen Tekstiilihuolto company working and function.”
Personal communication, meeting and email. 2015-02-23.
[28] TAUKO, “Tauko Designs store information.” http://taukodesign.fi/,
2015. Online; accessed, 2015-04-30.
[29] Mila, Moisio, “TAUKO Designs: Company working and function.” Personal
communication, meeting and email. 2014-2015.
[30] Ecolab, “Ecolab Chemicals Information.” http://www.ecolab.com/pages/
sds, 2015. Online; accessed, 2015-06-01.
[31] G. Akovali, “4.7 polyester fibre and fabric,” in Advances in Polymer Coated
Textiles, Smithers Rapra Technology, 2012.
[32] C. D. D. White, James L., “8. melt spinning,” in Polyolefins - Processing, Structure Development, and Properties, Hanser Publishers, 2005.
[33] I. Shigemoto, T. Kawakami, H. Taiko, and M. Okumura, “A quantum chemical study on the thermal degradation reaction of polyesters,” Polymer Degradation and Stability, vol. 97, no. 6, pp. 941 – 947, 2012.
[34] R. M. Kozlowski, “2. cotton fibres,” in Handbook of Natural Fibres, Volume 1
- Types, Properties and Factors Affecting Breeding and Cultivation, Woodhead
Publishing, 2012.
[35] P. J. Wakelyn, N. R. Bertoniere, A. D. French, D. P. Thibodeaux, B. A. Triplett,
M.-A. Rousselle, W. R. Goynes Jr, J. V. Edwards, L. Hunter, D. D. McAlister,
et al., Cotton fiber chemistry and technology. CRC Press, 2006.
References
61
[36] C. Birtwell, D. A. Clibbens, and B. P. Ridge, “The chemical analysis of cotton—oxycellulose, part i,” Journal of the Textile Institute Transactions, vol. 16,
no. 1, pp. T13–T52, 1925.
[37] L. Youhanan, “Environmental assessment of textile material recovery techniques : Examining textile flows in sweden,” Master’s thesis, KTH, Industrial Ecology, 2013.
[38] SFS 2945, “Sairaalatekstiilit. lakana polyesteri-puuvillainen.” Finnish Standard Association, Helsinki, 1983.
[39] SFS 1833-11, “Quantitative chemical analysis. part 1: General principles of
testing.” Finnish Standard Association, Helsinki, 2010.
[40] SFS 13934-1, “Tensile properties of fabrics. part 1: Determination of maximum force and elongation at maximum force using the strip method.”
Finnish Standard Association, Helsinki, 1999.
[41] SFS 12127, “Determination of mass per unit area using small samples.”
Finnish Standard Association, Helsinki, 1998.
[42] SFS 5084, “Determination of thickness of textiles and textile products.”
Finnish Standard Association, Helsinki, 1996.
[43] SFS 1049-2, “Methods of analysis. part 2: Determination of number of
threads per unit length.” Finnish Standard Association, Helsinki, 1994.
[44] SFS 2947, “Hospital textiles. blanket cover, polyester-cotton.” Finnish Standard Association, Helsinki, 1983.
[45] SFS 2943, “Hospital textiles. polyester-cellulose blended fabrics. general requirements and inspection.” Finnish Standard Association, Helsinki, 1992.
[46] SFS 2962, “Hospital textiles. sheet, cotton.” Finnish Standard Association,
Helsinki, 1992.
[47] SFS 2961, “Hospital textiles. cotton fabrics. general requirements and inspection.” Finnish Standard Association, Helsinki, 1992.
[48] A. SANKAUSKAITĖ, L. STYGIENĖ, M. D. TUMĖNIENĖ, S. Krauledas,
L. JOVAIŠIENĖ, and R. PUODŽIŪNIENĖ, “Investigation of cotton component destruction in cotton/polyester blended textile waste materials,” Materials Science, vol. 20, no. 2, pp. 189–192, 2014.
References
62
[49] A. Vasconcelos and A. Cavaco-Paulo, “Enzymatic removal of cellulose from
cotton/polyester fabric blends,” Cellulose, vol. 13, no. 5, pp. 611–618, 2006.
[50] SFS 3672, “Woven shirt and blouse fabric. requirements.” Finnish Standard
Association, Helsinki, 1976.
[51] SFS 3673, “Shirt and blouse fabrics. requirements.” Finnish Standard Association, Helsinki, 1976.
[52] SFS 3674, “Light woven dress fabrics. requirements.” Finnish Standard Association, Helsinki, 1976.
[53] SFS 3677, “Woven dress and skirt fabrics. requirements.” Finnish Standard
Association, Helsinki, 1977.
[54] SFS 4321, “Woven fabrics for trousers. requirements.” Finnish Standard Association, Helsinki, 1979.
[55] SFS 4323, “Woven fabrics for suits. requirements.” Finnish Standard Association, Helsinki, 1979.
[56] SFS 4324, “Woven fabrics for light suits. requirements.” Finnish Standard
Association, Helsinki, 1979.
[57] S. Poistotekstiilit, “Suomen Poistotekstiilit Ry Company Description.” http:
//www.poistotekstiilit.fi/DowebEasyCMS/?Page=Yhdistys. Online, Accessed: 2015-04-23.
[58] Tiina, Kosonen, “Lovia Collection: Company working and function.” Personal communication, email. 2015-04-24.
[59] L. Shen, E. Worrell, and M. K. Patel, “Environmental impact assessment of
man-made cellulose fibres,” Resources, Conservation and Recycling, vol. 55,
no. 2, pp. 260–274, 2010.
[60] A. Nicolajsen, “Thermal transmittance of a cellulose loose-fill insulation material,” Building and Environment, vol. 40, no. 7, pp. 907–914, 2005.
[61] J.-O. Yeon, K.-W. Kim, K.-S. Yang, J.-M. Kim, and M.-J. Kim, “Physical properties of cellulose sound absorbers produced using recycled paper,” Construction and Building Materials, vol. 70, pp. 494–500, 2014.
[62] Termex, “Termex Company Information, Working and Function.” http://
www.termex.fi/en/ecological. Accessed: 2015-04-26.
References
63
[63] C. Woodings, “3. the viscose process,” in Regenerated Cellulose Fibres, Woodhead Publishing, 2001.
[64] L. Shen, E. Worrell, and M. K. Patel, “Open-loop recycling: A lca case study
of pet bottle-to-fibre recycling,” Resources, conservation and recycling, vol. 55,
no. 1, pp. 34–52, 2010.
[65] H. Sixta, A. Michud, L. Hauru, S. Asaadi, Y. Ma, A. King, I. Kilpeläinen, and
M. Hummel, “Ioncell-f: A high-strength regenerated cellulose fibre,” Nordic
Pulp and Paper Research Journal, vol. 30, no. 1, pp. 43–57, 2015.
[66] C. Yin and X. Shen, “Synthesis of cellulose carbamate by supercritical co2assisted impregnation: Structure and rheological properties,” European Polymer Journal, vol. 43, no. 5, pp. 2111 – 2116, 2007.
[67] H. J. J. M. K. T. Eichhorn, S.J., “1.4.2 cellulose carbamate (cc) process,” in
Handbook of Textile Fibre Structure, Volume 2 - Natural, Regenerated, Inorganic
and Specialist Fibres, Woodhead Publishing, 2009.
[68] K. Ekman, V. Eklund, J. Fors, J. Huttunen, L. Mandell, J. Selin, and O. Turunen, “Regenerated cellulose fibers from cellulose carbamate solutions,”
Lenzinger Berichte, vol. 57, pp. 38–40, 1984.
[69] A. Harlin and K. Valta, “The carbamate technology of VTT.” http://
www.vttresearch.com/services/bioeconomy/high-performance-fibres/
sourcing-renewable-fibres/wood-based-textile-fibres-2. Accessed:
2015-04-27.
[70] H. Tadesse and R. Luque, “Advances on biomass pretreatment using ionic
liquids: an overview,” Energy & Environmental Science, vol. 4, no. 10,
pp. 3913–3929, 2011.
[71] V. Menon and M. Rao, “Trends in bioconversion of lignocellulose: biofuels,
platform chemicals & biorefinery concept,” Progress in Energy and Combustion
Science, vol. 38, no. 4, pp. 522–550, 2012.
[72] A. Jeihanipour, S. Aslanzadeh, K. Rajendran, G. Balasubramanian, and M. J.
Taherzadeh, “High-rate biogas production from waste textiles using a twostage process,” Renewable Energy, vol. 52, pp. 128–135, 2013.
[73] C. Ryu, A. N. Phan, V. N. Sharifi, and J. Swithenbank, “Combustion of textile
residues in a packed bed,” Experimental thermal and fluid science, vol. 31, no. 8,
pp. 887–895, 2007.
REFERENCES
64
[74] M. Salomaa, “Vantaan uudessa jätevoimalassa jäte palaa jo tauotta helsingin
sanomat.” http://www.hs.fi/kaupunki/a1410843883575, 2014. Accessed:
2015-04-26.
[75] L. Peter and C. David, “Trees are source for high-capacity,
soft
batteries.”
https://www.kth.se/en/aktuellt/nyheter/
de-har-uppfunnit-mjuk-elektronik-1.569410. Online; accessed, 2015-0605.
[76] T. Maija,
“Wood-based aerogels (aerowood).” https://tuhat.
halvi.helsinki.fi/portal/en/projects/woodbased-aerogels-%
283628241e-62d0-49b5-ad2b-c24f8686b098%29.html. Online; accessed,
2015-06-05.
Appendix
65
APPENDIX A. THICKNESS
Table 1: Blanket Cover (PES/CO) Thickness
Corner
Center
Original Recycled Original Recycled
0.4
0.4
0.4
0.4
0.35
0.35
0.4
0.4
0.35
0.4
0.4
0.4
Figure 1: Blanket Cover PES/CO Thickness
Table 2: Bed sheet (PES/CO) Thickness
Corner
Center
Original Recycled Original Recycled
0.35
0.3
0.35
0.3
0.3
0.3
0.3
0.3
0.35
0.3
0.3
0.3
Appendix
66
Figure 2: Bed sheet PES/CO Thickness
Appendix
67
APPENDIX B. THREAD COUNT
Table 3: Blanket Cover PES/CO Thread Count Corner
Original
Recycled
Warp Weft Warp Weft
90
79
93
79
89
78
90
73
91
79
86
73
90
78
91
74
90
78
87
76
Table 4: Blanket Cover PES/CO Thread Count Center
Original
Recycled
Warp Weft Warp Weft
90
80
88
79
91
80
89
78
90
81
88
79
91
80
88
78
90
83
89
78
Figure 3: Blanket Cover PES/CO Thread Count


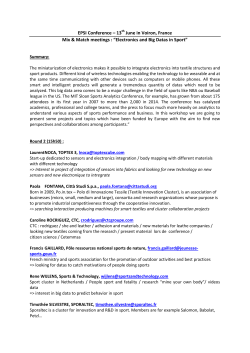

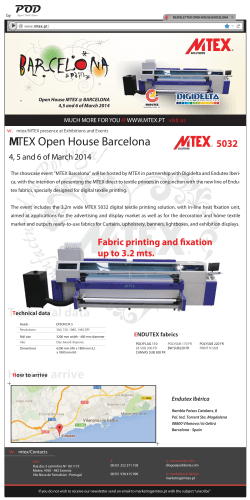


© Copyright 2026