
African Economic Outlook 2007 Drinking Water and Sanitation: can Africa fill the gap?
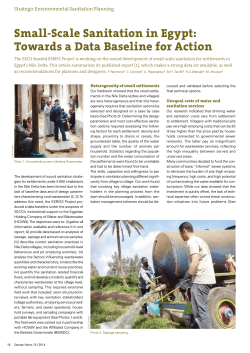
African Economic
Outlook 2007
Drinking Water and Sanitation:
can Africa fill the gap?
Lucia Wegner
OECD Development Centre
28 June 2007 Second OECD Forum on Statistics
Knowledge and Policy
Istanbul
African Economic Outlook
Measuring the Pulse of Africa
• Joint publication of the AfDB and the OECD
Development Centre, supported by the EC – 6th
edition.
• Mobilising a network of in-country African experts
& collaboration with WB, IMF, bilateral donors, …
• A resource for policy makers, aid practitioners,
investors, researchers, students, …
• A tool for policy dialogue among African policy
makers (nationally, APRM, …) and with their
partners (EC, G8, OECD)
2
African Economic Outlook
An innovative product, an evolving process
•
Comprehensive, comparative and independent analysis
of 31 countries and short-term macroeconomic
forecasts.
•
Annual focus
• 2003: Privatization
• 2004: Access to energy
• 2005: SME development
• 2006: Transport infrastructure
• 2007: Access to drinking water and sanitation
•
Statistical annex, including innovative indicators
3
AEO Special Topic 2007
Access to water and sanitation
• Water is on the top of the agenda of the
international community
• Africa is in a particularly difficult situation
• A delicate and highly technical topic
• AEO 2007 offers an assessment of major
trends, challenges and also encouraging
country experiences
4
Access to water and sanitation:
the facts
• 10 million people / year have gained access to
improved drinking water over 1990-2004 in sub-Saharan
Africa
• With population growth, the number of unserved has
increased by about 60 million and SSA is unlikely to
reach the MDGs by 2015.
• The situation is worse for sanitation: 35 million more
people annually need access to improved sanitation
(current trend: 7 million)
• If the MDGs were reached by 2015, 234 million people
would still lack access to safe drinking water and 317
million to improved sanitation
5
Access: some outstanding experiences
•
Universal access to water in Mauritius and South Africa.
•
North Africa
– 91% have access to drinking water (highest level in developing
world with Latin America).
– Sanitation coverage up by 12% between 1990 and 2004 (at 75%), on
track to reach the 83% target by 2015.
•
Uganda: coverage for drinking water tripled between 1990 and 2006
(from 21% to 61%).
•
Tanzania: 90% of population have access to some form of sanitation.
BUT:
Quality of data and information regarding access remain
problematic: data collection and treatment is poor
6
A resource issue? Partly …
Renewable water per capita (m3/inhab/yr)
North Africa
East Africa
Southern Africa
West Africa
Central Africa
Africa
0
10000 20000 30000 40000 50000 60000
Source: FAO, Aquastat.
7
..but mainly a management issue
• Weak extraction capacities - except in North and
South Africa.
• Inefficient use: agricultural (68%), domestic
(24%), industrial (8%).
• Industrial pollution, poor sanitation and sewage
practices. In Congo, only 68% of water samples
comply with quality standard.
• Wastage: unaccounted for water reaches 50% in
most cities: Botswana 46%, Mauritius 47%, Egypt
50% (good practice: 15-20%).
8
Introducing water demand management
the municipality of Windhoek
Programme components:
• Increasing public awareness
• Implementation of block tariff system
• Quality Monitoring programs to ensure appropriate
standards
• Improved maintenance and technical measures to reduce
leaks
• Re-use of water: one of the first cities to introduce recycling
of effluent for drinking purposes
In 2006: unaccounted-for water fell to 10.3%
9
(good practice: 15-20%)
The challenges
• Implement integrated water resource
management (IWRM) -Monitoring mechanisms
are crucial
• Strengthen local management
• Move sanitation and wastewater treatment to
the top of the development agenda
10
Status of National IWRM
Level 1
Level 2
Level 3
North Africa
Egypt
Morocco
Tunisia
Mauritania
Sudan
Algeria
Libya
Central Africa
Cameroon
Burundi
Central African Rep.
Chad
Congo
DRC
Rwanda
Eastern Africa
Uganda
Eritrea
Ethiopia
Kenya
Mauritius
Tanzania
Western Africa
Burkina
Benin
Ghana
Mali
Nigeria
Senegal
Southern Africa Namibia
South Africa
Zimbabwe
Botswana
Malawi
Mozambique
Swaziland
Zambia
Source: Global Water Partnership, 2006
11
Key management issues
• Strong national water policies and legislation.
• Sound and autonomous regulation: monitor
progress, set guidelines, design incentives to
extend service provision and protect consumers
(NWASCO in Zambia).
• Capacity on the ground (partnership between
TCTA and Umgeni Water in South Africa).
• Harmonisation of different stakeholders’
interventions (SWAP in Uganda).
• Participation of all stakeholders: improve
efficiency, maintenance, avoid conflict (Ghana
community approach).
• Regional cooperation
12
Reducing the sanitation gap
• Access can only be increased if water and sanitation are
tackled simultaneously.
• Investments are small compared to the health and
environmental costs of inaction and returns to action
• Overcome the segmentation of the sector: between
administrations, among providers (e.g. Durban).
• Develop technologies adapted to communities’ needs.
• Invest in prevention campaigns (e.g. community health
clubs in Zimbabwe).
13
Financing – a key issue for all
stakeholders
• Investment needs: $20b/yr until 2025, 1/3 for
sanitation, ¼ for drinking water supply (Africa
Water Vision 2025).
• Public money (national budgets and ODA)
remains insufficient
• National water providers have failed to
achieve financial viability.
• Least attractive sector to private investors –
but active in some countries.
14
Strengthening utilities
• Financial independence
– cost-recovery: affordability and cross-subsidisation
– sustainable & predictable public funding
• Capacity building through benchmarking and
partnerships (ex: UNSGAB Water Operators Partnership).
• Small-scale local providers
– Flexible, better knowledge of remote areas
– But they need better regulation and more conducive
institutional framework (Uganda Association of Private
Water Operators)
15
What role for aid?
Total water ODA to Africa, $ billion, 2004 prices
1.2
0.9
0.6
Bilateral ODA
0.3
Multilateral ODA
1990 1991 1992 1993 1994 1995 1996 1997 1998 1999 2000 2001 2002 2003 2004 2005
Source: OECD/DAC
16
What role for the donor
community?
• Using ODA to leverage further financing (Zambian
Devolution Trust Fund).
• Using subsidies targeted on performance, such as
Output-Based Aid (GPOBA in Mozambique).
• Develop innovative financial tools: sub-sovereign
financing facility in local currency, risk mitigation
through resource pooling, guarantees (Jo’burg 2004
municipal bonds: 1rst non-sov guaranteed loan in SSA).
• The role of the African development Bank: African
Water Facility and the Rural Water and Sanitation
Initiative.
17
Thank you!
Tesekkur Ederim!
For more information:
www.oecd.org/dev/aeo
19
© Copyright 2026