
Avena introductions but still maintain substantial population structure barbata
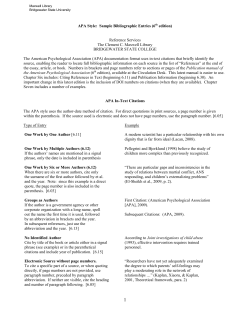
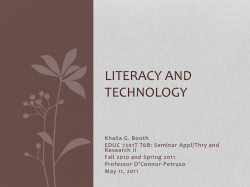
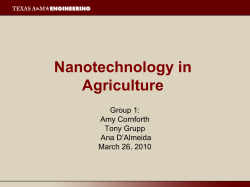
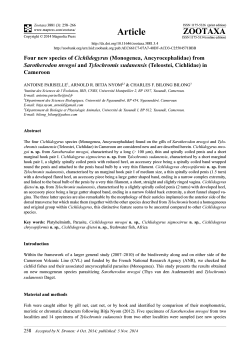
Evolving California genotypes of Avena
barbata are derived from multiple
introductions but still maintain
substantial population structure
Kate Crosby, Taylor O. Stokes and Robert G. Latta
Department of Biology, Dalhousie University, Halifax, NS, Canada
ABSTRACT
Submitted 29 July 2014
Accepted 1 October 2014
Published 4 November 2014
Corresponding author
Kate Crosby, [email protected]
Academic editor
Jana Vamosi
Multiple introductions are thought to enhance the chance of successful
colonization, in part because recombination may generate adaptive variation to
a new environment. Avena barbata (slender wild oat) is a successful colonist in
California, historically noted for striking genetic divergence into two multilocus
genotypes, but is still undergoing adaptive change. We sought to understand whether
multiple introductions might be contributing to this change. We used cpDNA
phylogeography of A. barbata within its home range and in its invaded range in
California to determine the minimum number of separate introductions, and the
spatial distribution of these introduced lineages. We collected from sites throughout
the state of California, where it is an invasive species. Accessions from a representative
portion of A. barbata’s full native range were obtained from germplasm repositories. We sequenced seven intergenic chloroplast DNA loci for A. barbata individuals
both in California (novel geographic range) and its ancestral range. 204 individuals
were assayed for chloroplast haplotype within California using single strand conformational polymorphism SSCPs. Genome size was determined by flow cytometry.
Californian accessions are tetraploid as expected, but their genome sizes were smaller
than the Old World accessions. There were three haplotypes present in California
that were identical to haplotypes in the native range. Within California, the presence
of multiple haplotypes at a site was observed primarily in Northern and Central
populations. Between populations there was still substantial structure with
FST ∼ 0.33, due to a shallow latitudinal cline caused by a preponderance of xeric
haplotypes in Southern California. There was a minimum of three seed introductions
to California. Recombination is thus likely to occur, and contribute to adaptation in
new range in this highly-selfing, invader.
Additional Information and
Declarations can be found on
page 13
Subjects Biogeography, Ecology, Evolutionary Studies, Genetics, Plant Science
Keywords Avena barbata, Native range, Multiple introductions, Chloroplast DNA, Latitudinal
DOI 10.7717/peerj.633
cline, Phylogeography, Invasive species, Genome size
Copyright
2014 Crosby et al.
Distributed under
Creative Commons CC-BY 4.0
OPEN ACCESS
INTRODUCTION
Introduced and invasive species are likely to have to adapt to novel conditions (Dlugosch &
Parker, 2008; Prentis et al., 2008), and the first requirement of adaptation is access to a pool
of genetic variation. The pool of genetic variation can be increased through introductions
How to cite this article Crosby et al. (2014), Evolving California genotypes of Avena barbata are derived from multiple introductions but
still maintain substantial population structure. PeerJ 2:e633; DOI 10.7717/peerj.633
from multiple sources. Typically, adaptive genetic variation is much reduced in the new
range compared to the home range, as many invasive species reproduce primarily via
selfing or are facultatively asexual during colonization of the new range (Baker, 1955; Baker,
1967; Price & Jain, 1981; Barrett & Colautti, 2008). During invasions, the main advantage
of selfing is that individuals need not depend on pollinators or other conspecifics to
pollinate with for persistence or spread. Indeed, in selfing or clonal species, one or a few
introductions could be enough to allow for successful establishment and persistence—even
on a global scale (Le Roux et al., 2007). By contrast, outcrossing species generate new
multilocus genotypes with each round of outcrossing, provided that enough individuals
of different genotypes have been introduced that mates are available and to avoid
inbreeding depression.
Self-fertilizing species typically suffer less from the effects of inbreeding depression
than outcrossers (Husband & Schemske, 1996), but they may still require adaptive
genetic variation in order to respond to novel environmental conditions. It has been
suggested that multiple introductions of different genetic variants allow selfing species the
opportunity for occasional outcrossing and recombination in new environments (Ellstrand
& Schierenbeck, 2000; Schierenbeck & Ellstrand, 2009). Assessing the minimum number
of introductions in a new environment is thus critical to evaluating how important the
amount of genetic variation may be for self-fertilizing species in the new range, which will
ultimately determine how much effective recombination is possible in the new range.
Californian populations of the highly-selfing (Marshall & Allard, 1970), tetraploid
(Hutchinson et al., 1983), invasive annual grass, Avena barbata Pott ex Link are thought
to have been introduced from the Iberian Peninsula roughly two centuries ago during
Spanish colonization (Jain & Marshall, 1967; Garcia et al., 1989). Avena barbata became
widely known for a number of pioneering observations in the 1970s (Clegg & Allard, 1972;
Allard et al., 1972; Hamrick & Holden, 1979) which found that there were predominantly
two multilocus genotypes of A. barbata in California. Each genotype was monomorphic
for a set of five allozyme loci, and few recombinants were found. One genotype was found
in moist environments, while the other occurred in more arid environments, a pattern
repeated at both large (Clegg & Allard, 1972; Allard et al., 1972) and small geographic scale
(Hamrick & Holden, 1979), leading to the interpretation that these represented locally
adapted ‘mesic’ and ‘xeric’ ecotypes. The allozyme combinations characteristic of the
original Californian genotypes were not found in native Iberian populations (Garcia et
al., 1989). This suggests that recombination among separate genotypes was part of the
evolutionary history of A. barbata in California.
Past experimental work in which a novel environment was imposed in the greenhouse
demonstrated that recombination between the two genotypes produced a few hybrid recombinants that were more fit than the parents (Johansen-Morris & Latta, 2006; JohansenMorris & Latta, 2008). Additionally, a previous four-year field common garden, reciprocal
transplant experiment of parental genotypes to wet and dry environments found that
the mesic genotype, and a few recombinants are consistently more fit than the xeric
(Latta, 2009). Thus, the mesic could be displacing the xeric genotype, or a recombinant
Crosby et al. (2014), PeerJ, DOI 10.7717/peerj.633
2/17
could be displacing both as the prominent genotype throughout California. Collectively,
this evidence does not support the idea that the two genotypes are locally adapted to moist
and arid environments as Allard’s work suggested (though we retain the names ‘mesic’
and ‘xeric’ here), but rather that adaptive change is still occurring in California. This
continuing evolution could be due to recombination between several different genetic
variants as demonstrated by Johansen-Morris & Latta (2006), Johansen-Morris & Latta
(2008) and/or the superior fitness of one lineage (likely the mesic) (Latta, 2009).
The first step in assessing the role of intermixing and recombination is to determine
the minimum number of introductions to California and their spatial distribution. We
constructed a cpDNA phylogeny of accessions from across A. barbata’s native range as well
as its invaded range in California to determine the minimum number of introductions to
California. In most plants, organelle genomes of both the chloroplast and mitochondrion
are maternally inherited (Corriveau & Coleman, 1988; Zhang, Liu & Sodmergen, 2003),
and provide a useful trace of seed introduction during colonization. We hypothesize that
the mesic and xeric genotypes are the result of at least two separate seed (maternal) introductions to California from the native range. We sought to characterize the geographic
distribution and the degree of spatial overlap of these introductions within California. As
A. barbata is highly selfing, pollen movement is limited and recombination is restricted
until a new genotype arrives in the population via seed (maternal) gene flow. Limited seed
migration would tend to restrict levels of spatial intermixing, and we expected that for a
selfing species most genetic diversity would occur amongst rather than within populations
(Hamrick & Godt, 1996). We assayed a wider panel of individuals across California sampled
from both within and amongst populations to assess the validity of this expectation.
Future studies using nuclear loci will examine the degree of recombination among
genotypes in California. In order to rule out novel polyploid formation in an invader
(often a result of hybridization (Novak, Soltis & Soltis, 1991; Daehler & Strong, 1997)), we
estimated the ploidy of a subset of accessions from both ranges using flow cytometry. As
a cpDNA phylogeny of most of the species in the genus Avena is available (based on the
trnL-F/trnF-R intergenic region—Peng et al., 2010), we placed a root to our own cpDNA
tree with a direct comparison of chloroplast sequence data and ploidy estimates.
METHODS
Source of material
Old World accessions of A. barbata were donated by Agriculture Canada’s Plant Genome
Resources of Canada (PGRC) germplasm station in Saskatoon, Saskatchewan, Canada,
and the USDA National Small Grains Collection (NSGC) in Aberdeen, Idaho, USA.
We attempted to obtain accessions from across A. barbata’s range in the Old World,
but with particular emphasis on the Iberian Peninsula (Spain and Portugal) as this is
thought to be the origin of Californian A. barbata (Jain & Marshall, 1967; Garcia et al.,
1989; Minnich, 2008). Official repository accession names, our own sample code names,
GenBank accession numbers along with sampling locations and other information are
given in Supplemental Information 1A.
Crosby et al. (2014), PeerJ, DOI 10.7717/peerj.633
3/17
In May 2010, we carried out an extensive geographic survey of A. barbata sites in
California, USA. We collected seeds from 95 sites matching locations described in three
dissertations (Clegg, 1972; Miller, 1977; Hutchinson, 1982) that studied allozyme variation
in the 1970s. These sites represent the full range of growing conditions for A. barbata,
and will be used for future studies comparing present day to past genotypic composition.
We walked ∼3–5 m between each individual at a collection site to avoid sampling close
relatives. In addition, we included in the analysis the mesic and xeric accessions used by
Gardner & Latta (2006) to create a genetic mapping population of A. barbata—these seeds
were kindly provided by P. Garcia from collections made in California during the 1980s,
and had previously been genotyped using the original set of five allozyme loci (Latta et
al., 2004). Seeds were germinated following our lab’s standard protocol (Latta et al., 2004),
and then planted in the greenhouse at Dalhousie University. Californian populations were
grown in June 2010 and June 2011, while seeds from germplasm repositories were grown in
June 2011 and June 2012.
Ploidy assessment
Forty-eight accessions from the Old World, and 24 Californian individuals were assayed
for ploidy via flow cytometry. Flow cytometry was performed with a BD FACSCalibur
flow cytometer at the University of Guelph, Ontario, Canada with CellQuest Pro software
(BD Biosciences, San Jos´e, USA). All assays came from fresh leaf tissue harvested from
young plants (10–20 cms in height) from the greenhouse at Dalhousie University and
were shipped to Guelph in moist paper towels. Sample preparation was modified slightly
from a previous protocol (Doleˇzel, Greilhuber & Suda, 2007). The DNA content standard
used was Vicia faba (26.90 pg/2C) (Doleˇzel, C´ıhal´ıkov´a & Lucretti, 1992). Approximately
0.5 cm2 of V. faba and 1.2 cm2 of A. barbata were chopped with a razor blade, and was
placed in cold extraction buffer for staining (100 µg/ml propidium iodide and 50 µg/ml
RNAse—in this study LB01 buffer was used (Doleˇzel, Greilhuber & Suda, 2007)). The FL-2
peak analysis program was used to infer ploidy from 2C DNA content measurements of
each individual against the DNA content standard. To examine whether there was any
difference in DNA content (pg/2C) between California and the Old World, we performed
a one-way two-sample randomization test based on 1000 Monte-Carlo re-samplings of the
approximate distribution using the R-package ‘coin’ (Zeileis et al., 2008).
Chloroplast DNA variation
To create the phylogeny, we obtained cpDNA sequences from 49 Old World and 32
Californian accessions, which included two Mesic and two Xeric standards (the parents
of the mapping population described in Latta et al. (2004)). We chose California sites
that formed North-South and East-West transects by choosing at least one accession from
sites previously sampled by Clegg (1972) and Hutchinson (1982). DNA extraction was
carried out from leaf tissue following a slightly modified protocol of plant DNA extraction
(Dellaporta, Wood & Hicks, 1983); we also employed an expedient protocol optimized for
seeds (Ivanova, Fazekas & Hebert, 2008) for 10 samples.
Crosby et al. (2014), PeerJ, DOI 10.7717/peerj.633
4/17
Table 1 Summary of intergenic cpDNA loci used. Intergenic locus region target, the primer pair (as given in reference), the number of variable
characters for each locus, and the length of the fragment uploaded to GenBank. Sequencing primers are underlined. The eighth and last intergenic
locus (trnL (UAA) 3′ exon) is italicized because we only screened unique haplotypes among accessions from our dataset to ascertain the root of our
tree see Supplemental Information 1C.
Intergenic regions
targeted
Primer pair
Number of variable
characters
Length of fragment in
A. barbata (bp)
Reference
trnQ (UUG)–psbK
atpB–rbcLa
psaI - ycf4a
psaJ–rpl33
rpl33–rps18
trnT (UGU)
trnL (UAA) 5′ exon
trnL (UAA) 3′ exon
ANU11-L/ANU-12R
ANU67-L/ANU68-R,
ANU73-L/ANU74-R
ANU83-L/ANU84-R
ANU85-L/ANU86-R
trnT-F/trnL-R
trnT-F/trnL-R
trnL-F/trnF-R
5
7
3
1
4
4
4
3
408
901
356
221
595
510
259
730
Ebert & Peakall (2009)
Ebert & Peakall (2009)
Ebert & Peakall (2009)
Ebert & Peakall (2009)
Ebert & Peakall (2009)
Taberlet et al. (1991)
Taberlet et al. (1991)
Taberlet et al. (1991)
Notes.
a
These loci were used in SSCP analysis.
We used seven previously described primer pairs (Ebert & Peakall, 2009; Taberlet et al.,
1991) for the large single copy (LSC) region of the chloroplast (Table 1). All PCR products
were visualized on a 1.5% agarose TAE gel run at 60 mA, 100 V for approximately 1.5 h.
Sanger cycle-sequencing reactions for PCR products with single, clear bands were carried
out by MacrogenUSA Inc. For each primer pair, we used only the forward primer for
sequencing, with the exception of the trnT-F/trnL-R fragment, which was bi-directionally
sequenced. To infer a root for our final phylogeny we screened one individual from each
cpDNA haplotype using trnL-F/trnF-R (Taberlet et al., 1991), and compared this to Peng et
al.’s (2010) phylogeny of the genus Avena.
To assess the distribution of haplotypes in the introduced range, we expanded our
screening to more accessions within California, using single strand conformational
polymorphism (SSCP). SSCPs are an efficient, and cost-effective method for screening
many samples that isolate single nucleotide polymorphisms (SNPs) (Gasser et al., 2007).
SSCPs were used for two chloroplast intergenic regions that displayed variation within
California. Two Californian haplotypes were separated by an SNP at the intergenic region
spanning atpB and rbcL. A third Californian haplotype differed from the first two at several
loci of which we screened an indel for the intergenic region between psaI and ycf4. We
performed double restriction digest of locus atpB-rbcL amplicons, with HpaII and RsaI,
and of locus psaI-ycf4 with SspI and AluI. These enzymes were chosen from the chloroplast
sequence data to isolate the SNP and indel into smaller fragments conducive to SSCP
assays. The fragments from double digests were denatured for 10 min at 95 ◦ C, snap
frozen, and run on non-denaturing polyacrylamide gels for 17.5 h at 502 V, 14 mA, and
a constant wattage of 8 W. We attempted to screen 5–10 accessions from sites that had
at least one individual sequenced for chloroplast loci, and one accession at each of the
remaining 71 sites. This two-level sampling scheme allowed us to evaluate the potential of
admixture within sites, and also broad population structure between sites in California.
In total, 204 samples were screened for SSCPs. All of the Californian accessions for which
Crosby et al. (2014), PeerJ, DOI 10.7717/peerj.633
5/17
we had already obtained chloroplast sequence data were also assayed with SSCPs, and we
confirmed the accuracy of SSCP to relevant loci (Tables S1 and S2).
Analysis
Trace files for each chloroplast locus were imported to Geneious v. 5.4.4, and aligned with
each other using the MUSCLE algorithm within Geneious default settings, and confirmed
by eye. Traces with QV scores <20 were discarded and not used in further analyses.
Every character change (SNP or single indel) for each chloroplast locus was treated as an
independent binary character. The only exception was the trnL-F (UAA) locus, which had
several indels of multiple adjacent basepairs; these were treated as one multistate character.
All polymorphic sites were then used to construct a maximum-likelihood phylogenetic tree
using PhyML 3.0 (Guindon et al., 2010), iterated for 10,000 bootstraps. In order to doubly
verify cpDNA tree topology, we also constructed a Bayesian phylogenetic tree using Mr.
Bayes v. 3.2. Chloroplast trace files were blasted and annotated using the web server tool
CpGAVAS (Liu et al., 2012) and uploaded to NCBI using the web server tool—BankIt.
For the Californian accessions assayed with SSCPs, we modeled the relative frequency of
chloroplast haplotype at a site with respect to latitude using a generalized linear binomial
model using the R package ‘lme4’ (Bates, Maechler & Dai, 2008). For this approach, any
samples in the same population were treated as non-independent observations. Within
California we estimated the overall FST for individuals at geographic sites assayed with
SSCPs (n = 204).
RESULTS
Ploidy estimations
Flow cytometry gave 2C DNA content clustered at values of 8, 16 and 24 pg (Table 2)
implying variation in ploidy. A. barbata is tetraploid and 16 pg was the most common 2C
content, so accessions that had approximately 8 pg and 24 pg were inferred to be diploids
and hexaploids, respectively. These genome size estimates are well within previously
reported estimates of other Avena species (Bennett & Leitch, 2005). All Californian
accessions were tetraploid. However, we observed six diploid and two hexaploid accessions
among the 48 Old World accessions. The ranges of the genome size (pg/2C) of Californian
and tetraploid Old World accessions overlapped (Table 2), but Californian accessions have
approximately 1.5% smaller genomes on average than tetraploids from the Old World
(permutation test Z = 3.9626, p = 0.00001) (Fig. 1). Inferred ploidy is mapped onto our
phylogeny (Fig. 2).
Phylogeography in the Old World
From seven chloroplast loci, we obtained 3250 bp of chloroplast sequence from which
we found a total of 18 different cpDNA haplotypes across A. barbata’s range (Figs. 2A
and 2B). Overall, there was very little cpDNA variation, and total chloroplast sequence
divergence was 0.86% for all accessions in our phylogeny. Of the roughly six major
clades in our phylogeny four were well supported (bootstrap support proportion of 75
or greater). However, the different haplotypes within each of these major clades were not
Crosby et al. (2014), PeerJ, DOI 10.7717/peerj.633
6/17
Figure 1 Genome sizes of tetraploid Avena species in the Old World and California. Probability density
plot (grey-shaded region) and rug plot (orange hatch marks) of genome size values (pg/2C) for tetraploid
A. barbata from the Old World (n = 40), and California (n = 24). The thick black line in the middle of
each density plot is the median value for genome size. The dotted line is the overall median value.
Table 2 Summary of genome size range from flow cytometry analyses. Broad grouping of accessions
evaluated with flow cytometry, number of plants assayed, mean 2C DNA content (pg/2C), the minimum
and maximum range of the mean DNA content, inferred ploidy, and standard error (SE). See Supplemental Information 1A–B for detailed genome size information.
Group
Sample
size
Mean 2C DNA
content (pg/2C)
SE
Range of 2C DNA
content (pg/2C)
Inferred
ploidy
All Californian accessions
Tetraploid Old World accessions
Diploid (Clade 1—Spain)
Diploid (Clade 2—Morocco,
Greece, Spain)
Babylon, Iraq and Giza, Egypt
24
40
3
3
15.97
16.21
8.26
8.65
0.03
0.03
0.05
0.10
15.62–16.36
15.68–16.69
8.16–8.32
8.48–8.83
4x
4x
2x
2x
2
24.99
0.56
24.43–25.55
6x
Crosby et al. (2014), PeerJ, DOI 10.7717/peerj.633
7/17
Figure 2 Map of Old World Avena accessions and cpDNA phylogeny juxtaposed with previous cpDNA
phylogeny by Peng et al. (2010). Map (Lambert azimuthal equal-area projection) of the Old World
accessions (A). The haplotypes in colour on the map represent the accessions that occur in both the
Old World and California. Maximum-likelihood phylogenetic tree based on 100,000 re-samplings (B).
Bootstrap support is indicated at nodes. The tree was constructed using all informative chloroplast sites
of seven loci. The ploidy for each haplotype is mapped onto the tree, not included as a character in the
phylogeny. Inset tree is a drawn rough approximation of Peng et al. (2010) tree for context in explaining
our phylogeny’s hypothesized rooting. Blue hatched marks are collapsed branches, generally within a
clade. Map of broad categories chloroplast haplotypes of Old World (European and Asian) wild oat
accessions. “Singleton tetraploids” are not necessarily identical to each other, but all mesic and xeric
haplotypes are identical to each other. See discussion for further elaboration on A. damascena-like, and
A. lusitanica types.
Crosby et al. (2014), PeerJ, DOI 10.7717/peerj.633
8/17
well differentiated from each other with polytomies occurring in each clade (Fig. 2B). The
most widely distributed haplotype in the Old World matched that of the mesic genotype. A
haplotype matching that of the xeric genotype was very closely related to the mesic, being
separated by only a single SNP. The xeric haplotype was present in three Mediterranean
sites—for consistency, we refer to these haplotypes as “mesic” and “xeric”. Most other
Old World haplotypes were unique single point occurrences (in Fig. 2A we label these
as “singleton tetraploids”), with the exception of the identical haplotypes isolated from
accessions in Portugal (CN25800), Corsica, France (PI337963), and Tunisia (CN19364).
Three diploid Spanish accessions belonged to one well-supported clade closely related
to tetraploid Algerian accessions. The trnL-F/trnF-R sequences for these clades closely
matched trnL-F/trnF-R sequences for the diploid Avena lusitanica, and the diploid Avena
damascena, respectively (Peng et al., 2010). We therefore root our tree to these groups.
The other three diploids from Greece, Spain, and Morocco are basal to the clade
containing the mesic and xeric haplotypes, along with other tetraploids (Figs. 2A and 2B).
The trnL-F/trnF-R sequence of these diploids matches those of A. hirtula and A. barbata,
which had identical trnL/trnF sequences in Peng et al. (2010) A. hirtula is the inferred
diploid A genome ancestor of the AB tetraploid A. barbata (Allard et al., 1993). We suggest
the diploid accessions in this clade are likely A. hirtula.
The two hexaploids (found in Iraq and Egypt) had the same haplotype, which is also
basal to the main clade. These two hexaploids do not match the trnL-F sequences of
hexaploid A. fatua (or any other Avena species) from Peng et al.’s (2010) phylogeny. Finally,
all haplotypes in the main tetraploid clade containing the mesic and xeric haplotypes have
trnL-F sequences matching those of Peng et al.’s (2010) A. barbata sequences.
Introductions and population structure in California
Three chloroplast haplotypes were identified in California. All three of these were also
observed in the Old World (Figs. 2 and 3). The xeric and mesic haplotypes were of
course present in California, given their association with the mesic and xeric allozyme
genotypes of Allard et al. (1972). However, a third haplotype was found at sites in Northern
California. One accession collected from Livorno, Italy had a chloroplast haplotype
identical to that of this “Northern” haplotype (Fig. 2A), and this haplotype was distantly
related to the mesic and xeric haplotypes.
The SSCP approach we used was able to differentiate between mesic and xeric
haplotypes, and northern and mesic haplotypes (Supplemental Information). The SSCPs
revealed 106 accessions possessing the xeric allele at marker ANU 67-L/68-R, distributed
mostly at southern latitudes (Figs. 3A and 3B). We then were able to further differentiate
74 accessions that had the mesic allele from 24 Northern alleles at marker ANU 73-L/ANU
74-R in California (Fig. 3B). Chloroplast sequence divergence = 0.28% for Californian
haplotypes, in comparison with 0.86% sequence divergence of all accessions, which is more
than a 3x reduction in sequence divergence for Californian haplotypes.
Of the 24 sites that were screened for more than one individual, 12 of these sites were
polymorphic (Fig. 3B). However, there is substantial spatial structure as to how this
Crosby et al. (2014), PeerJ, DOI 10.7717/peerj.633
9/17
Figure 3 Linear logistic regression of latitudinal cline of cpDNA haplotypes in California. Linear logistic regression of the relative abundance of the xeric cpDNA haplotype on latitude, the 95% confidence
bands based on the logistic distribution (A). Note the latitude is on the y-axis for comparison with the
map. (B) shows the geographic distribution of haplotypes in California (Lambert azimuthal equal-area
projection). Pie charts represent 24 sites where multiple individuals were assayed, and are sized relative
to the number of individuals sampled at a site. Triangles represent 71 sites where one individual was
sampled per site.
variation is distributed in California. We estimated FST = 0.33 based upon haplotype
frequencies. Our generalized linear binomial mixed model indicates a latitudinal cline in
the distribution of haplotypes (β = −0.34, p < 0.0001) (Fig. 3A). The xeric haplotype is
more likely to occur at sites in southern California, while northern locations show a higher
frequency of the other two haplotypes.
DISCUSSION
Evidence from cpDNA sequences point to a minimum of three introductions from the
Old World to California. We had originally expected at least two introductions because
of the two previously described genotypes (Clegg & Allard, 1972), and indeed, separate
introductions of the mesic and xeric allozyme genotypes are seen. However we also
discovered a third haplotype that was mostly confined to Northern California. All three
haplotypes in California are also observed in the western Mediterranean, indicating that
there was a minimum of three distinct lineages introduced to California. The presence
of multiple genotypes is a necessary precondition for recombination to contribute to
adaptation/colonization success in the new range (Ellstrand & Schierenbeck, 2000).
The haplotypes within California show substantial large-scale among population
structure largely due to a statewide shallow North-South cline (Fig. 3A). There are
Crosby et al. (2014), PeerJ, DOI 10.7717/peerj.633
10/17
xeric haplotypes at Northern latitudes California, though their distribution is largely
concentrated at southern latitudes. Mesic haplotypes are found mostly in the Northern
region of California, but they are also found at many southern sites. This gradual cline
of xeric haplotypes indicates that residual population structure remains from the 1970s,
where during this time period xeric allozyme genotypes were predominant throughout
California, and especially at southern latitudes (Clegg & Allard, 1972).
But there is also clear spatial mixing within populations. The presence of different
haplotypes within populations increases the probability that hybrid recombination could
occur through occasional outcrossing between different selfing lineages of A. barbata. At
the within population level, spatial mixing of cpDNA lineages occurs most frequently
in North-central populations close to San Francisco and the surrounding Bay Area.
Interestingly, the Northern haplotype is quite distantly related to the other two Californian
haplotypes (Fig. 2B), so it is possible that it is introducing additional new nuclear alleles to
the Californian populations of A. barbata, (not present in the mesic and xeric genotypes)
from which additional new recombinant genotypes may be emerging. The occurrence
of all three genetic lineages within populations; (e.g., Geyserville, Bodega Bay, Marshall,
and San Ardo) allows for the possibility that recombination could greatly enhance genetic
variation.
The three introductions to California may have occurred at different times or
concurrently. With too little divergence time having passed since the presumed original
A. barbata introduction to California (∼200 years ago) (Jain & Marshall, 1967; Minnich,
2008), only small differences in our chosen cpDNA loci (i.e., no mutations have occurred
in California, which would allow us to track movements within the invaded range), it
is impossible to infer from the phylogeny which introduction came first. However, our
previous field studies of the allozyme genotypes and their recombinants suggest that mesic
genotypes have higher fitness than the xeric type (Latta, 2009). This leads to the prediction
of the spread of genotypes derived from the mesic haplotype into areas formerly occupied
by the xeric, especially in the northern region of California (Latta, 2009). This would
suggest that the mesic was introduced after the xeric.
Since neither multi-locus allozyme combination occurred in the Old World (Garcia
et al., 1989), the allozyme combinations described by Allard et al. (1972) were thought
to be recombinants of alleles present in Spanish populations. These findings support the
idea that recombination is relevant to colonization and that it contributes to adaptation.
However, if these recombinant allozyme combinations were separately introduced to
California, as we speculate above, then hybridization may have occurred in A. barbata
populations colonizing habitats further south in South or Central America which were
subsequently transported to California (Blumler, 2000). We cannot discern whether this
initial recombination might have happened in California, or prior to arrival, because our
geographic sampling is restricted to North America and the Mediterranean Basin. Further,
as there were no new cpDNA haplotype mutants observed in California since leaving the
Old World we would not be able to track the route of recombination or migration.
Crosby et al. (2014), PeerJ, DOI 10.7717/peerj.633
11/17
While flow cytometry data show that all Californian populations (accessions) are
tetraploid, one conspicuous result was that the genome sizes (pg/2C values) of Californian
tetraploid individuals were on average smaller (∼1.5%) than those of the Old World
tetraploid individuals. It has been demonstrated that a reduced genome size for plants is
adaptive in novel or stressful environments (as would be experienced during an invasion)
and is associated with a number of phenotypic traits, such as rapid cell division during
stem elongation, that facilitate invasion in Phalaris arundinacea (reed canarygrass)
(Lavergne, Muenke & Molofsky, 2009). Some have argued that intraspecific variation
may be an artifact of measurement error (Greilhuber, 1998; Doleˇzel & Bartos, 2005). But
our samples were grown under similar conditions and measured on the same machine,
at the same time, with the same size standards. We therefore think that these highly
statistically significant differences between Old World and Californian oats are genuine
and worth further testing the hypothesis of reduced genome size in an invading population
(Lavergne, Muenke & Molofsky, 2009).
Old World
Our main purpose in examining the Old World was to determine the number and
divergence of lineages introduced to California. While our Old World sampling was not
intensive, it was more than sufficient to identify the main branches of the phylogeny
(Nielsen & Slatkin, 2013). The mesic haplotype was widespread and the most commonly
found haplotype in the Old World—occurring as far east as India and as far west as coastal
Portugal. Based on our hypothesized rooting of our cpDNA tree, with the diploid A.
lusitanica haplotypes, the mesic haplotype also appears to be one of the most derived. This
is the opposite of what is predicted under coalescent theory, with the baseline expectation
being that the most abundant and/or widespread haplotype is usually basal (Templeton,
Routman & Phillips, 1995). This pattern suggests a recent and rapid spread of A. barbata
individuals bearing the mesic cpDNA haplotype. Such a spread may have occurred if rapid
expansion of the species range in the Old World had reduced genetic drift creating one
widespread and abundant haplotype, as well as an excess of rare haplotypes (Excoffier, Foll
& Petit, 2009), and our data appear to fit these expectations.
Although the large majority of our Old World accessions were tetraploid, a few were not.
As every accession we obtained from germplasm repositories was originally identified and
labeled as “A. barbata”, we used Peng et al.’s (2010) trnL-F phylogeny of Avena species to
infer a plausible root (Avena lusitanica) consistent with the larger Avena phylogeny. The
Avena samples we investigated in the Old World seem to be part of a polyploidy complex
or a series of repeated polyploidizations with multiple origins, which is not uncommon
for plants (Soltis & Soltis, 1999; Soltis et al., 2007; Husband, Baldwin & Suda, 2013). Near
the hypothesized root of our tree, the Algerian samples from Djelfa and Batna are most
closely related to the diploid Avena damascena sequences from Peng et al. (2010), yet
our accessions are tetraploid, so we refer to these accessions as Avena damascena-like
(Fig. 2B). We hypothesize that these tetraploids could potentially be an intermediate
between the diploid Avena damascena (2x) and the derivative hexaploid Avena fatua (6x),
Crosby et al. (2014), PeerJ, DOI 10.7717/peerj.633
12/17
based the placement of these species in Peng et al.’s (2010) phylogenies. Our phylogeny
contains no accessions that matched the trnL-F-trnF-R sequence of A. fatua. The only
hexaploids from our phylogeny were found in Iraq and Egypt, and are closely related to
the tetraploid Northern A. barbata haplotype and they are distantly related to hexaploid A.
fatua from Peng et al. (2010).
The Northern haplotype is tetraploid, but quite divergent in cpDNA sequence from
the mesic and xeric haplotypes. One could argue that the Northern haplotype could be
another tetraploid oat species such as A. abyssinica or A. vaviloviana, which cluster closely
with A. barbata and have identical trnL-F sequences (Peng et al., 2010). However, it is
difficult to separate the whole A. barbata/abyssinica/vaviloviana group and some authors
have proposed it should all be considered A. barbata (Rajhathy & Thomas, 1974). These
inferences, while worth revisiting to clarify phylogeographic hypotheses, are speculative,
and were not the main focus of our study. Whether the Northern cpDNA haplotype
is considered a separate species capable of hybridizing with A. barbata, or a distant
lineage within one species complex does little to alter our main conclusion that there
were three genetic lineages introduced to California. Within California there is almost
certainly intermixing between the three introductions, especially in the North due to the
presence of multiple haplotypes within populations. This sets up the possibility to test for
recombination between the three different introductees, and the possible adaptive spread
of a new recombinant genotype(s) to novel environments.
ACKNOWLEDGEMENTS
We thank Dr. Harold Bockelman from the USDA Small Grains Collection and Dr.
Dallas Kessler from Agriculture Canada at Plant Genome Resources Canada (PGRC)
for supplying the Old World germplasm. We are grateful to the Marine Gene Probe
Laboratory at Dalhousie University for help with SSCPs analysis. We are indebted to Dr.
Brian Husband and Paul Kron for help with flow cytometry. We also thank two anonymous
reviewers from Axios Review for helpful comments.
ADDITIONAL INFORMATION AND DECLARATIONS
Funding
This work was funded by a NSERC Discovery Grant to RGL. The funders had no role
in study design, data collection and analysis, decision to publish, or preparation of the
manuscript.
Grant Disclosures
The following grant information was disclosed by the authors:
NSERC Discovery Grant.
Competing Interests
The authors declare there are no competing interests.
Crosby et al. (2014), PeerJ, DOI 10.7717/peerj.633
13/17
Author Contributions
• Kate Crosby conceived and designed the experiments, performed the experiments,
analyzed the data, contributed reagents/materials/analysis tools, wrote the paper,
prepared figures and/or tables, reviewed drafts of the paper.
• Taylor O. Stokes performed the experiments, analyzed the data.
• Robert G. Latta conceived and designed the experiments, analyzed the data, contributed
reagents/materials/analysis tools, reviewed drafts of the paper.
Supplemental Information
Supplemental information for this article can be found online at http://dx.doi.org/
10.7717/peerj.633#supplemental-information.
REFERENCES
Allard RW, Babbel GR, Clegg MT, Kahler AL. 1972. Evidence for coadaptation in Avena barbata.
Proceedings of the National Academy of Sciences of the United States of America 69:3043–3048
DOI 10.1073/pnas.69.10.3043.
Allard RW, Garcia P, Saenz-de-Miera LE, de la Vega MP. 1993. Evolution of multilocus genetic
structure in Avena hirtula and Avena barbata. Genetics 135:1125–1139.
Baker HG. 1955. Self-compatibility and establishment after “long-distance” dispersal. Evolution
9:347–349 DOI 10.2307/2405656.
Baker HG. 1967. Support for Baker’s law-as a rule. Evolution 21:853–856 DOI 10.2307/2406780.
Barrett S, Colautti RI. 2008. Plant reproductive systems and evolution during biological invasion.
Molecular Ecology 17:373–383 DOI 10.1111/j.1365-294X.2007.03503.x.
Bates D, Maechler M, Dai B. 2008. The lme4 package. In: Computer software manual. Available at
http://cran.r-project.org/web/packages/lme4/lme4.pdf.
Bennett MD, Leitch IJ. 2005. Nuclear DNA amounts in angiosperms: progress, problems and
prospects. Annals of Botany 95:45–90 DOI 10.1093/aob/mci003.
Blumler MA. 2000. Spatial analysis to settle an unresolved question in genetics, with both
theoretical and applied implications. Research in Contemporary and Applied Geography: A
Discussion Series 24:1–42.
Clegg MT. 1972. Patterns of genetic differentiation in natural populations of wild oats. Doctoral
Dissertation, University of California, Davis.
Clegg MT, Allard RW. 1972. Patterns of genetic differentiation in the slender wild oat species
Avena barbata. Proceedings of the National Academy of Sciences of the United States of America
69:1820–1824 DOI 10.1073/pnas.69.7.1820.
Corriveau JL, Coleman AW. 1988. Rapid screening method to detect potential biparental
inheritance of plastid DNA and results for over 200 angiosperm species. American Journal of
Botany 75:1443–1458 DOI 10.2307/2444695.
Daehler C, Strong D. 1997. Hybridization between introduced smooth cordgrass (Spartina
alterniflora; Poaceae) and native California cordgrass (S. foliosa) in San Francisco Bay,
California, USA. American Journal of Botany 84:607–611 DOI 10.2307/2445896.
Dellaporta SL, Wood J, Hicks JB. 1983. A plant DNA minipreparation: version II. Plant Molecular
Biology Reporter 1:19–21 DOI 10.1007/BF02712670.
Crosby et al. (2014), PeerJ, DOI 10.7717/peerj.633
14/17
Dlugosch K, Parker M. 2008. Founding events in species invasions: genetic variation,
adaptive evolution, and the role of multiple introductions. Molecular Ecology 17:431–449
DOI 10.1111/j.1365-294X.2007.03538.x.
Doleˇzel J, Bartos J. 2005. Plant DNA flow cytometry and estimation of nuclear genome size.
Annals of Botany 95:99–110 DOI 10.1093/aob/mci005.
Doleˇzel J, C´ıhal´ıkov´a J, Lucretti S. 1992. A high-yield procedure for isolation of metaphase
chromosomes from root tips of Vicia faba L. Planta 188:93–98 DOI 10.1007/BF00198944.
Doleˇzel J, Greilhuber J, Suda J. 2007. Estimation of nuclear DNA content in plants using flow
cytometry. Nature Protocols 2:2233–2244 DOI 10.1038/nprot.2007.310.
Ebert D, Peakall R. 2009. A new set of universal de novo sequencing primers for extensive
coverage of noncoding chloroplast DNA: new opportunities for phylogenetic studies and cpSSR
discovery. Molecular Ecology Resources 9:777–783 DOI 10.1111/j.1755-0998.2008.02320.x.
Ellstrand NC, Schierenbeck KA. 2000. Hybridization as a stimulus for the evolution of
invasiveness in plants? Proceedings of the National Academy of Sciences of the United States of
America 13:7043–7050 DOI 10.1073/pnas.97.13.7043.
Excoffier L, Foll M, Petit RJ. 2009. Genetic consequences of range expansions. Annual Review of
Ecology, Evolution, and Systematics 40:481–501 DOI 10.1146/annurev.ecolsys.39.110707.173414.
Garcia P, Vences F, de la Vega MP, Allard RW. 1989. Allelic and genotypic composition of
ancestral spanish and colonial californian gene pools of Avena barbata: evolutionary
implications. Genetics 122:687–694.
Gardner KM, Latta RG. 2006. Identifying the targets of selection across contrasting environments
in Avena barbata using Quantitative trait locus mapping. Molecular Ecology 15(5):1321–1333
DOI 10.1111/j.1365-294X.2005.02835.x.
Gasser RB, Hu M, Chilton NB, Campbell BE, Jex AJ, Otranto D, Cafarchia C, Beveridge I,
Zhu X. 2007. Single-strand conformation polymorphism (SSCP) for the analysis of genetic
variation. Nature Protocols 1:3121–3128 DOI 10.1038/nprot.2006.485.
Greilhuber J. 1998. Intraspecific variation in genome size: a critical reassessment. Annals of Botany
82:27–35 DOI 10.1006/anbo.1998.0725.
Guindon S, Dufayard J-F, Lefort V, Anisimova M, Hordjik W, Gascuel O. 2010. New algorithms
and methods to estimate maximum-likelihood phylogenies: assessing the performance of
PhyML 3.0. Systematic Biology 59:307–321 DOI 10.1093/sysbio/syq010.
Hamrick JL, Godt MJW. 1996. Effects of life history traits on genetic diversity in plant
species. Philosophical Transactions of the Royal Society B: Biological Sciences 351:1291–1298
DOI 10.1098/rstb.1996.0112.
Hamrick JL, Holden LR. 1979. Influence of microhabitat heterogeneity on gene frequency
distribution and gametic phase disequilibrium in Avena barbata. Evolution 33:521–533
DOI 10.2307/2407777.
Husband BC, Schemske DW. 1996. Evolution of the magnitude and timing of inbreeding
depression in plants. Evolution 50:54–70 DOI 10.2307/2410780.
Husband BC, Baldwin SJ, Suda J. 2013. The incidence of polyploidy in natural plant populations:
major patterns and evolutionary processes. In: Plant genome diversity. Vol. 2. Vienna: Springer
Vienna, 255–276.
Hutchinson ES. 1982. Genetic markers and ecotypic differentiation of Avena barbata pott ex link.
Doctoral Dissertation, University of California, Davis.
Hutchinson ES, Price S, Kahler A, Allard RW. 1983. An experimental verification of segregation
theory in a diploidized tetraplold: esterase loci in Avena barbata. Journal of Heredity 74:381–383.
Crosby et al. (2014), PeerJ, DOI 10.7717/peerj.633
15/17
Ivanova NV, Fazekas AJ, Hebert PD. 2008. Semi-automated, membrane-based protocol
for DNA isolation from plants. Plant Molecular Biology Reporter 26:186–198
DOI 10.1007/s11105-008-0029-4.
Jain SK, Marshall DR. 1967. Population studies in predominantly self-pollinating species. X.
Variation in natural populations of Avena fatua and A. barbata. American Naturalist 101:19–33
DOI 10.1086/282465.
Johansen-Morris AD, Latta RG. 2006. Fitness consequences of hybridization between ecotypes
of Avena barbata: hybrid breakdown, hybrid vigor, and transgressive segregation. Evolution
60:1585–1595 DOI 10.1111/j.0014-3820.2006.tb00503.x.
Johansen-Morris AD, Latta RG. 2008. Genotype by environment interactions for fitness in hybrid
genotypes of Avena barbata. Evolution 62:573–585 DOI 10.1111/j.1558-5646.2007.00311.x.
Latta RG. 2009. Testing for local adaptation in Avena barbata: a classic example of ecotypic
divergence. Molecular Ecology 18:3781–3791 DOI 10.1111/j.1365-294X.2009.04302.x.
Latta RG, MacKenzie J, Vats A, Schoen D. 2004. Divergence and variation of quantitative traits
between allozyme genotypes of Avena barbata from contrasting habitats. Journal of Ecology
92:51–71 DOI 10.1046/j.0022-0477.2004.00852.x.
Lavergne S, Muenke NJ, Molofsky J. 2009. Genome size reduction can trigger rapid phenotypic
evolution in invasive plants. Annals of Botany 105:109–116 DOI 10.1093/aob/mcp271.
Le Roux JJ, Wieczorek AM, Wright MG, Tran CT. 2007. Super-genotype: global monoclonality
defies the odds of nature. PLoS ONE 2:e590 DOI 10.1371/journal.pone.0000590.
Liu C, Shi L, Zhu Y, Chen H, Zhang J, Lin X, Guan X. 2012. CpGAVAS, an integrated web server
for the annotation, visualization, analysis, and GenBank submission of completely sequenced
chloroplast genome sequences. BMC Genomics 13:715 DOI 10.1186/1471-2164-13-715.
Marshall DR, Allard RW. 1970. Maintenance of isozyme polymorphisms in natural populations
of Avena barbata. Genetics 66:393–399.
Miller RD. 1977. Genetic variability in the slender wild oat Avena barbata in California. Doctoral
Dissertation, University of California, Davis.
Minnich R. 2008. California’s fading wildflowers. Berkeley and Los Angeles: University of California
Press.
Nielsen R, Slatkin M. 2013. An introduction to population genetics: theory and applications.
Sunderland, MA: Sinauer Associates.
Novak SJ, Soltis DE, Soltis PS. 1991. Ownbey’s tragopogons: 40 years later. American Journal of
Botany 78:1586–1600 DOI 10.2307/2444984.
Peng Y-Y, Wei Y-M, Baum BR, Jiang QT, Lan XJ, Dai SF, Zheng YL. 2010. Phylogenetic
investigation of Avena diploid species and the maternal genome donor of Avena polyploids.
Taxon 59:1472–1482.
Prentis PJ, Wilson JRU, Dormontt EE, Richardson DM, Lowe AJ. 2008. Adaptive evolution in
invasive species. Trends in Plant Science 13:288–294 DOI 10.1016/j.tplants.2008.03.004.
Price SC, Jain SK. 1981. Are inbreeders better colonizers? Oecologia 49:283–286
DOI 10.1007/BF00349202.
Rajhathy T, Thomas H. 1974. Cytogenetics of oats (Avena L.). Ottawa: Genetics Society of Canada.
Schierenbeck KA, Ellstrand NC. 2009. Hybridization and the evolution of invasiveness in plants
and other organisms. Biological Invasions 11:1093–1105 DOI 10.1007/s10530-008-9388-x.
Soltis DE, Soltis PS. 1999. Polyploidy: recurrent formation and genome evolution. Trends in
Ecology & Evolution 14:348–352 DOI 10.1016/S0169-5347(99)01638-9.
Crosby et al. (2014), PeerJ, DOI 10.7717/peerj.633
16/17
Soltis D, Soltis P, Schemske D, Hancock JF, Thompson JN, Husband BC, Judd WS. 2007.
Autopolyploidy in angiosperms: have we grossly underestimated the number of species? Taxon
56:13–30.
Taberlet P, Gielly L, Pautou G, Bouvet J. 1991. Universal primers for amplification of
three non-coding regions of chloroplast DNA. Plant Molecular Biology 17:1105–1109
DOI 10.1007/BF00037152.
Templeton AR, Routman E, Phillips CA. 1995. Separating population structure from population
history: a cladistic analysis of the geographical distribution of mitochondrial DNA haplotypes
in the tiger salamander, Ambystoma tigrinum. Genetics 140:767–782.
Zeileis A, Wiel MA, Hornik K, Hothorn T. 2008. Implementing a class of permutation tests: the
coin package. Journal of Statistical Software 28:1–23.
Zhang Q, Liu Y, Sodmergen. 2003. Examination of the cytoplasmic DNA in male reproductive
cells to determine the potential for cytoplasmic inheritance in 295 angiosperm species. Plant
and Cell Physiology 44:941–951 DOI 10.1093/pcp/pcg121.
Crosby et al. (2014), PeerJ, DOI 10.7717/peerj.633
17/17


© Copyright 2026