
. . . . . . . . . . .... T F
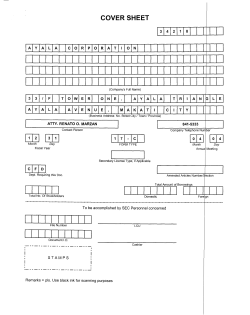
The Taiwan Fund, Inc.® .............. The Taiwan Fund, Inc. What’s Inside Annual Report August 31, 2014 Page Chairman’s Statement 2 Report of the Investment Manager 4 About the Portfolio Managers 6 Portfolio Snapshot 7 Industry Allocation 8 Schedule of Investments 9 Financial Statements 12 Notes to Financial Statements 15 Report of Independent Registered Public Accounting Firm 21 Other Information 22 Summary of Dividend Reinvestment and Cash Purchase Plan 26 ........ Directors and Officers 30 Chairman’s Statement Dear Stockholders, During the year ended August 31, 2014 Taiwan equities outperformed other regional markets in Asia as improving global market conditions, especially in the U.S. (a significant importer of Taiwan goods), translated into improved corporate earnings. Unsurprisingly, the technology sector was the greatest beneficiary as new product launches led to increased supply chain orders. It is against this backdrop that the Fund’s net asset value increased by 16.3%, an underperformance of 5.1% when compared to its benchmark, the TAIEX Total Return Index, which increased by 21.4%* over the same period. The Fund’s underperformance was primarily attributable to sector allocation differences and costs associated with portfolio repositioning following two changes in investment adviser during the financial year. Allianz Global Investors U.S. LLC (‘Allianz’) became the Fund’s investment adviser on an interim basis in February 2014 as the result of the resignation of Asset Management Ptd Ltd as the Fund’s sub adviser to the Fund’s investment adviser, Martin Currie, Inc. The Board’s selection of Allianz as the Fund’s investment adviser was submitted to the Fund’s stockholders for approval; however, the stockholders did not approve Allianz. The Board then selected JF International Management Inc. (‘JFIMI’) as the Fund’s investment adviser. JFIMI began managing the Fund, on an interim basis, in July 2014 and was approved by stockholders on September 22, 2014. The Board thanks Allianz for the interim investment advisory role that they fulfilled for the Fund and welcomes JFIMI. Although it is clearly early in the tenure of JFIMI it is pleasing to report that in the one month to August 31, 2014 the Fund’s net asset value increased by 2.7%, 0.2% ahead of its benchmark, which increased by 2.5% in the same period; this despite the costs of a portfolio repositioning exercise during the same period. 2 The Board also approved a Discount Management Policy on July 17, 2014 whereby the Board has authorized management to make open market purchases in an aggregate amount up to 10% of the Fund’s currently outstanding shares when the Fund’s shares trade at a discount of more than 9% of net asset value and management reasonably believes that such repurchases may enhance shareholder value. Any repurchases will be disclosed in future stockholder reports. Lastly, Bing Shen, a director of the Fund since 2007, chose not to stand for reelection at the Fund’s annual stockholders meeting. The Board thanks Mr. Shen for his contributions to the Board and we wish him well in his future endeavors. On behalf of the Board, I thank you for your continuing support of the Fund. Sincerely, Joe O. Rogers Chairman * Returns for the Fund are historical total returns that reflect changes in net asset value per share during each period and assume that dividends and capital gains, if any, were reinvested. Returns for the TAIEX Index are not total returns and reflect only changes in share price but do not assume that cash dividends, if any, were reinvested, and thus are not strictly comparable to the Fund returns. Past performance is not indicative of future results of the Fund. 3 Report of the Investment Manager Market Review Taiwan equities continued to outperform regional markets in Asia for the 12 months ended August 31, 2014. During this period the Taiwan Stock Exchange Capitalization Weighted Stock Index rose 21.4% in US dollar terms. After shrugging off several market shocks in the beginning of 2014, including US Federal Reserve chair Janet Yellen’s indication of a possible rate rise in six months and homegrown protests over a trade deal with China, the Taiwan Stock Exchange (“TWSE”) Index hit new yearly highs. The improving global macro backdrop, especially in the United States, has been a key catalyst for Taiwan as exports still equate to 70% of its Gross Domestic Product (“GDP”). As a result earnings revisions at the corporate level continued to improve during the year, especially for the technology sector. The TWSE Index finished the first half of the Fund’s financial year (six months ended February 28, 2014) up 6.6% in US dollar terms. Technology shares led the performance on expectations of a synchronized global recovery in 2014. Meanwhile financials, materials and telecom subsectors lagged. Although the results season was generally in line, consensus earnings were downgraded ahead of results hence overall expectations were already set low. During the second half of the Fund’s financial year, the market was volatile as domestic issues dominated headlines. Although the Cross-Strait Service Trade Agreement with China was signed last June, the Sunflower Student Movement began in March and demanded withdrawal from the Agreement. The students finally ended their 24-day occupation of the Legislature in April, saying they had seen “critical progress” made in relation to their demands. Legislative speaker Wang Jin-Ping pledged to halt debate on the services trade pact with China until new oversight rules are passed. While the service pact will have less impact on the technology sector, it should meaningfully benefit Taiwanese financials. On the macro front, Taiwan’s consumer price index rose 1.8% year on year to 104 in July, while core inflation was up 1.55% year on year, hitting a 15-month high. The central bank left its key interest rates unchanged at its quarterly policymaking meeting and the Taiwan economic indicator hit a three year high of 29 in April. The government remains confident with 2014 GDP growth 4 at 3%. At the corporate level, the first quarter results season was encouraging and with positive guidance, liquidity in the market surged as foreign investors remained net buyers. The TWSE Index rallied 13.8% during the period and the technology sector outperformed as new product launches were expected to boost supply chain orders. The construction sector closed down for the period and the government announced expanded measures to control rocketing housing prices by reducing the amount of money banks can lend to home buyers. Market Outlook The risk/reward profile of the market continues to look favorable given strong second quarter of 2014 earnings and positive earnings revisions. While investors are likely to take profits on the Apple supply chain post the launch of the iPhone6, a sustained strong demand for the phone should see investors returning to the sector. A strong Apple pull-in demand, a decent corporate PC replacement cycle and a transition from 3G to 4G in China smart phones should all bode well for Taiwan technology in the fourth quarter of 2014. Aside from technology, with Taiwan financials delivering better than expected year-to-date earnings and an upward revision in Taiwan GDP growth forecast, the financial sector should be poised for a further pick up in performance. Taiwan will hold its 9-in-1 elections in November 2014. The elections are widely perceived as a popularity pulse check between the two major political parties and serve as an important preview of the 2016 presidential election. JF International Management, Inc. * Returns for the Fund are historical total returns that reflect changes in net asset value per share during each period and assume that dividends and capital gains, if any, were reinvested. Returns for the TAIEX Index are not total returns and reflect only changes in share price but do not assume that cash dividends, if any, were reinvested, and thus are not strictly comparable to the Fund returns. Past performance is not indicative of future results of the Fund. 5 About The Portfolio Managers (unaudited) Shumin Huang Portfolio Manager, JPMAM Pacific Region Group Shumin Huang, Managing Director, is an Investment Manager and Head of Greater China Research for the Pacific Regional Group’s Greater China Team. She joined the firm in 2006 after eight years at Goldman Sachs where she was Managing Director and Head of the Asia-Pacific Energy and Chemicals Team. She began her career with UBS Taiwan in 1992 as a Research Analyst in Steel and Financials, after which she transferred to Hong Kong as Director and Head of Asia-Pacific Chemicals Research. Shumin obtained a B.S. in Business Administration from the National University of Taiwan and an M.B.A. from London Business School. Investment Adviser The Fund’s investment adviser is JF International Management Inc. JF International Management Inc. (“JFIMI”) was incorporated in the British Virgin Islands in 1992 and has established a branch in Hong Kong since July 1992. It is registered as an investment adviser under the U.S. Investment Advisers Act of 1940, as amended and is licensed by the Securities and Futures Commission in Hong Kong to conduct Type 4 (advising on securities) and Type 9 (asset management) regulated activities. JFIMI’s registered address is Palm Grove House, P.O. Box 438, Road Town, Tortola, British Virgin Islands and its principal address in Hong Kong is 19th Floor and 21st Floor, Chater House, 8 Connaught Road Central, Hong Kong. JFIMI belongs to a group of companies operating under the name of J.P. Morgan Asset Management (“JPMAM”), the brand name of the global group of asset management companies belonging to JPMorgan Chase & Co. JPMorgan Chase & Co. is the ultimate parent company of JFIMI. JPMAM has assets under management totalling US$ 1.7 trillion (as at June 30, 2014). 6 Portfolio Snapshot* Top Ten Equity Holdings Holdings as of August 31, 2014 Top Ten Equity Holdings % Holdings as of August 31, 2013 % Taiwan Semiconductor Manufacturing Co., Ltd. 9.3 WT Microelectronics Co., Ltd. 7.7 Hon Hai Precision Industry Co., Ltd. 6.9 YungShin Global Holding Corp. 6.4 Delta Electronics Inc. 3.5 Taiwan Semiconductor Manufacturing Co., Ltd. 5.6 Fubon Financial Holding Co., Ltd. 3.5 Aurora Corp. 4.8 Cathay Financial Holding Co., Ltd. 3.4 Yungtay Engineering Co., Ltd. 4.6 MediaTek, Inc. 3.4 Advantech Co., Ltd. 4.3 Advanced Semiconductor Engineering, Inc. 2.9 Mercuries & Associates, Ltd. 4.2 President Chain Store Corp. 2.4 PC Home Online 3.8 Nan Ya Plastics Corp. 2.1 Yem Chio Co., Ltd. 3.7 Advantech Co., Ltd. 2.1 Taiflex Scientific Co., Ltd. 3.6 Top Ten Industry Weightings Weightings as of August 31, 2014 Top Ten Industry Weightings % Weightings as of August 31, 2013 % Semiconductor 20.8 Building Material and Construction 12.7 Financial and Insurance 11.4 Trading and Consumers' Goods 10.4 Electronic Parts/Components 8.7 Electronic Products Distribution 7.7 Electrical Components 8.3 Semiconductor 7.2 Computer and Peripheral Equipment 7.1 Other Electronic 6.7 Diversified Finance Services 5.1 Textile 6.5 Machinery 4.0 Healthcare 6.4 Technology Hardware 4.0 Electronic Parts/Components 5.1 Communications and Internet 3.3 Electric Machinery 4.6 Food Products 2.6 Other 4.3 * Percentages based on net assets. 7 Industry Allocation Industry Allocation (as a percentage of net assets) Communications and Internet Industry 3.3% Machinery Industry 4.0% Technology Hardware Industry 4.0% Diversified Finance Services Industry 5.1% Food Products Industry 2.6% Other Industries 23.4% Other Assets and Liabilities, Net 1.3% Computer and Peripheral Equipment Industry 7.1% Electrical Components Industry 8.3% Semiconductor Industry 20.8% Electronic Parts/Components Industry 8.7% Financial and Insurance Industry 11.4% Fund holdings are subject to change and percentages shown above are based on net assets as of August 31, 2014. The pie chart illustrates the allocation of the investments by industry. A complete list of holdings as of August 31, 2014 is contained in the Schedule of Investments included in this report. The most current available data regarding portfolio holdings and industry allocation can be found on our website, www.thetaiwanfund.com. You may also obtain updated holdings by calling 1-877-864-5056. 8 Schedule of Investments/August 31, 2014 (Showing Percentage of Net Assets) Shares US $ Value (Note 2) ELECTRONICS — (continued) Optoelectronics Industry — 2.1% Largan Precision Co., Ltd. ������������������������ COMMON STOCKS – 98.7% CHEMICALS — 1.3% Chemical Industry — 1.3% China Steel Chemical Corp. ���������������������� TOTAL CHEMICALS ���������������������������������� CONSUMER DISCRETIONARY — 6.8% Auto Components Industry — 2.0% Cub Elecparts Inc. ������������������������������������ Hota Industrial Manufacturing Co., Ltd. ���� Shares 392,000 177,804 1,036,000 Hotels, Restaurants and Leisure Industry — 0.6% TTFB Co., Ltd. ������������������������������������������ 112,000 2,465,532 2,465,532 1,838,090 1,888,961 3,727,051 1,120,356 Leisure Product Industry — 0.3% Topkey Corp. �������������������������������������������� 94,000 471,722 Leisure Time Industry— 2.5% Johnson Health Tech Co., Ltd. ������������������ KMC Kuei Meng International Inc. ������������� Merida Industry Co., Ltd. �������������������������� 319,000 76,000 475,000 772,674 353,423 3,496,094 4,622,191 Multiline Retail Industry— 1.4% Poya Co., Ltd. �������������������������������������������� Taiwan FamilyMart Co., Ltd. ���������������������� 343,440 78,000 2,033,719 538,867 2,572,586 12,513,906 TOTAL CONSUMER DISCRETIONARY ���������� ELECTRONICS — 16.8% Communications and Internet Industry — 1.3% Wistron NeWeb Corp. �������������������������������� 891,460 Computer and Peripheral Equipment Industry — 2.6% Advantech Co., Ltd. ���������������������������������� 409,100 Quanta Computer, Inc. ������������������������������ 353,000 2,326,287 3,839,098 996,745 4,835,843 Electronic Parts/Components Industry — 0.8% King Slide Works Co., Ltd. ������������������������ 113,000 1,515,967 Electronic Products Distribution Industry — 0.0% WT Microelectronics Co., Ltd. �������������������� 45 71 Semiconductor Industry — 10.0% CHIPBOND Technology Corp. �������������������� Taiwan Semiconductor Manufacturing Co., Ltd. ������������������������������������������������ US $ Value (Note 2) 46,000 3,808,902 752,000 1,315,789 4,145,000 17,195,430 18,511,219 30,998,289 TOTAL ELECTRONICS �������������������������������� ENERGY — 0.9% Oil Gas and Electricity Industry General Industry — 0.9% Gigasolar Materials Corp. �������������������������� 89,800 TOTAL ENERGY ���������������������������������������� FINANCE — 16.5% Diversified Finance Services Industry — 5.1% Chailease Holding Co., Ltd. ����������������������� 1,154,000 China Development Financial Holding Corp. �� 7,113,000 E. Sun Financial Holding Co., Ltd. �������������� 3,608,165 Mega Financial Holding Co., Ltd. �������������� 1,732,000 Financial and Insurance Industry — 11.4% Cathay Financial Holding Co., Ltd. ������������ 3,677,600 China Life Insurance Co., Ltd. �������������������� 2,521,200 CTBC Financial Holding Co., Ltd. �������������� 5,237,000 Fubon Financial Holding Co., Ltd. �������������� 3,912,000 Ruentex Development Co., Ltd. ���������������� 1,195,000 TOTAL FINANCE ���������������������������������������� 1,568,244 1,568,244 3,119,493 2,403,483 2,372,006 1,494,976 9,389,958 6,274,823 2,340,654 3,810,734 6,386,832 2,146,886 20,959,929 30,349,887 FOODS — 3.1% Food Industry — 0.5% Uni-President Enterprises Corp. ���������������� 545,380 998,052 Food Products Industry — 2.6% Grape King Bio Ltd. ���������������������������������� Green Seal Holding Ltd. ���������������������������� Namchow Chemical Industrial Co., Ltd. ���� 187,000 370,700 795,000 828,942 2,207,544 1,718,172 4,754,658 5,752,710 TOTAL FOODS ������������������������������������������ The accompanying notes are an integral part of the financial statements. 9 Schedule of Investments/August 31, 2014 (Showing Percentage of Net Assets) (continued) Shares HEALTHCARE — 2.7% Health Care Equipments & Supplies Industry — 1.5% Ginko International Co., Ltd. ���������������������� 107,000 Intai Technology Corp. ������������������������������ 204,000 Healthcare Industry — 1.2% St. Shine Optical Co., Ltd. �������������������������� TOTAL HEALTHCARE �������������������������������� 107,000 US $ Value (Note 2) 1,490,959 1,201,184 2,692,143 2,212,275 4,904,418 INDUSTRIALS — 11.2% Electrical Components Industry— 7.2% Delta Electronics Inc. �������������������������������� ILI Technology Corp. ���������������������������������� Pegatron Corp. ������������������������������������������ Radiant Opto-Electronics Corp. ���������������� Teco Electric and Machinery Co., Ltd. �������� 922,000 704,000 647,000 396,000 1,507,000 6,477,643 1,752,316 1,372,336 1,709,038 1,895,693 13,207,026 Machinery Industry — 4.0% Hiwin Technologies Corp. �������������������������� Nak Sealing Technologies Corp. ���������������� Sumeeko Industries Co., Ltd. �������������������� TSC Auto ID Technology Co., Ltd. �������������� TURVO International Co., Ltd. �������������������� Yungtay Engineering Co., Ltd. �������������������� 5,760 324,000 250,450 117,000 561,468 663,000 56,269 1,349,526 1,030,607 1,113,614 2,291,668 1,643,609 7,485,293 20,692,319 TOTAL INDUSTRIALS �������������������������������� INFORMATION TECHNOLOGY — 32.2% Communications and Internet Industry — 2.0% E-Lead Electronic Co., Ltd. ������������������������ 1,138,000 Sercomm Corp. ���������������������������������������� 578,000 Computer and Peripheral Equipment Industry — 4.5% Axiomtek Co., Ltd. ������������������������������������ 662,000 Flytech Technology Co., Ltd. ���������������������� 24,589 Posiflex Technology, Inc. ���������������������������� 448,000 Wistron Corp. �������������������������������������������� 3,225,611 Electrical Components Industry — 1.1% Au Optronics Corp. ������������������������������������ 10 3,989,000 2,345,254 1,376,812 3,722,066 1,778,444 96,660 2,720,329 3,776,999 8,372,432 1,981,789 Shares INFORMATION TECHNOLOGY — (continued) Electronic Equipment & Instruments Industry — 1.3% Chroma ATE, Inc. �������������������������������������� 595,000 DYNACOLOR, Inc. �������������������������������������� 262,000 Electronic Parts/Components Industry — 7.9% Hon Hai Precision Industry Co., Ltd. ���������� 3,748,640 TXC Corp. ������������������������������������������������ 1,270,000 US $ Value (Note 2) 1,751,727 567,117 2,318,844 12,792,067 1,858,868 14,650,935 Semiconductor Industry — 10.8% Advanced Semiconductor Engineering, Inc. ������������������������������������������������������ ASPEED Technology Inc. ���������������������������� Epistar Corp. �������������������������������������������� MediaTek, Inc. ������������������������������������������ Novatek Microelectronics Corp. Ltd. ���������� Powertech Technology Inc. * �������������������� Sino-American Silicon Products, Inc. * ������ Sonix Technology Co., Ltd. ������������������������ Tong Hsing Electronic Industries Ltd. �������� 4,300,000 124,304 410,000 371,000 302,000 449,000 1,527,000 570,000 138,000 5,358,726 892,029 891,588 6,199,779 1,550,894 851,719 2,477,693 1,008,782 664,827 19,896,037 Software & Services Industry — 0.6% Addcn Technology Co., Ltd. ���������������������� 88,000 1,053,980 Technology Hardware Industry — 4.0% ARBOR Technology Corp. �������������������������� Asustek Computer, Inc. ���������������������������� Catcher Technology Co., Ltd. * ������������������ Compal Electronics, Inc. ���������������������������� Ennoconn Corp. ���������������������������������������� Micro-Star International Co., Ltd. �������������� 475,000 108,000 290,000 1,146,000 74,000 586,000 1,031,348 1,130,928 2,939,730 1,019,842 543,417 804,781 7,470,046 59,466,129 489,160 2,405,665 1,661,000 3,917,649 6,323,314 TOTAL INFORMATION TECHNOLOGY ���������� MATERIALS — 3.4% Metals & Mining Industry — 1.3% Yeong Guan Energy Technology Group Co., Ltd. ������������������������������������������������ Plastic Industry — 2.1% Nan Ya Plastics Corp. �������������������������������� TOTAL MATERIALS ������������������������������������ The accompanying notes are an integral part of the financial statements. Schedule of Investments/August 31, 2014 (Showing Percentage of Net Assets) (concluded) Shares TEXTILES — 0.6% Textile Industry — 0.6% Makalot Industrial Co., Ltd. ����������������������� TOTAL TEXTILES �������������������������������������� 231,000 US $ Value (Note 2) 1,139,911 1,139,911 WHOLESALE AND RETAIL — 3.2% Oil Gas and Electricity Industry General Industry — 0.8% Formosa Petrochemical Corp. ������������������ 606,000 1,530,687 Trading and Consumers' Goods Industry — 2.4% President Chain Store Corp. ���������������������� 574,000 TOTAL WHOLESALE AND RETAIL �������������� 4,349,576 5,880,263 TOTAL COMMON STOCKS (Cost — $170,459,797) ���������������������� 182,054,922 TOTAL INVESTMENTS — 98.7% (Cost — $170,459,797) ���������������������� 182,054,922 OTHER ASSETS AND LIABILITIES, NET—1.3% ������������������������������������������ 2,479,130 NET ASSETS—100.0% ���������������������������� 184,534,052 Legend: US $ – United States dollar * Non-income producing The accompanying notes are an integral part of the financial statements. 11 Financial Statements STATEMENT OF ASSETS AND LIABILITIES August 31, 2014 STATEMENT OF OPERATIONS For the Year Ended August 31, 2014 Assets: Investments in securities, at value (cost $170,459,797) (Notes 2 and 3) ���������������������������������� Cash ������������������������������������������������������ Cash in New Taiwan dollars (cost $522,034) �������������������������������� Receivable for securities sold ���������������� Dividend receivable �������������������������������� Prepaid expenses ���������������������������������� Total assets ���������������������������������������� Investment Income: Dividends ���������������������������������������������� Liabilities: Payable for securities purchased ������������ $929,476 Accrued directors' and officers' fees and expenses ���������������������������� 12,490 Other payables and accrued expenses �� 285,617 Total liabilities ������������������������������������ Net Assets �������������������������������������������� Net Assets Consist of: Paid in capital ���������������������������������������� Accumulated net realized gain on investments in securities and foreign currency �������������������������������� Net unrealized appreciation on investment in securities and foreign currency �������������������������������� Net Assets �������������������������������������������� Net Asset Value, per share ($184,534,052/8,221,259 shares outstanding) �������������������������� $182,054,922 1,071,416 522,789 989,512 1,064,744 58,252 185,761,635 1,227,583 $184,534,052 $151,481,218 Less: Taiwan withholding tax (Note 2) ���� Total investment income �������������������� Expenses: Management fees (Note 4) �������������������� $1,334,658 Directors' and officers' fees and expenses ������������������������������������ 464,145 Legal fees ���������������������������������������������� 340,692 Custodian fees �������������������������������������� 233,122 Administration and accounting fees ������ 190,480 Insurance fees ���������������������������������������� 75,929 Compliance services fees ���������������������� 73,819 Taiwan stock dividend tax (Note 2) �������� 72,592 Audit fees ���������������������������������������������� 72,000 Shareholder communications ���������������� 64,146 Delaware franchise tax �������������������������� 49,905 Transfer agent fees �������������������������������� 18,983 Miscellaneous ���������������������������������������� 144,862 Total expenses ���������������������������������� Net Investment Income ������������������������ 21,453,766 11,599,068 $184,534,052 $22.45 Realized and Unrealized Gain (Loss) on: Net realized gain (loss) on: Investments �������������������������������������� Foreign currency transactions ������������ 3,135,333 690,157 32,591,567 85,490 32,677,057 Net change in unrealized appreciation (depreciation) on: Investments �������������������������������������� Foreign currency translations ������������ Net realized and unrealized gain ������������ Net Increase in Net Assets Resulting From Operations ������������ 12 $4,710,215 4,710,215 (884,725) 3,825,490 The accompanying notes are an integral part of the financial statements. (7,524,719) 1,930 (7,522,789) 25,154,268 $25,844,425 Financial Statements (continued) STATEMENTS OF CHANGES IN NET ASSETS Year Ended August 31, 2014 Year Ended August 31, 2013 Increase/(Decrease) in Net Assets Operations: Net investment income ����������������������������������������������������������������������������������������������������������������������������������������� $690,157 Net realized gain on investments and foreign currency transactions ������������������������������������������������������������������� 32,677,057 Net change in unrealized appreciation (depreciation) on investments and foreign currency translations ������������� (7,522,789) Net increase in net assets resulting from operations ������������������������������������������������������������������������������������������� 25,844,425 $1,118,186 3,909,519 11,425,018 16,452,723 Capital stock transactions (Note 5): Cost of shares repurchased (Note 6) ��������������������������������������������������������������������������������������������������������������������� Total Capital Stock transactions ��������������������������������������������������������������������������������������������������������������������������� Increase in net assets ������������������������������������������������������������������������������������������������������������������������������������������� — — 25,844,425 (12,357,169) (12,357,169) 4,095,554 Net Assets Beginning of year ������������������������������������������������������������������������������������������������������������������������������������������������� 158,689,627 End of year ����������������������������������������������������������������������������������������������������������������������������������������������������������� 184,534,052 Accumulated undistributed net investment loss included in end of period net assets ������������������������������������������� $— 154,594,073 158,689,627 $(8,062,385) The accompanying notes are an integral part of the financial statements. 13 Financial Statements (continued) FINANCIAL HIGHLIGHTS Selected data for a share of common stock outstanding for the years indicated Year Ended August 31, 2014† 2013 2012 2011 2010^ $19.30 $17.21 $20.20 $16.33 $13.84 0.08 0.13 0.02 0.14 0.16 3.07 3.15 1.96 2.09 (2.57) (2.55) 3.81 3.95 2.40 2.56 Less Distributions to Shareholders from: Net investment income ������������������������������������������������������������������������������������������� Net realized gains ��������������������������������������������������������������������������������������������������� Total distributions to shareholders ��������������������������������������������������������������������������� — — — — — — — (0.56) (0.56) (0.08) — (0.08) (0.07) — (0.07) Capital Share Transactions: Accretion (dilution) to net asset value, resulting from share repurchase program, tender offer or issuance of shares in stock dividend ����������������������������������������������� — — 0.12 — — Net asset value, end of year ����������������������������������������������������������������������������������������� $22.45 $19.30 $17.21 $20.20 $16.33 Market value, end of year ������������������������������������������������������������������������������������������� $20.24 $17.33 $15.58 $18.09 $14.67 Selected Per Share Data Net asset value, beginning of year ������������������������������������������������������������������������������� Income from Investment Operations: Net investment income(a) ����������������������������������������������������������������������������������������� Net realized and unrealized gain (loss) on investments and foreign currency transactions ����������������������������������������������������������������������������� Total from investment operations ��������������������������������������������������������������������������� Total Return Per share net asset value(b) ����������������������������������������������������������������������������������������� Per share market value(b) ��������������������������������������������������������������������������������������������� Ratio and Supplemental Data: Net Assets, end of year (000s) ������������������������������������������������������������������������������������� Ratio of expenses before fee waiver(c) ������������������������������������������������������������������������� Ratio of expenses after fee waiver ������������������������������������������������������������������������������� Ratio of net investment income ����������������������������������������������������������������������������������� Portfolio turnover rate ������������������������������������������������������������������������������������������������� 16.32% 16.79% 12.14% 11.23% (11.54)% (10.58)% 24.21% 23.82% 18.56% 21.42% $184,534 1.80% 1.80% 0.40% 181% $158,690 1.96% 1.96% 0.72% 14% $154,594 1.65% 1.61% 0.12% 75% $375,172 1.43% 1.43% 0.71% 54% $303,412 1.49% 1.49% 1.03% 101% (a) Based on average shares outstanding during the period. Total investment return at net asset value (“NAV”) is based on changes in the NAV of Fund shares and assumes reinvestment of dividends and distributions, if any. Total investment return at market value is based on changes in the market price at which the Fund’s shares traded on the stock exchange during the period and assumes reinvestment of dividends and distributions, if any, at actual prices pursuant to the Fund’s dividend reinvestment program. Because the Fund’s shares trade in the stock market based on investor demand, the Fund may trade at a price higher or lower than its NAV. Therefore, returns are calculated based on share price and NAV. During the year ended August 31, 2012 the adviser reimbursed certain fund expenses. If the adviser had not reimbursed the Fund, the return would have been lower. (c) Expense ratio includes 20% tax paid on stock dividends received by the Fund. For the years ended August 31, 2014, 2013, 2012, 2011 and 2010, the Fund’s ratio of expenses before fee waiver and excluding taxes paid on stock dividends was 1.76%, 1.80%, 1.58%, 1.28% and 1.40%, respectively. † As of February 22, 2014, Allianz Global Investors U.S. LLC (“AllianzGI U.S.”) succeeded Martin Currie Inc. as the Fund’s investment adviser. As of July 22, 2014, JF International Management Inc. (“JFIMI”) succeeded AllianzGI U.S. as the Fund’s investment adviser. ^ As of May 8, 2010, Martin Currie Inc. succeeded HSBC Global Asset Management (Taiwan) Limited (“HSBC”) as the Fund’s investment adviser. (b) 14 The accompanying notes are an integral part of the financial statements. Notes To Financial Statements August 31, 2014 1. Organization The Taiwan Fund, Inc. (the “Fund”), a Delaware corporation, is registered under the Investment Company Act of 1940, as amended (the “Act”), as a diversified closed-end management investment fund. The Fund concentrates its investments in the securities listed on the Taiwan Stock Exchange. Because of this concentration, the Fund may be subject to certain additional risks not typically associated with investing in securities of U.S. companies or the U.S. government, including (1) volatility of the Taiwan securities market, (2) restrictions on repatriation of capital invested in Taiwan, (3) fluctuations in the rate of exchange between the NT Dollar and the U.S. Dollar, and (4) political and economic risks. In addition, Republic of China accounting, auditing, financial and other reporting standards are not equivalent to U.S. standards and, therefore, certain material disclosures may not be made, and less information may be available to investors investing in Taiwan than in the United States. There is also generally less regulation by governmental agencies and self-regulatory organizations with respect to the securities industry in Taiwan than there is in the United States. 2. Significant Accounting Policies Security Valuation. All securities, including those traded over-the-counter, for which market quotations are readily available are valued at the last sales price prior to the time of determination of the Fund’s net asset value per share or, if there were no sales on such date, at the closing price quoted for such securities (but if bid and asked quotations are available, at the mean between the last current bid and asked prices, rather than such quoted closing price). These securities are generally categorized as Level 1 securities in the fair value hierarchy. In certain instances where the price determined above may not represent fair market value, the value is determined in such manner as the Board of Directors (the “Board”) may prescribe. Foreign securities may be valued at fair value according to procedures approved by the Board if the closing price is not reflective of current market values due to trading or events occurring in the valuation time of the Fund. In addition, substantial changes in values in the U.S. markets subsequent to the close of a foreign market may also affect the values of securities traded in the foreign market. These securities may be categorized as Level 2 or Level 3 securities in the fair value hierarchy, depending on the valuation inputs. Short-term investments, having a maturity of 60 days or less are valued at amortized cost, which approximates market value, with accrued interest or discount earned included in interest receivable. The Fund has adopted fair valuation accounting standards which establish a definition of fair value and set out a hierarchy for measuring fair value. These standards require additional disclosures about the various inputs and valuation techniques used to develop the measurements of fair value and a discussion in changes in valuation techniques and related inputs during the period. These inputs are summarized in the three broad levels listed below: The financial statements are prepared in accordance with U.S. generally accepted accounting principles (“GAAP”), which require management to make estimates and assumptions that affect the reported amounts of assets and liabilities. Actual results could differ from those estimates. Management has evaluated the impact of all events or transactions occurring after year end through the date these financial statements were issued, and has determined that there were no subsequent events requiring recognition • Level 1 – quoted unadjusted prices for identical instruments in active markets to which the Fund has or disclosure. The following summarizes the significant access at the date of measurement. accounting policies of the Fund: 15 Notes To Financial Statements (continued) August 31, 2014 2. Significant Accounting Policies – continued • Level 2 – quoted prices for similar instruments in active markets; quoted prices for identical or similar instruments in markets that are not active; and model derived valuations in which all significant inputs and significant value drivers are observable in active markets. Level 2 inputs are those in markets for which there are few transactions, the prices are not current, little public information exists or instances where prices vary substantially over time or among brokered market makers. • Level 3 – model derived valuations in which one or more significant inputs or significant value drivers are unobservable. Unobservable inputs are those inputs that reflect the Fund’s own assumptions that market participants would use to price the asset or liability based on the best available information. Investments in Securities Level 1 Leve 2 Level 3 Total Common Stocks^ ������������ $182,054,922 $— $— $182,054,922 Total ������������������ $182,054,922 $— $— $182,054,922 ^ See schedule of investments for industry breakout. interest, at all times. If the seller defaults, and the fair value of the collateral declines, realization of the collateral by the Fund may be delayed or limited. Foreign Currency Translation. The financial accounting records of the Fund are maintained in U.S. dollars. Investment securities, other assets and liabilities denominated in a foreign currency are translated into U.S. dollars at the current exchange rate. Purchases and sales of securities, income receipts and expense payments are translated into U.S. dollars at the exchange rate on the dates of the transactions. Reported net realized gains and losses on foreign currency transactions represent net gains and losses from disposition of foreign currencies, currency gains and losses realized between the trade dates and settlement dates of security transactions, and the difference between the amount of net investment income accrued and the U.S. dollar amount actually received. The effects of changes in foreign currency exchange rates on investments in securities are not segregated in the Statement of Operations from the effects of changes in market prices of those securities, but are included in realized and unrealized gain or loss on investments. Forward Foreign Currency Transactions. A forward foreign currency contract (“Forward”) is an agreement between The inputs or methodology used for valuing securities are two parties to buy or sell currency at a set price on a not necessarily an indication of the risk associated with future date. The Fund may enter into Forwards in order to investing in those securities. hedge foreign currency risk or for other risk management purposes. Realized gains or losses on Forwards include The Fund’s policy is to disclose transfers between Levels based on valuations at the end of the reporting period. As net gains or losses on contracts that have matured or of August 31, 2014, there were no transfers between Levels which the Fund has terminated by entering into an offsetting closing transaction. Unrealized appreciation or 1, 2, or 3 based on the valuation input levels. depreciation on Forwards is included in the Statement Repurchase Agreements. In connection with transactions of Assets and Liabilities and is carried on a net basis. in repurchase agreements, it is the Fund’s policy that its The portfolio could be exposed to risk of loss if the custodian take possession of the underlying collateral counterparty is unable to meet the terms of the contract securities, the fair value of which exceeds the principal or if the value of the currency changes unfavorably. As of amount of the repurchase transaction, including accrued August 31, 2014 the Fund had no open Forwards. 16 Notes To Financial Statements (continued) August 31, 2014 2. Significant Accounting Policies – continued Indemnification Obligations. Under the Fund’s organizational documents, its officers and directors are indemnified against certain liabilities arising out of the performance of their duties to the Fund. In addition, in the normal course of business the Fund enters into contracts that provide general indemnifications to other parties. The Fund’s maximum exposure under these arrangements is unknown as this would involve future claims that may be made against the Fund that have not yet occurred. Taxes. As a qualified Regulated Investment Company (“RIC”) under Subchapter M of the Internal Revenue Code, the Fund is not subject to income taxes to the extent that it distributes all of its investment company taxable income and net realized capital gains for its fiscal year. In addition to federal income tax for which the Fund is liable on undistributed amounts, the Fund is subject to federal excise tax on undistributed investment company taxable income and net realized capital gains. The Fund is organized in Delaware and as such is required to pay Delaware an annual franchise tax. Also, the Fund is currently subject to a Taiwan security transaction tax of 0.3% on sales of equities and 0.1% on sales of mutual fund shares based on the transaction amount. The Fund’s functional currency for tax reporting purposes is the New Taiwan dollar. The Fund recognizes the tax benefits of uncertain tax positions only where the position is “more likely than not” to be sustained assuming examination by tax authorities. Management has analyzed the Fund’s tax positions, and has concluded that no liability for unrecognized tax benefits should be recorded related to uncertain tax positions taken on returns filed for prior three fiscal years. The Fund identifies its major tax jurisdictions as U.S. Federal, Delaware and Taiwan where the Fund is not aware of any tax positions for which it is reasonably possible that the total amounts of unrecognized tax benefits will change materially in the next twelve months. Investment Income. Dividend income is recorded on the ex-dividend date; except, where the ex-dividend date may have passed, certain dividends from foreign securities are recorded as soon as the Fund is informed of the exdividend date. Taiwanese companies typically declare dividends in the Fund’s third fiscal quarter of each year. As a result, the Fund receives substantially less dividend income in the first half of its year. Interest income, which includes accretion of original discount, is accrued as earned. Dividend and interest income generated in Taiwan is subject to a 20% withholding tax. Stock dividends received (except those which have resulted from capitalization of capital surplus) are taxable at 20% of the par value of the stock dividends received. Distributions to Shareholders. The Fund distributes to shareholders at least annually, substantially all of its taxable ordinary income and expects to distribute its taxable net realized gains. Certain foreign currency gains (losses) are taxable as ordinary income and, therefore, increase (decrease) taxable ordinary income available for distribution. Pursuant to the Dividend Reinvestment and Cash Purchase Plan (the “Plan”), stockholders may elect to have all cash distributions automatically reinvested in Fund shares. (See the summary of the Plan described later.) Unless the Board elects to make a distribution in shares of the Fund’s common stock, stockholders who do not participate in the Plan will receive all distributions in cash paid by check in U.S. dollars. Income and capital gain distributions are determined in accordance with income tax regulations, which may differ from GAAP. No capital gain distributions shall be made until any capital loss carryforwards have been fully utilized or expired. 17 Notes To Financial Statements (continued) August 31, 2014 2. Significant Accounting Policies – continued Tax components of distributable earnings are determined in accordance with income tax regulations which may differ from the composition of net assets reported under GAAP. Accordingly, for the year ended August 31, 2014, the effects of certain differences were reclassified. The Fund decreased undistributed net investment loss by $7,372,228, decreased accumulated net realized gain by $1,963,121, and decreased paid in capital by $5,409,107. These differences are primarily due to differing treatments for foreign currency transactions and net operating loss. Permanent book and tax basis differences relating to shareholder distributions will result in reclassifications to paid in capital. Security Transactions. Security transactions are accounted as of the trade date. Gains and losses on securities sold are determined on the basis of identified cost. 3. Purchases and Sales of Securities For the year ended August 31, 2014, purchases and sales of securities, other than short-term securities, aggregated $303,324,161 and $295,862,143, respectively. 18 4. Management Fees and Other Service Providers Management Fee. Effective July 22, 2014, the Fund entered into an Interim Investment Management Agreement (the “Interim Agreement”) with a new investment manager, JF International Management Inc. (“JFIMI”). Under the terms of the Interim Agreement, JFIMI provided its services without a fee. An Investment Management Agreement with JFIMI to replace the Interim Agreement was approved at a Special Meeting of Stockholders, which was held on September 22, 2014. Effective September 23, 2014, JFIMI receives a fee for its services, computed daily and payable monthly in U.S. dollars, at the annual rate of 0.90% per annum of the value of the Fund’s average daily net assets up to and including $150 million of net assets; 0.80% per annum of the value of the Fund’s average daily net assets on the next $150 million of net assets; and 0.70% per annum of the value of the Fund’s average daily net assets in excess thereof. Prior to July 22, 2014, the Fund’s investment adviser was Allianz Global Investors U.S. LLC. (“AllianzGI U.S.”). AllianzGI U.S. received a fee for its services, computed daily and payable monthly in U.S. dollars, at the annual rate of 0.85% per annum of the value of the Fund’s average daily net assets up to and including $150 million of net assets; 0.80% per annum of the value of the Fund’s average daily net assets on the next $150 million of net assets; and 0.70% per annum of the value of the Fund’s average daily net assets in excess thereof. Notes To Financial Statements (continued) August 31, 2014 4. Management Fees and Other Service Providers – continued Prior to February 22, 2014, the Fund’s investment adviser was Martin Currie, Inc., (“Martin Currie”). Martin Currie received a fee for its services, computed daily and payable monthly in U.S. dollars, at the annual rate of 0.90% on the first $150 million in total net assets under management, 0.80% on the next $150 million in total net assets under management and 0.70% on total net assets under management over $300 million. For the period September 1, 2013 through August 31, 2014, the management fee was equivalent to an annual rate of 0.77% of weighted average net assets. Administration Fees. State Street Bank and Trust Company (“State Street”) provides, or arranges for the provision of certain administrative and accounting services for the Fund, including maintaining the books and records of the Fund, and preparing certain reports and other documents required by federal and/or state laws and regulations. The Fund pays State Street a fee at the annual rate of 0.11% of the Fund’s average daily net assets up to $150 million, 0.08% of the next $150 million, and 0.05% of those assets in excess of $300 million, subject to certain minimum requirements. The Fund also pays State Street $130,000 per year for certain legal administrative services, including corporate secretarial services and preparing regulatory filings. State Street also serves as custodian (the “Custodian”) to the Fund. For this service, the Fund pays State Street asset-based fees that vary according to the number of positions and transactions plus out of pocket fees. Director’s and Officer’s Fees and Expenses. The Fund pays each of its directors who is not a director, officer or employee of the investment adviser an annual fee of $20,000 plus $2,500 for each Board meeting or Committee meeting attended in person or by telephone. In addition, the Fund will reimburse each of the directors for travel and out-of-pocket expenses incurred in connection with Board meetings. Other Service Providers. Pursuant to a Compliance Services Agreement, Foreside Compliance Services, LLC (‘‘FCS’’) provides the Fund with a Chief Compliance Officer. FCS is paid customary fees for its services. Foreside Management Services, LLC (“FMS”) provides the Fund with a Treasurer. Prior to February 22, 2014, Martin Currie paid FMS customary fees for its services pursuant to the Treasury Services Agreement between the Fund and FMS. After February 22, 2014, the Fund pays these fees. Neither FCS, FMS, nor their employees that serve as officers of the Fund, have a role in determining the investment policies or which securities are purchased or sold by the Fund. General. Certain officers of the Fund may also be employees of the aforementioned companies that provide services to the Fund, and during their terms of office, receive no compensation from the Fund. 5. Fund Shares At August 31, 2014, there were 100,000,000 shares of $0.01 par value capital stock authorized, of which 8,221,259 were issued and outstanding. For the year ended August 31, 2014, the Fund did not repurchase any shares of its common stock. For the Year Ended August 31, 2014 For the Year Ended August 31, 2013 Shares outstanding at beginning of year ����������������������� 8,221,259 8,982,386 Shares repurchased ����������������������� — Shares outstanding at end of year � 8,221,259 (761,127) 8,221,259 19 Notes To Financial Statements (continued) August 31, 2014 6. Discount Management Program 7. Federal Tax Information On July 17, 2014 and September 11, 2014, the Fund’s Board of Directors approved a Discount Management Policy which authorized management to make open market purchases in an aggregate amount up to 10% of the Fund’s outstanding shares when the Fund’s shares trade at a discount of more than 9% of net asset value and management reasonably believes that such repurchases may enhance shareholder value. Any repurchases will be disclosed in the Fund’s stockholder reports for the relevant fiscal periods and updated in the Fund’s monthly reports when repurchases are made. As of August 31, 2014, the tax components of accumulated net earnings (losses) were $11,405,123 of Unrealized Appreciation and $21,647,711 of Undistributed Capital Gains. The amount of capital loss carryover utilized in the current year was $8,676,568. The Board committed to regularly reviewing the effectiveness of the Policy and commencing one year after implementation of the Policy, formally review the Policy and in consultation with stockholders consider other actions that, in its judgment, may be effective in addressing the discount. Also, with adoption of the Discount Management Policy the Board determined not to implement the previously announced Managed Distribution Policy at this time. 20 The difference between book basis and tax basis unrealized appreciation and depreciation is attributable primarily to the tax deferral of losses on wash sales. At August 31, 2014, the aggregate cost basis of the Fund’s investment securities for income tax purposes was $170,653,742. Net unrealized appreciation of the Fund’s investment securities was $11,401,180 of which $14,415,177 related to appreciated investment securities and $(3,013,997) related to depreciated investment securities. Report of Independent Registered Public Accounting Firm To the Shareholders and The Board of Directors of The Taiwan Fund, Inc. We have audited the accompanying statement of assets and liabilities, including the schedule of investments, of The Taiwan Fund, Inc. (the “Fund”), as of August 31, 2014 and the related statement of operations for the year then ended, the statements of changes in net assets for each of the two years in the period then ended, and the financial highlights for each of the five years in the period then ended. These financial statements and financial highlights are the responsibility of the Fund’s management. Our responsibility is to express an opinion on these financial statements and financial highlights based on our audit. We conducted our audit in accordance with the standards of the Public Company Accounting Oversight Board (United States). Those standards require that we plan and perform the audit to obtain reasonable assurance about whether the financial statements and financial highlights are free of material misstatement. The Fund is not required to have, nor were we engaged to perform, an audit of its internal control over financial reporting. Our audit included consideration of internal control over financial reporting as a basis for designing audit procedures that are appropriate in the circumstances, but not for the purpose of expressing an opinion on the effectiveness of the Fund’s internal control over financial reporting. Accordingly, we express no such opinion. An audit includes examining, on a test basis, evidence supporting the amounts and disclosures in the financial statements. Our procedures included confirmation of securities owned as of August 31, 2014, by correspondence with the custodian and brokers or through alternative procedures where replies from brokers were unable to be obtained. An audit also includes assessing the accounting principles used and significant estimates made by management, as well as evaluating the overall financial statement presentation. We believe that our audit provides a reasonable basis for our opinion. In our opinion, the financial statements and financial highlights referred to above present fairly, in all material respects, the financial position of The Taiwan Fund, Inc. as of August 31, 2014, the results of its operations for the year then ended, the changes in its net assets for each of the two years in the period then ended and the financial highlights for each of the five years in the period then ended, in conformity with accounting principles generally accepted in the United States of America. Philadelphia, Pennsylvania October 28, 2014 21 Other Information (unaudited) Federal Tax Information. The Fund has made an election under Internal Revenue Code Section 853 to pass through foreign taxes paid by the Fund to its shareholders. For the year ended August 31, 2014, the total amount of foreign source income, for information reporting purposes, will be $4,710,215. Privacy Policy Privacy Notice The Taiwan Fund, Inc. collects non-public personal information about its shareholders from the following sources: Information it receives from shareholders on applications or other forms; Information about shareholder transactions with the Fund, its affiliates, or others; and Information it receives from a consumer reporting agency. The Fund’s policy is to not disclose nonpublic personal information about its shareholders to nonaffiliated third parties (other than disclosures permitted by law). The Fund restricts access to nonpublic personal information about its shareholders to those agents of the Fund who need to know that information to provide products or services to shareholders. The Fund maintains physical, electronic, and procedural safeguards that comply with federal standards to guard its shareholders’ nonpublic personal information. Proxy Voting Policies and Procedures A description of the policies and procedures that are used by the Fund’s investment adviser to vote proxies relating to the Fund’s portfolio securities is available (1) without charge, upon request, by calling 1-877-864-5056; and (2) as an exhibit to the Fund’s annual report on Form N-CSR which is available on the website of the Securities and Exchange Commission (the “Commission”) at http://www.sec.gov. Information regarding how the investment adviser voted these proxies during the most recent 12-month period ended June 30 is available without charge, upon request, by calling the same number or by accessing the Commission’s website. Quarterly Portfolio of Investments The Fund files with the Securities and Exchange Commission its complete schedule of portfolio holdings on Form N-Q for the first and third quarters of each fiscal year. The Fund’s Form N-Q’s are available on the Commission’s website at http://www.sec.gov. Additionally, the Portfolio of Investments may be reviewed and copied at the Commission’s Public Reference Room in Washington, D.C. Information on the operation of the Public Reference Room may be obtained by calling 1-800-SEC-0330. The most recent Form N-Q is available without charge, upon request, by calling 1-877-864-5056. 22 Other Information (unaudited) (continued) Certifications The Fund’s chief executive officer has certified to the New York Stock Exchange that, as of June 6, 2014, he was not aware of any violation by the Fund of applicable New York Stock Exchange corporate governance listing standards. The Fund also has included the certifications of the Fund’s chief executive officer and chief financial officer required by Section 302 and Section 906 of the Sarbanes-Oxley Act of 2002 in the Fund’s Form N-CSR filed with the Securities and Exchange Commission, for the period of this report. Board Deliberations regarding Approval of Interim Investment Advisory and Management Agreement and Investment Advisory and Management Agreement General Background On July 18, 2014, the Board of Directors, all of whom are Independent Directors, voted to approve an Interim Investment Advisory and Management Agreement and an Investment Advisory and Management Agreement with JF International Management Inc. (“JFIMI”) (together, the “Agreements”) and recommended to stockholders the approval of the Investment Advisory and Management Agreement between the Fund and JFIMI. The Interim Investment Advisory and Management Agreement replaced the Interim Investment Advisory Agreement dated, February 22, 2014, between the Fund and AllianzGI U.S. (“Allianz”) (the “Allianz Agreement”). The Allianz Agreement replaced the Investment Advisory and Management Agreement, dated February 23, 2012, between Martin Currie, Inc. (“Martin Currie”) and the Fund (the “Martin Currie Agreement”). The Allianz Agreement was not approved by stockholders. Approval Process and the Factors Considered by the Board of Directors in Approving the Agreements On September 5, 2013, Martin Currie received a notice from Asset Management Ptd Ltd (“APS,”) the Fund’s subadviser, that APS intended to resign as sub-adviser of the Fund effective February 22, 2014. At a special Board meeting held on September 17, 2013, the Board determined it would be appropriate for the Board to meet with Martin Currie to review the arrangements for the management of the Fund’s assets. At that time, and at subsequent Board meetings held on October 8, 2013, November 11, 2013 and December 12, 2013, the Board discussed the ramifications of the APS resignation; the proposal by Martin Currie to continue to serve as the Adviser, subject to the engagement of an individual with the requisite expertise; and possible courses of action in the event that Martin Currie was unable to provide a satisfactory alternative. The Board retained a consultant to assist the Board in identifying and evaluating appropriate alternative investment advisers. After reviewing the consultant’s report, a committee of the Board identified three potential investment adviser candidates and requested that those candidates provide certain additional information. Two of those candidates, JFIMI and Allianz, provided additional information, and then were requested to make a presentation to the Board on January 20, 2014. Martin Currie was not included in the later stages of the selection process when it became clear that it would not be able to employ on a timely basis an experienced Taiwan equity portfolio manager to manage the Fund’s portfolio. 23 Other Information (unaudited) (continued) Following those presentations and further discussions with the consultant, the Board, at a meeting on January 21, 2014, determined that it would be appropriate to enter into an interim arrangement with Allianz and at the Board meeting held on January 21, 2014, the Board approved the Allianz Agreement. At that Board meeting, the Board also approved the selection of Allianz as the investment adviser for the Fund and agreed to submit the selection of Allianz for approval by the Fund’s stockholders at the next annual stockholders meeting which after adjournments was held in May 2014. At the annual meeting of stockholders held on May 14, 2014, the stockholders of the Fund did not approve the Allianz Agreement. The Board then determined to ask JFIMI to update the information that it had provided in January 2014 in response to the Fund’s Request for Proposal. After considering that information the Board held a meeting on May 30, 2014 during which it received a presentation by JFIMI and discussed the information provided by JFIMI. At that meeting, the Board approved the selection of JFIMI as Investment Adviser to the Fund. In making this selection the Board noted that JFIMI managed other portfolios containing Taiwan equity securities and that JFIMI proposed to engage employees of JPMorgan Asset Management (Taiwan) Limited (“JPMAM Taiwan”) to provide non-discretionary investment advice to JFIMI in its management of the Fund as well as trade execution and other support services via a participating affiliate arrangement. The Board also considered the terms and conditions of the Agreements and the nature, scope and quality of services that JFIMI is expected to provide to the Fund. The Board also based its decision on the following considerations, among others, although the Board did not identify any consideration that was all important or controlling, and each Director attributed different weights to the various factors. Nature, Extent and Quality of the Services provided by the Investment Adviser. The Board reviewed and considered the nature and extent of the investment management services to be provided by JFIMI under the Agreements. The Board noted the following: J.P. Morgan Asset Management, which is the brand name for the asset management business of JPMorgan Chase & Co. and its affiliates worldwide, is one of the leading sponsors and administrators of closed-end funds, with over $14.3 billion of closed-end fund assets under management as of June 30, 2014. The Board also noted that JFIMI managed one other Asian equity closed-end fund. JFIMI informed the Board that the Fund’s portfolio manager is proposed to be Shumin Huang, an officer and portfolio manager of JFIMI with assistance from investment professionals employed by JPMAM Taiwan and supervised by JFIMI through a participating affiliate arrangement. The Board determined that JFIMI appeared to be capable of providing the Fund with investment management services of above average quality. Performance, Fees and Expenses of the Fund. The Board noted that, at the time of JFIMI’s selection by the Board, JFIMI had not been providing services to the Fund; therefore, there were limitations on the Board’s ability to evaluate the performance of JFIMI in managing the Fund. Based, however, on JFIMI’s performance in managing other portfolios containing Taiwan equity securities utilizing the resources of JPMAM Taiwan, the Board concluded that there was reason to believe that JFIMI could achieve competitive performance over the long term in managing the Fund. The Board also noted that the advisory fee agreed to by JFIMI was the same as under the Martin Currie Agreement and slightly higher than under the Allianz Agreement and compared favorably with fees charged by advisers of other U.S. 24 Other Information (unaudited) (continued) registered closed-end funds that invest in the Greater China region. The Board also noted that, except for certain compliance and treasury services fees that Martin Currie had been paying, other expenses of the Fund were not expected to increase as a result of the retention of JFIMI. Economies of Scale. The Board considered the economy of scale benefits that the Fund’s stockholders would be afforded as the management fee rate under the Agreements declines as the Fund’s assets grow. Other Benefits of the Relationship. The Board considered whether there were other benefits that JFIMI and its affiliates may derive from its relationship with the Fund and concluded that any such benefits were likely to be minimal. Resources of the Proposed Investment Adviser. The Board considered whether JFIMI is financially sound and has the resources necessary to perform its obligations under the Agreements, noting that JFIMI appears to have the financial resources necessary to fulfill its obligations under the Agreements. General Conclusions. After considering and weighing all of the above factors, the Board concluded that it would be in the best interest of the Fund to approve the Agreements and for its stockholders to approve the Investment Advisory and Management Agreement. In reaching this conclusion, the Board did not give particular weight to any single factor referenced above. 25 Summary of Dividend Reinvestment and Cash Purchase Plan What is the Dividend Reinvestment and Cash Purchase Plan? The Dividend Reinvestment and Cash Purchase Plan (the “Plan”) offers shareholders of the Fund, a prompt and simple way to reinvest their dividends and capital gains distributions in shares of the Fund. The Fund will distribute to shareholders, at least annually, substantially all of its net income and expects to distribute annually its net realized capital gains. Computershare Trust Company, N.A. (the “Plan Administrator”), acts as Plan Administrator for shareholders in administering the Plan. The Plan also allows you to make optional cash investments in Fund shares through the Plan Administrator. Who Can Participate in the Plan? If you own shares in your own name, you can elect to participate directly in the Plan. If you own shares that are held in the name of a brokerage firm, bank, or other nominee, you should contact your nominee to arrange for them to participate on your behalf. What Does the Plan Offer? The Plan has two components; reinvestment of dividends and capital gains distributions, and a voluntary cash purchase feature. Reinvestment of dividends and capital gains distributions If you choose to participate in the Plan, your dividends and capital gains distributions will be promptly invested for you, automatically increasing your holdings in the Fund. If the Fund declares a dividend or capital gains distribution payable in cash, you will automatically receive shares purchased by the Plan Administrator on the open market. You will be charged a per share fee (currently $0.05) incurred with respect to the Plan Administrator’s open market purchases. If a distribution is declared which is payable in shares or cash at the option of the shareholder and if on the valuation date (generally the payable date) the market price of shares is equal to or exceeds their net asset value, the Fund will issue new shares to you at the greater of the following: (a) net asset value per share or (b) 95% of the market price per share. If the market price per share on the valuation date is less than the net asset value per share, the Fund will issue new shares to you at the market price per share on the valuation date. All reinvestments are in full and fractional shares, carried to three decimal places. In the case of foreign (non-U.S.) shareholders, reinvestment will be made net of applicable withholding tax. The Plan will not operate if a distribution is declared in shares only, subject to an election by the shareholders to receive cash. 26 Summary of Dividend Reinvestment and Cash Purchase Plan (continued) Voluntary cash purchase option Plan participants have the option of making investments in Fund shares through the Plan Administrator. You may invest any amount from $100 to $3,000 semi-annually. The Plan Administrator will purchase shares for you on the New York Stock Exchange or otherwise on the open market on or about February 15 and August 15. If you hold shares in your own name, you should deal directly with the Plan Administrator. Checks in U.S. dollars and drawn in U.S. banks should be made payable to “Computershare”. The Plan Administrator will not accept cash, traveler’s checks, money orders, or third party checks. We suggest you send your check, along with a completed transaction form which is attached to each statement you receive, to the following address to be received at least two business days before the investment date: Computershare, c/o The Taiwan Fund, Inc. at P.O. Box 43078, Providence, RI 02940-3078. The Plan Administrator will return any cash payments received more than thirty days prior to February 15 or August 15, and you will not receive interest on uninvested cash payments. If you own shares that are held in the name of a brokerage firm, bank, or other nominee, you should contact your nominee to arrange for them to participate in the cash purchase option on your behalf. If your check is returned unpaid for any reason, the Plan Administrator will consider the request for investment of such funds null and void, and shall immediately remove these shares from your account. The Plan Administrator shall be entitled to sell shares to satisfy any uncollected amount plus any applicable fees. If the net proceeds of the sale are insufficient to satisfy the balance of any uncollected amounts, the Plan Administrator shall be entitled to sell such additional shares from your account as may be necessary to satisfy the uncollected balance. Is There a Cost to Participate? For purchases from the reinvestment of dividends and capital gains distributions, you will pay a pro rata portion of brokerage commissions payable with respect to purchases of shares by the Plan Administrator on the open market. You will also be charged a per share fee (currently $0.05) incurred with respect to the Plan Administrator’s open market purchases in connection with the reinvestment of dividends and capital gains distributions. Brokerage charges for purchasing shares through the Plan are expected to be less than the usual brokerage charges for individual transactions, because the Plan Administrator will purchase stock for all participants in blocks, resulting in lower commissions for each individual participant. The Plan Administrator’s transaction fees for handling capital gains distributions or income dividends will be paid by the Fund. For purchases from voluntary cash payments, participants are charged a service fee (currently $0.75 per investment) and a per fee (currently $0.05) for each voluntary cash investment. Per share fees include any brokerage commissions the Plan Administrator is required to pay. Brokerage commissions and service fees, if any, will be deducted from amounts to be invested. 27 Summary of Dividend Reinvestment and Cash Purchase Plan (continued) What Are the Tax Implications for Participants? You will receive tax information annually for your personal records and to help you prepare your federal income tax return. The automatic reinvestment of dividends and capital gains distributions does not relieve you of any income tax which may be payable on dividends or distributions. For further information as to the tax consequences of participating in the Plan, you should consult with your tax advisors. If the Fund issues shares upon reinvestment of a dividend or capital gains distribution, for U.S. federal income tax purposes, the amount reportable in respect of the reinvested amount of the dividend or distribution will be the fair market value of the shares received as of the payment date, which will be reportable as ordinary dividend income and/or long term capital gains. The shares will have a tax basis equal to such fair market value, and the holding period for the shares will begin on the day after the payment date. State, local and foreign taxes may also be applicable. Once Enrolled in the Plan, May I Withdraw From It? You may withdraw from the Plan without penalty at any time by calling the Plan Administrator at 1-800-426-5523, by accessing your Plan account at the Plan Administrator’s web site, www.computershare.com/investor or by written notice to the Plan Administrator. If you withdraw, you will receive, without charge, stock certificates issued in your name for all full shares, and a check for any fractional share (valued at the market value of the shares at the time of withdrawal or termination) less any applicable fees. You may also request that the Plan Administrator sell your shares and send you the proceeds, less a transaction fee of $2.50 and a per share fee of $0.15 for any request for withdrawal or termination. The per share fee includes any brokerage commissions the Plan Administrator is required to pay. Alternatively, you may also request that the Plan Administrator move your whole shares to the Direct Management System, which would allow you to maintain ownership of those whole shares in book entry form on the records of the Fund. All sale requests having an anticipated market value of $100,000.00 or more are expected to be submitted in written form. In addition, all sale requests within thirty (30) days of an address change are expected to be submitted in written form. 28 Summary of Dividend Reinvestment and Cash Purchase Plan (continued) Whom Should I Contact for Additional Information? If you hold shares in your own name, please address all notices, correspondence, questions, or other communications regarding the Plan to: Computershare, c/o The Taiwan Fund, Inc. at P.O. Box 43078, Providence, RI 02940-3078, by telephone at 1-800-426-5523 or through the Internet at www.computershare.com/investor. If your shares are not held in your name, you should contact your brokerage firm, bank, or other nominee for more information and to arrange for them to participate in the Plan on your behalf. Either the Fund or the Plan Administrator may amend or terminate the Plan. Except in the case of amendments necessary or appropriate to comply with applicable law, rules or policies or a regulatory authority, participants will be mailed written notice at least 30 days before the effective date of any amendment. In the case of termination, participants will be mailed written notice at least 30 days before the record date of any dividend or capital gains distribution by the Fund. 29 Directors and Officers (unaudited) The following table sets forth certain information concerning each of the directors and officers of the Fund. Directors serve from the time of election and qualifications at the Fund’s annual meeting of stockholders until their next succeeding election or until their respective successors have been elected and qualified. All Officers serve for one year or until their respective successors are chosen and qualified. Name, Address and (Age) Present Office with the Fund Since Principal Occupation or Employment During Past Five Years Directorships in Publicly-Held Companies (Directors Only) Chairman of the Board, Director and Member of the Audit Committee, The China Fund, Inc. (1992-present). Directors Considered Independent Persons Joe O. Rogers, Ph.D. (65) 2477 Foxwood Drive Chapel Hill, NC 27514 Chairman of the Board (since January 2012) and Director 1986 President, Rogers International LLC (2010-present); Visiting Professor, Fudan University School of Management (2010-12). M. Christopher Canavan, Jr. (75) 73 Brook Street Wellesley, MA 02482 Director 2003 Retired; Independent Consultant (20002010); Partner, PricewaterhouseCoopers (1972-1999). Anthony Kai Yiu Lo (65) 2/F Hong Villa 12 Bowen Street Hong Kong Director 2003 Chairman, Shanghai-Century Capital Ltd. (January 2009-present); Chairman and Co-CEO, Shanghai Century Acquisition Inc. (January 2006-March 2009). Independent Non-Executive Director and Chairman of the Audit Committee, Mecox Lane Limited (October 2010-July 2014); Director, Bosera China Fund plc (October 2010-present). Michael F. Holland (70) 375 Park Avenue, Suite 2108 New York, New York 10152 Director 2007 Chairman, Holland & Company LLC (1995-present). Director, The Holland Balanced Fund, Inc., The China Fund, Inc., Reaves Utility Income Fund and Blackstone/GSO Loan Funds; Trustee and CoChairman, State Street Master Funds; State Street Institutional Investment Trust and Trustee SSgA Funds. 30 Directors and Officers (unaudited) (continued) Principal Occupation or Employment During Past Five Years Directorships in Publicly-Held Companies (Directors Only) Present Office with the Fund Since Director 2013 T.M. Chang Professor of Director, The China Fund, China Studies (2006-present); Inc., Cabot Corporation Spangler Family Professor of Business Administration (2006-present); Chairman, Harvard China Fund (2006-present); Harvard University Distinguished Service Professor (2006-present); Director, John K. Fairbank Center for Chinese Studies, Harvard University (2006-2014); Dean of the Faculty of Arts and Sciences Harvard University (2002-2006). Simon J. Crinage (49) J.P. Morgan Asset Management 60 Victoria Embankment London, EC4Y 0JP President 2014 Managing Director, J.P. Morgan Asset Management Richard F. Cook, Jr. (63) Foreside Compliance Services, LLC. Three Canal Plaza, Suite 100 Portland, ME 04101 Chief Compliance Officer 2007 Director of Foreside Compliance Services LLC, (January 2006-present); Chief Compliance Officer, Guinness Atkinson Funds (November 2005-2012); Chief Compliance Officer, Nomura Partners Funds (April 2007-present); Managing Member of Northlake, LLC (2002-present). Name, Address and (Age) Directors Considered Independent Persons — (continued) William C. Kirby (64) Harvard University CGIS South Building 1730 Cambridge Street Cambridge, MA 02138 Officers Director of JPMorgan China Region Fund, Inc., Director of the Association of Investment Companies Limited and JF International Management, Inc. 31 Directors and Officers (unaudited) (continued) Name, Address and (Age) Present Office with the Fund Since Principal Occupation or Employment During Past Five Years Officers — (continued) Brian F. Link (41) Secretary State Street Bank and Trust Company 4 Copley Place Boston, MA 02116 2014 Vice President and Managing Counsel, State Street Bank and Trust Company (2004-present) William C. Cox (48) Foreside Financial Group, LLC 10 High Street Suite 302 Boston, MA 02110 2013 Fund Principal Financial Officer, Foreside Financial Group, LLC. (2013-Present); Vice President, State Street Corporation (1997-2012). 32 Treasurer Directorships in Publicly-Held Companies (Directors Only) THIS PAGE INTENTIONALLY LEFT BLANK THIS PAGE INTENTIONALLY LEFT BLANK THIS PAGE INTENTIONALLY LEFT BLANK UNITED STATES ADDRESS The Taiwan Fund, Inc. c/o State Street Bank and Trust Company One Lincoln Street P.O. Box 5049 Boston, MA 1-877-864-5056 www.thetaiwanfund.com INVESTMENT ADVISER AND SUB-ADVISER JF International Management Inc. 21st Floor, Chater House 8 Connaught Road Central Hong Kong DIRECTORS AND OFFICERS Joe O. Rogers, Chairman of the Board and Independent Director Michael F. Holland, Director M. Christopher Canavan, Jr., Director Anthony Kai Yiu Lo, Director William Kirby, Director Simon J. Crinage, President William C. Cox, Treasurer Richard F. Cook, Jr., Chief Compliance Officer Brian F. Link, Secretary ADMINISTRATOR AND ACCOUNTING AGENT State Street Bank and Trust Company Boston, MA CUSTODIAN State Street Bank and Trust Company Boston, MA TRANSFER AGENT, DIVIDEND PAYING AGENT AND REGISTRAR Computershare Trust Company, N.A. Canton, MA LEGAL COUNSEL Clifford Chance US LLP New York, NY Lee and Li Taipei, Taiwan INDEPENDENT REGISTERED PUBLIC ACCOUNTING FIRM Tait, Weller & Baker, LLP Philadelphia, PA SHAREHOLDER AGENT AST Fund Solutions, LLC New York, NY Notice is hereby given in accordance with Section 23(c) of the Investment Company Act of 1940 that from time to time the Fund may purchase shares of its common stock in the open market at prevailing market prices.


© Copyright 2026