
Bellatrix Exploration Ltd. BUY Equity Research
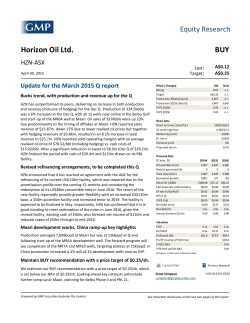
Equity Research
Bellatrix Exploration Ltd.1
BUY
BXE-TSX/NYSE
▼
November 4, 2014
Q3 results light
What's Changed
Rating
Production pre-released; cash flow behind on higher gas
weighting and lower realized oil prices
Bellatrix released Q3 results that were below expectations. In a market
concerned about commodity prices and any associated risk, our forecast of
rising debt to cash flow causes some concern (note: GMP continues to have a
generous price deck when compared to the current futures strip). When
combined with continued expected infrastructure challenges and a year where
capital spending was guided higher while production was guided lower, we are
lowering our target price to $7.00 from $10.00. While Bellatrix should
continue to appeal to value investors with a long term investment horizon, we
would not be surprised to see short term challenges to the share price as risk
adverse investors look for lower risk energy investments.
Key highlights from the quarter
• Production was pre-released and was as expected although cash flow was
19% lower than expected on higher gas weighting and lower realized oil
prices.
• Bellatrix has maintained its full year 2014 capital plans of $530 million with
much of that in Q3 as spending was 70% higher than we anticipated.
• Our forecasts now call for net debt of $505 million at YE’14 rising to $653
million and 2.0 times at YE’15.
• Preliminary 2015 guidance was released with $450 million in capital
spending delivering 48,000 – 49,000 boe/d of average production, up from
38,500 boe/d in 2014.
• On the infrastructure side look for the compression booster expansion as
well as the Twin Rivers pipeline build in 2014 along with new pipelines and
the BXE owned plant being completed mid-2015.
C$4.77
C$7.00
Last:
Target:
Target
Production 2014E (boe/d) 6:1
Production 2015E (boe/d) 6:1
CFPS 2014E (f.d.)
CFPS 2015E (f.d.)
Old
New
BUY
$10.00
38,493
48,997
$1.58
$1.91
n.c.
$7.00
38,353
47,670
$1.45
$1.59
Share Data
Shares o/s (mm, basic/f.d)
191.5/202.7
52-week high/low
$11.27/$4.55
Market Cap (mm)
$922
EV (mm)
Dividend Yield
Projected Return
$1,428
0.0%
54%
Financial Data
YE Dec. 31
Oil and NGLs (b/d)
Natural Gas (mmcf/d)
Total (boe/d) 6:1
Equivalent growth
WTI (US$/b)
HHUB (US$/mmbtu)
FX rate (USD/CAD)
EPS (f.d.)
CFPS (f.d.)
Net debt (mm)
Net Debt/CF
Annual Dividend ($/share)
Dividend Payout (%)
Corporate Payout (%)
2013A
6,489
92.0
21,829
31%
$97.99
$3.73
$0.97
$0.58
$1.12
$397.3
2.9x
$0.00
0%
263%
2014E
12,688
154.0
38,353
76%
$95.80
$4.41
$0.91
$0.64
$1.45
$505.3
1.8x
$0.00
0%
135%
2015E
15,124
195.3
47,670
24%
$90.00
$4.00
$0.90
$0.35
$1.59
$653.0
2.0x
$0.00
0%
146%
5.8x
10.6x
$72,028
3.1x
4.8x
$37,223
2.9x
4.5x
$33,046
$6.75
0.6x
0.3x
Valuation
P/CF
EV/DACF
EV/boe/d
EV/2P reserves (YE13)
P/(2P) NAV
P/Risked Upside NAV
All figures in CAD$ unless otherwise noted
Grant Daunheimer, CFA
(403) 543-3039
Graham Smith, CFA
(403) 543-3032
[email protected]
[email protected]
Maintaining BUY recommendation, lowering target to $7.00
We calculate our $7.00 target price based on a combination of our 2015E
EV/DACF multiple of 4.5 times (down from 5) and our risked development
NAV of $14.08. We have moved our Risked NAV weighting to 30% from equal
weight as a result of infrastructure constraints continuing to impact Bellatrix’s
ability to crystalize value in a more timely fashion.
Prepared by GMP Securities L.P.
See important disclosures on the last two pages of this report
Equity Research
Operational highlights
•
A $450 million capital budget was approved for 2015 whereby Bellatrix will aim to
average 48,000 to 49,000 boe/d in the year, implying 26% y-o-y growth using guidance
mid-points.
•
Infrastructure will remain a priority for the company in the upcoming year as July 1,
2015 remains the target date to get phase 1 of the 110 mmcf/d plant at Alder Flats
online.
•
Near term, additional booster compression and completion of the Twin Rivers pipeline
are expected to increase gross processing capability by 30 – 40 mmcf/d, which could
bolster Bellatix’s net volumes by 3,000 – 4,000 boe/d.
•
In Q2 2015, an additional 60 mmcf/d of gross processing capacity is expected to come
online with the construction and tie-in of new pipelines, along with expansion of liquids
handling capability at a third party plant.
Figure 1. Actuals versus estimates
Forecast
Q3'14
Actual
Q3'14
% Difference
Q3'13
Year/Year
% Change
Production
Crude Oil and NGL's (bbl/d)
Natural Gas (mmcf/d)
boe/d
% Gas
12,964
150.2
37,995
66%
11,631
157.2
37,838
69%
(10%)
5%
(0%)
5%
5,993
94.0
21,852
72%
94%
67%
73%
(3%)
Wellhead Prices
Crude Oil and NGL's ($/bbl)
Natural Gas ($/mcf)
$98.71
$4.34
$90.39
$4.44
(8%)
2%
$102.71
$2.68
(12%)
66%
Financial
Gross Revenue ($/boe)
Royalties ($/boe)
$40.62
$7.63
$37.57
$7.00
(8%)
(8%)
$32.27
$4.04
16%
73%
Operating Costs ($/boe)
$8.03
$8.85
10%
$8.98
(1%)
Transport ($/boe)
$1.00
$1.25
25%
$0.82
53%
Bellatrix Exploration Ltd.
G&A ($/boe)
$1.75
$1.75
0%
$2.26
(23%)
Cash Flow ($/boe)
Cash Flow per Share (fd)
Debt / Cash Flow
Development Capex ($mm)
$21.05
$0.36
1.3x
$65.0
$17.08
$0.29
2.0x
$110.5
(19%)
(19%)
52%
70%
$14.67
$0.25
1.9x
$49.5
16%
17%
8%
123%
Weighted Avg Basic Shares (mm)
Net Debt ($mm)
191.1
$388.7
191.4
$477.3
0%
23%
108.3
$219.7
77%
117%
Source: Company reports, GMP
2
Equity Research
We have revised our forecasts down for Bellatrix as a result of greater spending on gas focused
production as well as lower realized oil prices. As a result we have 2015 debt to cash flow rising to
2.0 times from 1.4 times. It should be noted our 2015 capital spending numbers remain slightly
above guidance with our production forecasts on the low end of guidance.
Figure 2. Revised forecasts
2014E
2015E
Pre
Revised
% Change
Pre
Revised
% Change
Crude Oil&NGL's (bbl)
13,441
12,688
-6%
17,376
15,124
-13%
Natural Gas (mmcf/d)
150.3
154.0
2%
189.7
195.3
3%
boe/d
38,493
38,353
0%
48,997
47,670
-3%
% Gas
65%
67%
3%
65%
68%
6%
-8%
Production
Financial
Revenue ($/boe)
$33.59
$32.38
-4%
$33.59
$30.84
Operating Costs ($/boe)
($8.00)
($8.25)
3%
($8.00)
($8.00)
0%
Cash Flow ($/boe)
$21.83
$20.06
-8%
$21.59
$18.52
-14%
CFPS (FD)
$1.58
$1.45
-8%
$1.91
$1.59
-17%
D/CF
1.5x
1.8x
24%
1.4x
2.0x
48%
E&D Capex ($mm)
$514
$545
6%
$470
$470
0%
Net Debt ($mm)
$445
$505
14%
$529
$653
23%
W. Avg Basis Shares (mm)
191.1
191.5
0%
191.1
191.5
0%
Source: Company reports, GMP
Bellatrix trades at a discount to its peers, we believe this is a result of an operationally challenged
2014 as well as higher debt levels.
Figure 3. Valuation
2014E
P/NAV*
EV/DACF
%
times
P/CF
EV/boe/d
D/CF
Capex/CF
times
$/boe/d
times
times
2015E
BXE
61%
4.8x
Mid Inter. AVG
107%
6.7x
BXE
Mid Inter. AVG
4.5x
5.4x
3.1x
$37,223
1.8x
1.7x
5.2x
$79,976
1.5x
1.3x
2.9x
$33,046
2.0x
1.3x
4.2x
$64,316
1.5x
1.1x
*NAV is based on 2013YE reserves
Source: Company reports, FactSet, GMP
Our target price is a combination Risked NAV and forward EV/DACF multiple. Given what we
expect will be continued infrastructure challenges in Bellatrix’s core operating areas, we have
moved our Risked NAV weighting down to 30%, from equal weight. We have done this to account
for what we believe will be ongoing challenges in crystalizing value in the short term.
3
Equity Research
Figure 4. GMP Risked NAV breakdown
2013 YE Assigned Reserves
Reserves
(mmboe)
124.2
87.4
211.6
Proven
Probable
2P Reserves
Other Assets/Liabilities
Land Value (417,000 acres @ $400 per acre)
Net Debt
Option Proceeds & Other
Total
2013YE 2P Net Asset Value
Net
Unbooked Upside Potential
Locations
Rich Gas Ferrier Cardium (Hz)
Low GOR Pembina Cardium (Hz)
High GOR Cardium (Hz)
Cardium (JV)
Notikewin (Hz)
Notikewin (JV)
Rich Gas Ferrier Cardium (JV)
NGL Ferrier Cardium Oil (Hz)
NGL Harmattan Cardium Oil (Hz)
NGLHarmattan Mannville Gas(Hz)
Total
2P NAV + Risked Upside Value
Source: Company reports, GMP
15
70
125
32
50
25
20
25
90
45
497
4
Net Risked
Resource
(mmboe)
6.8
14.6
33.8
8.7
30.4
15.2
9.0
6.1
13.4
26.3
164.4
BT PV@10%
($mm)
$1,050.8
$494.8
$1,545.6
Value
($mm)
$167.0
($397.3)
$53.0
($177.3)
$1,368.3
$NAV/
Share
$5.77
$2.72
$8.49
$NAV/
Share
$0.91
($2.18)
$0.29
($0.98)
$7.51
BT PV@10%
($mm)
$51.3
$192.2
$385.9
$97.5
$145.6
$69.2
$73.0
$37.5
$192.0
$87.3
$1,331.4
$2,699.7
$NAV/
Share
$0.25
$0.95
$1.90
$0.48
$0.72
$0.34
$0.36
$0.18
$0.95
$0.43
$6.57
$14.08
Equity Research
Disclosures
The information contained in this report is drawn from sources believed to be reliable but the accuracy or completeness of the information is not
guaranteed, nor in providing it do GMP Securities L.P., GMP Securities Europe LLP or GMP Securities Australia Pty Limited (collectively referred to as “GMP”)
assume any responsibility or liability whatsoever. Information on which this report is based is available upon request. This report is not to be construed as a
solicitation of an offer to buy or sell any securities. GMP and/or affiliated companies or persons may as principal or agent, buy and sell securities mentioned
herein, including options, futures or other derivative instruments thereon. Griffiths McBurney Corp. (“GM Corp.”), an affiliate of GMP accepts responsibility
for the contents of this research subject to the foregoing. U.S. clients wishing to effect transactions in any security referred to herein should do so through
GM Corp. GMP Securities L.P. will provide upon request a statement of its financial condition and a list of the names of its Directors and senior officers.
Company-Specific Disclosures:
1 GMP has, within the previous 12 months, provided paid investment banking services or acted as underwriter to the issuer.
2 GMP is a market maker for the securities of the subject issuer.
3 GMP owns 1% or more of this issuer’s securities.
4 GMP Securities, LLC, an affiliate of GMP, discloses the following in relation to this issuer as required by the Financial Industry Regulatory Authority
(“FINRA”) Rule 2711: as applicable.
5 The analyst is related to an officer, director or advisory board member of the issuer, but that individual has no influence in the preparation of this report.
6 The analyst has visited the operations of this issuer. The issuer and/or GMP clients paid all or a portion of the travel expenses associated with the
analyst’s site visit to its operations.
7 The analyst who prepared this report has viewed the operations of this issuer.
8 The analyst who prepared this research report owns this issuer's securities.
9 RESERVED
10 RESERVED
Each research analyst and associate research analyst who authored this document and whose name appears herein certifies that:
(1) the recommendations and opinions expressed in the research report accurately reflect their personal views about any and all of the securities or issuers
discussed herein that are within their coverage universe; and (2) no part of their compensation was, is or will be, directly or indirectly, related to the
provision of specific recommendations or views expressed herein.
GMP Analysts are not registered and/or qualified as research analysts with the FINRA and/or the New York Stock Exchange and may not be associated
persons of GMP Securities, LLC and therefore may not be subject to FINRA Rule 2711 restrictions on communications with a subject company, public
appearances and trading securities held by a research analyst account as defined by FINRA but are subject to the applicable regulatory rules as mentioned in
the next paragraph.
All relevant disclosures required by regulatory rules (including The Investment Industry Regulatory Organization of Canada, Financial Conduct Authority
and Australian Securities & Investments Commission), GMP’s recommendation statistics and research dissemination policies can be obtained at
www.gmpsecurities.com or by calling the relevant GMP office’s Compliance Department.
GMP Analysts are compensated competitively based on several criteria. The Analyst compensation pool is comprised of several revenue sources, including
secondary trading commissions, new issue commissions, investment banking fees, and directed payments from institutional clients. GMP prohibits any
director, officer or employee of GMP from holding any office in publicly traded companies or any office in private companies in the financial services
industry.
The GMP research recommendation structure consists of the following ratings:
Buy: A Buy rating reflects 1) bullish conviction on the part of the analyst; and 2) typically a 15% or greater return to target.
Speculative Buy: A Speculative Buy rating reflects 1) bullish conviction on the part of the analyst accompanied by a substantially higher than normal risk,
including the possibility of a binary outcome; and 2) typically a 30% or greater return to target.
Hold: A Hold rating reflects 1) a lack of bullish or bearish conviction on the part of the analyst; and 2) typically a return of 0 to 20%.
Reduce: A Reduce rating reflects 1) bearish conviction on the part of the analyst; and 2) typically a 5% or lower return to target.
Tender: Clients are advised to tender their shares to a takeover bid or similar offer.
5
Equity Research
Country-Specific Disclaimers:
Australia: GMP Securities Australia Pty Limited (“GMP Australia”). ACN 149 263 543; Australian Financial Services License No: 403684. Level 9, 190 St.
Georges Tce, Perth, WA, Australia 6000 Tel + (618) 6141 6300 Fax + (618) 9226 1370.
Any advice contained in this document has been prepared without taking into account your objectives, financial situation or needs. Before acting on any
advice in this document, GMP Australia recommends that you consider whether the advice is appropriate for your circumstances. GMP Australia
recommends that you obtain and consider the relevant “Product Disclosure Statement” or other disclosure documents before making any decision about a
product including whether to acquire or to continue to hold it.
Canada: GMP Securities L.P. is a member of the Investment Industry Regulatory Organization of Canada and a participant of the TSX, TSX Venture and the
Montreal Exchange. It is registered with all the provincial self-regulatory authorities of Canada. 145 King Street West, Suite 300 Toronto, Ontario M5H 1J8
Tel: (416) 367-8600 Fax: (416) 943-6134.
United Kingdom: GMP Securities Europe LLP is authorised and regulated by the Financial Conduct Authority and is a member of the London Stock Exchange.
5 Stratton Street, London W1S 4GA Tel 0044 20 7647 2800 Fax 0044 20 7647 2801.
This information is issued for the benefit of persons who qualify as eligible counterparties or professional clients and should be made available only to such
persons and is exempt from the restriction on financial promotion in s21 of the Financial Services and Markets Act 2000 in reliance on provision in the
Financial Services and Markets Act 2000 (Financial Promotion) Order 2005 particularly Article 19(5) for Investment Professionals and Article 49(2) for
entities of prescribed net worth.
Other countries: circulation of this report may be restricted by laws and regulations in other countries and persons in receipt of this document must
satisfy any relevant legal requirements in that country.
© GMP. All rights reserved. Reproduction in whole or in part without permission is prohibited.
6


© Copyright 2026