
EARNINGS RELEASE 3Q14
EARNINGS RELEASE
3Q14
3Q14 EARNINGS RELEASE
PARANAPANEMA DISCLOSES ITS 3Q14 EARNINGS
PARANAPANEMA S.A. (“Paranapanema” or the “Company”) – BM&FBovespa – Novo Mercado: PMAM3, the largest nonintegrated Brazilian producer of refined copper, rods, wires, laminates, bars, tubes, connections and its alloys with a 94% share
of the copper production volume in Brazil, announces its third quarter of 2014 (3Q14) earnings. The consolidated quarterly financial
information is prepared in accordance with the International Financial Reporting Standard – IFRS and is presented in Brazilian
Reais., functional currency of the Company. The financial information presented in Reais was rounded to the nearest million,
unless otherwise stated, the last number therefore has been rounded. The calculations of certain figures found in the
corresponding tables may therefore differ slightly. The comparisons presented, unless otherwise stated, refer to the second
quarter of 2014 (2Q14). It is recommended that this report be read in conjunction with the Notes to the Financial Statements.
Quarter Highlights (vs 2Q14)
Significant increase in the Company’s key figures:
o Production Volume: +1.5%, +7.2% recovery on Primary Copper
o Sales Volume: +12.4%, primarily Primary Copper export driven
o Net Revenues: +13.6%, R$ 1,238 million, due to increased sales volume
o Gross Profit: +30.7%, benefited by structural reductions in Transformation Cost per ton
o Gross Margin: 8.5% with an 8.8% Adjusted EBITDA Margin, due to sales volumes and product mix
o Adjusted EBITDA: +50.5% or R$109 million due to operational improvement
o 3Q14 Net Income: R$131 million, reversing Net Losses of the first half of 2014
o Net Debt: R$257 million; 0.8 x Adjusted EBITDA of the last twelve months
Key Indicators
3Q14
Sales Volume ('000 t)
Domestic Market
Export Market
Toll
Net Revenues (R$ million)
Domestic Market
Export Market
Toll
COGS (R$ million)
Gross Profit (R$ million)
Gross Margin (%)
Operational Expenses (R$ million)
Operational Results (R$ million)
Net Financial Income (Loss) (R$ million)
Net Income (R$ million)
Net Margin (%)
Adjusted EBITDA (R$ million)
Adjusted EBITDA Margin (%)
2
71
35
22
14
1,238
695
508
35
1,133
105
8.5%
41
64
112
131
10.6%
109
8.8%
2Q14
63
37
14
12
1,090
797
260
33
1,009
80
7.4%
45
35
-133
-72
-6.6%
73
6.7%
% Var.
3Q14/2Q14
12.4%
-5.6%
55.8%
17.8%
13.6%
-12.8%
95.3%
7.3%
12.2%
30.7%
-9.2%
82.1%
N/A
N/A
50.5%
-
1Q14
64
39
17
8
1,093
758
312
24
1,018
75
6.9%
109
-33
16
-15
-1.3%
57
5.2%
3Q13
71
45
16
10
1,302
994
279
30
1,158
144
11.1%
56
88
-130
-35
-2.7%
136
10.5%
9M14
198
112
53
33
3,421
2,250
1,080
92
3,160
261
7.6%
195
66
-5
44
1.3%
239
7.0%
3Q14 EARNINGS RELEASE
Conference Calls
Portuguese
Date: November 4, 2014
Time: 11 am (Brasília) / 8 am (US-ET)
Dial in: +55 11 3193-1001 | +55 11 2820-4001
Password: Paranapanema
English
Date: November 4, 2014
Time: 12pm (noon - Brasília) / 9 am (US-ET)
Dial in: +55 11 3193-1001
+55 11 2820-4001 | +1 786 924-6977
Password: Paranapanema
Contact
Phone: + 55 (11) 2199-7566 / 7904
E-mail: [email protected]
Press Office
FSB – Alessandra Carvalho
Phone: +55 11 3165-9585
E-mail: [email protected]
[The remainder of this page has been intentionally left blank]
3
3Q14 EARNINGS RELEASE
Message from Management to Shareholders and Capital Market Agents
Dear Sirs,
Paranapanema Management presents the Company’s Management Report and the Consolidated Quarterly
Information for the quarter ended September 30, 2014 (3Q14), including comments on the Company’s performance.
Paranapanema 2018 Project
In the beginning of the second half of the year, we kicked-off Paranapanema 2018 Project (PMA 2018 or Project)
which sets a roadmap to increase earnings in a sustainable manner, and consequently increase the Company’s
value through short and medium-term structured actions.
PMA 2018 has been created given the observed opportunities to improve processes, people and operational margin
management.
One of PMA 2018 objectives is to redesign the Company business processes to improve earnings forecast and
capital employment levels. The implementation of a strong budget driven culture and objective criteria to manage
expenditures is of fundamental importance to maximize earnings potential. We believe that by implementing a culture
of excellence in management and processes, with strong focus on execution, we are strengthening the conditions to
sustain the value creation to our shareholders.
Management strategy is to maximize shareholders value through four key drivers (i) installed capacity utilization, (ii)
cost efficiency, (iii) commercial penetration, and (iv) asset productivity.
Capacity utilization at Paranapamena is highly correlated with smelter availability at Dias d’Ávila. In this context,
preventive maintenance is a top priority to keep operations up-and-running. Thus, we are implementing a daily
scheduled maintenance system to increase confidence on critical equipment. This model is based on best-in-class
industrial players. The Primary Copper production is recovering with higher volumes.
Cost efficiency will increase the Company’s competitiveness and profitability. Implementing new cost management
processes and reducing outsourcing will allow us to reach the expected results. We are shaping our organization to
be fast and lean, eliminating low productivity operations, merging structures, and reviewing existing contracts.
In order to increase commercial penetration, the Company is reorganizing its sales processes, focusing on clients,
value adding, and simplification of product lines.
Increasing asset productivity is a target to be reached by lowering Inventories and Fixed Assets amounts. We
continue our journey towards reducing Inventories levels. In 3Q14 there was a 16% volume reduction. Another
initiative is to enhance the risk-return analysis and prioritization of Capex projects according to expected yields
criteria.
The results of these four key drivers will be perceived in better operational results and lower need for operating
assets, thus increasing the Return on Invested Capital index, which has become the key decision making driver for
our Management.
To deliver all initiatives we rely on a newly formed group of professionals, comprised of a renewed Board of Directors
and Officers, and of a technically improved team of managers.
In July/14 we hired Galeazzi & Associados (G&A), a renowned consulting firm with relevant experience in the
initiatives that we are undertaking at Paranapanema. G&A will participate in our operations for 12 months, identifying
and helping our managers to deliver the gains foreseen in PMA 2018.
In October/14 the Executive Office and G&A presented to the Board of Directors its diagnosis and action plan, to
capture the identified gains. Another important step that is starting now is the “Zero-Base Budget” process, which will
help us to reduce spending and increase productivity of operational assets by implementing a stricter budgeting
4
3Q14 EARNINGS RELEASE
culture. On 2Q15 G&A will review its diagnosis and will leave Paranapanema at the beginning of 3Q15, when a new
culture of management excellence is to be implemented in the Company.
In order to allow our shareholders and the market to follow the evolution of PMA 2018, we present the following table
with the main KPIs we will concentrate our efforts on improving:
Unit
2013
2014(E)
Baseline
2016
Review
2018
Target
kt
257
236
280
290
Transformation Cost
R$/ton
sold
2,047
2,029
1,840
1,748
Recurring SG&A
R$/ton
sold
615
554
515
489
Maintenance Capex
R$MM
Index
Cathode production
% of depreciation
Operating assets
%
Days
N/A
124
103
116
120
~90%
~100%
~100%
155
140
120
Note1: the ammounts presented in R$ will be adjusted by inflation index of the period
Note 2: (E) Estimate
[The remainder of this page has been intentionally left blank]
5
3Q14 EARNINGS RELEASE
Capex trend, maintenance plan and return thresholds for future projects to benefit value
creation process
Over the past four years, Paranapanema entered an intense Capex cycle, investing in the expansion, of (i) additional
smelting capacity from 220kton to 280kton per year, (ii) a new Tubes plant with annual capacity of 30 kton, and (iii)
wiring capacity at Dias d’Ávila from 18 kton to approximately 52 kton a year in 2011.
Note: (E) - Estimate
The main CapEx project at this moment is related to the Sulfuric Acid plant at Dias d’Ávila (BA), which has reached
the end of its operational life. This new sulfuric acid plant are being built at the same place as the existing one and is
part of our recently revised-down CapEx plan to 2014, from R$194 million to R$103million. We expect to commission
the plant in the 1H15.
Currently our installed capacity availability presents opportunity to grow our volumes without investments in new
capacity. Our focus is to maximize productivity of the Company’s existing assets by increasing production volumes
using the same level of resources, and we do not anticipate the need of major additional capacity for the coming
years. Our annual CapEx plan should be equivalent to the annual depreciation rate, currently around R$120 million,
while this capacity availability remain comfortable.
New investments are decided upon a strict decision process based on criteria such as strategic alignment and
prioritization, return on investment, Internal Rate of Return (IRR), Net present value versus weighted average cost of
capital, funding structure, and payback.
With higher capacity utilization, aligned with adequate CapEx maintenance to existing assets and capital discipline
for future projects, Paranapanema starts a new era of positive cash flow generation, while increasing its competitive
advantages. To achieve an operational level of excellence and to maximize the Company’s value is an important
step to explore complementary businesses in the future, bringing synergies and additional gains to our shareholders.
Business Environment – Copper Market
Related to the copper market, we observed global cathode demand sustained by moderate growth in Chinese market,
with attractive prices and limited supply by other smelters.
Macroeconomic data influenced the Copper price, maintaining the decline trajectory on 3Q14 (-3.1% vs. 2Q14).
6
3Q14 EARNINGS RELEASE
According with Wood Mackenzie, consumers remain tentative on the full year outlook due to on-going geopolitical
tensions, with demand expected to decelerate to 4.6% in second half of 2014, after posting strong 7.6% growth in
H1. However, moderate economic growth, more affordable copper prices, and the continued limited availability of
high grade scrap have been major factors supporting cathode demand in 2014.
At the end of 3Q14, spot TCRCs remained significantly higher than current benchmark terms for 2014 of $92/t &
9.2c/lb. LME week, held at the second half of October, marked the beginning of negotiations for next year TCRCs.
Traditionally, the spot buying demand amongst Chinese smelters is significantly lower in September. An average
TCRCs of $115/t & 11.5c/lb is believed to be the spot buying terms from Chinese smelters for clean concentrates
during the month. The mine to trader market also reported TCRCs of $110/t & 11c/lb for clean concentrate during
September.
Brazil
The macroeconomic environment in Brazil remained challenging during 3Q14. We prepared the Company to face
these market conditions in the past months by assuming at the end of 2Q14, a cautious posture when dealing with
business related to the Brazilian economy. The way we found to grow was to export the surplus of production for
which there was no demand in Brazil.
7
3Q14 EARNINGS RELEASE
Industrial Survey data released by CNI – Confederação Nacional da Indústria (National Industry Confederation) on
October 23, 2014, indicate a slight improvement in the industrial sector in September compared to previous months,
but still not enough to improve expectations for year-end.
The Brazilian Construction Sector, an important segment to Paranapanema, presented in August its worst results
since November 2005, according with the 60th Sondagem Nacional da Indústria da Construção Civil (National Civil
Construction Industry Research) published by the SindusCon-SP and Fundação Getulio Vargas on October 7, 2014.
It is a reflex of the negative perception in the sector for the coming months.
Data from the Economic Survey of ABINEE - Associação Brasileira da Indústria Elétrica e Eletrônica (Brazilian
Association of Electrical and Electronics Industry) published on October 21, 2014 show that in September the
Electronics sector posted better results than in the last three months, even though the industry has not yet retaken
significant growth.
Internal Environment
Measures taken to normalize the Company's Primary Copper production show the first results in 3Q14, when we
produced 60 thousand tons (annualized production of 240 thousand tons out of the total capacity of 280 thousand
tons), 7.2% growth when compared to last quarter. Production volumes also shows recovery to historical levels and
evolution of the utilization of installed capacity of the Dias d’Ávila plant. This recovery is due to the adoption of a new
preventive maintenance model, from which we are already benefiting from preventing unscheduled maintenance
stoppages and greater smelter availability, reflecting in greater installed capacity usage during 3Q14. The constant
evolution of industrial uptime at the Dias d’Ávila Primary Copper Unit is focus of Paranapanema’s Management, but
we cannot rule out the event of other unscheduled maintenance stoppages until the preventive maintenance program
is fully implement in all critical equipment. Management is fully committed in delivering this process by 1H15.
The Copper Products production reached 62 thousand tons in 3Q14, a 3.5% reduction to 2Q14, due to the weak
business environment in Brazil, main destination of the sales of Laminates and Wires, the main affected products.
The greater production of Primary Copper contributed to a total Sales Volume of 71 thousand tons, a 12.4% growth
over 2Q14.
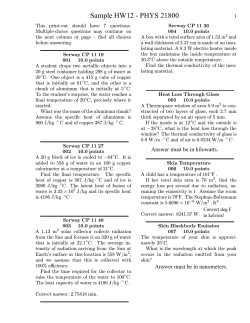
We continue to make progress on Transformation Cost per ton sold, which index amounted 9.6% less when
compared to 2Q14. To achieve this performance we are increasing the Management for us on two areas: (i) capacity
usage and (ii) productivity, at the same time as creating a culture of greater operational efficiency and leaner
organization.
Transformation Cost (R$/ton)
1,999
-9.6%
1,807
2Q14
3Q14
Additionally, the Selling, General and Administrative Expenses (SG&A) were 9% lower over 2Q14. It’s important to
highlight that over the quarter there were non-recurring (one-off) events, specially labor contingency provisions,
amounting to R$16 million. When comparing SG&A excluding non-recurring items, the improvement is even better,
a reduction of 31.3% from R$36 million on 2Q14 to R$25 million on 3Q14.
8
3Q14 EARNINGS RELEASE
Throughout the year there was an important change regarding non-recurring items. On the first 9 months of 2014
non-recurring expenses negatively impacted our EBITDA on R$86 million, mainly related to the Partial Closure of
Capuava and Poland Project assets write-off. During 3Q14 significant amounts related to lawsuits were recovered,
positively impacting both Other non-recurring Revenues and Expenses (R$13 million) and Financial Income and
Expenses (R$ 54 million).
Another area of attention has been – and will continue to be – the management of invested capital, especially
Inventories and Recoverable Taxes. For the second consecutive quarter, there was a reduction on both our
Inventories and Recoverable Taxes level. Since the beginning of our Stock Short program on 4Q13, Inventories were
reduced by 28% or R$533 million (September/14 vs. September/13). Recoverable Taxes reduction reaching R$148
million (September/14 vs. March/14). We still see room for additional improvement in our operations, which will benefit
further reduction on Inventories cycle and lower Recoverable Taxes balance.
The Company Management remains focused on promoting initiatives to expand the usage of installed capacity, sales
volume and premiums, without losing sight of the goals of reducing spending and invested capital, thus aiming to
improve the return on invested capital.
Final Considerations
The Independent Auditors KPMG Auditores Independentes (KPMG), who examines the financial statements since
January 2012, only provides services to the Company related to the audit of the financial statements.
The Board of Directors declare to approve the statement of independence of the independent auditors.
Comments on the consolidated
www.paranapanema.com.br/EN/ri.
performance
of
the
Company
are
available
at
The Company is subject to arbitration on the Market Arbitration Chamber, pursuant to the Bylaws.
Dias d’Ávila, October 31, 2014.
The Management.
[The remainder of this page has been intentionally left blank]
9
the
website
3Q14 EARNINGS RELEASE
COMMENTS TO THE CONSOLIDATED FINANCIAL STATEMENTS
Comments to the Consolidated Statement of Income
Production Volume
Production Volume ('000 t)1
Primary Copper
Copper Products
Rods/Wires/other Copper Products
Bars/Profiles/Laminates/Tubes and Fittings
By-products
Production consumed by Copper Products
Total Copper
3Q14
60
62
46
15
259
44
121
2Q14
56
64
49
15
235
41
120
% Var.
3Q14/2Q14
7.2%
-3.5%
-5.5%
2.9%
10.1%
8.2%
1.5%
1Q14
60
58
45
14
248
38
118
3Q13
9M14
61
71
55
16
273
42
132
176
183
140
44
742
123
359
1
2Q14 and 3Q13 data w ere adjusted to better reflect the concept of ocupation of capacity production (w ithouth intercompay elimination) and to include all Byproducts (Sulfuric Acid, Anodic Slime, Slag, Oleum and Revert)
The Company produced 60 thousand tons of Cathode in the 3Q14; a 7.2% increase since the 2Q14. Production
volume recovery is due to the adoption of a new preventive maintenance model, focused on minimizing unscheduled
maintenance stoppage effects at the Dias d’Ávila smelter.
44 thousand tons of production were used to supply the Company’s Copper Products lines in the third quarter, with
a 3.5% (2 thousand ton) decrease in production, primarily in Laminates and Wires.
Sales Volume
Sales Volume ('000 t)1 2
Primary Copper
Domestic Market
Export Market
By-products
Copper Products
Rods/Wires/other Copper Products
Domestic Market
Export Market
Toll
Bars/Profiles/Laminates/Tubes and Fittings
Domestic Market
Export Market
Toll
Total Copper
3Q14
22
9
13
283
48
29
19
6
5
19
7
3
9
71
2Q14
16
10
6
258
47
30
21
6
3
17
6
2
9
63
% Var.
3Q14/2Q14
43.6%
-9.7%
134.2%
9.6%
2.1%
-3.5%
-11.1%
-10.1%
70.4%
12.1%
20.3%
35.4%
1.3%
12.4%
1Q14
19
11
8
258
45
30
22
6
2
15
7
2
6
64
3Q13
20
10
10
280
51
32
25
5
2
19
9
1
9
71
9M14
57
30
28
798
140
30
62
18
9
51
20
7
24
198
¹ Sales volume net of the intraoperations eliminations
2
Sales Volume of By-products on 2Q14 and 3Q13 w ere adjusted to include all By-products (Sulfuric Acid, Anodic Slime, Slag, Oleum and Revert)
Primary Copper sales volume increased by 43.6%, to 22 thousand tons, due to increased industrial availability, which
allowed greater production, as well as the execution of the finished products inventory reduction plan. Exports had
an important role in implementing this strategy, since the Brazilian market remains at a low level of activity.
Copper Product sales increased 2.5% to 48 thousand tons. This performance is primarily due to increased sales of
Tubes and growth in Toll of Rods, which offset the loss of Wires sales due to market contraction, particularly in the
civil construction, automotive and energy distribution segments.
By-products posted a 9.6% increase in sales volume, reaching 283 thousand tons, due to the sales of Sulfuric Acid
(+0.3%), Anodic Slime (+24.9%), Revert (a By-product rich in copper and of which there were no sales on 2Q14) and
Slag (+19.1%).
10
3Q14 EARNINGS RELEASE
Sales Volume per Market
The Brazilian Market (DM) absorbed 69.3% of the sales in the quarter, 49 thousand tons (including Toll) and 30.7%
or 22 thousand tons of the Company’s sales were to the Export Market (EM). Increased EM sales are attributed to
(i) the Company’s strategy to export the excess of Cathodes not absorbed at DM, (ii) sales of Anodic Slime, which is
always exported and was sold well above historical levels in the 3Q14 and (iii) export of excess inventories of Revert.
Copper and Exchange Rate Quotes
The Company’s prices are based on the Copper settlement price on the London Metal Exchange (LME) in US-Dollars
(USD).
The LME price at the end of 3Q14 was lower than the 2Q14 closing price, whilst the average LME price in 3Q14 was
3.0% greater than last quarter, reaching USD6,992/t. Over the quarter, the average USD exchange rate was BRL
2.2654/USD; 1.6% above the 2Q14 average of BRL 2.2296/t.
11
3Q14 EARNINGS RELEASE
Net Revenues
in R$ million
Net Revenues
Primary Copper
Domestic Market
Export Market
Toll
Copper Products
Rods/Wires/other Copper Products
Domestic Market
Export Market
Toll
Bars/Profiles/Laminates/Tubes and Fittings
Domestic Market
Export Market
Toll
By-products
3Q14
1,238
378
162
216
0
688
454
338
108
7
234
162
44
28
172
2Q14
1,090
252
163
89
0
770
592
489
99
4
178
117
33
29
67
% Var.
3Q14/2Q14
13.6%
49.7%
-0.8%
142.3%
-10.7%
-23.4%
-30.9%
9.5%
70.8%
31.6%
38.7%
35.1%
-1.8%
157.0%
1Q14
1,093
311
178
134
0
724
531
416
112
3
193
139
33
21
58
3Q13
1,302
345
177
168
0
791
547
458
86
2
244
192
25
27
167
9M14
3,421
941
503
438
0
2,183
1,577
1,242
320
14
606
418
111
77
297
3Q14 Net Revenues totaled R$1,238 million; a 13.6% increase over 2Q14, due an increase in Exports of Primary
Copper and By-products.
Primary Copper Revenues increased 49.7%, reaching R$378 million in the quarter, primarily due to increased export
volumes. Domestic Market represented 42.9% of the Primary Copper Revenues, below historical levels, reflecting
the deterioration of Brazilian demand due to a slowed economy. 57.1% of Primary Copper Revenues came from the
Export Market, above historical levels, due to excess production available for sale and to Brazilian economic
momentum. While not strategic, 3Q14 exports demonstrate the Company’s ability to use the EM to absorb surplus
Brazilian demand.
Copper Products Revenues reached R$688 million, posting a 10.7% retraction over 2Q14. The 31.6% (R$56 million)
increase in Bars, Profiles, Wires, Laminates, Tubes and Fittings revenues was not enough to offset the 23.4% (R$139
million) decrease in Rods and Wires Revenues. Export Revenues increased 15.1% (+R$20 million), R$9 million
arising from greater sales of Rods, Wires and other Copper Products and R$11 million from Bars, Profiles, Wires,
Laminates, Tubes and Fittings, partially offsetting the 17.5%, or R$106 million, Brazilian market retraction . Toll
Revenues, which are primarily from the Domestic Market, posted a 6.1% or R$4 million increase in the quarter.
By-products Revenues posted a 157.0% quarterly increase, totaling R$172 million, due to increased sales of Sulfuric
Acid (R$4 million, +16.4%) and Slag (R$0.2 million, +12.7%) in the Domestic Market, and greater exports of Anodic
Slime (R$ 23 million, +58.9%) and Revert (R$21 million, there were no sales of Revert in 2Q14).
12
3Q14 EARNINGS RELEASE
Cost of Goods Sold (COGS)
Cost of Goods Sold (COGS), comprised of Metal Cost, Transformation Cost and Costs allocated to Inventories totaled
R$1,133 million; a 12.2% quarterly increase, primarily due to increased sales volume. The COGS per ton totaled
R$16,022, in line when compared to 2Q14.
Metal Cost in Reais increased 13.1%, totaling R$992 million, and was impacted by increase of sales volumes
(+12.4%). The Metal Cost per ton was R$14,031; a 0.6% increase when compared to 2Q14.
in R$ million
COGS (R$ million)
Metal Cost
Transformation Cost
Costs allocated to Inventories
COGS/t
Metal Cost/t
Transformation Cost/t
3Q14
1,133
992
128
13
16.022
14.031
1.807
2Q14
1,009
877
126
6
16.045
13.944
1.999
% Var.
3Q14/2Q14
12.2%
13.1%
1.6%
105.1%
-0.1%
0.6%
-9.6%
1Q14
1,018
890
133
-5
15.917
13.918
2.072
3Q13
1,158
1,023
134
1
16.224
14.332
1.877
9M14
3,160
2,759
386
15
15.995
13.967
1.954
Transformation Cost
Gross Profit and Gross Margin
The Company’s Gross Profit increased 30.7% to R$105 million. Gross Margin also increased to 8.5%, versus 7.4%
in 2Q14.
13
3Q14 EARNINGS RELEASE
The accumulated Gross Profit in the 9M14 includes a reclassification of results that in 1Q14 and 2Q14 were classified
in the Net Financial Income (Loss) as “Metal Hedge” of +R$23 million and +R$25 million, respectively. This
reclassification relates to the improvement of Hedge Accounting adoption by the Company.
Operational Expenses
in R$ million
3Q14
Operational Expenses
Sales Expenses
General and Administrative Expenses
Other Operational Revenues and Expenses
2Q14
41
7
12
22
45
7
27
12
% Var.
3Q14/2Q14
-9.2%
7.6%
-55.1%
85.1%
1Q14
3Q13
109
8
29
72
9M14
56
8
27
22
195
22
68
106
Operational Expenses totaled R$41 million in 3Q14, 9.2% decrease when compared to 2Q14.
Sales Expenses amounted to R$7 million; a 7.6% increase due to increased third-party services related to dispatch
and personnel expenses.
General and Administrative Expenses decreased 55.1% to R$12 million. The primary reason for this decrease is the
reclassification of R$12 million in expenses from General and Administrative to “Other Operational Revenues and
Expenses”. The reclassified expenses are of non-recurring nature. Without this adjustment, General and
Administrative Expenses would have amounted to R$24 million, nevertheless a 9.6% reduction over 2Q14. This
variation is primarily due to a reduction in third-party services, travel and personnel.
Other Operational Expenses totaled R$22 million; a 85.1% increase from that of 2Q14 primarily due to the
reclassification of General and Administrative expenses of R$12 million. Isolating this effect, the variation would have
been a R$2 million reduction. The following table provides details on 3Q14 non-recurring items:
in R$ million
3Q14
Other Operational Revenues and Expenses
Partial Closure of Capuava
Poland Project assets write-off*
Provisions, gains (lossess) in lawsuits*
Other non-recurring
Total non-recurring
Other recurring
*No cash impact on the quarter
2Q14
22
3
3
11
0
16
6
12
14
0
-7
2
9
3
% Var.
3Q14/2Q14
85.1%
-80.8%
300.0%
-245.8%
-110.6%
84.1%
88.0%
1Q14
3Q13
72
44
24
-7
0
61
11
9M14
22
0
0
21
1
20
3
106
60
26
-3
2
86
20
3Q14 Operational Expenses excluding non-recurring events dropped 31.1% when compared to 2Q14. When
considering the accumulated on the first nine months of the year (9M14) Operational Expenses excluding nonrecurring events posted a 12.1% reduction when compared to the same period last year.
Net Financial Income (Loss)
in R$ million
Financial Income
Financial Expense
Foreign Exchange Variation
Other Financial Income and Expenses
Subtotal (i)
Metal Hedge
Cash Flow Hedge (income and expenses)
Total Return Swap
Subtotal (ii)
Net Financial Income (Loss)
14
3Q14
33
-38
47
43
85
34
4
-12
25
112
2Q14
31
-38
-10
0
-17
-70
-35
-11
-117
-133
% Var.
3Q14/2Q14
4.4%
-1.3%
-586.6%
82581.7%
-608.9%
-148.6%
-110.2%
11.7%
-121.8%
-184.1%
1Q14
3Q13
27
-42
-11
30
4
23
9
-20
12
16
26
-37
-3
-6
-19
-74
-39
3
-110
-130
9M14
90
-118
27
73
72
-13
-22
-43
-79
-5
3Q14 EARNINGS RELEASE
Financial Income, Financial Expenses, Foreign Exchange Variation and Other Financial Income and
Expenses
Financial income increased 4.4% in the quarter due to interest revenue over a larger cash position within this period.
Financial Expenses remained stable in the period, in line with gross debt.
Foreign Exchange Variation from accounts payable, accounts receivable and financing lines was R$47 million
positive in 3Q14, compared to R$10 million negative in 2Q14, mainly due to liquidation of debt contracts in foreign
currency.
Other Financial Income and Expenses totaled R$43 million mainly from the accrual of interest and inflation updates
over won lawsuits and bad debts recoveries by the Company within the quarter.
Metal Hedge
Metal Hedge results was R$34 million positive in 3Q14, from the mark–to-market difference between the average
future price (based on the market curve) and the month average spot prices of metals.. Management highlights that
these results are the effect of marking to market of derivatives used on Metal Hedge and which economic realization
might occur in the future.
Exchange Rate Hedge
Paranapanema uses USD Non Deliverable Forwards (NDFs) to adjust its exposure to the USD in line with the Risk
Management Policy. NDFs settled during 3Q14 generated a Hedge revenue of R$4 million.
The Other Comprehensive Income account presented a negative variation of R$340 million in 3Q14, from the
appreciation of the USD against the BRL, especially in September 2014. At the end of the quarter, the OCI balance
in Net worth was negative R$216 million, a result of the marking to market the Exchange Rate Hedge positions.
Total Return Swap
Due to the variation of PMAM3 share price and CDI over 3Q14, the result ofmarking to market the Total Return Swap
contracted in November 2012 was negative R$12 million.
EBITDA and Adjusted EBITDA Reconciliation
in R$ million
Net Income
(+) Taxes
(+) Net Financial Income (Loss)
EBIT
(+)Depreciation and Amortization
EBITDA
(+)Other non-recurring Operational Revenues and Expenses
Partial Closure of Capuava
Poland Project assets write-off*
Provisions, gains (lossess) in lawsuits*
Other non-recurring
Adjusted EBITDA
Adjusted EBITDA Margin
*No cash impact on the quarter
3Q14
131
-45
112
64
29
93
16
3
3
11
0
109
8.8%
2Q14
-72
26
-133
35
29
64
9
14
0
-7
2
73
6.7%
% Var.
3Q14/2Q14
-281.5%
-274.6%
-184.1%
82.2%
1.6%
46.0%
84.1%
-80.8%
300.0%
-245.8%
-110.6%
50.5%
-
1Q14
-15
3
16
-33
29
-4
61
44
24
-7
0
57
5.2%
3Q13
-35
7
-130
88
28
116
20
0
0
21
1
136
10.5%
9M14
44
-16
66
87
153
86
60
26
-3
2
239
7.0%
Paranapanema’s EBITDA for the 3Q14 was adjusted to isolate effects of non-recurring expenses and revenues
occurred, notably (i) wins and losses of lawsuits (R$11 million), (ii) write-off of assets from Projeto Polônia (Poland
Project R$3 million) and (iii) expenses related to the partial shutdown of Capuava plant (R$3 million). During 3Q14
15
3Q14 EARNINGS RELEASE
significant amounts related to lawsuits were recovered, positively impacting both Other non-recurring Revenues and
Expenses (R$13 million) and Financial Income and Expenses (R$ 54 million).
Adjusted EBITDA therefore increased 50.5%, totaling R$109 million. Adjusted EBITDA Margin increased by 2.1
percentage points compared to 2Q14, reaching 8.8%.
Net Income
Income Tax & Net Result
in R$ million
Earnings Before Taxes
Taxes
Net Income (Loss)
Net Margin (%)
3Q14
176
-45
131
10.6%
2Q14
-98
26
-72
-6.6%
% Var.
3Q14/2Q14
-
1Q14
-18
3
-15
-1.3%
3Q13
-42
7
-35
-2.7%
9M14
61
-16
44
1.3%
Paranapanema reported Net Income of R$130 million in 3Q14 compared to a Net Loss of R$72 million in 2Q14.The
accumulated Net Income in 2014 reached R$43 million, thus reverting the Net Losses accumulated up to 2Q14. Net
Margin was 10.5% compared to -6.6% in 2Q14.
[The remainder of this page has been intentionally left blank]
16
3Q14 EARNINGS RELEASE
Comments to the main accounts of the Consolidated Statement of Financial Position
Cash and Financial Investments
Paranapanema ended 3Q14 with high liquidity reflected by its Cash and Financial Investments position of R$988
million. This amount represents R$74 million in Cash and Cash Equivalents, and R$915 million in Financial
Investments split between 92% on the short term and 8% on the long term. In 3Q14 there was R$329 million increase
in our Cash balance, driven by a reduction in Inventories level (in R$109 million), Recoverable Taxes monetization
(R$13 million), and increasing local Trade Payables.
Working Capital
Accounts Receivable
In 3Q14 the Accounts Receivable balance totaled R$394 million; R$120 million greater than 2Q14 due to increased
export volume.
Inventories
In 3Q14 Inventories totaled R$1,386 million, 7.3% or R$109 million lower than 2Q14. The Physical inventory at the
end of the quarter totaled 96 ktons of raw materials, products in process and finished products, a 15 kton reduction.
We are working to improve further the inventory reduction process. We estimate additional opportunities to reduce
inventory volumes by 10% of the current balance.
Recoverable Taxes
In 3Q14 the Recoverable Taxes totaled R$349 million; a R$13 million reduction compared to 2Q14. The monetization
of balances of Recoverable Taxes is one of Management’s goals in order to increase cash generation and reduce
the Company’s capital invested in assets.
Trade Payables
Trade Payables totaled R$ 1,744 million; a R$283 million increase over 2Q14, due to improved terms offered by local
and international suppliers.
17
3Q14 EARNINGS RELEASE
Fixed Assets + CapEx
Fixed Assets was flat at R$1,341 million in 3Q14. Depreciation totaled R$29 million in the quarter, whilst the additions
to fixed assets amounted to R$21 million and were allocated especially on projects related to maintenance, increased
productivity and technological upgrade.
As part of the PMA-2018 Project, the Company's management reviewed the budget need for capital investment
announced for 2014 to R$103 million, a 48.4% reduction over the R$194 million originally planned.
Debt and Debt Structure
in R$ million
Loans and Financing
Short Term
Long Term
(-)Cash and Cash Equivalent
Cash and Cash Equivalent
Financial Investments
Net Debt
Adjusted EBITDA (LTM)
Net Debt/Adjusted EBITDA
3Q14
1,246
679
567
988
177
811
257
318
0.8
2Q14
1,165
547
618
659
64
596
506
345
1.5
% Var.
3Q14/2Q14
6.9%
23.9%
-8.2%
49.9%
178.4%
36.2%
-49.2%
-7.8%
-
1Q14
1,039
470
569
520
36
485
519
326
1.6
3Q13
887
514
373
390
9
381
497
182
2.7
9M14
1,246
679
567
988
177
811
257
318
0.8
At the end of the quarter, the Consolidated Financial debt totaled R$1,161 million, an increase of R$80 million or
6.9% compared to 2Q14. Net Debt totaled R$257 million, a decrease of R$249 million or 49.2% compared to 2Q14.
The Net Debt / Adjusted EBITDA ratio used to monitor the Company covenants (at 3.5x) was 0.8x, demonstrating
Adjusted EBITDA and cash position improvement.
Capital Structure
[The remainder of this page has been intentionally left blank]
18
3Q14 EARNINGS RELEASE
Appendix I – Statement of Income (R$ million)
Net Revenues (R$ MM)
Domestic Market
Export Market
Toll
COGS (R$ MM)
Gross Profit (R$ MM)
Gross Margin (%)
Operational Expenses (R$ MM)
Operating Income (R$ MM)
Financial Income (loss) (R$ MM)
Net Income (loss) (R$ MM)
Net Margin (%)
Ajusted EBITDA (R$ MM)
Adjusted EBITDA Margin (%)
3Q14
1,238
695
508
35
1,133
105
8.5%
-41
64
112
131
10.6%
109
8.8%
2Q14
1,090
797
260
33
1,009
80
7.4%
-45
35
-133
-72
-6.6%
73
6.7%
1Q14
1,093
758
312
24
1,018
75
6.9%
-109
-33
16
-15
-1.3%
57
5.2%
3Q13
1,302
994
279
30
1,158
144
11.1%
-56
88
-130
-35
-2.7%
136
10.5%
[The remainder of this page has been intentionally left blank]
19
9M14
3,421
2,250
1,080
92
3,160
261
7.6%
-195
66
-5
44
1.3%
239
7.0%
9M13
3,865
2,435
1,340
91
3,569
295
7.6%
-147
141
-149
12
0.3%
253
6.6%
3Q14 EARNINGS RELEASE
Appendix II – Statement of Financial Position (R$ million)
Assets (R$ MM)
Current assets
Cash and cash equivalents
Financial Investiments
Accounts receivable
Inventory
Recoverable taxes
Prepaid expenses
Others Current assets
Non-current assets
Long-term Financial Investments
Accounts receivable
Deferred taxes
Other non-current Assets
Investiments
Fixed Assest
Intangible Assets
Total Assets
3Q14
2,938
177
742
392
1,386
171
6
64
1,817
70
177
2
94
133
11
1,326
5
4,755
2Q14
2,651
64
528
273
1,495
183
10
99
1,816
68
179
2
140
76
11
1,336
5
4,467
1Q14
2,671
36
419
333
1,522
217
12
133
1,797
66
166
2
114
76
11
1,358
5
4,468
3Q13
2,981
9
318
388
1,920
245
5
96
1,734
63
43
3
128
78
11
1,405
5
4,715
Liabilities (R$ MM)
Current liabilities
3Q14
2,711
2Q14
2,182
1Q14
2,219
3Q13
2,723
Social and labor obligations
43
36
42
56
1,744
1,461
1,576
1,892
15
22
25
27
Loans and financing
679
547
470
514
Other liabilities
230
115
106
234
Non-current liabilities
755
787
750
544
Loans and financing
567
618
569
373
4
4
7
8
Trade Payables
Tax liabilities
Other liabilities
Provisions
184
165
174
163
Equity
1,289
1,498
1,499
1,448
Realized capital
1,383
1,383
1,383
1,383
Capital reserves
26
27
27
20
251
254
257
-
14
14
14
14
Retained Earnings/Losses
-169
-303
-234
-215
Other Comprehensive Income
-216
123
52
246
4,755
4,467
4,468
4,715
Revaluation reserve
Profit reserves
Total Liabilities
[The remainder of this page has been intentionally left blank]
20
3Q14 EARNINGS RELEASE
Appendix III – Statement of Cash Flow (R$ million)
Net cash from operating activities
Income (loss) before taxes
Residual value of written-off fixed assets
Depreciation, amortization and depletion
Provisions
Estimated loss
Long-term interest rate
Adjustment to present value - Trade accounts receivable and suppliers
Other Comprehensive Income
Changes in assets and liabilities
Trade accounts receivable
Inventories
Recoverable taxes and contributions
Prepaid expenses
Deposits for judicial claims
Derivative financial instruments Assets
Assets for sale
Other current and non-current assets
Trade Payables
Current income and social contribution taxes
Taxes and contributions payable
Additions and write-offs for lawsuits
Salaries and social security charges
Other Comprehensive Income
Derivative financial instruments Liabilities
Other liabilities
Net cash from investment activities
Financial Investiments
Additions in Property, plant and equipment, and Intangible assets
Net cash from financing activities
Additions (payments) of loans and financing lines
Dividends
Increase (decrease) in cash and cash equivalents
Opening balance of cash and cash equivalents
Closing balance of cash and cash equivalents
3Q14
532
176
2
29
32
2
-22
1
1
311
-99
106
4
4
0
-42
-7
-61
295
-5
0
-4
7
-3
24
93
-263
-242
-20
-156
-156
0
114
58
172
[The remainder of this page has been intentionally left blank]
21
2Q14
-16
-99
24
29
2
-2
9
-1
-1
22
75
32
23
2
0
95
0
8
-76
0
-3
-7
-6
-133
35
-22
-213
-178
-35
257
257
0
28
31
58
1Q14
156
-18
0
33
2
-1
3
136
-17
268
-147
-38
-8
2
-75
0
-7
7
-2
2
-7
-8
-24
21
-96
-109
13
-87
-87
0
-44
80
36
3Q13
-107
-43
1
28
22
-2
-1
0
0
-113
117
-836
-60
4
0
82
-1
52
478
0
-11
-4
8
22
65
-31
31
51
-20
29
29
0
-48
83
35
3Q14 EARNINGS RELEASE
About Paranapanema
Company Profile and Business
Paranapanema is one of the most important world-class Brazilian companies in non-ferrous metals, smelting and
refining primary copper and copper products and its alloys. The Company’s activities are divided into four industrial
units, located in Dias D'Ávila (BA), Utinga and Capuava (Santo André - SP) and Serra (ES). Paranapanema is
currently the largest Brazilian copper producer, with a market share of over 50% of the Brazilian Primary Copper
market It is also Brazil’s largest copper rod supplier with growing presence in the pipe and fittings markets.
Outstanding Shares
Outstanding shares: 319,152,437
Treasury shares: 24,505
Total shares issued: 319,176,942
Main Shareholders – as of September 30, 2014
[The remainder of this page has been intentionally left blank]
22
3Q14 EARNINGS RELEASE
Concepts and Definition
Raw Material
Copper Concentrate is primarily purchased on the international market, with Chile as the main supplier. of the Copper
Concentrate purchase price is determined by international prices of metals contained and respective yields (copper,
gold, silver, nickel, zinc, lead and other precious metals can be found in Copper Concentrate), subtracted from the
TC/RC, or Treatment Charge (TC)/Refining Charge (RC). The TC/RC is the charge paid to the transformer for the
mineral copper processing and refining into metal copper and is negotiated between suppliers and smelters, such as
Paranapanema. There may also be adjustments to Copper Concentrate price based on precious metals content as
well as those specific characteristics of Copper Concentrate offered, which ranges from mine to mine.
Copper Scrap consists of recycled copper bought both in the local and international markets used either in the raw
material mix to produce Cathode and other alloys for copper products. In 2013 the raw materials mix was 75% Copper
Concentrate and 25% Copper Scrap.
Production
Paranapanema produces Primary Copper, Copper Products and By-products from Copper Concentrate and Copper
Scrap. The Company also conducts operation of Transformation (Toll) of copper scrap received from customers into
Copper Products.
Primary Copper, also known as Copper Cathode, is the copper commodity in its metal form. Production process
consists in converting Copper Concentrate into metal Copper.
Copper Products are tubes, fittings, rods, wires, bars and others, whose main raw material are Cathodes and copper
alloys and copper alloys with other nonferrous metals such as tin, lead and zinc. In addition to the cost of copper ,
Primary Copper requires other costs to be transformed into Copper Products, such as labor, energy, etc.
By-products results from the processing of Copper Concentrate into Cathodes. The main by-products are Sulfuric
Acid and Anodic Slime (material containing precious metals such as Gold and Silver), besides Slag, Oleum and
Revert.
Toll refers to transactions where the Company receives copper scrap from its customers and transforms it into Copper
Products. Transformation costs incurred are similar to Copper Products obtained from Primary Copper.
Pricing
Paranapanema’s Net Revenues are derived from sales volumes and prices charged by Primary Copper, Copper
Products, Toll and By-Products.
The selling price of Primary Copper or Copper Cathode is established by London Metal Exchange (LME) transactions
and is converted into Reais (BRL) based on the exchange rate at the time of sale closing, as well as the Cathode
Premium, which is the remuneration charged by the Company to transform Copper Concentrate into Primary Copper.
Copper Products selling price is determined by the mix of copper, tin, lead and zinc contained in the product (in line
with those applied for Primary Copper, i.e. LME), plus Premium, value charged by Paranapanema to transform the
Primary Copper into value added products. As it occurs in Primary Copper, revenues from sales of Copper Products
are also impacted by the USD exchange rate, even if sales are booked for Brazilian customers.
By-product prices are linked to the USD. Sulfuric Acid is quoted based on FMB (Fertilizer Market Bulletin) plus
premiums or discounts, while Anodic Slime price is set based on contained precious metals.
Toll average price per ton is materially lower than those of Copper Products, which Paranapanema does not incur in
metal revenues or costs (copper received from customers is in the form of scrap). The Premium charged in Toll
23
3Q14 EARNINGS RELEASE
operations are usually priced in Reais but, in some occasions USD based contracts are adjusted by the dollar
exchange rate.
Inventories
Paranapanema Inventories are primarily comprised of commodities such as Copper, Gold, Silver, Zinc, Tin and Lead.
Commodity inventories have high liquidity and monetization values that are marked by very liquid markets.
Management dedicates special attention to adjusting inventories levels to operational needs and, since 4Q13, keeps
a program called Stock Short to monitor inventory levels, pursuing more integration and efficiency in Supply Chain,
Logistics, Industrial and Commercial on Inventories use.
Adjusted EBITDA
Paranapanema adjusts its EBIDTA of items called "non-recurring", which are amounts not related to Management
expectations that may occur in the future to the same degree as presented in the respective period.
Hedge and Hedge Accounting
The Company follows a risk management policy approved by the Board of Directors, in order to prevent unexpected
economic impacts from fluctuations in metal commodities prices, exchange rates and interest rates on profitability
and cash flow.
Paranapanema adopts various hedging strategies as a way to neutralize any (i.) disconnects between the sales price
and the purchase price of metals and raw materials, (ii.) impact of changes in exchange rates on the value of assets
and liabilities and the future value of revenues and costs, and (iii.) interest rate exposure, given by the annual payment
amount of floating interest embedded in financial contracts. The use of derivatives is limited exclusively to hedging
activities with adoption of Hedge Accounting when necessary.
Adoption of Hedge Accounting will be defined by standards specific to CPC 38 and 39, which should provide at least
the following: (a) the exchange risk on both financial and operational elements may adopt the hedge of the fair value
or cash flow with derivatives or financial instruments; (b) commodity risk may adopt hedge of the fair value or cash
flow with derivative or embedded derivatives and (c) for the interest rates risk may adopt the cash flow hedge with
derivatives.
The reading and interpretation of financial statements with the adoption of Hedge Accounting differ from those that
do not adopt Hedge Accounting and recognize all the variations on derivatives and financial instruments as Financial
Income or Losses.
With the adoption of Hedge Accounting of Cash Flows there is a need to analyze the "Other Comprehensive Income"
account presented in Net Worth. This account is used to record future gains and losses on hedges until the moment
they actually occur, when they are recognized in the Operational Result of the respective period.
In order to allocate effects of economic hedges in Gross Profit, Paranapanema has adopted Hedge Accounting of
the fair value hedging of metals (copper, zinc, lead and tin) and precious metals (gold and silver) inventories.
Management may implement new hedging strategies or modify current strategies, implemented parallel with Hedge
Accounting.
Metal Hedge
The Company seeks to neutralize metal price fluctuation on Paranapanema’s income through the fair value hedge
of the inventories program by using derivative contracts at stock exchanges, derivatives embedded in Copper
Concentrate purchasing contracts and offsetting long and short positions.
24
3Q14 EARNINGS RELEASE
The industrial cycle of the smelter causes Paranapanema to carry a "load" of physical inventory of metals and makes
use of hedging instruments to protect them, in an effort to approximate metal cost value to metal price at sale moment.
For hedging purposes, metal inventories represent a long position. Copper Concentrate sourcing process causes
purchase value to be unknown at purchase date, a metals market practice. Values are defined according to LME
parameters during months following the purchase date. This period is known as "Quotational Period" (or "QP"). This
situation specific to metal markets creates a short position for Paranapanema, until the QP is defined.
Due to amounts usually involved between long and short position of financial transactions, Paranapanema has a
long position. To balance this position, the Company sells derivatives to create an additional short, up to the amount
to neutralize the exposure. This procedure is in line with Company’s risk management policy.
Exchange Rate Hedge
The Company aims to permanently protect 70% to 100% of net foreign exchange exposure of the 6-12 months
projected cash flow through derivative transactions, and offsetting revenues and liabilities pegged to the US Dollar
(USD).
Paranapanema maintains liabilities pegged to the USD (short position), mainly with suppliers and credit facilities. As
a nature of copper business, future revenues are also pegged to the USD (long position). Net position perceived by
Paranapanema, is long. To counteract this situation, Paranapanema sells USD Non Deliverable Forwards (NDFs),
thereby reducing its USD exposure. This process is in line with the Company’s risk management policy.
Effects arising from exchange rate hedge are perceived in three accounts in Financial Statements: in Financial
Results for transactions settled during the period, in OCI, within Net Worth, where gains and losses of exchange rate
mark-to-market variations on future income and expenses awaits transfer to Operating Revenues until they are
materialized.
Total Return Swap
Paranapanema entered into an agreement in November 2012 with Deutsche Bank (DB) to exchange flows by which
DB is long on CDI (Certificados de Depósitos Interbancários – reference daily interest rate used in Brazilian market)
and short on Paranapanema’s share price, PMAM3. The Company has the opposite positions as DB.
[The remainder of this page has been intentionally left blank]
25
3Q14 EARNINGS RELEASE
Disclaimer
Management makes statements about future events that are subject to risks and uncertainties. These statements
are based on estimates and assumptions by the Management and information which the Company currently has
access. Forward-looking statements include information about their intentions, beliefs or current expectations, as
well as those of members of the Board of Directors and Executive Officers. The caveats in relation to statements and
information about the future also include information on possible or presumed operating results, as well as statements
preceded by, followed by or that include the words "believes", "may", "will", "continue", "expects", "anticipates",
"intends", "plans", "estimates" or similar expressions. The statements and information are not guarantees of future
performance. They involve risks, uncertainties and assumptions because they relate to future events and therefore
depend on circumstances that may or may not occur. Future results and value creation for the shareholder may differ
materially from those expressed in or suggested by statements about the future. Many of the factors that will
determine these results and values are beyond our ability to control or predict.
[The remainder of this page has been intentionally left blank]
26
3Q14 EARNINGS RELEASE
Board of Directors Composition
Sitting member
Alternate member
Albano Chagas Vieira (independent) – Chairman
Sergio Ricardo Lopes de Farias
Valéria Maria de Paula Rezende – Vice-Chairman
Fernanda Duclos Carisio
Dannyel Lopes de Assis
Osvaldo Bruno Brasil Cavalcante
Maria Gustava Brochado Heller Britto
César Silva do Carmo
Maria Paula Soares Aranha
Euripedes de Freitas
Maurício França Rubem
Flavia Silva Fialho Rebelo
Paulo Amador Thomaz A. Cunha Bueno (independent)
Endrigo de Pieri Perfetti
Statutory Executive Board Composition
CEO
Chief Supply Chain Officer
Christophe Malik Akli
Antônio Carlos da Rosa Pereira
Chief Copper Products Officer
CFO and IRO
Miguel Angelo de Carvalho
Thiago Alonso de Oliveira
Fiscal Council Composition
Sitting member
Alternate member
João Bosco de Oliveira Santos - Chairman
Gilda Maria dos Santos
Humberto Santamaria
Daniela Lopes de Almeida Leal
Jacy Afonso de Melo
Sergio Mesti Samorano
Susana Hanna Stiphan Jabra
Artur Carlos Das Neves
Paulo Henrique Bezerra R. Costa
Thiago Souza Silva
27


© Copyright 2026