
Spatially resolved 2D Laplace NMR
Spatially resolved 2D Laplace NMR
Von der Fakultät für Mathematik, Informatik und Naturwissenschaften der RWTH
Aachen University zur Erlangung des akademischen Grades eines Doktors der
Naturwissenschaften Ingenieurwissenschaften genehmigte Dissertation
vorgelegt von
M. Ing.
Yan Zhang
aus NEI Mongol, China
Berichter: Univ.-Prof. Dr. rer. nat. Dr. h. c. Bernhard Blümich
Univ.-Prof. Dr. rer. nat. Rüdiger-Albert Eichel
Tag der mündlichen Prüfung: 06. 10. 2014
Diese Dissertation ist auf den Internetseiten der Hochschulbibliothek online verfügbar.
2 3 Abstract
Within the past decade, 2D Laplace nuclear magnetic resonance (NMR) has been
proved to be a powerful method to investigate porous materials. However, it gives
information only about integral characteristics of a given sample with regard to pore-size
and pore connectivity. It is therefore desirable to combine MRI with 2D-Laplace NMR to
generate information about fluid transport within defined areas of a sample. Spatially
resolved D-T2 correlation maps were measured for four different samples: glass beads
with different bead diameters saturated with water, glass beads filled with oil and water
separated by a membrane, a wet mortar sample and glass beads filled with oil and
water without a membrane. The information contained in pixels of similar contrast were
exploited by spatially resolved D-T2 correlation NMR as a representative of 2D-Laplace
NMR. Summation of pixels with similar contrast and low spatial resolution have been
chosen to accelerate the measurement time which is inherently long for 2D-Laplace
resolved MRI. This method reveals the heterogeneous information of these samples
and is expected to be appreciated by the oil industry.
Moreover, Gint2D - T2 maps were obtained to study the relationship between pore
space and internal gradients in porous media. Three different kinds of samples were
measured, which are glass beads with different bead diameters saturated with water,
glass beads filled with oil and water, and a wet mortar sample. Two different cases are
distinguished: 1) The heterogeneity of internal gradients dominates the heterogeneity of
diffusion coefficients, which concerns the first sample. 2) The heterogeneity of diffusion
coefficients dominates the heterogeneity of internal gradients, which occurs in the
second sample. Only in the first case, the internal gradients can be estimated when
assuming a constant diffusion coefficient across the sample. This result delineates the
limitations of this assumption. Then the correlation maps of mortar were measured and
internal gradient distributions were acquired to explore the utility of this method in
reality. Finally, spatially resolved Gint2D - T2 maps were studied at 7 T and 16 T to probe
sample heterogeneity.
4 5 Contents
1
Introduction ............................................................................................................. 1
2
Fundamentals .......................................................................................................... 5
2.1
2.2
2.3
3
Magnetic Resonance Imaging (MRI) ................................................................. 5
2.1.1
Basics of MRI ......................................................................................... 5
2.1.2
Contrast ................................................................................................. 7
2.1.3
Back-projection imaging ......................................................................... 7
2.1.4
Spatially resolved NMR ........................................................................ 10
Porous Media in NMR ..................................................................................... 10
2.2.1
NMR relaxation in porous media .......................................................... 13
2.2.2
Diffusion in porous media .................................................................... 16
2.2.3
Diffusion in porous media in the presence of internal gradient............. 16
Laplace NMR .................................................................................................. 24
2.3.1
1D inverse Laplace transformation ...................................................... 24
2.3.2
2D inverse Laplace transformation ...................................................... 27
2.3.3
Different kinds of 2D inverse Laplace NMR and their applications....... 27
Spatially Resolved D-T2 correlation NMR of Porous Media ............................... 33
3.1
Introduction ..................................................................................................... 33
3.2
Materials and Experimental Protocol .............................................................. 34
3.3
Methods .......................................................................................................... 35
3.4
3.3.1
D-T2 sequence with pulsed-field gradients ........................................... 35
3.3.2
D-T2 correlation-resolved MRI .............................................................. 38
Results and Discussion ................................................................................... 40
3.4.1
Glass-bead sample filled with oil and water with a membrane ............. 40
3.4.2
Glass-bead sample .............................................................................. 41
3.4.3
Mortar sample ...................................................................................... 44
6 3.4.4
3.5
4
Conclusion ...................................................................................................... 48
Gint2D - T2 Correlation NMR of Porous Media ...................................................... 51
4.1
Introduction ..................................................................................................... 51
4.2
Materials and Experimental Protocol .............................................................. 52
4.3
Methods and Theory ....................................................................................... 53
4.4
Results and Discussion ................................................................................... 57
4.5
5
Glass-bead sample filled with oil and water without a membrane ........ 46
4.4.1
Glass-Bead sample .............................................................................. 57
4.4.2
Glass-Bead sample filled with oil and water ......................................... 60
4.4.3
Mortar .................................................................................................. 64
Conclusion ...................................................................................................... 68
Conclusions and Outlook ..................................................................................... 71
References ................................................................................................................... 75
Chapter 1
Introduction
Porous media are widely used in industry and material science. For example, chemical
reactors containing catalysts are porous materials. The petroleum industry is particularly
interested in transport properties of porous sedimentary rocks containing oil. Water flow
and state in soils are important in the areas of environmental protection and climate
change. The cement drying process, which is related to the state of water in porous
materials, is essential in the building industry. Thus, knowledge of the fluid state and
structure within porous materials is desirable in many areas, and this information can be
ascertained using various methods, such as mercury intrusion porosimetry and
scanning electron microscopy. Compared to these methods, NMR is a noninvasive and
powerful approach that can obtain information at both microscopic and macroscopic
scales and is also sensitive to water dynamics. [1-10].
Spin relaxation time can provide the surface-to-volume ratio and pore size
distribution of porous materials, which was first reported in the early 1980s [11, 12]. This
technique was later widely implemented to monitor cement hydration and utilized by the
oil industry in well-logging tools. By measuring the time-dependent diffusion coefficient
of fluids in porous media, surface-to-volume ratios can also be obtained with NMR [13].
Because of the heterogeneous properties of porous materials such as rocks, the MRI
method is particularly useful to provide local structure and fluid state information in the
sample. This local information is extracted from the NMR imaging contrast provided by
different parameters including relaxation, diffusion, and magnetic susceptibility [14, 15].
Moreover, the internal magnetic field gradient induced in porous media by magnetic
susceptibility differences at material interfaces affects diffusion measurements,
particularly at high magnetic field; this relationship can be used to probe the pore
2 structure. Insight into the relationship between pore space and internal gradient Gint has
been explored by many researchers [16, 17].
Within the past decade, 2D Laplace nuclear magnetic resonance (NMR) has
been developed to analyze pore geometry and diffusion of fluids in porous media on the
micrometer scale. Many objects like rocks and concrete are heterogeneous on the
macroscopic scale, and an integral analysis of microscopic properties provides volumeaveraged information. Magnetic resonance imaging (MRI) resolves this spatial average
on the contrast scale set by the particular MRI technique. Desirable contrast parameters
for studies of fluid transport in porous media derive from the pore-size distribution and
the pore connectivity. These microscopic parameters are accessed by 1D and 2D
Laplace NMR techniques. It is therefore desirable to combine MRI and 2D Laplace
NMR to image functional information on fluid transport in porous media. This
dissertation focuses on spatially resolved D-T2 and Gint2-T2 correlation porous media to
explore the relationship between transverse relaxation time, diffusion coefficient and
internal gradient. Information on heterogeneity on the microscopic scale is obtained by
these locally resolved 2D correlation maps.
In chapter 3, spatially resolved D-T2 correlation maps were measured for four
different samples: glass beads with different bead diameters saturated with water, glass
beads filled with oil and water in different compartments separated by a membrane, a
wet mortar sample and glass beads filled with oil and water without a separating
membrane. Spatially resolved information is obtained by back-projection imaging in
order to acquire short echo time. Because 2D Laplace resolved MRI demands
excessive measuring time, this study investigates the possibility to restrict the 2D
Laplace analysis to the sum signals from low-resolution pixels, which correspond to
pixels of similar amplitude in high-resolution images. Regions of similar contrast are first
identified in high-resolution images to locate corresponding pixels in low-resolution
images generated with D-T2 resolved MRI for subsequent pixel summation to improve
the signal-to-noise ratio of contrast-specific D-T2 maps. This method is expected to
contribute valuable information on correlated sample heterogeneity from the
3 macroscopic and the microscopic scales in various types of porous materials including
building materials and rock.
In chapter 4, internal gradients and diffusion effects in porous media were
explored to gain a better understanding of the pore structure. When measuring
distributions of transverse relaxation times T2 in fluid filled porous media, relaxation and
diffusion D in internal gradients arise simultaneously and data are often interpreted with
the assumption that one or the other parameter be constant throughout the sample. To
examine this assumption correlations of the distributions of Gint2D and T2 were measured
by 2D Laplace NMR for three different samples: glass beads with different bead
diameters saturated with water, glass beads filled with oil and water with a separating
membrane and a wet mortar sample. For the first two samples, the cases where either
the internal gradient or diffusion dominates were examined separately in order to better
understand the relationship between Gint and D. These results are useful for estimating
the impact of internal gradients and diffusion in unknown samples, such as the mortar
sample. The experiments were performed at different magnetic field strengths
corresponding to 300 MHz and 700 MHz 1H Larmor frequency to identify the impact of
the magnetic field on the internal gradient. Subsequently, spatially resolved Gint2D - T2
maps were obtained to study the sample heterogeneity. The conclusions and
perspective of this work are presented in chapter 5.
4 5 Chapter 2
Fundamentals
2.1 Magnetic Resonance Imaging (MRI)
2.1.1 Basics of MRI
Magnetic resonance imaging (MRI) is well-known as a clinical method. It is also growing
more important for materials research, for example, to investigate flow and diffusion in
porous media. The popularity of MRI is mainly due to two reasons [17-21]. First, the
non-invasive nature of MRI enables us to observe the interior of materials without
having to cross-section or cut the sample. This is especially important for medical
applications. Second, many NMR parameters, such as spin density, nuclear spin
relaxation time, chemical shift, and diffusion coefficient, can be used for imaging.
The first MRI experiment was reported by Paul C. Lauterbur and Sir Peter
Mansfield [22, 23]. They superimposed a magnetic field gradient G onto a main
magnetic field B0 , leading to a spatially dependent magnetic field. As a result, the
Larmor frequency becomes spatially dependent, 0 (r ) (B0 G r ) , where γ is the
gyromagnetic ratio. This equation is at the heart of MRI. In the presence of G , the NMR
signal fraction dS at position r within a volume dV of a sample can be described as [24]
dS(G, t ) C(r ) (r )dV exp[i (B0 G r )t ] ,
(2.1)
where (r ) is the local spin density, C (r ) is the contrast factor arising from other NMR
parameters, such as T1, T2, the diffusion coefficient and so on. If the gradient is strong
enough, the dephasing of the transverse magnetization is dominated by the gradient.
6 Figure 2.1. (a) Pulse sequence for basic imaging method: spin echo imaging (b) Scheme for k-
space sampling.
Therefore, the T2 effect can be neglected. When the NMR signal is ‘on resonance’, the
integration of equation 2.1 for the whole sample is
S (t ) d 3 rC ( r ) ( r ) exp( iG r t ) .
(2.2)
This equation describe a Fourier transformation. To make this point clear, Mansfield
introduced the wave vector k (= Gt / 2 ). Then, Eq. (2.2) can be reformulated as
follows:
S ( k ) d 3 rC ( r ) ( r ) exp( i 2k r ) ,
(2.3)
C ( r ) ( r ) d 3 kS (k ) exp( i 2k r ) .
(2.4)
Thus, the signal acquisition for imaging is k-space sampling [25]. Based on the method
of scanning in k space, two methods of the acquiring signal are defined: frequency and
phase encoding. If the signal is acquired when the gradient is being applied (read
gradient), a single line is scanned in k-space. This is called frequency encoding. If the
7 signal is acquired after the gradient is applied (phase gradient), this is called phase
encoding. Both methods are used for two dimensional imaging, and the whole of kspace is scanned with increments of the phase gradient strength. This is depicted in
Fig. 2.1.
There are two basic parameters in MRI: Field of View (FOV) and resolution. The
definition of the two parameters (for the read gradient) is shown below
FOV = 2π/(γGDW) ,
Δr = Δω/γG,
(2.5)
(2.6)
where DW is the dwell time, which is the time between the acquisition of two data
points, and Δω is the line width of the signal.
2.1.2 Contrast
The fact that contrast is provided by many NMR parameters is an advantage of MRI
[26]. The contrast is defined as the relative difference in image intensities M of
neighboring structures i and j,
M z (ri ) M z (r j )
M z
,
M z,max
Mz,max
(2.7)
where M z,max is the maximum of M z (ri ) and M z ( r j ) , and ri and r j are the space
coordinates of the pixels i and j under consideration. Then, these parameters are
related to the material properties. If the different parts of the materials have different
values of the NMR parameters, then information can be acquired about the materials
based on the contrast in the NMR images. To achieve that, a filter preparation period is
added before the space encoding and detection period. Different types of filter are
discussed below based on which NMR parameter is used by the filter [27-29].
8 T2 and T1 filters
T2 contrast can be acquired by using a Hahn echo and CPMG pulse sequence [30]. The
CPMG sequence is used when molecular self-diffusion is apparent. The saturation
recovery, inversion recovery and stimulated echo are three different T1 filters. To obtain
better contrast, a suitable value of the echo time (for the T2 filter) and of the recovery
time (for the T1 filter) need to be chosen. The equations for the contrast factor are listed
below,
Spin echo
C(r ) exp[t E / T2 (r )] .
(2.8)
Saturation recovery
C(r ) 1 exp[t r / T1(r )] .
(2.9)
Inversion recovery
C(r ) 1 2 exp[t r / T1(r )] ,
(2.10)
where t E is the echo time and t r is the recovery time.
Translational diffusion filters
The translational diffusion filter generate contrast by self-diffusion. It can be
implemented by using a stimulated echo pulse sequence which separates relaxation
attenuation from the diffusion attenuation [31-33]. By varying the echo time in a staticfield gradient or the gradient duration and strength in a pulsed field gradient, diffusion
contrast is introduced. To separate relaxation attenuation from the diffusion attenuation,
a fixed echo time and diffusion time are employed in the stimulated echo pulse
sequence with a varying gradient strength. The contrast factors for this method, which
are determined by the diffusion coefficient, are shown below:
C ( r ) exp[ 2G 2D ( r ) 2 ( 1 / 3 )] ,
(2.11)
9
where D(r ) is the diffusion coefficient at position r , Δ is the diffusion time and δ is the
gradient duration. This equation is only valid for free diffusion. For restricted diffusion,
the echo attenuation is modified, and diffraction patterns may be observed.
2.1.3 Back-projection imaging
In contrast to Fourier imaging, which uses Cartesian k-space sampling, back-projection
imaging applies radial k-space sampling [34-38]. This method is similar to that used in
X-ray computerized tomography (CT). The basic principle of back-projection is
described as follows: the object is placed in an imaging gradient G , and the signal is
acquired at the same time. Then, a radial line in k-space is recorded. By varying the
direction of G while keeping the amplitude the same, the whole of k-space is sampled.
In practice, G is a combination of the x-gradient Gx and Gy. These can be expressed by
the following equation:
Gx G sin
Gy G cos ,
(2.12)
where is the directional angle of the imaging gradient G .
Another way to accomplish back-projection imaging is to keep the gradient
constant but to rotate the sample. Then, the projection of the spin density of the object
can be obtained by Fourier transformation of the k-space signal for each G direction.
Using a series of projections with different angles, the image of the object can be
reconstructed by using an inverse Radon transformation. Therefore, this method is also
called reconstruction from projections [39, 40]. Because the density of signal points in
the center of k-space is higher than in the outer region, filters need to be employed. In
this work a Hamming filter is used. Figure 2.2 shows the back-projection of an object
with a simple geometry.
10 Demonstration of the back-projection principle: projections of the object are
acquired at different angles.
Figure 2.2.
2.1.4 Spatially resolved NMR
Spatially resolved NMR refers to measurements that generate NMR information from a
sample with spatial resolution. The information can be, for instance, the chemical shift,
the relaxation time and the diffusion coefficient. Spatially resolved NMR measurements
can be obtained in three different ways by NMR imaging, the gradient method and the
surface-coil techniques [26]. For the NMR imaging method, the whole sample (3D
imaging) or a slice of the sample (2.5D imaging) is excited, and spin echo or CPMGmethod images of the sample are acquired with different attenuations of the T2
relaxation. Then, for each pixel, the T2 attenuation data can be inverted by using an
inverse Laplace transformation to obtain the T2 relaxation time distribution that
corresponds to a certain region of the sample [41, 42]. An example of such a pulse
11 sequence is shown in Fig. 2.3a. The soft 90o pulse and a 180o pulse are combined with
a slice-selective gradient to excite a slice of the sample. Then, the imaging gradients
are added between the 180o pulses to image the slice of the sample during each echo.
Using these T2 weighted images, spatially resolved T2 distributions are obtained.
Spatially resolved images can also be obtained for other NMR parameters by using this
method. Examples include diffusion weighted images and T1 weighted images.
The gradient method, also known as volume-selective excitation, employs
successive slice-selection pulses with mutually orthogonal gradients to excite three
orthogonal planes of the sample. Then, the region at the common intersection is the
volume element of interest. This method is of particular interest for localized
spectroscopy experiments because it can select a limited region within the sample. The
key to this method is to retain the magnetization of the selected volume element but
destroy the magnetization of the other parts. Then, after applying a subsequent pulse
sequence, the localized chemical shift, relaxation time, diffusion coefficient and other
NMR parameters can be measured [43]. SPACE is one of the available pulse
sequences that can be used to acquire such localized information. This is shown in Fig.
2.3b. First, a selective 90o pulse is applied in the presence of a gradient, and a slice of
the sample is excited. By using a 180o pulse, the magnetization in the slice is refocused
and stored by the following hard 90o pulse. At the same time, the hard 90o pulse excites
spins in other parts of the sample, and the magnetization are dephased due to the
spoiler gradient. Only the magnetization components in the slice of interest is retained
and stored along the z axis. Subsequently, orthogonal gradients are used, and only the
magnetization in the intersected region is retained [44].
Compared to the two methods mentioned above, the surface coil method can
obtain localized information without using gradients of the static magnetic field [45]. The
surface-coil can be used for signal reception, excitation or both. When the surface-coil is
used to receive the signal, the volume elements of the sample near the surface-coil
have a high signal-to-noise ratio. In contrast, the volume elements of the sample away
from the surface-coil have a low signal-to-noise ratio. Then, a sensitive volume is
defined which contains localized information. Similarly, when the surface-coil is used for
12 Figure 2.3. a) Spatially resolved T2 distribution pulse sequence achieved by NMR
imaging. b) SPACE pulse sequence
13 excitation, a sensitive volume can be defined where the spins in the sensitive volume
are excited properly, but the spins in the other parts of the sample are not excited or not
enough. The sensitive volume is determined by the inhomogeneous B1 field and the
relationship between B1 and transverse magnetization. Experimental details, such as
the relaxation time and the pulse sequence, are important to the actual sensitive
volume. For example, the sensitive volume for spin-echo excitation is smaller than that
for single pulse excitation. The advantage of the surface-coil is that the sample does not
need to fit inside the coil. This means that a sample with any shape can be measured
without having to cut it. In low field NMR, a surface-coil is usually used. Examples of
applications include single-sided NMR and well-logging tools.
2.2 Porous Media in NMR
2.2.1 NMR relaxation in porous media
There are two basic relaxation processes in NMR: longitudinal relaxation and transverse
relaxation. The longitudinal relaxation is also called spin-lattice relaxation, and it has a
characteristic time constant T1. It is a measure of the ability of the macroscopic
magnetization (for a nuclear spin system) to return to thermal equilibrium after a
perturbation. At a molecular level, this process describes the energy exchange between
spins and their surroundings (the lattice, by a mechanism such as rotating, chemical
groups and paramagnetic ions). Then, the energy exchange rates depend on the
interaction between the spin and the oscillating local magnetic field Bloc caused by
molecular motion. When the frequency of Bloc is close to the spin resonant frequency,
the energy is transferred efficiently between the spins and the lattice. Consequently, the
spins transfer energy to molecular motion and the system returns to thermal equilibrium.
The longitudinal relaxation of magnetization can be expressed by the equation:
M z (t ) M z (0 )[1 exp( t / T1 )] ,
(2.13)
14 where M z (t ) is the longitudinal magnetization at time t after an rf pulse is applied and M z (0) is the equilibrium longitudinal magnetization.
In porous media, the longitudinal relaxation process can be divided into two
parts: relaxation in the bulk fluid and relaxation near a pore surface. Due to the
presence of paramagnetic ions on pore surfaces, the relaxation rate of spins near the
pore surface is much faster than that in the bulk fluid. There are two important rates in
the pores: (1) the relaxation rate in the vicinity of the fluid-matrix surface, w / a ,
where is the surface relaxivity and a is the characteristic length of the pore. (2) The
rate for molecular diffusion from the bulk fluid to the fluid-matrix surface, w D D / a 2 .
When w D w , which is called the fast diffusion limit, the relaxation process is
dominated by surface relaxation and can be expressed by (diffusion between pores are
neglected) [46, 47]:
S
1
1
1 ,
T1 T1,b
V
(2.14)
where T1,b is the longitudinal relaxation time in the bulk fluid, ρ1 is the surface relaxivity
for the longitudinal relaxation process, and S/V is the surface-to-volume ratio of the
pores. In the low diffusion limit where wD<<0.1wρ, the relaxation process in one pore
could be multiexponential. For the case where diffusion between the pores cannot be
neglected, Cohen and Mendelson discussed the relaxation in detail [48, 49].
In the fast diffusion limit, different relaxation rates correspond to different sizes of
pores in the porous media. Therefore, the T1 relaxation distribution can be
representative of the pore size distribution. The total NMR signal S(t) for all of the pores
are expressed as:
S(t ) i Ai {1 exp(
t
)} ,
T1i
(2.15)
where T1i is the spin-lattice relaxation time for each pore and Ai is the corresponding
relative population of each pore. The T1 distribution can be obtained by Laplace
15 transformation of the signal. Therefore, the pore size distribution can be estimated from
the T1 relaxation distribution with measured or estimated surface relaxivity. In another
method, if the pore size distribution is measured by another method, such as mercury
porosimetry, the surface relaxivity can be determined by combining the pore-size
distribution with the T1 distribution [50-52].
Another NMR relaxation process is transverse relaxation, which is also called
spin-spin relaxation. This process concerns the decay of magnetization in the
transverse plane. The decay is due to the destruction of the coherence of transverse
magnetization. There are two phenomena that can destroy the coherence. One is the
process that causes the longitudinal relaxation. Another is the spin-spin interaction.
Influenced by the spin-spin interaction, Bloc varies through the entire spin system.
Therefore, it causes spins to precess at different frequencies at different positions,
which causes the net transverse magnetization to decrease to zero. The decay of the
transverse magnetization is described as:
Mxy (t ) Mxy (0) exp(t / T2 ) ,
(2.16)
where Mxy(t) is the transverse magnetization at time t after the rf pulse is applied, and
Mxy(0) is the magnetization in the xy plane immediately after the rf pulse is applied.
In porous media, the T2 relaxation process also involves surface relaxation. In
addition to this, molecular diffusion in the presence of a magnetic field gradient also
contributes to the relaxation process. The magnetic field gradient can be the applied
gradient or an internal gradient. The internal gradient arises from the differences in
magnetic susceptibilities between the matrix and fluid. The expression for the T2
relaxation rate (measured by the CPMG pulse sequence) is shown below,
S Gt E D
1
1
2
,
T2 T2,b
V
12
2
(2.17)
where T2,b is the transverse relaxation time in the bulk fluid, ρ2 is the surface relaxivity
for the longitudinal relaxation process, G is the gradient strength, tE is the echo time and
D is the diffusion coefficient. The T2 relaxation distribution can also be used to
16 determine the pore size distribution but only in a weak field where the internal gradient
is small. An advantage of Equ. 2.17 is that diffusion information can be extracted from
this equation with varying echo time [53-56].
2.2.2 Diffusion in porous media
Due to existence of the pore walls the diffusion in porous media is restricted. Then, the
diffusion coefficient is replaced by an effective diffusion coefficient,
Deff (t )
r (t ) 2
6t
,
,
(2.18)
Figure 2.4. Schematic of a porous media cross-sectional area.
where r (t )2
is the mean-square displacement of the spins at time t. When t→0, the
molecules diffuse a very short distance and experience no barrier. Therefore, the Deff(t)
will be the free diffusion coefficient D0. When t increases, the number of molecules that
rebound from the walls of pores Deff(t) decreases. In the case of t→ , Deff(t) becomes
17 zero for closed pores. For connected pores, Deff(t) reaches an asymptotic value, Deff( ),
that is determined by the tortuosity effect. In the short diffusion time limit, Deff(t) can be
expressed as [57,58],
Deff (t )
4 S
1
D0 t ,
D0
9 V
(2.19)
where S is the pore surface, V is the pore volume, and t is the diffusion time. This
equation means that diffusion measurements (at a short diffusion time) can be used to
obtain pore-structure information, such as the surface-to-volume ratio [59, 60]. In the
long diffusion time limit for connected pores, Deff(t) is defined as,
Deff (t ) 1
,
D0
(2.20)
where α is the tortuosity, which is a measure of the pore connectivity in porous media.
For a porous medium with a simple pore geometry, such as random packed glass
beads, 1/ α can be calculated as ~ 0.62 , where is the volume fraction of the pores
in the sample. In more complex porous media, Deff(t) may be represented as [61, 62],
Deff (t ) 1 1 2
,
D0
t t 3/2
(2.21)
where β1 and β2 are constants that depend on microscopic details. Based on the shortand long- time limits expression, Deff(t), in the intermediate regime can be interpolated
using the Pade approximation as follows,
Deff (t )
1
c t (1 1 / )t /
,
1 (1 )
D0
(1 1 / ) c t (1 1 / )t /
where c is
4
S
9 V
(2.22)
D0 and θ has dimensions of time. In NMR narrow pulsed field
gradient (PFG) measurement is suitable to measure effective diffusion coefficient and
surface-to-volume ratio is obtained from this curve, as depicted in Fig. 2.5 [63].
18 The time dependent diffusion coefficient D(t) as a function of the normalized
diffusion length, measured by the 129Xe gas NMR method. The solid curve is a Pade fit [63].
Figure 2.5.
2.2.3 Diffusion in porous media in the presence of internal
gradients
Narrow pulsed gradients are applied in PFG measurements. This is necessary for
accurate measurement of the diffusion coefficient. In addition to PFG measurements,
diffusion measurements in the presence of a constant gradient are also interesting in
some cases. For example, in low field NMR, the external gradient is constant due to B0
not being homogeneous for the diffusion measurements. In high field NMR (for porous
media), the internal gradient is large during the measurement. This is the extreme case
of PFG measurement, and the decay of the Hahn echo or of CPMG echoes in the
presence of an uniform gradient is governed by the interplay of three lengths: the
diffusion length, the dephasing length and the length of the pore structure [64].
The diffusion length lD is defined by
19 l D D ,
(2.23)
where is the diffusion time for the molecules. In a CPMG sequence, t E / 2 . This is
a measure of the average distance through which the molecules diffuse during the
diffusion time. The second length is the dephasing length lG, which can be described by
1/ 3
D
lG
G
,
(2.24)
where γ is the gyromagnetic ratio. The dephasing length is a measure of the distance
through which the molecules must travel to experience a 2π phase shift. When the
molecules diffuse a greater distance than the dephasing length, the signal is completely
dephased, and no echo occurs. Finally, the length of the pore structure, lS, is a measure
of the pore size. Next, three regimes are defined based on the three characteristic
length scales that govern the diffusion of the restricted molecules.
In the free diffusion regime, lD is the shortest length scale (lD << lS and lD << lG).
In this regime, the echo attenuation is described by the following equation [65]:
2 l 6
2
2 2
3
M (G, n ) / M0 exp D G n exp n D ,
3
3 lG
(2.25)
where n is the number of echoes and n=1 for the Hahn echo. In this regime, only a
small fraction of the molecules experience the walls of the pores, and the restriction of
diffusion is not severe. The second regime is the motional averaging regime, where lS is
the shortest length scale (lS << lG and lS << lD). The echo attenuation can be expressed
by
n l 2 l 4
1 2G 2l s4 2n
D s ,
M (G, n ) / M0 exp
exp
D
60
120
lG lG
(2.26)
In this regime, spins travel across the pores several times before dephasing occurs. The
magnetic field inhomogeneities are averaged out by the diffusive motion, and as a
20 result, the echo amplitude decays at a much slower rate. For different geometries of
pores, the equation has a similar form but different prefactors.
The third regime is the localization regime, where lG is the shortest length scale
(lG << lS and lG << lD). In this regime, the signal is mainly from those spins that are within
a distance lG of the pore walls. This is the region where restricted diffusion has reduced
the signal loss by dephasing of the magnetization components. The spins far from the
pore walls, however, contribute no signal because their magnetization has been
completely dephased by diffusive translation though the gradient field. In the free
diffusion regime and the motional averaging regime, the spins’ phase distribution is
Gaussian. However, in the localization regime, the Gaussian phase approximation fails.
De Swiet et al. found that at long echo times, the echo amplitude can be expressed by
2
l D
D01 / 3
lG
1/ 3 2 / 3 2 / 3
M (G, n ) / M 0 c 1 / 3 1 / 3 exp a1D0 G n c exp a1n ,
G ls
ls
lG
(2.27)
where –a1 = -1.0188 and c = 5.8841 for the Hahn echo, and c(n) for CPMG has been
calculated elsewhere [65]. The prefactor c is modified for different geometries. The
equation for the localization regime is deduced for a one dimensional restriction.
However, for two- or three- dimensional cases, the simulation results show that the
diffusion cannot be in the pure localization regime but is stuck in an intermediate regime
between the free diffusion regime and the localization regime [66]. The signal
ln[ M (G, ) / M 0 ] depends on the third power of the diffusion time for the free diffusion
regime, and the first power of the diffusion time for the localization regime or the
motional averaging regime. In the three-dimensional case, we can expect a power
dependence that is between 1 and 3. These regimes are shown in Fig. 2.6. The
boundaries between the different regimes are not well defined [64].
The cases mentioned above address an uniform gradient. Two simple
nonuniform gradient cases were already examined theoretically. The first is an
unbounded parabolic field [67]:
B = (B0 + g1z + g2z2)z ,
(2.28)
21 Figure 2.6. Schematic diagram for the three diffusion regimes
The echo attenuation of the motional averaging regime for the parabolic field is
expressed as:
8 2G 2l s6 2n
M (G, n ) / M0 exp
,
D
945
(2.29)
which has a lS6 dependence instead of lS4 for linear gradient. The dephase length is
1/ 4
8D
lG
g
2
.
(2.30)
This is the size of a packet of magnetization at long diffusion times. A critical length can
be defined by:
l (
D 1/ 2
) ,
B0
(2.31)
which corresponds to a diffusion distance over the time interval given by the inverse of
the spread in the Larmor frequency arising from the field inhomogeneity. Then, the
relationship between dephasing length, critical length and pore size can be found:
22 lG ~ (lS l*)1/2 .
(2.32)
The critical length l* can be used to characterize small pores and large pores. For small
pores, lS <l*. Then, we have lG> lS, and the diffusion is in the motional averaging regime
or the free diffusion regime depending on whether short or long echo times are applied.
For large pores, lS >l*, and lG< lS from Equ. 2.27. Then, the free diffusion regime or
localization regime is applied.
The second case is the bounded cosine field, B0cos(πxlS)z. This is similar to the
internal magnetic field in porous media which is bounded by B0 B/20. The signal
decay in the motional averaging regime for this magnetic field is expressed as [68]:
2n 1 l 2
M (G, n ) / M0 exp 2 s 1 .
2 n l D
(2.33)
The signal decay rate varies with the square of the pore size (~lS2) for the cosine field.
This is much lower than the linear (~lS4) and the parabolic (~lS6) fields. This is a useful
indication for bounded vs. unbounded fields. In the localization regime, one can obtain
1/ 2
2
l D
2 1 / 4 lG
M (G, n ) / M0 exp 2( ) .
l S lG
(2.34)
This has a dependence on pore size (~lS-1/2) unlike the linear and parabolic fields. The
dephase length for the cosine field is
1/ 3
2DLS
lG
B
0
.
(2.35)
The critical length l* is
l (
Then, we have
D 1/ 2
) .
B0
(2.36)
23 lG3 ~ ( 2 / )1/3(lS l*2).
(2.37)
After this, a similar relationship can be obtained for small pores (lS <l*), and we have
lG3> lS3, lG> lS. For large pores, (lS >l*) lG< lS.
In a real case, such as a porous medium, the diffusion in the presence of an
internal gradient is more complex. When a porous medium is placed in a homogeneous
magnetic field B0, the magnetic susceptibility difference Δ between the solid matrix and
the fluid or gas leads to local magnetic field variations, ΔB = ΔB0. These variations
have a linear relationship with B0. A simple example of a porous medium is randomly
packed spherical glass beads. The magnetic dipole moment M of the glass beads is
M
g 3
R B 0 , (2.38)
g 2
where R is the radius of the glass beads, g is the magnetic susceptibility of the glass
beads, is the magnetic susceptibility of the medium. μg = 1 + 4πg and μ = 1 + 4π.
Then, the local internal magnetic field at position R can be calculated as
B(R ) 0
4
R R
3M R R i R R i M R R i
i
5
,
2
(2.39)
i
where R i is the center of the glass bead. Then, the variation of the local magnetic field
leads to an internal magnetic field gradient, which scales with the pore size. No exact
equation can be found to describe the internal gradient. An effective internal gradient
Gint,eff can be introduced that describes the average field inhomogeneity over the length
lG = (D / Gint,eff)1/3 [69]. For the whole sample, the total magnetic field variation is
bounded by ∆
. This means that Gint,eff lG B0. Then, the maximum possible
internal gradient in the sample can be calculated using
Gint,max ( / D)1/2 ( B0)3/2,
and the corresponding structural length scale is given by
(2.40)
24 l* = B0 / Gint,max = (D /( B0))1/2,
(2.41)
which is also the shortest dephasing length. For small pores, lS <l*. In porous media,
such as rocks, lG ≥l*. Therefore, lS <lG. In a high magnetic field (B0>2 T), in general,
l*<0.5 m. In addition, for an really short echo time tE = 100 s, lD ≈ 0.5 m. Therefore,
in most cases we have lS << lD and lS << lG. Then, the diffusion for small pores in a high
magnetic field is in the motional averaging regime. In a low magnetic field, such as 3
MHz, l* ≈ 5 m, and for a long echo time tE = 10 ms and lD ≈ 5m. Hence, in most
cases, lD << lS and lD << lG. This is in the free diffusion regime, except for really small
pores or really long echo times. The profile of the internal gradient is not important in
small pores because the local internal gradient is averaged by the diffusion over the
dephase length to obtain an effective internal gradient. For large pores (in porous
media), lS >l*, similar to the cases of the parabolic and cosine fields. In addition, lS >lG
may also apply. In a high magnetic field (B0>2 T), the diffusion is in the free diffusion
regime or the localization regime depending on the diffusion time. In a real case, the
diffusion is in the intermediate regime between the two regimes mentioned above. In a
low magnetic field, such as 3 MHz, l* ≈ 5 m, and for a long echo time tE = 10 ms and lD
≈ 5m. Hence, in most cases, lD < l*< lS and lD < l*< lG. This is in the free diffusion
regime. The profile of the internal gradient can be detected in large pores, and the local
internal gradient is important to obtain the effective internal gradient.
2.3 Laplace NMR
Since the fast and stable 2D inverse Laplace algorithm was developed by
Venkataramanan [70], 2D Laplace NMR experiments have been widely performed to
extract structural information from materials [71-77]. Diffusion-relaxation correlation (DT1 or D-T2) experiments were performed to characterize the oil-water mixture in rocks.
Relaxation-relaxation correlation or exchange experiments were performed to monitor
25 the drying process of cement. The inverse Laplace transformation is expressed by the
equation,
f (R ) L1 {S(t )}
1
2i
i
i
S(t ) exp(Rt )dt ,
(2.42)
where S(t) is the time domain signal, R is the decay rate, f(R) is the amplitude
distribution of the decay rate, and γ is a vertical contour that is positioned to the right of
any singularities. However, the inverse Laplace transformation is an ill-posed problem,
which means that there is no unique solution for a certain signal S(t). In practice, the
inverse Laplace transformation is performed by a non-negative least square
minimization with a proper smoothing procedure.
2.3.1 1D inverse Laplace transformation
The inverse Laplace transformation procedure is described for the case of a relaxation
process. The NMR relaxation signal S(t) can be expressed as
S(t ) A(1 / T ) exp( t / T )d (1 / T ) ,
(2.43)
where A(1/T) is the distribution of the relaxation time, t is the measurement time, and ε
is the noise in the signal. In real experiments, the data were sampled in a discrete
manner. The discrete form of Equ. 2.20 is
N
S(t i ) A(1/ T j ) exp(t i / T j ) i . (2.44)
j 1
To obtain the relaxation time distribution A(1/Tj) with the constraint of A(1/Tj)≥0
(negative amplitude for A(1/Tj) is meaningless), a non-negative least square algorithm
was applied. The principle of this method is to minimize the following term
26 M
N
i 1
j 1
2
2 {S(t i ) A(1/ T j ) exp( t i / T j )} .
(2.45)
The solution from the above equation is not unique for a given dataset. Therefore, a
Tikhonov regularization term or smoothing term is needed as well. There are various
smoothing methods, such as norm smoothing, slope smoothing and curvature
smoothing. Here, the curvature smoothing method was used, and minimization was
performed using the following expression [76]
M
N
i 1
j 1
2
2 {S(t i ) A(1/ T j ) exp( t i / T j )}
2
1 N 1
{ A(1/ T j 1 ) 2A(1/ T j ) A(1/ T j 1 )} , (2.46)
j 2
where α is the smoothing parameter. With a chosen discrete relaxation time Tj, A(1/Tj)
can be obtained. To obtain the right A(1/Tj) distribution a proper α value needs to be
chosen. If α is too large the fit just fits the noise. If α is too small, the fit results will be too
smooth and cause a bias. Only if α is chosen such that the two terms in Equ. 2.46 are
Figure 2.7. The residual term
2 as a function of α. The arrow shows the right α value.
27 comparable, a right A(1/Tj) distribution can be obtained, and the results are stable in
presence of noise. In practice α is chosen in such a way that with a series of α value the
M
N
i 1
j 1
2
residual {S(t i ) A(1/ T j ) exp(t i / T j )} is calculated. Then, the right α is at the
2
heel of 2 ( ) curve as depicted in Fig. 2.7 [75].
2.3.2 2D inverse Laplace transformation
For
two-dimensional
Laplace
NMR
experiments,
such
as
diffusion-relaxation
experiments, the correlation signal can be expressed in a discrete form [77]
S(q i2 ( 1 / 3 ), t j ) A(Dp ,1 / Tq ) exp( q i2Dp ( 1 / 3 )) exp( t j / Tq )dD p d (1 / Tq ) ,(2.47)
where A(D,1/T) is the distribution of diffusion and relaxation, and q = G δ. The matrix
form of this equation is
S K 1AK 2 ,
(2.48)
where A is the diffusion-relaxation distribution, K1i , p exp(qi2Dp ( 1 / 3 )) and
K 2 j ,q exp( t j / Tq ) . This 2D problem can be solved by transforming the above
equation: S and A are reformulated to a 1D vector, and a new kernel is created by
K K 1 K 2 . Then, the 2D problem is reduced to a 1D problem and a 1D Laplace
inversion can be applied. However, the size of the K matrix is enormous, and it requires
a large amount of computer memory and is impractical for a desktop computer. This
problem was solved by Venkataramanan et al., who proposed a nice method to
accelerate the inversion process. The procedure is described below. First a Singular
Value Decomposition (SVD) is applied to the K1 and K2 matrices
K1 =U1 Σ1 V1 ,
(2.49)
K2 =U2 Σ2 V2 ,
(2.50)
28 where Σ1 and Σ2 are diagonal matrices, and U1 V1 U2 V2, are unitary matrices. Due to
the singular values in Σ1 and Σ2, they decay very quickly. Then, only 8-10 of the largest
singular values are selected, and the dimensions of the K1 and K2 matrices are
significantly reduced. Now, the 2D form of the equation can be reduced to a 1D form,
and the 2D inverse Laplace transformation is performed in a fast manner.
2.3.3 Different kinds of 2D inverse Laplace NMR and their
applications
The T2-T2 relaxation exchange pulse sequence includes three parts (Fig. 2.8a): First, a
CPMG sequence is applied with m 180o pulses during a time period t1. At the end of this
part, a 90o pulse is applied to store the magnetization along the z axis. The
magnetization needs to be stored along both positive and negative directions on the z
axis to cancel the T1 recovery effect by proper phase cycling, which occurs during the
exchange. After the exchange time t2, a second CPMG pulse train is applied with an n
number of 180o pulses, and the amplitudes of the echoes are recorded during the time
interval t3. Then, the experiment is repeated p times with different values of m, and a
two-dimensional NMR dataset is acquired. The echo attenuation can be expressed as
M (t1, t 2 , t 3 ) / M 0 d (1 / T21st )d (1 / T22nd )f (1 / T21st ,1 / T22 nd ) exp( t 1/ T21st ) exp( t 2 / T1 ) exp( t 3 / T22 nd )
(2.51)
where f(1/T21st, 1/T22nd) is the T2-T2 relaxation distribution function. This experiment was
used to detect the chemical exchange between water and urea protons in solution. The
exchange rate between the two chemical sites was extracted from the intensity variation
of the cross peaks [78]. Callaghan et al. observed the water transport between pores in
Castlegate sandstone [79]. T2 exchange data from two sites were analyzed in detail,
and a cross peak was observed in the 2D relaxation spectrum. The exchange rate
between the two smallest porosity reservoirs was estimated to be on the order of 5 ms-1
[80]. A theoretical analysis was performed to obtain a better understanding, and it was
found that the cross peaks can be asymmetric when the number of exchange sites is
greater than 2 [81].
29 Another type of 2D Laplace NMR experiment measures the T1-T2 correlation. As
shown in Fig. 2.8b, a first 180o pulse is applied, followed by a recovery time td. T1
information is encoded during this time interval. Then, a CPMG pulse train is applied to
encode T2 information. By repeating this experiment with different td values, a 2D T1-T2
correlation experiment is performed. The resulting signal is described as
M (t d , t ) / M 0 d (1 / T1 )d (1 / T2 )f (1 / T1,1 / T2 ) exp( t d/ T1 ) exp( t / T2 ) ,
(2.52)
where f(1/T1,1/T2) is the T1-T2 relaxation distribution function. Song et al. measured the
T1-T2 correlation spectrum for rocks. The results show that there are two peaks in the
correlation map that indicates two distinct pore environments [82]. McDonald et al. first
performed T1-T2 correlations experiments to study the drying process of cement [83].
The water and fat of milk, cream and cheese have also been examined using this
method. The peak related to the water decrease from milk to cheese and the contents
of water and fat can be obtained by integrating the peaks in the T1-T2 correlation map.
This method could be useful for food quality control [84].
Diffusion-relaxation correlation experiments are widely used during Well-logging
to identify the oil and water contents in sedimentary rocks. D-T2 experiments can be
implemented by using a spin echo or a stimulated echo with a pulsed field gradient
followed by a CPMG pulse train (Fig. 2.8c). The strength of the gradients is increased in
a series of experiments to encode the diffusion information. The relaxation information
is encoded by the CPMG pulse train. The signal of echoes decays as
M (G, t ) / M 0 dDd (1 / T2 )f (D,1 / T2 ) exp[ D 2 g 2 2 ( 1 / 3 )] exp( t / T2 ) ,
(2.53)
where f(D,1/T2) is the diffusion relaxation distribution function, t = ntE2, δ is the duration
of the pulsed field gradient, and Δ is the diffusion time.
The pulse sequence with a stimulated echo is particularly suitable for the sample
with a long T1 but short T2, such as porous media, by setting a long Δ and short δ. The
D-T2 experiments can also be conducted in a constant field gradient, for example, in an
NMR well-logging tool or an NMR MOUSE. In this case, the echo time of the spin echo
30 or the stimulated echo needs to be varied to encode the diffusion information. The pulse
sequence is shown in Fig. 2.6d, and the amplitudes of the echoes are expressed as
[77],
M (t E 1, t ) / M 0 dDd (1/ T2 )f (D,1/ T2 ) exp(
1
D 2 g 2t E31 ) exp( 2t E 1 / T2 ) exp( t / T2 ) ,
6
(2.54)
For this constant gradient experiment, the spin echo and the stimulated echo encode
the diffusion information and also include relaxation information. The pulses may not
excite the entire sample, and off-resonance effects appear due to the presence of the
static gradient. The signals from oil and water overlap in the T2 dimension but not in the
diffusion dimension. Therefore, the signals from oil and water can be readily separated
by using D-T2 correlation maps [85]. The water and fat in cream and cheese can also be
identified by this method based on to the diffusion differences between these two
components [84].
31 Figure 2.8. Pulse sequence for 2D Laplace NMR. a) T2-T2 exchange pulse
sequence: The number m of echoes in the first part is varied for different
acquisitions. b) T1-T2 correlation pulse sequence: the recovery time td is incremented
for a series of experiments to encode T1 information. c) D- T2 correlation pulse
sequence with a pulsed field gradient: The strength g or duration δ is changed to
encode diffusion effects. d) D- T2 correlation pulse sequence with a constant field
gradient: The echo time tE1 is varied to obtain attenuation from diffusion.
32 33 Chapter 3
Spatially Resolved D-T2 correlation NMR
of Porous Media
3.1. Introduction
Porous media, such as rock, mortar and membranes, typically show distributions of
pores with different shapes and connectivities. In the field of porous media and in
particular in petro-physics, 2D Laplace NMR provides unprecedented insight into pore
geometry, connectivity and multiphase fluid distribution by diffusion and relaxation of
fluids and gases on the micrometer scale [86-91]. Because many porous objects like
rock and concrete are heterogeneous on the macroscopic scale, an integral analysis of
the microscopic-scale properties yields volume-averaged information. Magnetic
resonance imaging (MRI) techniques resolve this spatial average on the contrast scale
defined by the particular MRI method. The relaxation times T1 and T2 as well as the
diffusion coefficient are desirable NMR parameters in porous media studies that help to
understand the pore-size distribution, the pore connectivity and consequently the
permeability as well as the fluid distribution of the investigated object. These
microscopic parameters are accessed by 1D and 2D Laplace NMR techniques [92-95].
Within the past decade, 2D-Laplace NMR has been employed, for example, to
investigate water flow through pores of different sizes in Castlegate sandstone [80].
Moreover, using this technique, diffusion-relaxation correlations have been developed to
characterize sedimentary rock saturated with oil-water mixtures [85], and diffusiondiffusion correlations have been measured to examine local anisotropy under conditions
of global isotropy [96].
34 However, 2D-Laplace NMR gives information only about integral characteristics of
a given sample with regard to pore-size and pore connectivity. It does not give
information about variations of these parameters across the object under study. It is
therefore desirable to combine MRI with 2D-Laplace NMR to generate information about
fluid transport within defined areas of a sample. The aim in this chapter is to explore
spatially resolved D-T2 correlation NMR as a representative of 2D-Laplace NMR to
exploit the information contained in pixels of similar contrast. This idea has first been
mentioned in 2008 by Petrov and Balcom with reference to one space dimension [97].
In this study this concept is investigated in more detail with spatial resolution in two
dimensions. The use and limitations of this method are shown in this chapter.
Three types of samples are examined, a ceramic sample, packs of glass beads,
and mortar, following the general strategy of first measuring a high-resolution image to
identify regions of similar contrast. Then D-T2 resolved MRI data are acquired with low
resolution and compromising signal-to-noise ratio (SNR) for the benefit of shorter
experimental time. To improve the SNR in the pixel-resolved D-T2 maps, the maps from
low-resolution pixels in regions of similar contrast identified in high-solution images are
added.
3.2. Materials and Experimental Protocol
The ceramic sample is a mixture of α-Al2O3 and γ-Al2O3 consisting of a meso-porous
skeleton with highly aligned, slit-shaped macro-pores and measuring 6.4 mm in height
with a diameter of 6.2 mm. It was prepared by ice templating and sintering [98]. Three
types of glass bead samples were prepared in cylindrical 10 mm diameter glass tubes:
two were divided into two half cylindrical compartments by a membrane and the other is
without membrane. In the first case one compartment was packed with 100 m
diameter glass beads and the other with 700 m diameter glass beads, and both
compartments were filled with water. In the second case, both compartments contained
700 m diameter glass beads, and one compartment was filled with linseed oil and the
35 other water. In the third case the sample is similar to the second case just without
membrane. The mortar sample was prepared from sand, lime putty and water
homogeneously mixed in the volume ratio of 3:2:3 and cast into a 6 mm diameter glass
tube, where it was dried in air for several days. Prior to analysis all samples were
saturated with water for two to three days.
For reasons of sensitivity all NMR measurements were not conducted at low field,
but on a high-field 300 MHz horizontal-bore imaging magnet controlled by a Bruker
Avance 300 spectrometer. The 90o pulse length was 11 µs. The relaxation and imaging
experiments employed Carr-Purcell-Meiboom-Gill (CPMG) sequences with 128 echoes,
whereby the echo time was 1 ms and the imaging gradient strength was 0.3 T/m. This
protocol allowed good exploration of a T2 range up to ca. 1 ms. For the diffusion
experiment with pulsed field gradients (PFG, Fig. 3.1a) a stimulated echo with a
gradient pulse duration δ = 1 ms and a diffusion time Δ = 20 ms was applied when
studying water, while δ = 1.5 ms and Δ = 60 ms were employed to measure the low
diffusion coefficient for oil in the glass bead sample filled with oil and water. The
gradient strength was varied linearly from 0 to 1 T/m over 30 steps to encode the
diffusion information. The D-T2 experiments lasted up to 4 h for 8 scans. All
measurements were repeated with a repetition time of 4 s in order to fully recover the
longitudinal magnetization and dissipate the heat generated by the current pulses in the
rf coil and the gradient coils to avoid heating the samples and evaporating the water.
The data were processed by 2D inverse Laplace transformation with the Schlumberger
algorithm [82].
3.3. Methods
3.3.1 D-T2 sequence with pulsed-field gradients
D-T2 correlation maps were measured with a standard pulse sequence in
inhomogeneous fields (Fig. 3.1a) by diffusion encoding with a modified stimulated echo
36 employing anti-phase pulsed field gradient pairs to cancel the effect of internal gradients
[99] and with CPMG (Carr-Purcell-Meiboom-Gill [100,101]) detection [77] using the
phase cycle listed in Tab. 3.1 [102, 103]. Chapter 4.2 confirms that the internal
gradients are significant and of the order of 1 T/m at 7 T field strength. This method of
measuring D-T2 correlation maps f(D,1/T2) is referred to in the following as the
stimulated-echo method, in short, the SE method. If tE1 << T2 and Δ << T1, the
attenuation of the stimulated echo by diffusion is given by the exponential exp{-q2 D (Δ δ/3)}, where D is the diffusion coefficient, Δ the diffusion time, δ the total duration of
gradient pulses of one anti-phase pulsed gradient pair, and q = G δ, with the gyromagnetic ratio and G the amplitude of the gradient pulse. Furthermore, at short echo
time tE2, signal attenuation by diffusion can be neglected during detection of the CPMG
echo train, which then is attenuated only by T2 according to exp{-n tE2 /T2}, where t = n
tE2 is the detection time axis of the CPMG echo train. Subsequently the echo amplitudes
can be described by
dD d(1/ T )f (D,1/ T )expq D( 1/ 3) expt / T ,
s q 2 ( 1/ 3), t / s 0, 0
2
2
2
2
(3.1)
where f(D,1/T2) is the diffusion-relaxation distribution function. The 2D inverse Laplace
transform of this expression provides the diffusion-relaxation correlation map f(D,1/T2). It
is the convention in NMR to plot D and T2 on logarithmic scales, where the logarithms of
relaxation rate and relaxation time only differ in their sign.
In fluid-filled media with small pores, the limits of validity, within which relaxation
can be neglected in the diffusion-encoding period and diffusion can be neglected in the
relaxation-encoding/detection period, may be hard to fulfill. Furthermore, the SNR is
decreased when detecting a stimulated echo with only half the amplitude of a Hahn
echo. Therefore, as an alternative way to encode diffusion and relaxation, the use of
CPMG echo trains in the presence of an effectively constant gradient was explored with
varying echo time tE (Fig. 3.1 c) [104]. The CPMG echo envelope can be written as
dD d(1 / T )f (D,1 / T )expq Dt / 3 expt / T .
s q 2 t / 3, t / s 0, 0
2
2
2
2
(3.2)
37 In
Figure 3.1. Pulse sequences for D-T2 correlation NMR and back-projection MRI.
From scan to scan the imaging gradients are rotated in the xy plane. a) SE sequence
for D-T2 correlation NMR. Diffusion is encoded with pulsed field gradients in a
modified stimulated echo with echo time tE1, which is detected with a CPMG
sequence with echo time tE2. b) Imaging gradients for back-projection imaging with
D-T2 resolution according to the PFG scheme. c) CPMG sequence for D-T2
correlation NMR. Diffusion is encoded in variable echo times. The gradient field is
turned off only for the rf pulses to limit off-resonance effects. Otherwise the gradient
field is constant in time.
Because for time-invariant gradients q = G tE/2, the D-T2 correlation map f(D,1/T2) can
be retrieved by inverse Laplace transformation of Eqn. (2) when storing the CPMG echo
trains in a two-dimensional matrix with axes proportional to (tE/2)2 t and t. This method
of measuring D-T2 correlation maps f(D,1/T2) is referred to in the following as the CPMG
method. It is also limited in its use because diffusion and relaxation are detected
simultaneously. For a given maximum gradient strength, short echo times are needed to
acquire magnetization components with short T2 relaxation times. Conversely, long
echo times are needed for encoding slow diffusion. This means that one cannot detect
the magnetization components with both short T2 and small diffusion coefficient in such
a D-T2 correlation map acquired in constant gradients. Furthermore, internal gradients
cannot be distinguished from applied gradients.
38 Table 3.1. Phase cycle for SE pulse sequence with CPMG detection (Fig.
1a). Pulses are numbered from left to right
No.
P1(90ºSE)
P2(180ºSE) P3(90ºSE)
P4(180ºSE) P5(90ºSE)
P6(180ºCPMG) Rec.
1
+x
+y
+x
+x
+y
+y
+x
2
+x
+y
−x
+x
+y
+y
−x
3
+x
+y
+x
−x
+y
+y
−x
4
+x
+y
−x
−x
+y
+y
+x
5
+x
+y
+y
+y
+y
+y
+x
6
+x
+y
−y
+y
+y
+y
−x
7
+x
+y
+y
−y
+y
+y
−x
8
+x
+y
−y
−y
+y
+y
+x
3.3.2 D-T2 correlation-resolved MRI
Either way of measuring D-T2 maps can readily be combined with spatial resolution by
employing effectively constant imaging gradients (Fig. 3.1b) and rotating these or the
object from acquisition to acquisition to subsequently reconstruct images by backprojection in combination with 2D Laplace inversion to retrieve D-T2 correlation maps
from each pixel. These schemes were applied in this study without slice selection so
that 2D projections were obtained. Instead of keeping the gradients turned on during the
rf pulses, they were switched on only during each echo. The reasons are twofold: First,
the gradients cannot be kept on for a time long enough to encode T2 information due to
the gradient protection mechanism of the spectrometer, because too long gradient
durations can damage the gradient coils. Second, the excitation bandwidth of the rf
pulses is limited, so that when gradients are kept on during the rf pulses the spins are
excited in a slice only and not in the entire sample volume. Low-resolution backprojection images were constructed from projections obtained by Fourier transformation
of echoes acquired at 16 orientations of constant amplitude gradients equally spaced
39 over a whole circle. The inverse Radon transform of this set of projections was
computed with Matlab® code from MathWorks, Natick, MA, using a Hamming filter.
Back-projection imaging proved to be advantageous on account of the short
transverse relaxation times of both samples. Single-point ramped imaging with T1
enhancement (SPRITE) is a good alternative to image samples with short T2
components [105], but is more demanding on the gradient hardware. In order to keep
the measurement time short, D-T2 resolved low-resolution images were measured in
this work.
The concept of pixel summation is illustrated in Fig. 3.2 by example of a waterfilled porous aluminum oxide sample and 1D T2 distributions. T2 resolved backprojection images were acquired with the CPMG sequence of Fig. 3.1b with an echo
time of 1 ms at low resolution and constant gradient amplitude of 0.3 T/m (Fig. 3.2b). To
improve the signal-to-noise ratio, distributions of T2 (Fig. 3.2c) were calculated for signal
sums over particular pixels from the low-resolution image (Fig. 3.2b), which were
identified by similar contrast in the high-resolution image (Fig. 3.2a). Even small
differences in the 1D relaxation-time distributions can be identified in this way, and
different pore-size distributions can be assigned to the different contrast regions in the
high-resolution image, which was acquired with conventional spin echo imaging at a
field-of-view of 8.1 mm 8.1 mm. Although the image 3.2b does not show any interesting
features, the T2 distributions calculated from the sums of pixels identified in the standard
high-resolution image 3.2a nevertheless do.
40 Figure 3.2. Illustration of the pixel-summation procedure by example of the watersaturated porous Al2O3 sample. a) High-resolution spin-echo image acquired with a
field-of-view of 8.1 mm 8.1 mm and a resolution of 63 m 63 m. Different
contrast regions are identified and labeled 1 to 4. b) Low-resolution image of the
same sample with resolution of the T2 distribution in each pixel. c) Pixel sums of the
T2 distributions from the low-resolution image of each region identified in the highresolution image.
3.4. Results and Discussion
3.4.1 Glass-bead sample filled with oil and water with a
membrane
The D-T2 MRI pulse sequence (Fig. 3.1) was tested with the two-compartment glassbead sample where one compartment contained oil and the other water (Fig. 3.3a). The
high-resolution spin-echo image (Fig. 3.3b) maps the pore space and the membrane
dividing the two compartments by providing T2 weighted contrast yet shows little
difference between the oil and water filled compartments. The low-resolution back-
41 projection image acquired with D-T2 resolution (Fig. 3.3c) does neither resolve the pore
structure nor the dividing membrane but identifies a bright region A and a darker region
B which are assigned to oil and water, respectively, due to a D-T2 filtering artifact from
finite-duration echo times. For oil and water, the T2 distributions overlap (Fig. 3.3d) but
not the D distributions because oil has a diffusion coefficient lower than water (Fig.
3.3e). Figure 3.3f shows the D-T2 correlation map of the sample measured with the
stimulated-echo pulse sequence in Fig. 3.1a without spatial resolution. The projections
along the relaxation dimension and diffusion dimension agree well with the 1D T2
distribution and D distribution measured separately (Fig. 3.3d). The D-T2 distribution
(Fig. 3.3g) obtained from the D-T2 resolved, low-resolution image by summing over all
pixels image agrees well with the integral D-T2 distribution (Fig. 3.3f) measured as a
projection without spatial resolution. The D-T2 distributions extracted from the lowresolution image for region A and region B (Fig. 3.3g and Fig. 3.3h) shows that most
fluid in region A is oil and in region B is water. Residual oil signal detected in the water
compartment and vice versa results from blurring in the low-resolution image. These
measurements underline the validity of the methodical approach to extract 2D Laplace
maps from different regions with ill specified contrast in magnetic resonance images. 3.4.2 Glass-bead sample
Both D-T2 MRI pulse sequences (Fig. 3.1) were compared on the water-filled sample
with two different-size glass beads (Fig. 3.4a). In the fast diffusion limit, the transverse
relaxation rate 1/T2 of a pore saturated with water and observed with a CPMG
sequence is related to the pore size via the surface-to-volume ratio S/V according to
[106]
2
1
1
S 1
2 Gint tE / 2 D ,
T2 T2b
V 3
(3.3)
where T2b is the transverse relaxation time for bulk water, ρ2 is the surface relaxivity, Gint
is the internal gradient due to the susceptibility difference between fluid and matrix, and
42 tE is the echo time. The smaller beads in compartment B give rise to a larger surface-tovolume ratio of the interstitial pore space and a larger internal gradient which both lead
to shorter T2 relaxation time. Conversely, the larger beads in compartment A with
smaller associated surface-to-volume ratio and smaller internal gradient lead to larger
T2. In the high-resolution spin-echo image (Fig. 3.4b) as well as in the low-resolution DT2 resolved back-projection image (Fig. 3.4c), region A with the large beads lights up
because the signal from the water in the pack with small beads is attenuated by more
rapid T2 relaxation as well as by diffusion in stronger internal gradients.
The individual T2 distributions for either bead-pack overlap only partially (Fig. 3.4d)
while the D distributions overlap completely (Fig. 3.4e). The signature of the bead-packs
can therefore be disentangled in spatially resolved D-T2 maps. The integral D-T2 map of
the whole sample (Fig. 3.4f) measured with the pulse sequence in Fig. 3.1a and the DT2 map (Fig. 3.4g) obtained by summation of pixels from the low-resolution image agree
reasonably well and so do the projections along the relaxation dimension and the 1D T2
distribution measured separately (Fig. 3.4d). But it is also noted, that the signal at short
D and short T2 in the 2D D-T2 correlation map is lost. This is because the long echo time
tE1 during the diffusion attenuation period and the stronger internal gradient for smaller
pores lead to significant signal loss. The D-T2 distributions extracted from the lowresolution image for region A and for region B clearly show that the peaks with large
relaxation time and diffusion coefficient are from the pack with the large beads (Fig.
3.4h) and the other peaks from the pack with the small glass beads (Fig. 3.4i).
For comparison with Fig. 3.4f, the D-T2 correlation map was measured without
spatial resolution with the CPMG method depicted in Fig. 3.1c (Fig. 3.4k). The delay
time between gradient and rf pulse in this measurement is quite long, around 3 ms, in
order to reduce the eddy currents to an acceptable level. This leads to a long echo time
and explains why in the projection along the relaxation dimension (green) short T2
components are lost by relaxation. Moreover, long T2 components are shifted towards
shorter relaxation time, and the projection along the diffusion dimension (green)
indicates an apparent diffusion more rapid than in the 1D diffusion measurement (blue).
43 Figure 3.3. Results from the glass-bead sample filled with oil and water. a) Photo of
the glass-bead phantom with two compartments separated by a plastic membrane
and containing water and oil, respectively. b) High-resolution spin-echo image
acquired with an echo time of tE = 3.69 ms with a resolution of x = y = 50 m. c)
Low-resolution back-projection image acquired with D-T2 resolution on 162 pixels. d)
Integral T2 distribution. e) Integral D distribution. f) D-T2 map measured with the SE
method without spatial resolution. On top and on the right, the projections along the
diffusion and relaxation dimensions are shown (green) in comparison with 1D T2 and
D distributions measured individually (blue). g) D-T2 map from the sum over all
pixels. h) D-T2 map from the pixel sum over region A. i) D-T2 map from the pixel sum
over region B.
44 Both effects are explained by the fact that the measurements were done at low gradient
strength of 0.3 T/m and long echo time to avoid eddy currents effects from gradient
switching. As a result, the strength of the applied gradient is comparable to that of the
internal gradients, and higher apparent diffusion coefficients are observed as well as
diffusive attenuation in the T2 dimension. Due to these deficiencies, measurements with
the CPMG sequence are not feasible in high-field studies, although they promise to be
useful with sensors that have constant gradients and low field, for example, logging
tools and the NMR-MOUSE.
3.4.3 Mortar sample
The experimental procedures tested on the glass-bead sample (Sections 3.4.1 and
3.4.2) were subsequently applied to a mortar sample (Fig. 3.5a). However, while for the
glass-bead phantom samples, the structure was known, the significance of the contrast
in the high-resolution image (Fig. 3.5b) of the mortar sample is at first unknown. The
different mortar structures giving rise to bright and dark regions in the image of Fig. 3.5b
are studied by 2D D-T2 resolved MRI in the other plates of Fig. 3.5.
For mortar, the T2 relaxation peaks are generally related to water in three kinds of
environments: The shortest T2 is from water bound in the cement gel structures (CSH),
the intermediate T2 is from water in capillary pores, and the longest T2 is from water in
micro-cracks [107, 108]. Sometimes water in capillary pores gives rise to two peaks
[109]. In the observed T2 distribution (Fig. 3.5d), the peak with largest T2 is assigned to
essentially free water residing in micro-cracks. The two other peaks are assigned to
water in the capillary pores. The T2 components from CSH with a T2 relaxation time
around 100 µs was not detected due to the long echo time of 1ms in our measurements.
In the D-T2 maps (Fig. 3.5f,g) only one peak is observed from water in capillary pores
with higher T2 and higher D along with the peak from free water, while the other peak
from the water in capillary pores with shorter T2 and lower D has already relaxed with
the minimum echo time tE1 = 10 ms that could be used for detection. 45 Figure 3.4. Results from the glass-bead sample. a) Photo of the glass-bead phantom
with two compartments separated by a plastic membrane and containing 100 µm
diameter and 700 µm diameter glass beads. b) High-resolution spin-echo image
acquired with an echo time of tE = 3.69 ms with a resolution of x = y = 50 m. c)
Low-resolution back-projection image acquired with D-T2 resolution on 162 pixels. d)
T2 distributions of either compartment (green and red) and both compartments
together (blue). e) D distribution. f) D-T2 map measured with the SE method without
spatial resolution. On top and on the right, the projections along the diffusion and
relaxation dimensions are shown (green) in comparison with 1D T2 and D
distributions measured individually (blue). g) D-T2 map from the sum over all pixels.
h) D-T2 map from the pixel sum over region A. i) D-T2 map from the pixel sum over
region B. k) D-T2 map acquired with the CPMG method in the presence of an
effectively constant gradient with varying echo time.
46 Subsequently spatially resolved D-T2 correlation maps were generated. The D-T2
distribution (Fig. 3.5g) obtained when summing over all pixels of the sample agrees
reasonably well with the distribution (Fig. 3.5f) measured as a projection without spatial
resolution. The D-T2 correlation map for the dark regions in the high-resolution image
(Fig. 3.5h) shows highest signal from small pores with short T2 relaxation time and low
diffusion coefficient. The D-T2 correlation map for the light region (Fig. 3.5i) shows
predominantly signal from large pores with long T2 relaxation time and high diffusion.
3.4.4 Glass-bead sample filled with oil and water without a
membrane
In order to explore the application of this method to rocks in petroleum industry, glassbead sample filled with oil and water without membrane was measured to simulate the
sedimentary case. High-resolution image of the sample was obtained and different
regions of the sample were defined according to the contrast difference. The magnitude
difference of signal between two regions is not large this is due to the similarity of T2
relaxation for oil and water. The high-resolution image (Fig. 3.6b) is used to define
different regions of the sample according to the difference of the contrast in the images.
The boundaries between the two regions are not so clear. This is because that oil and
water are not completely separated but mixed around regions near the boundaries.
Then this result can be used to characterize the regions in low resolution image (Fig.
3.6c). The D-T2 distribution (Fig. 3.6g) obtained from the D-T2 resolved, low-resolution
image such as Fig. 3.6c by summing over all pixels image agrees well with the integral
D-T2 distribution (Fig. 3.6f) measured as a projection without spatial resolution. Fig.3.6h
and Fig. 3.6i clearly show that this method can identify different fluids in this sample: in
one region most fluid is oil and the other is water.
47 Figure 3.5. Results from the mortar sample. a) Photo of the mortar sample. b) Highresolution spin-echo image acquired with an echo time of tE = 3.69 ms with a
resolution of x = y = 53 m. c) Low-resolution back-projection image acquired with
D-T2 resolution on 162 pixels. d) T2 distribution. e) D distribution. f) D-T2 map without
spatial resolution. On top and on the right, the projections along the diffusion and
relaxation dimensions are shown (green), in comparison with 1D T2 and D
distributions measured individually (blue). g) D-T2 map from the sum over all pixels.
h) D-T2 map from the pixel sum over the dark part. i) D-T2 map from the pixel sum
over the bright part.
48 3.5. Conclusion
Spatially resolved D-T2 correlation maps were measured for four different samples:
three glass-bead samples filled with oil or water and a mortar sample saturated with
water. Different regions of the samples were identified by the D-T2 correlation maps to
obtain the local information such as pore size. Different fluids were distinguished in
different parts of the samples. Three different methods were used to shorten the
measurement time: (1) T2 and imaging information were encoded at the same time to
save measurement time. (2) Low resolution images were obtained during the backprojection period. (3) Voxels with similar contrast in the low resolution images were
added to increase the signal-to-noise ratio.
Two methods of generating spatially resolved D-T2 maps by back-projection
imaging were investigated. With the stimulated echo sequence, CPMG echo trains are
acquired with different diffusion weights. With the CPMG method, echo trains are
acquired with different echo times so that diffusion and relaxation encoding are
intertwined. Due to the use of pulsed gradients, both methods are limited in detecting
rapidly relaxing components. Moreover, the implementation of the CPMG method on the
available Avance 300 spectrometer was hampered by eddy currents from gradient field
pulses with varying duration, an effect, which did not impact the measurements with the
SE method. It is reasonable to expect, that these limitations will be less severe when
time-invariant gradients are employed.
In these studies on porous material models from glass beads, mortar and ceramic
we found a way of imaging fluid-filled macroscopic objects with functional microscopic
contrast that can be applied to cylindrical samples without the conventional need of
pulsing magnetic gradient fields but by rotating the sample instead. This means that we
expect that images with diffusion-relaxation correlation contrast can be measured in the
future with compact instruments that do not require bulky and heavy gradient amplifiers
but only a motor to rotate the cylindrical sample inside the magnet, a simple way well
suited for rugged service on a drilling platform or in a geophysical testing laboratory.
49 Figure 3.6. Results from the glass-bead sample filled with oil and water without
membrane. a) Photo of the glass-bead phantom with two compartments separated
by a plastic membrane and containing water and oil, respectively. b) High-resolution
spin-echo image acquired with an echo time of tE = 3.69 ms with a resolution of x =
y = 50 m. c) Low-resolution back-projection image acquired with D-T2 resolution
on 162 pixels. d) Integral T2 distribution. e) Integral D distribution. f) D-T2 map
measured with the SE method without spatial resolution. On top and on the right, the
projections along the diffusion and relaxation dimensions are shown (green) in
comparison with 1D T2 and D distributions measured individually (blue). g) D-T2 map
from the sum over all pixels. h) D-T2 map from the pixel sum over region A. i) D-T2
map from the pixel sum over region B.
50 The methods of spatially resolved 2D Laplace NMR studied in this investigation,
generate information about correlations of diffusion coefficients and transverse
relaxation time distributions with spatial resolution. Unlike the 2D Laplace NMR method
alone which gives highly resolved data averaged across a macroscopically
heterogeneous sample, Laplace-resolved MRI enables regions of similar contrast to be
characterized by their D-T2 distributions. We anticipate this method to be most
appreciated in studies of multi-phase fluids in porous media, for example, oil and water
in rock.
51 Chapter 4
Gint2D - T2 Correlation NMR of Porous
Media
4.1. Introduction
An internal gradient Gint is the linear approximation describing a distortion of magnetic
field B0, which arises from the magnetic susceptibility difference between different
phases in an object. In NMR studies of porous media, an internal gradient typically
refers to the magnetic field inside fluid filled pores. It is approximately described by
Gint = B0 / r,
(4.1)
where r is the radius of the pore. As the strength of the internal gradient is proportional
to the strength of the applied magnetic field, effects of internal gradients are pronounced
at high field (B0 > 2 T) and can often be neglected at low field. On the one hand, internal
gradients affect MRI contrast as well as relaxation and diffusion measurements, so that
a variety of methods, most notably the bipolar gradient pulse method have been
developed to reduce the effects of internal gradients [110 - 114]. On the other hand, the
strength of the internal gradient relates to the pore geometry, so that distributions of
internal gradients can be used to characterize the heterogeneity of the pore space.
The Decay due to Diffusion in the Internal Field (DDIF) method uses a stimulated
echo to measure the time-dependent evolution of magnetization in the internal magnetic
field [115]. The decay constants are obtained by inverse Laplace transformation
providing estimates of structure parameters, like pore size and surface-to-volume ratio.
This concept has been extended to retrieve spatially resolved information about the
52 distributions of internal gradient strength and direction in glass column samples by 2D
spin-warp imaging [116 - 118]. Audoly et al. showed that the internal magnetic field
correlation function is similar to the structure auto-correlation function, which relates to
the sample geometry. This internal field correlation function can be measured in
experiments with a pair of symmetric (without internal magnetic field effect) and
asymmetric (with internal magnetic field effect) stimulated echo Pulsed Field Gradients
(PFG). Results from simulation and experiment on glass beads were compared [119,
120]. Moreover, the pore structure has been characterized by correlating the internal
magnetic field gradient Gint and other NMR parameters such as the transverse
relaxation time T2 and the longitudinal relaxation time T1 [121-125]. Due to the spatial
dependence of the internal gradient on the pore structure, spatially resolved Gint2 D – T2
correlations were measured in this study to explore the heterogeneity of porous media.
Three kinds of samples were measured. First, a case is studied, where the spread
of internal magnetic field gradients dominates. Here the sample consists of water
saturated, different-diameter glass beads. Then a case is investigated, where
differences in diffusion dominate. Here the sample consists of glass beads filled with oil
and water. Finally a water saturated mortar sample is studied to explore the application
of this method in a more demanding and realistic situation.
4.2. Materials and Experimental Protocol
The samples investigated are the same as those used in our previous study of spatially
resolved D - T2 correlation NMR (chapter 3) [131]. Two types of glass bead samples
were prepared in cylindrical 10 mm diameter glass tubes divided into two half cylindrical
compartments by a membrane. In one case one compartment was packed with 100 m
diameter glass beads and the other with 700 m diameter glass beads, and both
compartments were filled with water. In the other case, both compartments contained
700 m diameter glass beads, and one compartment was filled with linseed oil and the
53 other with water. The mortar sample was prepared from sand, lime putty and water
homogeneously mixed in the volume ratio of 3:2:3 and cast into a 6 mm diameter glass
tube, where it was dried in air for several days. Prior to analysis the sample was
saturated with water for two to three days.
All samples were measured on both an AV300 and an AV700 Bruker NMR
spectrometer, to also explore the relationship between the internal magnetic field
gradient and the polarizing magnetic field. For simplicity and to assure short deadtime,
our pulse sequence was based on the back-projection method, employing a CPMG
sequence with two echo times for consecutive encoding of Gint2D and T2 (Fig. 4.1). The
90o pulse length was 11 µs. The information on Gint2D was encoded by the first part of
the pulse sequence of constant duration t0 = 40 ms by varying the number m of 180o
pulses from 1 to 66 in 30 steps, which is equivalent to varying the echo time. The
relaxation and imaging encoding was accomplished in the second part of the CPMG
echo train with 256 echoes, using a constant echo time of 600 µs and a strength of the
imaging gradient of 0.3 T/m. The Gint2D - T2 experiments lasted up to 2 h with 4 scans.
All measurements were repeated with a repetition time of 4 s in order to fully recover the
longitudinal magnetization and dissipate the heat generated by the current pulses in the
rf coil and the gradient coils to avoid heating the samples and evaporation of the water.
The data were processed by 2D inverse Laplace transformation with the Schlumberger
algorithm [126].
4.3. Methods and Theory
The Gint2D - T2 correlation map was measured with a modified CPMG sequence, which is
split into two parts [127]. By varying the echo time tE1, Gint2D is encoded by the first part
while the total encoding time for the first part t0 kept constant so that the relaxation
attenuation remains constant and only the effect of the internal gradients varies. The
second part of the pulse sequence is a normal CPMG sequence, which encodes
54 Figure 4.1. Pulse sequences for Gint2D - T2 correlation NMR and back-projection
MRI. From scan to scan the imaging gradients are rotated in the xy plane. a)
Modified CPMG sequence for Gint2D - T2 correlation NMR. Gint2D is encoded in the
first part of the CPMG sequence with different echo times tE1. b) Imaging gradients
for back-projection imaging with Gint2D - T2 resolution. The gradient field is turned off
only for the rf pulses to limit off-resonance effects and accommodate the gradient
protection of the spectrometer. Otherwise the gradient field is constant in time.
transverse relaxation. By setting a short echo time tE2 signal attenuation from Gint2D is
minimized. When neglected, the echo attenuation can be described as
t 2 t
t2 t
2
2
2
s E1 0 ,t / s 0,0 d(Gint
D ) d(1 / T2 )f (Gint
D,1 / T2 )exp Gint
D E1 0 exp t / T2 , (4.2)
2 3
2 3
where f(Gint2D, 1/T2) is the joint probability density of finding pairs of (Gint2D, T2), t = n tE2,
and D is the diffusion coefficient of the fluid. Due to the fact, that the acquisition of the
signal starts after a time interval t0 the signal from short T2 components, which usually
go along with strong internal gradients, can be lost in this experiment.
Equation (4.2) appears deceptively simple, but its interpretation for fluids in porous
media needs some discussion. The fluids are confined in pores where their diffusion is
55 restricted. Restricted diffusion of fluid molecules in the presence of a gradient is
characterized by three length scales, the diffusion length, the dephaseing length and the
pore size [128, 129]. The diffusion length is lD = (D ) 1/2, where is the diffusion time of
the molecules. For the CPMG sequence the diffusion length is lD = (D tE/2)1/2, where tE is
the echo time. The dephaseing length is lG = (2 D / Gint)1/3, where is the
gyromagnetic ratio. To properly account for its interpretation as a dephasing length, we
include a factor 2 in contrast to the literature [129]. It is a measure of the distance,
which molecules must travel to accumulate a 2 phase shift. The magnetization of
molecules that diffuse further than the dephaseing length is completely dephased and
cannot contribute to an echo. Finally there is the length ls of the pore. These three
length scales determine how the molecular motion is mapped in the Gint2D - T2
correlation diagram.
When the diffusive length satisfies lD << ls and lD << lG, the regime is called free
diffusion regime. In this regime only a small fraction of all molecules experience the
walls of the pores, the restriction of diffusion is not severe, and the diffusion attenuation
exponent depends on tE3. In this regime, Eqn. (4.2) is still valid but the diffusion
coefficient D should be replaced by the apparent diffusion coefficient Dapp. The second
regime is the motional averaging regime, in which lS is the shortest length scale, i. e. ls
<< lG and ls << lD. In this regime the magnetic field inhomogeneities are averaged out by
the diffusive motion, and the echo amplitude decays much slower. The third regime is
the localization regime, in which lG is the shortest length scale, i. e. lG << ls and lG << lD.
In this regime the signal is mainly from the spins within a distance lG of the pore walls,
where restricted diffusion has reduced the signal loss from dephaseing of magnetization
components. The spins far from the pore walls, however, contribute no signal because
their magnetization has completely dephased from diffusive translation though the
gradient field. The diffusion attenuation exponent varies with tE in this regime.
In the case that the internal magnetic field can no longer be approximated by a
linear field, an effective internal gradient Gint,eff can be introduced describing the average
field inhomogeneity over the length lG = (2 D / Gint,eff)1/3 [130]. For the whole sample
the total magnetic field variation is bounded by B0, this means that Gint,eff lG B0.
56 Then the maximal internal gradient that can be measured in the sample can be
estimated from
Gint,max ( /( 2 D))1/2 ( B0)3/2,
(4.3)
and the corresponding structural length is given by
l* = B0 / Gint,max = (2 D /( B0))1/2,
(4.4)
which is also the shortest dephaseing length. The quantity l* is a critical length which
can be used to characterize the pore size. For pore sizes smaller than l* the field
inhomogeneties are averaged out by restricted diffusion and the magnetization of the
pore fluid is unaffected by the internal gradients in high magnetic field except for a really
short echo time. This is the motional averaging regime. Magnetization from fluids in
pores larger than l* belongs to the localization regime or free diffusion regime, where
the magnetization decay depends on the diffusion time. In this work, Gint2D - T2
correlation maps are measured, where the effects of internal gradients Gint and diffusion
D cannot be separated. Given maximum diffusion lengths of 6.8 m for water diffusion
with D = 2.310-9 m2/s and maximum diffusion times of 20 ms, we assume the validity of
the free diffusion regime for all three samples and with it the validity of Eqn. (4.2). All
experimental data were inverted according to Eqn. (4.2), and the validity of this
inversion and the meaning of the results from this inversion are discussed below.
Spatially resolved Gint2D - T2 maps were acquired by back-projection imaging with
pulsed space encoding gradients applied during the relaxation-detection period of the
sequence (Fig. 4.1). The gradient direction was varied from scan to scan in 16 steps.
Back-projection imaging was used in order to achieve short echo times. The basic
strategy of obtaining spatially resolved Gint2D - T2 maps follows the same way as
discussed in chapter 3 for measuring spatially resolved D - T2 maps [131]. First regions
of similar contrast are identified in a conventional high-resolution spin-echo image. Then
Gint2D -T2 resolved MRI data are acquired with low resolution for the benefit of shorter
experimental time. The Gint2D -T2 maps from the low-resolution pixels in regions of
similar contrast identified in the high-solution image were added to obtain maps for the
57 sample regions of similar contrast. Low resolution images from back-projection imaging
were constructed by Fourier transformation and inverse Radon transformation, which
were computed with Matlab® code.
4.4. Results and Discussion
4.4.1 Glass-Bead sample
To interpret the experimental data, the applicable diffusion regime needs to be
determined by estimating the three diffusion lengths lD, lG, and ls. The quantity B0 can
be estimated from the inhomogeneous line-width of the NMR spectrum according to
= B0 / (2).
(4.5)
The glass-bead sample contained two kinds of glass beads with diameters of 100 m
and 700 m. The size ls,min of the smallest pores is about 20 m. The structural length l*
follows from Eqn. (4.4) to 0.85 m and 0.63 m for the AV300 and AV700
spectrometers, respectively. Thus all pores in the sample are large pores because ls,min
>> l*, and from this diffusion is estimated to occur in the free diffusion regime or in the
localization regime. The echo times for these experiments range from 600 s to 40 ms
and thus lD is in the range from 0.83 m to 6.8 m which means that lD << ls,min in most
cases.
The internal gradients estimated from the data measured with the AV300
spectrometer at 7 T range from 0.25 T/m to 19 T/m (Fig. 4.2), and the calculated values
of the dephasing length lG range from 1.3 m to 5.6 m. Generally small pores generate
strong internal gradients, which correspond to short lG. The corresponding signal can
only be detected at short echo time which means short diffusion length lD due to short
T2. Large pores generate weak internal gradients. This corresponds to long lG, and their
58 signal attenuation can mainly be detected at longer echo time due to longer T2. Thus at
7 T, the molecular diffusion for this sample is in the region between the free diffusion
regime and the localization regime due to lG lD. In this case the echo attenuation due
to diffusion in the internal gradients still shows a strong dependence on the echo time,
which is similar to the free diffusion case. Thus inversion of the data following Eqn. (4.2)
is still acceptable. For the measurement with the AV700 spectrometer at 16 T, the
internal gradient is stronger but the dephaseing length depends on the gradient strength
only weakly so that the discussion above remains valid.
The measurements from the glass-bead sample at 7 T with the AV300
spectrometer are summarized in Fig. 4.2. In the high-resolution spin-echo image (Fig.
4.2c) as well as in the low-resolution Gint2D - T2 resolved back-projection image (Fig.
4.2d), region A with the large beads lights up. This is because the NMR signal in
compartment B with the larger glass beads is associated with a smaller surface-tovolume ratio of the interstitial pore space and a smaller internal gradient, so that T2 is
larger. Conversely, the fluid in compartment B with the smaller glass beads is
associated with a larger surface-to-volume ratio and a larger internal gradient giving rise
to shorter T2. Thus the signal from the water in the pack with small beads is attenuated
by more rapid T2 relaxation as well as by diffusion in stronger internal gradients. The
individual T2 distributions for either bead-pack overlap only partially (Fig. 4.2b) and this
signature of the bead-packs can be disentangled in spatially resolved D-T2 maps. The
internal gradient value on the right hand side of the maps (Fig. 4.2e-h) is calculated by
the value on the left side of the maps under the assumption that the diffusion coefficient
of the fluid molecules is constant across the sample, taking the bulk water diffusion
coefficient in this case. Within the validity of this assumption, the right hand side of the
maps represents the distribution of apparent internal gradients.
All maps show a negative correlation between Gint2D and T2. This indicates, that
the impact of the gradient dominates the impact of diffusion in the pores and that the
f(G2D,T2) maps of the glass-bead sample approximate the internal-gradient - relaxation
maps. From the experimental data the order of magnitude of the internal gradients can
59 Figure 4.2. Summary of measurements from the glass-bead sample at 7 T with the AV300
spectrometer. a) Photo of the glass-bead phantom with two compartments separated by a
plastic membrane and containing 100 µm diameter and 700 µm diameter glass beads. b) T2
distributions of either compartment (green and red) and both compartments together (blue). c)
High-resolution spin-echo image acquired with an echo time of tE = 3.69 ms with a resolution of
x = y = 50 m. d) Low-resolution back-projection image acquired with Gint2D - T2 resolution on
162 pixels. e) Gint2D -T2 map measured without spatial resolution. On top and on the right, the
projections along the internal gradient and the relaxation dimensions are shown (green) in
comparison with 1D T2 distributions measured individually (blue). f) Gint2D - T2 map from the sum
over all pixels. g) Gint2D - T2 map from the pixel sum over region A. h) Gint2D - T2 map from the
pixel sum over region B.
60 be estimated to be 1 T/m assuming a diffusion coefficient of free bulk water molecules.
The integral Gint2D - T2 map of the whole sample (Fig. 4.2e) measured with the pulse
sequence in Fig. 4.1a and the Gint2D - T2 map (Fig. 4.2f) obtained by summation of pixels
from the low-resolution image agree reasonably well. The signal at strong internal
gradient and short T2, however, in the 2D Gint2D -T2 correlation map is attenuated much.
This is because the long preparation time t0 during the internal gradient encoding period
and the stronger internal gradient for smaller pores lead to significant signal loss. Figure
4.2g and Fig. 4.2h show that the water in the region with the small glass beads (region
B) experiences stronger internal gradients and smaller relaxation times and the water in
the region with the large glass beads (region A) experiences weaker internal gradients
and larger relaxation times.
Figure 4.3 shows the experimental results measured at 16 T with the AV700
spectrometer. Due to the higher magnetic field, the 2D Gint2D - T2 correlation map
presents distributions with shorter T2 and higher internal gradients. One observation
should be mentioned that the measured maximum internal gradient at 16 T is similar to
that at 7 T. The reasons are twofold: First, the signal from the smallest pores having
strongest internal gradient and shortest T2 is lost at this high magnetic field in the
deadtime of the experiment. Second, due to the existence of stronger internal gradients
the dephasing length is shorter, so that the diffusion of the water molecules deviates
more from the free diffusion regime, and the echo attenuation from diffusion shows a
weaker dependence on the echo time. As a result, when inverting the experimental data
according to Eqn. (4.2), the internal gradient strength is underestimated.
4.4.2 Glass-Bead sample filled with oil and water
For the two-compartment glass-bead sample filled with water the negative correlation of
the Gint2D - T2 maps (Figs. 4.2 and 4.3) are dominated by the distribution of internal
gradients and the distribution of relaxation times. These maps are contrasted by the
Gint2D - T2 maps of the two-compartment glass-bead sample where one compartment
61 Figure 4.3. Summary of measurements from the glass-bead sample at 6 T with the AV700
spectrometer. a) Photo of the glass-bead phantom with two compartments separated by a
plastic membrane and containing 100 µm diameter and 700 µm diameter glass beads. b) T2
distributions of either compartment (green and red) and both compartments together (blue). c)
High-resolution spin-echo image acquired with an echo time of tE = 3.69 ms with a resolution of
x = y = 50 m. d) Low-resolution back-projection image acquired with Gint2D - T2 resolution on
162 pixels. e) Gint2D - T2 map measured without spatial resolution. On top and on the right, the
projections along the internal gradient and relaxation dimensions are shown (green) in
comparison with 1D T2 distributions measured individually (blue). f) Gint2D - T2 map from the sum
over all pixels. g) Gint2D - T2 map from the pixel sum over region A. h) Gint2D - T2 map from the
pixel sum over region B.
62 is filled with oil and the other with water (Figs. 4.4 and 4.5). Here the dominating impact
is by the diffusion coefficient and the relaxation time. Again one needs to determine
which diffusion regime is applicable. The diffusion of water is similar to the case
discussed before. Yet oil has a much smaller diffusion coefficient albeit magnetic
susceptibility similar to that of water. This leads a much shorter lD and a similar lG.
Consequently the diffusion of oil in the pack of 700 m diameter glass beads is
completely free, because lD << ls and lD << lG. Thus Eqn. (4.2) is valid for inverting the
experimental data.
The results measured at 7 T with the AV300 spectrometer are summarized in
Fig. 4.4. The high-resolution spin echo image (Fig. 4.4b) depicts two regions of the
sample containing oil and water separately, which are divided by a plastic membrane.
While the high-resolution image shows little contrast between two regions, the lowresolution back-projection image (Fig. 4.4c) acquired with the Gint2D - T2 resolved MRI
pulse sequence (Fig. 4.1) provides good contrast between the two regions due to the
diffusion filter effect activated by the presence of the internal gradient. In order to
elaborate the Gint2D - T2 distribution, Figs. 4.4f and 4.4g show the Gint2D - T2 correlation
maps for the water and the oil compartments separately. The T2 distributions overlap
completely for the two compartments, but in the Gint2D dimension the distributions of the
two compartments overlap only for small parts and they are separated by two orders of
magnitude. The internal gradient scale on the right hand side of the maps (Figs. 4.4f-g)
has been calculated from the values on the left hand side of the maps under the
assumption that the diffusion coefficient of the fluid molecules is constant across the
compartment with a value of the diffusion coefficient of 1.92×10⁻⁹ m2/s for water and
1×10-11 m2/s for oil from Fig. 4.4e [131]. As the internal gradient distributions for the oil
and the water compartments water are similar, the difference of the signal positions in
the Gint2D dimension is mainly due to the different diffusion coefficients. The Gint2D - T2
correlation map (Fig. 4.4h) for whole samples agrees well the Gint2D -T2 correlation map
(Fig. 4.4i) obtained by summation of pixels from the low-resolution image. By
comparison to Figs. 4.4f-g, it is clear that the biggest peak in these two maps is mostly
from water and only a small portion of the peak is from oil. The Gint2D - T2 distributions
extracted from the low-resolution image for regions A and region B (Figs. 4.4j and 4.4k)
63 Figure 4.4. Summary of measurements at 7 T with the AV300 spectrometer from the glassbead sample filled with oil and water. a) Photo of the glass-bead phantom with two
compartments separated by a plastic membrane and containing water and oil. b) Highresolution spin-echo image acquired with an echo time of tE = 3.69 ms with a resolution of x =
y = 50 m. c) Low-resolution back-projection image acquired with Gint2D - T2 resolution on 162
pixels. d) Integral T2 distribution. e) D - T2 map. On top and on the right, the projections along
the diffusion and relaxation dimensions are shown (green) in comparison with 1D T2 and D
distributions measured individually (blue). f) Gint2D - T2 map of a glass beads filled with water. g)
Gint2D - T2 map of glass-bead pack filled with oil. h) Gint2D - T2 map measured without spatial
resolution. i) Gint2D - T2 map from the sum over all pixels. j) Gint2D - T2 map from the pixel sum
over region A. k) Gint2D - T2 map from the pixel sum over region B.
64 show that most fluid in region A is oil and in region B is water. Residual oil signal
detected in the water compartment and vice versa results from blurring in the lowresolution image.
The results from measuring the two-compartment glass-bead sample filled with
oil and water measured at 16 T with the AV700 spectrometer are summarized in Fig.
4.5. Compared to the distributions measured at 7 T, the Gint2D - T2 distributions at 16 T
are shifted in the positive direction of Gint2D values. This is due to the larger internal
gradient present at the higher polarizing magnetic field, which is identified on the right
hand side of the maps (Figs. 4.5e - f). Similar to the results at 7 T, the Gint2D - T2
distributions for whole sample without spatial resolution (Fig. 4.5g) and with spatial
resolution (Fig. 4.5h) are obtained and they agree sufficiently well with each other.
Regions A and B contain most of the oil and water signals separately as identified in the
corresponding Gint2D - T2 distributions (Figs. 4.5i - j).
4.4.3 Mortar
Following the study of the method with glass-bead samples of known structure reported
in Sections 4.4.1 and 4.4.2, a mortar sample was studied, which has an a priori
unknown structure. Again, one needs to estimate the three different lengths lD, ls, and lG
to determine which diffusion regime applies. The characteristic length ls of the pore can
be estimated from the D - T2 map (Fig. 4.6e) [131]. The shortest value ls,min exist in the
smallest pores which have shortest T2 and lowest diffusion coefficient, giving ls,min = 2
(Deff,min Δ)1/2 = 9 m. It is possible that there are pores smaller than 9 m, but these
cannot be detected in this experiment because the T2 relaxation times of these pores
are too short. The critical length l* of mortar sample is 1.4 m at 7 T and 0.7 m at 16 T.
Therefore, the diffusion of water molecules in the mortar sample is in the free diffusion
regime or the localization regime with l* << ls,min. Similar to the glass-bead samples the
diffusion length lD is in a range from 0.83 m to 6.8 m which means that lD << ls,min for
65 Figure 4.5. Summary of measurements at 16 T with the AV700 spectrometer from the glassbead sample filled with oil and water. a) Photo of the glass-bead phantom with two
compartments separated by a plastic membrane and containing water and oil. b) Integral T2
distribution. c) High-resolution spin-echo image acquired with an echo time of tE = 3.69 ms with
a resolution of x = y = 50 m. d) Low-resolution back-projection image acquired with Gint2D T2 resolution on 162 pixels. e) Gint2D - T2 map of the glass bead pack filled with water. On top
and on the right, the projections along the internal gradient and relaxation dimensions are
shown (green) in comparison with 1D T2 distributions measured individually (blue). f) Gint2D - T2
map of a glass bead pack filled with oil. g) Gint2D - T2 map measured without spatial resolution.
h) Gint2D - T2 map from the sum over all pixels. i) Gint2D - T2 map from the pixel sum over region
A. j) Gint2D - T2 map from the pixel sum over region B.
66 most echo times. The apparent internal gradient measured at 7 T can be obtained from
Fig. 4.6f, which ranges from 0.1 T/m to 10 T/m. Thus the dephaseing lengths lG range
from 1.6 m to 7.4 m, and lG lD << ls,min is true for most echo times. A diffusion regime
between free diffusion regime and localization regime applies and the inversion of the
data following Eqn. 4.2 still valid for these experiments. For the data measured at 16 T
the discussion is similar due to the weak dependence of lG on the strength of internal
gradient.
The T2 relaxation peaks of mortar relate to water in three kinds of environments:
The shortest T2 is from water bound in the cement gel structures (CSH), the
intermediate T2 is from water in capillary pores, and the longest T2 is from water in
micro-cracks [107, 108]. Sometimes water in capillary pores gives rise to two peaks
[109]. In the T2 distribution of the measured mortar sample (Fig. 6b), the peak with
largest T2 is assigned to essentially free water residing in micro-cracks. The two other
peaks are from water in capillary pores. The T2 component from CSH with a T2
relaxation time around 100 µs was not detected due to the long internal gradient
encoding period of 40 ms in our measurements. In the Gint2D - T2 maps (Fig. 4.6f, g) the
peak from the water with shortest T2 and lowest D has already relaxed within the long
preparation time t0. The internal gradient value on the right hand side of the maps (Fig.
4.6f - i) has been calculated from the Gint2D value on the left hand side assuming that the
diffusion coefficient of the fluid molecules is constant across the sample and
corresponds to that of bulk water. Within the validity of this assumption the right hand
side of the maps represents the apparent internal gradient dimension. The maps show a
negative correlation between Gint2D and T2. Similar to the glass beads sample filled with
water in Sec. 4.4.1 the impact of the gradient on the NMR signal dominates the
impact of the diffusion coefficient in the pore so that the f(G2D,T2) maps of the mortar
sample approximate internal gradient-relaxation maps.
Subsequently spatially resolved Gint2D - T2 correlation maps were generated. The
Gint2D -T2 distribution (Fig. 4.6g) obtained when summing over all pixels of the sample
agrees reasonably well with the distribution (Fig. 4.6f) measured without spatial
67 Figure 4.6. Summary of measurements at 7 T with the AV300 spectrometer for the mortar
sample. a) Photo of the sample. b) High-resolution spin-echo image acquired with an echo time
of tE = 3.69 ms with a resolution of x = y = 53 m. c) Low-resolution back-projection image
acquired with Gint2D - T2 resolution on 162 pixels. d) Integral T2 distribution. e) D - T2 map. On
the top and the right, the projections along the diffusion and relaxation dimensions are shown
(green) in comparison with 1D T2 and D distributions measured individually (blue). f) Gint2D - T2
map without spatial resolution. g) Gint2D - T2 map from the sum over all pixels. h) Gint2D - T2 map
from the pixel sum over the dark regions. i) Gint2D -T2 map from the pixel sum over the bright
regions.
68 resolution. The Gint2D - T2 correlation map for the dark regions in the high-resolution
image (Fig. 4.6h) shows highest signal from small pores with short T2 relaxation time
and strong internal gradient. The Gint2D -T2 correlation map for the light region (Fig. 4.6i)
shows predominantly signal from large pores with long T2 relaxation time and weak
internal gradient.
The results from the Gint2D - T2 resolved MRI study of the mortar sample at 16 T
are summarized in Fig. 4.7. The measured minimum gradients are shifted to higher
values due to a higher polarizing magnetic field of 16 T. The measured maximum
gradients, however, are about the same as those detected at 7 T. This is due to the fact
that with stronger internal gradients more signal is lost during the preparation period t0
so that the internal gradients from small pores with gradient strengths greater than 10
T/m cannot be detected. The Gint2D - T2 correlation map for the light region (Fig. 4.7i)
shows highest signal from large pores with long T2 relaxation time and weak internal
gradient.
4.5. Conclusion
All experimental data were inverted by 2D Laplace transformation following Eqn. (4.2),
which is valid for free diffusion. The validity of the inversions of the date from the
samples, where the diffusion is restricted, is discussed in each cases. Generally, for
high magnetic field, the critical length l* is very small (smaller than 0.5 m), so the size
of most of pores in porous media such as rock and mortar is larger than l*. The diffusion
of the liquid molecules reported in this study was found to be in between the free
diffusion and the localization regimes where the echo attenuation due to diffusion in the
presence of internal gradients still strongly depends on the echo time similar to the free
diffusion case and the inversion is acceptable. With increasing magnetic field the
dephaseing length lG decreases and the dependence of the echo attenuation on the
echo time is weaker. At high magnetic field, the diffusion behavior deviates more from
69 Figure 4.7. Summary of measurements at 16 T with the AV700 spectrometer for the mortar
sample. a) Photo of the mortar sample. b) Integral T2 distribution. c) High-resolution spin-echo
image acquired with an echo time of tE = 3.69 ms and with a resolution of x = y = 53 m. d)
Low-resolution back-projection image acquired with Gint2D - T2 resolution on 162 pixels. e) Gint2D
- T2 map without spatial resolution. On top and on the right, the projections along the internal
gradient and relaxation dimensions are shown (green) in comparison with 1D T2 distributions
measured individually (blue). f) Gint2D - T2 map from the sum over all pixels. g) Gint2D - T2 map
from the pixel sum over the dark regions. h) Gint2D - T2 map from the pixel sum over bright
regions.
70 Eqn. (4.2) and the internal gradient is underestimated. At low field, where the
dephaseing length lG is much larger due to much weaker internal gradients, the diffusion
in most pores obeys the free diffusion regime where lD << Ls and lD << lG. So inversion
of the data following Eqn. (4.2) gives more reliable values when measured at low
magnetic field. However, the signal-to-noise ratio is much lower at low magnetic field,
which translates into measurement times unacceptably long for the small samples
studied in this investigation.
The Gint2D - T2 correlation maps were obtained for three different samples: a twocompartment glass-bead sample filled with water, a two-compartment glass-bead
sample filled oil and water, and a mortar sample. For the first sample, the impact of the
gradient dominates the impact of diffusion in the pore, so that a negative correlation
between Gint2D and T2 was observed. For the second sample, another case of the Gint2D T2 correlation was measured where diffusion and relaxation dominate the measured
signal. In the first case, the f(G2D, T2) maps of the sample approximate internal
gradient-relaxation maps and the internal gradient value could be calculated with the
assumption that the diffusion coefficient of the fluid molecules is constant across the
sample. Lastly Gint2D -T2 correlation maps of the mortar sample were measured and
internal gradient distributions were estimated. Moreover, spatially resolved Gint2D - T2
correlation maps were acquired for the three samples at 7 T and at 16 T, and the
structural heterogeneity of samples could be characterized in terms of average Gint2D -T2
correlation maps obtained by pixel summation from regions of similar contrast. Pixel
summation and low spatial resolution have been chosen to accelerate the measurement
time. In the case of the glass-bead sample filled with oil and water, the results indicate
that the Gint2D -T2 MRI method can be used to distinguish oil and water in rocks.
Compared to measurements on 7 T, the experiments on 16 T lose more signals from
short T2 components, which means that the 7 T spectrometer is the better choice for this
type of experiments.
71 Chapter 5
Conclusions and Outlook
2D Laplace NMR was frequently used to characterize porous media on a microscopic
level in recent years. As is well known MRI is a powerful method to investigate the
heterogeneities of porous materials on a macroscopic level. This thesis demonstrates
the combination of both, 2D Laplace NMR and MRI, to characterize material
heterogeneities on microscopic and macroscopic levels with application to porous
media.
Spatially resolved D-T2 correlation maps were obtained for four different samples:
three different kinds of samples, glass beads with different bead diameters saturated
with water, glass beads filled with oil and water with a separating membrane, a wet
mortar sample and glass beads filled with oil and water without a separating membrane.
The pulse sequence included a modified stimulated echo employing anti-phase pulsed
field gradient pairs to cancel the effect of internal gradients followed by a CPMG part.
The back-projection imaging method was used in order to achieve a short echo time.
Instead of keeping the gradients turned on during the rf pulses, they were switched on
only during each echo for back-projection imaging to limit off-resonance effects and
keep the gradient coil protected. The results from glass-bead samples filled with oil and
water with a membrane show that this method can clearly identify the different
compartments of the sample, where in one part most fluid is water and in the other part
most fluid is oil. The D-T2 distribution obtained from the D-T2 resolved, low-resolution
image by summing over all pixels image agrees well with the integral D-T2 distribution
measured as a projection without spatial resolution. The D-T2 correlation maps of glass
beads with different bead diameters saturated with water shows that the signals from
small pores with short T2 and low diffusion coefficient can be lost due to the presence of
long echo time and strong internal gradient during diffusion encoding period. Then a
72 mortar sample was investigated to explore the application of this method with a sample
of unknown heterogeneity. Finally glass-bead samples filled with oil and water without a
membrane ware examined to simulate the sedimentary rock case. The outcomes of
these experiments indicate the macroscopic heterogeneity of porous materials can be
readily examined by spatially resolved D-T2 correlation maps. This method could be
particularly useful in studies of rocks filled with oil and water in the petroleum industry.
The measurement time for spatially resolved 2D Laplace NMR is inherently long
when the experiment is executed in a straightforward way with a conventional D-T2
pulse sequence preceding an imaging sequence. Such a measurement can take
several days. With back-projection imaging, the imaging part and the T2 encoding part
are combined into one to save measurement time. Resorting to lower resolution is the
second way explored to save measurement time. The third approach used in this work
is to improve the signal-to-noise ratio by summation of D-T2 correlation maps from
voxels with similar contrast. In our experiments the resolution is limited to around 0.4
mm and the measurement time is 4 h. If the resolution is increased to 0.04 mm, then the
measurement time will be 40 h. A further strategy to shorten the acquisition time is to
make use of the principles of sparse sampling such as compressed sensing [132,133].
This will be explored in subsequent work.
Then spatially resolved Gint2D-T2 correlation experiments were implemented for
three samples to acquire a better understanding of relationship between pore structure
and internal gradients. For the first sample, the internal gradient dominating case was
investigated and only in this case the internal gradient value can be calculated with the
assumption that the diffusion coefficient of the fluid molecules is constant across the
sample. This thesis delineates the limitations of this assumption which was used in the
previous research. For the second sample, another case of the Gint2D - T2 correlation
was measured where diffusion and relaxation dominate the measured signal. These
results from second sample show the possibility of employing the Gint2D - T2 correlation
map to distinguish oil and water in rocks. Then Gint2D -T2 correlation maps of mortar
were measured to test this method in a real case and internal gradient distributions
were estimated. These experiments were implemented at 7 T and at 16 T
73 spectrometers to examine the relationship between magnetic field strength and internal
gradient strength.
The method can be extended to low field NMR such as core scanners. Spatial
resolution can be introduced by back-projection imaging, by using one time-invariant,
transverse gradient and rotating the sample in the magnet. This eliminates the need for
bulky and costly gradient amplifiers, so that the measurement schemes explored in this
work can eventually be implemented on scanners with simple, dedicated magnets. An
important benefit of measuring porous media at low field is that internal gradients are
weak. At 300 MHz the internal gradients in the glass bead samples are of the order of 1
T/m so that their impact on diffusive signal attenuation could not be eliminated even at
short echo time. At lower field say 30 MHz, the internal gradient is a factor 10 times
lower than at the field strength we measured. However, as the signal-to-noise ratio
roughly scales with B02 the measurement time will be 100 times longer than at high field
given the same voxel size. This is unacceptably long and the measurement time needs
to be further shortened, e.g. by increasing the voxel size with larger samples and by
methods of sparse sampling and hyper-polarization. This method could be particular
interesting for petroleum industry to distinguish oil and water in highly heterogeneous
sedimentary rocks.
74 75 References
[1] R. W. Mair, G. P. Wong, D. Hoffmann, M. D. Hürlimann, S. Patz, L. M. Schwartz,
and R. L. Walsworth, Probing porous media with gas diffusion NMR, Phys. Rev.
Lett. 83 (1999) 3224-3227.
[2] J. D. Seymour, P. T. Callaghan, Generalized approach to NMR analysis of flow
and dispersion in porous media, AIChE Journal, 43(1997) 2096-2111.
[3] R. L. Kleinberg, C. Flaum, D. D. Griffin, P. G. Brewer, G. E. Malby, E. T. Peltzer, J.
P. Yesinowski, Deep sea NMR: Methane hydrate growth habit in porous media
and its relationship to hydraulic permeability, deposit accumulation, and submarine
slope stability, Journal of Geophysical Research: Solid Earth 108 (2003) 12.
[4] R. Kimmich, Strange kinetics, porous media, and NMR, Chem. Phys. 284(2002)
253-285.
[5] P.T. Callaghan, A. Coy, D. MacGowan, K.J. Packer, F. O. Zelaya, Diffraction-like
effects in NMR diffusion studies of fluids in porous solids, Nature 351(1991) 467 –
469.
[6] A. Timur, Pulsed Nuclear Magnetic Resonance studies of porosity, movable fluid,
and permeability of sandstones, Journal of Petroleum Technology 21 (1969) 775786.
[7] Joseph
D.
Seymour,
Paul
T.
Callaghan,
“Flow-Diffraction”
structural
characterization and measurement of hydrodynamic dispersion in porous media by
PGSE NMR, J. Magn. Reson. 122 (1996) 90-93.
[8] S.P. Rigby, L.F. Gladden, NMR and fractal modelling studies of transport in porous
media, Chemical Reaction Engineering 10 (1996) 2263–2272.
[9] F. Stallmach, J. Kärger, The potentials of pulsed field gradient NMR for
investigation of porous media, Adorption 5 (1999) 117-133.
[10] J. H. Strange, M. Rahman, and E. G. Smith, Characterization of porous solids by
NMR, Phys. Rev. Lett. 71 (1993) 3589-3591.
[11] M. H. Cohen and K. S. Mendelson, Nuclear magnetic relaxation and the internal
geometry of sedimentary rocks, J. App. Phys. 52 (1982) 1127-1135.
76 [12] R. Kleinberg, Encyclopedia of nuclear magnetic resonance, edited by D. M. Grant
and R. K. Harris, Willy New York 1995.
[13] P. P. Mitra, P. N. Sen, and L. M. Schwartz, Short-time behavior of the diffusion
coefficient as a geometrical probe of porous media, Phys. Rev. B 47 (1993) 85658574.
[14] S. Michaeli, D. J. Sorce, C. S. Springer Jr., K. Ugurbil, M. Garwool, T1ρ MRI
contrast in the human brain: Modulation of the longitudinal rotating frame
relaxation shutter-speed during an adiabatic RF pulse, J. Magn. Reson. 181
(2006) 135-147.
[15] V. Mlynárik, P. Szomolányi, R. Toffanin, F. Vittur, S. Trattnig, Transverse
relaxation mechanisms in articular cartilage, J. Magn. Reson. 169 (2004) 300-307.
[16] K. E. Washburn, C. D. Eccles, P. T. Callaghan, The dependence on magnetic field
strength
of
correlated
internal
gradient
relaxation
time
distribution
in
heterogeneous materials, J. Magn. Reson. 194 (2008) 33-40.
[17] J. Mitchell, T. C. Chandrasekera, and L. F. Gladden, Obtaining true transverse
relaxation time distribution in high-field NMR measurements of saturated porous
media: Removing the influence of internal gradient, J. Chem. Phys. 132 (2010)
244705.
[18] K. H. Hausser, H. R. Kalbizer, NMR in Medicine and Biology, Springer, Berlin,
1991.
[19] E. M. Haacke, R. W. Brown, M. R. Thompson, R. Venkatesan, Magnetic
Resonance Imaging, Wiley-Liss, New York, 1999.
[20] R. Kimmich, NMR Tomography, Diffusometry, Relaxometry, Springer, Berlin,
1997.
[21] B. Blϋmich, W.Kuhn. Eds., Magnetic Resonance Microscopy, VCH, Weinheim,
1992.
[22] P. C. Lauterbur, Imaging formation by induced local interaction: Examples
employing nuclear magnetic resonance, Nature 242 (1973) 190-191.
[23] P. Mansfield, P. K. Grannell, NMR ‘diffraction’ in solids? J. Phys. C: Solid State
Phys. 6 (1973) L422-L426.
77 [24] S. Ljunggren, A simple graphical representation of fourier-based imaging methods,
J. Magn. Reson. 54 (1983) 338–343.
[25] D. B. Twieg, The k-trajectory formulation of the NMR imaging process with
applications in analysis and synthesis of imaging methods, Med. Phys. 10 (1983)
610–621.
[26] B. Blϋmich, NMR imaging of materials, Clarendon Press, Oxford, 2000.
[27] P. Blϋmler, B. Blϋmich, Magnetization filters: Applications to NMR imaging of
elastomers, Magn. Reson. Imag. 10 (1992) 779-788.
[28] B. Blϋmich, Contrast in solid-state NMR imaging Part I: Principles, Concepts
Magn. Reson. 10 (1998) 19-31.
[29] B. Blϋmich, Contrast in solid-state NMR imaging Part IIa: Basic filters, Concepts
Magn. Reson. 11 (1999) 71-87.
[30] J. Dua, M. Byddera, A. M. Takahashib, M. Carlb, C. B. Chunga, G. M. Byddera,
Short T2 contrast with three-dimensional ultrashort echo time imaging,
Magn.Reson. Imag. 29 (2011) 470-482.
[31] E. Solomon, N. Shemesh, L. Frydman, Diffusion weighted MRI by spatiotemporal
encoding: Analytical description and in vivo validations, J. Magn. Reson. 232
(2013) 76-86.
[32] A. Hanyga, M. Seredyńska, Anisotropy in high-resolution diffusion-weighted MRI
and anomalous diffusion, J. Magn. Reson. 220 (2012) 85-93.
[33] M. Cercignani, M.A. Horsfield, An optimized pulse sequence for isotropically
weighted diffusion imaging, J. Magn. Reson. 140 (1999) 58-68.
[34] S. Hafner, Fast imaging in liquids and solids with the back-projection low angle
shot (BLAST) technique, Magn.Reson. Imag. 12 (1994) 1047-1051.
[35] S. K. Yrjänä, T. Vaara, A. Karttunen, J. Katisko, J. Koivukangas, Dynamic MR
imaging of brain tumors in low field using undersampled projection reconstruction,
Magn.Reson. Imag. 22 (2004) 799-805.
[36] D.G Cory, J.B Miller, A.N Garroway, Chemical-shift-resolved back-projection
imaging, J. Magn. Reson. 85 (1989) 219-227.
78 [37] R.E. Botto, G.D. Cody, S.L. Dieckman, D.C. French, N. Gopalsami, Philippe Rizo,
Three-dimensional magnetic resonance microscopy of materials, Solid State
Nuclear Magn. Reson. 6 (1996) 389-402.
[38] L. Ge, X. Bi, P. Lai, D. Li, Time-resolved contrast-enhanced coronary magnetic
resonance
angiography
with
highly
constrained
projection
reconstruction,
Magn.Reson. Imag. 28 (2010) 195-199.
[39] R. N. Bracewell. Two-Dimensional Imaging. Englewood Cliffs. NJ. Prentice Hall
(1995).
[40] A.C. Kak, M. Slaney, Principles of computerized tomographic Imaging. New York,
NY, IEEE Press (1988).
[41] O. V. Petrov, G. Ersland, B. J. Balcom, T2 distribution mapping profiles with phaseencode MRI, J. Magn. Reson. 209 (2011) 39-46.
[42] D. Xiao, B. J. Balcom, Two-dimensional T2 distribution mapping in rock core plugs
with optimal k-space sampling, J. Magn. Reson. 220 (2012) 70-78.
[43] A. Banerjee, N. Chandrakumar, Volume localized spin echo correlation
spectroscopy with suppression of ‘diagonal’ peaks, J. Magn. Reson. 239 (2014)
69-74.
[44] D. M. Doddrell, W. M. Brooks, J.M. Bulsing, J. Field, M. G Irving, H. Baddeley,
Spatial and chemical-shift-encoded excitation. SPACE, a new technique for
volume-selected NMR spectroscopy, J. Magn. Reson. 68 (1986) 367-372.
[45] M. Alecci, S. Romanzetti, J. Kaffanke, A. Celik, H.P. Wegener, N.J. Shah, Practical
design of a 4 Tesla double-tuned RF surface coil for interleaved 1H and 23Na MRI
of rat brain, J. Magn. Reson. 181 (2006) 203-211.
[46] K. R. Brownstein and C. E. Tarr, Importance of classical diffusion in NMR studies
of water in biological cells, Phys. Rev. A 19 (1979) 2446-2453.
[47] M.H.Cohen K.S. Mendelson, Nuclear magnetic relaxation and the internal
geometry of sedimentary rocks, J. App. Phys. 53 (1982) 1127-1135.
[48] K. R. McCall, D. L. Johnson, and R. A. Guyer, Magnetization evolution in
connected pore systems, Phys. Rev. B 44 (1991) 7344-7355.
[49] K.S. Mendelson, Nuclear Magnetic Relaxation in Porous Media, J. Electrochem.
Soc. 133 (1986) 631-633
79 [50] R.L. Kleinberg, Utility of NMR T2 distributions, connection with capillary pressure,
clay effect, and determination of the surface relaxivity parameter ρ2, Magn.Reson.
Imag. 14 (1996) 761-767.
[51] D. P. Gallegos, D. M. Smith, A NMR technique for the analysis of pore structure:
Determination of continuous pore size distributions, J. Colloid Interface Sci. 122
(1988) 143-153.
[52] W.E. Kenyon, J.J. Howard, A. Sezginer, C. Straley, A. Matteson, K. Horkowitz, R.
Ehrlich, Pore-size distribution and nmr in microporous cherty sandstones, In: Tran.
Of the SPWLA 13 Annual Logging Symposium, Vol. Paper LL., 1989, p. 1.
[53] D.S. Grebenkov, Multiexponential attenuation of the CPMG spin echoes due to a
geometrical confinement, J. Magn. Reson. 180 (2006) 118-126.
[54] R.V. Mulkern, R.G. Spencer, Diffusion imaging with paired CPMG sequences,
Magn.Reson. Imag. 6 (1988) 623-631.
[55] M. Ronczka and M. Mϋller-Petke, Optimization of CPMG sequences to measure
NMR transverse relaxation time T2 in borehole applications, Geosci. Instrum.
Method. Data Syst. 1 (2012) 197–208.
[56] X. Zhang, C.-G. Li, C.-H. Ye, and M.-L. Liu, Determination of molecular selfdiffusion coefficient using multiple spin-echo NMR spectroscopy with removal of
convection and background gradient artifacts, Anal. Chem. 73 (2001) 3528-3534.
[57] P. P. Mitra, P. N. Sen, L. M. Schwartz, and P. Le Doussal, Diffusion propagator as
a probe of the structure of porous media, Phys. Rev. Lett. 68 (1992) 3555-3558.
[58] P. P. Mitra, P. N. Sen, and L. M. Schwartz, Short-time behavior of the diffusion
coefficient as a geometrical probe of porous media, Phys. Rev. B 47 (1993) 85658574.
[59] L.L. Latour, P.P. Mitra, R.L. Kleinberg, C.H. Sotak, Time-Dependent diffusion
coefficient of fluids in porous media as a probe of surface-to-volume ratio, J. Magn.
Reson. 101 (1993) 342-346.
[60] V. Rajanayagam, S, Yao, J, M. Pope, Quantitative magnetic resonance flow and
diffusion imaging in porous media, Magn.Reson. Imag. 13 (1995) 729-738.
80 [61] P. N. Sen, L. M. Schwartz, P. P. Mitra, and B. I. Halperin, Surface relaxation and
the long-time diffusion coefficient in porous media: Periodic geometries, Phys.
Rev. B 49 (1994) 215-225.
[62] J.W. Haus, K.W. Kehr, Diffusion in regular and disordered lattices, Phys. Rep. 150
(1987) 263-406.
[63] R.W. Mair, P.N. Sen, M.D. Hürlimann, S. Patz, D.G. Cory, R.L. Walsworth, The
narrow pulse approximation and long length scale determination in xenon gas
diffusion NMR studies of model porous media, J. Magn. Reson. 156 (2002) 202212.
[64] M.D. Hürlimann, K.G. Helmer, T.M. Deswiet, P.N. Sen, Spin echoes in a constant
gradient and in the presence of simple restriction, J. Magn. Reson. A 113 (1995)
260-264.
[65] P. N. Sen, A.l A. and S. Axelrod, Spin echoes of nuclear magnetization diffusing in
a constant magnetic field gradient and in a restricted geometry, J. Chem. Phys.
111 (1999) 6548-6555.
[66] T. M. de Swiet and P. N. Sen, Decay of nuclear magnetization by bounded
diffusion in a constant field gradient, J. Chem. Phys. 100 (1994) 5597-5804.
[67] P. Le Doussal and P. N. Sen, Decay of nuclear magnetization by diffusion in a
parabolic magnetic field: An exactly solvable model, Phys. Rev. B 46 (1992) 34653485.
[68] L. J Zielinski, P. N Sen, Relaxation of nuclear magnetization in a nonuniform
magnetic field gradient and in a restricted geometry, J. Magn. Reson. 147 (2000)
95-103.
[69] M. D. Hürlimann, Effective gradients in porous media due to susceptibility
differences, J. Magn. Reson. 131 (1998) 232-240.
[70] L. Venkataramanan, Yi-Qiao Song, M. D. Hurlimann, Solving Fredholm integrals of
the first kind with tensor product structure in 2 and 2.5 dimensions, IEEE trans. 50
(2002) 1017-1026.
[71] S. Godefroy, P.T. Callaghan, 2D relaxation/diffusion correlations in porous media,
Magn.Reson. Imag. 21 (2003) 381-383.
81 [72] P. Galvosas, Y. Qiao, M. Schönhoff, P. T. Callaghan, On the use of 2D correlation
and exchange NMR spectroscopy in organic porous materials, Magn.Reson. Imag.
25 (2007) 497-500.
[73] M. Fleury, J. Soualem, Quantitative analysis of diffusional pore coupling from T2store-T2 NMR experiments, J. Colloid Interface Sci. 336 (2009) 250-209.
[74] Y.-Q. Song, L. Zielinski, and S. Ryu, Two-dimensional NMR of diffusion systems,
Phys. Rev. Lett. 100 (2008) 248002.
[75] L. M. Burcaw, P. T. Callaghan, Observation of molecular migration in porous
media using 2D exchange spectroscopy in the inhomogeneous magnetic field, J.
Magn. Reson. 198 (2009) 167-173.
[76] G. C. Borgia, R. J. S. Brown and P. Fantazzini, Uniform-Penalty inversion of
multiexponential decay data, J. Magn. Reson. 132 (1998) 65-77.
[77] M. D. Hürlimann and L. Venkataramanan, Quantitative Measurement of TwoDimensional Distribution Functions of Diffusion and Relaxation in Grossly
Inhomogeneous Fields, J. Magn. Reson. 157 (2002) 31-42.
[78] J. H. Lee, C. Labadie, C. S. Springer Jr., G. S. Harbison, Two-dimensional inverse
Laplace transform NMR: altered relaxation times allow detection of exchange
correlation, J. Am. Chem. Soc. 115 (1993) 7761–7764.
[79] K. E. Washburn and P. T. Callaghan, Tracking pore to pore exchange using
relaxation exchange spectroscopy, Phys. Rev. Lett. 97 (2006) 175502.
[80] L. Monteilhet, J.-P. Korb, J. Mitchell, and P. J. McDonald, Observation of
exchange of micropore water in cement pastes by two-dimensional T2-T2 nuclear
magnetic resonance relaxometry, Phys. Rev. E 74 (2006) 061404.
[81] M. V. Landeghem, A. Haber, J.-B. D'espinose De Lacaillerie, B. Blümich, Analysis
of multisite 2D relaxation exchange NMR, Concepts in Magnetic Resonance Part
A Volume 36A (2010) 153–169.
[82] Y.-Q. Song, L. Venkataramanan, M.D. Hürlimann, M. Flaum, P. Frulla, C. Straley,
T1–T2 correlation spectra obtained using a fast Two-Dimensional Laplace
inversion, J. Magn. Reson. 154 (2002) 261-268.
82 [83] P. J. McDonald, J.-P. Korb, J. Mitchell, and L. Monteilhet, Surface relaxation and
chemical exchange in hydrating cement pastes: A two-dimensional NMR
relaxation study, Phys. Rev. E 72 (2005) 011409.
[84] M. D. Hürlimann, L. Burcaw, Y.-Q. Song, Quantitative characterization of food
products by two-dimensional D–T2 and T1–T2 distribution functions in a static
gradient, J. Colloid Interface Sci. 297 (2005) 303-311.
[85] M.D. Hürlimann, L. Venkataramanan, C. Flaum, The diffusion–spin relaxation time
distribution function as an experimental probe to characterize fluid mixtures in
porous media, J. Chem. Phys. 117 (2002) 10223-10232.
[86] M.D. Hürlimann, K.G. Helmer, L.L. Latour, C.H. Sotak, Restricted diffusion in
sedimentary rocks. Determination of surface-area-to-volume ratio and surface
relaxivity, J. Magn. Reson. 111 A (1994) 169–178.
[87] M.D. Hürlimann, M. Flaum, L. Venkataramanan, C. Flaum, R.Freedman, G.J.
Hirasaki, Diffusion–relaxation distribution functions of sedimentary rocks in
different saturation states, Magn. Reson. Imaging 21 (2003) 305–310.
[88] C. Sun, G. S. Boutis, Measurement of the exchange rate of waters of hydration in
elastin by 2D T2–T2 correlation nuclear magnetic resonance spectroscopy, New
Journal of Physics 13 (2011) 025026-025042.
[89] L.M. Burcaw, P.T. Callaghan, Correlation of the inhomogeneous field as a
measure of sample heterogeneity, J. Magn. Reson. 216 (2012) 144-151.
[90] P.T. Callaghan, Translational Dynamics & Magnetic Resonance, Clarendon Press,
Oxford, 2011.
[91] F. Casanova, J. Perlo, B. Blϋmich, Single-Sided NMR, Springer, 2011.
[92] D. Xiao, B.J. Balcom, Two-dimentional T2 distribution mapping in rock core plugs
with optimal k-space sampling, J. Magn. Reson. 220 (2012) 70-78.
[93] A.E. Pomerantz, P. Tilke, Y.-Q. Song, Inverting MRI measurements to
heterogeneity spectra, J. Magn. Reson. 193 (2008) 243-250.
[94] A.E. Pomerantz, E.E. Sigmund, Y.-Q. Song, Spatial heterogeneity length scales in
carbonate rocks, Appl. Magn. Reson. 32 (2007) 221–231.
[95] S. Stapf, S.-I Han, NMR Imaging in Chemical Engineering, Wiley, 2006.
83 [96] P.T. Callaghan, I. Furo, Diffusion-diffusion correlation and exchange as a signature
for local order and dynamics, J. Chem. Phys. 120 (2004) 4032-4038.
[97] L. Li, O. Petrov, B. Balcom, Spatially resolved two-dimensional T2-D MRI in porous
media, Poster P53, International Bologna Conference on Magnetic Resonance in
Porous Media, Boston, 13th-17th July 2008.
[98] J. Zheng, D. Salamon, L. Lefferts, M. Wessling, L. Winnubst, Ceramic microfluidic
monoliths by ice templating, Microporous and Mesoporous Materials 134 (2010)
216–219.
[99] R. M. Cotts, M. J. R. Hoch, T. Sun, J. T. Markert, Pulsed field gradient stimulated
echo methods for improved NMR diffusion measurements in heterogeneous
systems, J. Magn. Reson. 83 (1989) 252-266.
[100] H.Y. Carr, E.M. Purcell, Effects of diffusion on free precession in nuclear magnetic
resonance experiments. Phys Rev 94(3) (1954) 630–638.
[101] S. Meiboom, D. Gill, Modified spin-echo method for measuring nuclear relaxation
times. Rev Sci Instrum 29(8) (1958) 688–691.
[102] P. Z. Sun, J.G. Seland, and D. Cory, Background gradient suppression in pused
gradient stimulated echo measurements, J. Magn. Reson. 61 (2003) 168-173.
[103] D. Wu, A. Chen, and C.S. Johnson Jr., An improved diffusion-ordered
spectroscopy experiment incorporating bipolar-gradient pulses, J. Magn. Reson. A
115 (1995) 260-264.
[104] J. Mitchell, T. C. Chandrasekera, and L. F. Gladden, Obtaining true transverse
relaxation time distribution in high-field NMR measurements of saturated porous
media: Removing the influence of internal gradient, J. Chem. Phys. 132 (2010)
244705.
[105] B. J. Balcom, R. P. Macgregor, S. D. Beyea, D. P. Green, R. L. Armstrong, and T.
W. Bremner, Single-Point Ramped Imaging with T1 Enhancement (SPRITE), J.
Magn. Reson. Series A, 123 (1996) 131 – 134.
[106] Kenyon, W.E., Nuclear magnetic resonance as a petrophysical measurement,
Nuclear Geophysics, v.6, no.2 (1992) 153-171.
84 [107] L. J. Schreiner, J. C. MacTavish, L. Miljkovic, M. M. Pintar,R. Blinc, G. Lahajnar, D.
D. Lasic, and L. W. Reeves, NMR Line Shape-Spin-Lattice Relaxation Correlation
Study of Portland Cement Hydration, J. Am.Ceram. Soc. 68 (1985) 10-16.
[108] D. D. Lasic, J. M. Corbett, J. Jian, J. C. MacTavish, M. M. Pintar, R. Blinc, and G.
Lahajnar, NMR spin grouping in hydrating cement at 200 MHz, Cem. Concr. Res.
18 (1988) 649-653.
[109] A. Valori, V. Rodin, P.J. McDonald, On the interpretation of 1H 2-dimensional NMR
relaxation exchange spectra in cements: Is there exchange between pores with
two characteristic sizes or Fe3+ concentrations?, Cem. Concr. Res. 40 (2010)
1375 – 1377.
[110] R.F Karlicek Jr., I.J Lowe, A modified pulsed gradient technique for measuring
diffusion in the presence of large background gradients, J. Magn. Reson. 37
(1980) 75-91.
[111] R.M Cotts, M.J.R Hoch, T Sun, J.T Markert, Pulsed field gradient stimulated echo
methods for improved NMR diffusion measurements in heterogeneous systems, J.
Magn. Reson. 83(1989) 252-266.
[112] D. Wu, A. Chen, and C.S. Johnson Jr., An improved diffusion-ordered
spectroscopy experiment incorporating bipolar-gradient pulses, J. Magn. Reson. A
115 (1995) 260-264.
[113] P. Z. Sun, J.G. Seland, and D. Cory, Background gradient suppression in pused
gradient stimulated echo measurements, J. Magn. Reson. 61 (2003) 168-173.
[114] P. Galvosas, F. Stallmach, J. Kärger, Background gradient suppression in
stimulated echo NMR diffusion studies using magic pulsed field gradient ratios, J.
Magn. Reson. 166 (2004) 164-173.
[115] Y.-Q. Song, S. Ryu and P. N. Sen, Determining multiple length scales in rocks,
Nature 406 (2000) 178-181.
[116] Y.-Q. Song, Determining pore sizes using an internal magnetic field, J. Magn.
Reson. 143 (2000) 397-401.
[117] N. V. Lisitza, Y.-Q. Song, The behavior of diffusion eigenmodes in the presence of
internal magnetic field in porous media, J. Chem. Phys. 114 (2001) 9120-9124.
85 [118] H. Cho, S. Ryu, J.L. Ackerman, Y.-Q. Song, Visualization of inhomogeneous local
magnetic field gradient due to susceptibility contrast, J. Magn. Reson. 198 (2009)
88-93.
[119] B. Audoly, P.N. Sen, S. Ryu, Y.-Q. Song, Correlation functions for inhomogeneous
magnetic field in random media with application to a dense random pack of
spheres, J. Magn. Reson. 164 (2003) 154-159.
[120] Hyung Joon Cho, Yiqiao Song, NMR measurement of the magnetic field
correlation function in porous media, Phys. Rev. Lett. 100 (2008) 025501.
[121] K. E. Washburn, C. D. Eccles, P. T. Callaghan, The dependence on magnetic field
strength
of
correlated
internal
gradient
relaxation
time
distribution
in
heterogeneous materials, J. Magn. Reson. 194 (2008) 33-40.
[122] J. Mitchell, T. C. Chandrasekera, and L. F. Gladden, Obtaining true transverse
relaxation time distribution in high-field NMR measurements of saturated porous
media: Removing the influence of internal gradient, J. Chem. Phys. 132 (2010)
244705.
[123] L. M. Burcaw, P. T. Callaghan, Correlation of the inhomogeneous field as a
measure of sample heterogeneity, J. Magn. Reson. 216 (2012) 144-151.
[124] J. Mitchell, Rapid measurements of heterogeneity in sandstones using low-field
nuclear magnetic resonance, J. Magn. Reson. 240 (2014) 52-60.
[125] J. G. Seland, K. E. Washburn, H. W. Anthonsen, and J. Krane, Correlations
between diffusion, internal magnetic field gradients, and transverse relaxation in
porous systems containing oil and water, Phys. Rev. E 70 (2004) 051305.
[126] Y.-Q. Song, L. Venkataramanan, M.D. Hurlimann, M. Flaum, P. Frulla and C.
Straley,T1-T2 correlation spectra obtained using a fast two-dimensional Laplace
Inversion, J. Magn. Reson. 154 (2002) 261-268.
[127] B. Sun and K. –J. Dunn, Probing the internal field gradients of porous media,
Phys. Rev. E 65 (2002) 051309.
[128] M.D. Hürlimann, K.G. Helmer, T.M. Deswiet, P.N. Sen, Spin echoes in a constant
gradient and in the presence of simple restriction, J. Magn. Reson. A 113 (1995)
260-264.
86 [129] J. Mitchell, T. C. Chandrasekera, M. L. Johns, L. F. Gladden, and E. J. Fordham,
Nuclear magnetic resonance relaxation and diffusion in the presence of internal
gradients: The effect of magnetic field strength, Phys. Rev. E 81(2010) 026101.
[130] M.D. Hürlimann, Effective gradients in porous media due to susceptibility
differences, J. Magn. Reson. 131 (1998) 232-240.
[131] Y. Zhang, B. Blümich, Spatially resolved D-T2 correlation NMR of porous media, J.
Magn. Reson. 242 (2014) 41-48.
[132] M. Lustig, D. Donoho, J.M. Pauly, Sparse MRI: the application of compressed
sensing for rapid MR imaging, Magnetic Resonance in Medicine 58 (2007) 1182–
1195.
[133] P. Parasoglou, D. Malioutov, A.J. Sederman, J. Rasburn, H. Powell, L.F. Gladden,
A. Blake, M.L. Johns, Quantitative single point imaging with compressed sensing,
J. Magn. Reson. 201 (2009) 72–80.


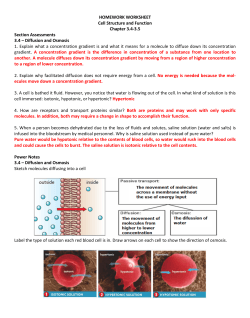


© Copyright 2026