
London Seafood Investment Forum 2014 – CFO Britt Kathrine Drivenes
London Seafood Investment Forum 2014
Britt Kathrine Drivenes – CFO
Brief history
•
Established in 1981 as a wholly owned family company within pelagic fisheries
and salmon farming.
•
Fully integrated fishing company with license to participate in some of the worlds
largest pelagic fisheries (Peru, Chile and Norway).
•
World`s second largest producer of salmon and trout through ownership in Lerøy
Seafood Group ASA.
•
Significant acquisitions since 2002.
•
2
2002 Chile
2004 Peru
2006 Norway
2008 Norway
2010 Norway
(FoodCorp)
(Austral Group)
(Welcon)
(Lerøy Seafood Group)
(Norway Pelagic ASA)
Listed on the Oslo Stock Exchange (since October 2006).
www.auss.no
Austevoll Seafood ASA
4
6
3
4
AUSS value chain
2
5
2
3
1
Pelagic
Salmon & Trout
1.
2.
3.
4.
Farming
Processing
VAP
Consumer market
1
1.
Fishing
2.
Processing
3.
4.
Fishmeal and fish oil
VAP (Customer)
5.
Commodity market
6.
Consumer market
Company overview
2014
Chile
4
www.auss.no
Peru
North Atlantic
Norway
Norway/ UK
Austevoll Seafood ASA
Overview
* Associated companies
PERU
Harvesting
7% of anchovy quota
centre-north
21 fishing vessels
CHILE
9.1% of pelagic fishing
quota
5 fishing vessels
Salmon
NORTH ATLANTIC
AUSTEVOLL SEAFOOD GROUP
3 fishing vessels*
400,000-500,000 MT of pelagic fish
annually
(28 vessels)
Norway
• 139 salmon licenses
• 7 salmon licenses*
180,000 – 190,000 MT of salmon
Salmon operation UK*
5
Processing
7 Processing plants
(4 sites)
4 Processing plants
(1 site)
47 Processing plants
58 processing plants
Intake of 1.5 – 1.8 mill MT of pelagic fish
annually
Sales
Own sales organisation
Own sales organisation
Own sales organisation
Wholesale with global sales &
distribution
www.auss.no
Austevoll Seafood ASA
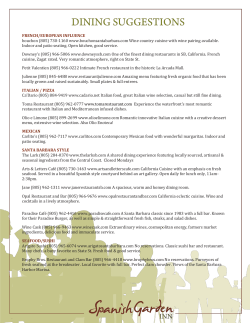
Historical Highlights
(all figures in MNOK)
2009 *
2010 *
2011 *
2012
(restated)
2013
Historical EBITDA
H1 2014
14 000
Turnover
11 325
12 745
12 162
11 171
12 410
7 187
12 000
EBITDA
1 922
2 541
2 046
1 170
2 226
1 447
10 000
17 %
20 %
17 %
10 %
18 %
20 %
1 442
1 984
1 533
636
1 607
1 174
Net result***
988
1 766
527
641
1 561
370
Total assets
16 291
19 042
18 574
18 650
21 224
19 447
7 095
9 111
9 200
9 400
10 699
10 507
EBIT**
Booked equity
Equity %
44 %
48 %
50 %
50 %
50 %
54 %
Net interest baring debt
4 137
3 162
3 361
3 655
4 768
3 588
Earnings per share (NOK)
Paid dividend per share (NOK)
Yield
3,83
3,3 %
6,03
1,20
3,0 %
1,82
1,50
4,8 %
2,10
1,00
4,2 %
3,48
1,20
4,5 %
1,14
1,60
243,3
304,1
202,7
243,3
324,3
Paid dividend in total MNOK
20%
MNOK
EBITDA %
25%
15%
8 000
6 000
10%
4 000
5%
2 000
-
0%
2009 *
2010 *
Turnover
2011 *
2012
EBITDA
2013
H1 2014
EBITDA %
AUSS Share Price Development
60
50
50% of Welcon Group proportionally consolidated
**
excl. biomass adjustment
*** incl.biomass adjustment
40
NOK
*
30
20
10
0
6
www.auss.no
Austevoll Seafood ASA
Pelagic
Austral Group S.A.A
FoodCorp S.A.
Pelagia AS (associated)
Operation in Peru
Austral Group S.A.A
•
•
4 processing sites
4 fishmeal and fish oil plants
2 canning plants (HC)
1 frozen-fish plant (HC)
21 active vessels – 7% Quota
Incl. 11 RSW-equipped vessels
8
Austral -
Headquarters
Austral -
Fishmeal and Human consumption factories
Austral -
Fishmeal factories
www.auss.no
Austevoll Seafood ASA
Annual catches in Peru
Anchoveta unloaded in Peru 1993-2013
Anchovy (Engraulis ringens) Unloading
National Unloading ('000 MT)
12000
10000
8000
6000
4000
2000
0
9
www.auss.no
Austevoll Seafood ASA
Operation in Chile
FoodCorp S.A.
1 processing site in Coronel
5 vessels
9.1% of Chilean total
Horse Mackerel
quota (South)
• Fishmeal & fish oil plants
• Canning plant (HC)
• Freezing plant (HC)
6,100 MT of hold capacity
Coastal vessel
contracts
10
www.auss.no
Austevoll Seafood ASA
Annual catches in Chile
Jack Mackerel unloaded in Chile 2000-2014E
Jack Mackerel (Trachurus murphyi)
1 800
National unloading (‘000 MT)
1 600
1 400
1 200
1 000
800
600
400
200
2000
11
2001
www.auss.no
2002
2003
2004
2005
2006
2007
2008
2009
2010
2011
2012
2013
2014E
Austevoll Seafood ASA
North Atlantic pelagic quotas
(2007-2014 est)
5 000
4 500
219
115
432
4 000
84
143
340
3 500
'000 tons (TAC)
82
606
540
20
390
209
423
200
275
171
33
1 279
381
146
360
435
164
1 500
1 518
1 280
643
700
160
380
510
320
200
405
465
1 483
988
418
126
833
1 000
500
65
470
189
1 643
292
391
41
250
393
40
3 000
2 000
82
374
1 700
1 250
2 500
127
216
139
161
619
150
180
500
456
2007
2008
177
569
180
181
211
572
672
586
2010
2011
2012
126
1 240
542
-
12
2009
2013
Mackerel
Horse Mackerel
NVG-Herring
NS-Herring
Capelin Barents Sea
Capelin Iceland
Blue Whiting
Sand Eel
Norway Pout
Boar
www.auss.no
2014
Austevoll Seafood ASA
Pelagia AS
(associated)
Pelagia’s share of Norwegian landings 2013
Capelin (HC) 2013
Mackerel (HC) 2013
27%
48%
Herring (HC) 2013
41%
52%
59%
73%
Pelagia
Volume (‘000 MT)
Others
2014E
2013P
Human Consumption (HC)
460
492
Fishmeal/FPC & oil
700
684
Pelagia -
Headquarters
Pelagia -
17 Human consumption factories
Pelagia -
10 Fishmeal and fish oil factories
Source: Pelagia AS –
All figures are based on landing in Norway
13
www.auss.no
Austevoll Seafood ASA
Salmon
Lerøy Seafood Group ASA
Lerøy Seafood Group ASA
Lerøy Seafood Group ASA
Farming
15
www.auss.no
VAP
15
Sales &
Distribution
Austevoll Seafood ASA
Lerøy Seafood Group ASA
Lerøy Aurora
Farming Segments Norway
• Lerøy Aurora (salmon)
25 licenses (acquired 8 licenses in July 2014)
• Lerøy Midt (salmon)
Lerøy Midt
54 licenses
• Lerøy Sjøtroll (salmon and trout)
60 licenses
• In total 139 licenses in Norway
16
www.auss.no
Lerøy Sjøtroll
Austevoll Seafood ASA
Lerøy Seafood Group ASA
Ten years sustainable growth, more to come!
MNOK
12 000
GWT
175 000
10 000
150 000
125 000
8 000
100 000
6 000
75 000
4 000
50 000
2 000
25 000
Market Cap
•
17
EV
2014
2013
2012
2011
2010
2009
2008
2007
2006
2005
2004
2003
0
2002
0
GWT
Share of harvest volumes in Norskott Havbruk and Villa Organic AS not included
www.auss.no
Austevoll Seafood ASA
Market Trends
Fishmeal and Fish oil Supply Worldwide
19
www.auss.no
Austevoll Seafood ASA
Fishmeal Usage Trend
20
www.auss.no
Austevoll Seafood ASA
Fish oil Usage Trend
21
www.auss.no
Austevoll Seafood ASA
Fishmeal use in China
Fishmeal use in Aquaculture China 2012
Fishmeal use in China 2012
6%
5% 3%
Crustacea
10%
Marine Fish
Aquaculture
Pigs
37%
55%
9%
42%
Salmonids
Eels
Poultry
Cyprinids
Others
16%
Tilapias
14%
Other Freshwater fishes
1%
Source: IFFO
22
www.auss.no
Austevoll Seafood ASA
Price development Fishmeal vs Soymeal
2000
1000
1800
900
1600
800
1400
700
Fishmeal
1200
600
1000
500
800
400
600
300
Soyameal
400
200
USD/MT - Soyameal
USD/MT- Fishmeal
Fishmeal 64/65% vs Soyameal 44% (CIF Main port Europe)
200
100
0
0
Source: FAO.org
23
www.auss.no
Austevoll Seafood ASA
Price development Fish oil vs Rapeoil
2500
2500
2000
2000
1500
1500
Fishoil
1000
1000
Rapeoil
500
0
USD/MT - Rapeoil
USD/MT - Fish oil
CIF Main port Europe
500
0
Source: FAO.org
24
www.auss.no
Austevoll Seafood ASA
Atlantic salmon consumption
Atlantic salmon - supply
(in tonnes WFE )
Figures as per Oct.14 - Source: Kontali
•
25
Limited growth in global salmon supply combined with strong demands, gives a strong outlook for the
coming years
www.auss.no
Austevoll Seafood ASA
Summary
AUSS is well positioned within the global marine value chain, and maintains a long term
commitment towards the seafood industry. Our strategy remains firm in respect of
investing and generating sustainable growth through the value chain.
Salmon
•
Strong upstream and downstream positions within the global salmon industry.
Pelagic
South America
•
Strategically positioned in Peru to participate in the largest Anchovy fishery in the world, a major ingredient in
the global production of fishmeal.
•
Strong position in Chile for production of fishmeal and direct human consumption products.
North Atlantic
26
•
AUSS has been a consolidator in the industry, latest by establishing a strong joint venture holding 100% of
Pelagia AS.
•
Strong upstream position in the supply chain.
•
Progressively improving our competitive strength in the pelagic business through productivity improvement,
hereunder utilising synergies and economy of scale.
www.auss.no
Austevoll Seafood ASA
Disclaimer
•
•
28
This Presentation has been produced by Austevoll Seafood ASA (the “Company” or
“Austevoll”) solely for use at the presentation to the market held in connection with the
Intrafish Seafood Investor Forum 2014.
This document contains certain forward-looking statements relating to the business,
financial performance and results of the Company and/or the industry in which it
operates. Forward-looking statements concern future circumstances and results and
other statements that are not historical facts, sometimes identified by the words
“believes”, expects”, “predicts”, “intends”, “projects”, “plans”, “estimates”, “aims”,
“foresees”, “anticipates”, “targets”, and similar expressions. The forward-looking
statements contained in this Presentation, including assumptions, opinions and views
of the Company or cited from third party sources are solely opinions and forecasts
which are subject to risks, uncertainties and other factors that may cause actual
events to differ materially from any anticipated development. Neither The Company or
any of their respective group of companies or any such person’s officers or
employees provides any assurance that the assumptions underlying such forwardlooking statements are free from errors nor does any of them accept any
responsibility for the future accuracy of the opinions expressed in this Presentation or
the actual occurrence of the forecasted developments. The Company assumes no
obligation, except as required by law, to update any forward-looking statements or to
conform these forward-looking statements to our actual results.
•
An investment in the company involves risk, and several factors could cause the
actual results, performance or achievements of the company to be materially different
from any future results, performance or achievements that may be expressed or
implied by statements and information in this presentation, including, among others,
risks or uncertainties associated with the company’s business, segments,
development, growth management, financing, market acceptance and relations with
customers, and, more generally, general economic and business conditions, changes
in domestic and foreign laws and regulations, taxes, changes in competition and
pricing environments, fluctuations in currency exchange rates and interest rates and
other factors.
•
Should one or more of these risks or uncertainties materialise, or should underlying
assumptions prove incorrect, actual results may vary materially from those described
in this presentation. the company does not intend, and does not assume any
obligation, to update or correct the information included in this presentation.
www.auss.no
•
No representation or warranty (express or implied) is made as to, and no reliance
should be placed on, any information, including projections, estimates, targets and
opinions, contained herein, and no liability whatsoever is accepted as to any errors,
omissions or misstatements contained herein, and, accordingly, none of the Company
or any of their group companies or any such person’s officers or employees accepts
any liability whatsoever arising directly or indirectly from the use of this document.
•
By attending the quarterly presentation or upon reading the Presentation you
acknowledge that you will be solely responsible for your own assessment of the
market and the market position of the Company and that you will conduct your own
analysis and be solely responsible for forming your own view of the potential future
performance of the Company’s business.
•
This Presentation is dated 31.10.2014. Neither the delivery of this Presentation nor
any further discussions of the Company with any of the recipients shall, under any
circumstances, create any implication that there has been no change in the affairs of
the Company since such date.
Austevoll Seafood ASA
Appendix
Financials Q2 2014
Key financial figures
Q2 2014 Q2 2013(restated)
(NOK 1,000)
Δ%
Q2 2014**
Q2 2013**
Δ%
29,9 %
4 143 062
3 266 880
26,8 %
Revenue
3 570 892
2 748 555
EBITDA
702 343
542 879
727 697
572 981
Depreciation/Impairment
136 248
126 689
158 498
147 594
EBIT*
566 095
416 190
569 199
425 387
Income from associates*
36 985
34 711
Net finance
-36 977
-86 701
Pre-tax*
566 103
364 200
Net profit
237 355
303 276
EPS (NOK)
0,66
0,55
EPS (NOK)*
1,21
0,34
36,0 %
33,8 %
55,4 %
253,4 %
* Before biomass adjustment
** AUSS incl. 50% of Pelagia AS (proforma)
Biomass adj group company
Biomass adj group associated companies
30
www.auss.no
Q2 2014
Q2 2013
-206 707
90 981
-33 424
-1 356
Austevoll Seafood ASA
Key financial figures
YTD Q2 2013
(NOK 1,000)
YTD Q2 2014
(restated)
Revenue
7 187 124
5 503 215
EBITDA
1 447 078
1 028 351
272 848
251 952
1 174 230
776 399
Depreciation/Impairment
EBIT*
Income from associates*
123 273
47 604
Net finance
-76 289
-141 254
Pre-tax*
1 221 214
682 749
Net profit
370 209
751 201
EPS (NOK)
1,14
1,83
EPS (NOK)*
2,89
1,13
YTD Q2 2014
YTD Q2 2013
-684 342
300 044
-60 128
14 141
Δ%
YTD Q2 2014**
YTD Q2 2013**
Δ%
30,6 %
8 431 096
6 754 057
24,8 %
1 534 322
1 137 018
315 681
293 817
1 218 642
843 202
51,2 %
44,5 %
78,9 %
156,6 %
* Before biomass adjustment
** AUSS incl. 50% of Pelagia AS (proforma)
Biomass adj group company
Biomass adj group associated companies
31
www.auss.no
Austevoll Seafood ASA
Balance sheet
YTD Q2 2013
(NOK 1,000)
YTD Q2 2014
End 2013
Intangible assets
6 061 463
5 973 890
6 035 665
Tangible fixed assets
4 082 774
3 986 214
4 095 855
Financial non-current assets
1 952 790
928 378
1 145 026
12 097 027
10 888 482
11 276 546
2 534 533
2 256 257
2 616 859
427 827
651 809
1 110 502
Total non-current assets
Biological assets at cost
Fair value adjustment biomass
Other inventory
Receivables
806 584
803 706
740 321
1 999 585
1 764 800
2 290 511
1 205 855
1 793 241
1 396 279
Assets classified as held for sale*
Cash and cash equivalents
1 581 156
1 753 397
Total current assets
7 349 685
8 435 824
9 947 713
19 446 712
19 324 306
21 224 259
3 587 888
4 041 226
4 767 714
10 506 721
9 819 424
10 699 318
Total assets
NIBD
Equity
Equity ratio
32
(restated)
54 %
www.auss.no
51 %
*From 1st January 2014 onwards Pelagia AS
(50%) is classified as an associated
company thereby reported as financial non
current asset.
50 %
Austevoll Seafood ASA
Atlantic salmon and trout
(MNOK)
Q2 2014
Q2 2013
Revenue
3 176,4
2 513,0
EBITDA
589,7
538,2
EBIT*
500,3
462,2
40 944
33 708
12,2
13,7
Harvested volume (GWT)
EBIT/kg* (NOK)
* before biomass adj.
•
Another strong quarter
•
Pressure on spot prices
o
Average NOS price down NOK 7.00 compared to Q1/14
o
NOS Q2/14 NOK 39.54 vs NOK 41.53 in Q2/13 (-5%)
•
Contract share 38%
•
Increase in cost both q-o-q and y-o-y
•
Russian sanctions against Norwegian seafood
products from August 7th.
EBITDA
(MNOK)
700,0
600,0
500,0
400,0
300,0
200,0
443,7
538,2
450,8
638,9
589,7
Q1 2014
Q2 2014
505,7
100,0
Q1 2013
33
Q2 2013
Q3 2013
www.auss.no
Q4 2013
Austevoll Seafood ASA
Fishmeal and oil
(South America)
(MNOK)
Q2 2014
Q2 2013
Revenue
318,9
163,2
EBITDA
126,8
18,0
97,0
-12,1
21 900
10 961
5 887
1 234
EBIT
•
Recovery of the sardine/anchovy fishery in Chile
•
First season for anchovy in Peru started April 23rd
and ended August 10th.
o Total quota 2,530,000 MT vs 2,050,000 MT same
season 2013
o The industry took 66% of the total quota
o Our fleet took 78% of its quota
Sales volumes (tonnes) :
Fishmeal
Fish oil
•
Achieved fishmeal prices down by approx. 8% q-o-q
•
Achieved fish oil prices down by approx. 15% q-o-q
EBITDA
(MNOK)
200,0
180,0
160,0
140,0
120,0
100,0
177,0
80,0
60,0
108,6
40,0
126,8
93,9
20,0
-
34
15,5
18,0
Q1 2013
Q2 2013
Q3 2013
www.auss.no
Q4 2013
Q1 2014
Q2 2014
Austevoll Seafood ASA
Human consumption
(MNOK)
Q2 2014
(South America)
Q2 2013
Revenue
100,9
87,2
EBITDA
-16,9
-16,3
EBIT
-29,7
-32,5
Frozen (tonnes)
6 261
3 056
Canning (cases)
174 360
377 918
•
Horse mackerel quota in Chile was caught 100% by
end June (48,000 MT)
•
Approx. 50% of the quota went for frozen products,
the rest for fishmeal and oil due to difficult market
situation for frozen products.
• Lower sales volumes frozen horse mackerel
q-o-q
• Nigeria has issued a new import quota from
August onwards
• Increased raw material intake and production
of frozen squid
•
Low volumes of raw material in Peru for Q2
Sales volumes:
EBITDA
(MNOK)
40,0
30,0
20,0
10,0
27,9
12,9
-16,3
-10,0
-24,3
-23,3
Q3 2013
Q4 2013
-16,9
-20,0
-30,0
Q1 2013
35
Q2 2013
www.auss.no
Q1 2014
Q2 2014
Austevoll Seafood ASA
Associated companies
Pelagia AS (100% figures)
•
Raw material intake 301,000 MT vs 195,000 MT in
same quarter 2013.
•
Increased raw material intake q-o-q due to:
• delayed Blue whiting fisheries
• good catches of Sand eel
•
Russian sanctions against Norwegian seafood
products from August 7th.
AUSS`s share = 50%
(MNOK)
Q2 2014
Q2 2013 *
Revenue
1 070,8
1 036,7
EBITDA
40,2
60,2
EBIT
-2,3
18,4
2 005
2 606
Net interest bearing debt
* Proforma as if Pelagia AS w as eststablished 01.01.2013.
EBITDA
(MNOK)
200,0
180,0
160,0
140,0
120,0
100,0
80,0
186,3
157,1
60,0
40,0
20,0
116,2
119,2
60,2
40,2
Q1 2013 P Q2 2013 P Q3 2013 P Q4 2013 P
36
www.auss.no
Q1 2014
Q2 2014
Austevoll Seafood ASA
Associated companies
Br. Birkeland AS (100% figures)
•
Low season for the pelagic fishing vessels
•
Salmon
• Harvested volume (GWT) 2,529 MT
• EBIT/kg NOK 9.23
AUSS`s share = 49,99%
(MNOK)
Q2 2014
Q2 2013
Revenue
118,0
124,0
EBITDA
27,0
39,0
EBIT*
18,0
30,0
281
334
Net interest bearing debt
* before biomass adj.
EBITDA
(MNOK)
70,0
60,0
50,0
40,0
64,0
30,0
20,0
10,0
39,0
26,0
26,0
25,0
27,0
Q1 2014
Q2 2014
Q1 2013
37
Q2 2013
Q3 2013
www.auss.no
Q4 2013
Austevoll Seafood ASA
Associated companies
Norskott Havbruk AS (100% figures)
•
High contract share
•
Negative cost impact y-o-y
• Higher feed cost
•
Biological health status good
•
Expected harvest in 2014 25,000 GWT
LSG`s share = 50%
(MNOK)
Q2 2014
Q2 2013
Revenue
332
211
EBITDA
82
53
EBIT*
68
40
6,6
5,1
10,2
7,9
187
329
Volumes (1.000 gwt)
EBIT/kg* (NOK)
Net interest bearing debt
EBIT*/kg
(NOK)
14,0
12,0
10,0
8,0
6,0
12,0
4,0
7,9
9,5
9,1
Q3 2013
Q4 2013
10,2
5,9
2,0
* Before biomass adjustment
Q1 2013
38
Q2 2013
www.auss.no
Q1 2014
Q2 2014
Austevoll Seafood ASA
Associated companies
Villa Organic AS (100% figures)
•
Company was split in July 2014. LSG`s share to be
reported on 100% basis in H2 2014
•
Q2/14 includes several one-off cost in connection
with the split of the company
•
The Group is positive towards the potential for
farming in Finmark
LSG`s share = 49,5%
(MNOK)
Q2 2014
Q2 2013
215
160
EBITDA
46
42
EBIT*
37
34
Revenue incl.gains
Volumes (1.000 gwt)
5,1
2,4
EBIT/kg* (NOK)
7,4
13,8
-204
168
Net interest bearing debt **
EBIT*/kg
(NOK)
20,0
15,0
10,0
17,0
13,8
5,0
12,6
7,4
6,2
-5,4
* Before biomass adjustment
** Positive NIBD Q2 2014
-5,0
-10,0
Q1 2013
39
Q2 2013
Q3 2013
www.auss.no
Q4 2013
Q1 2014
Q2 2014
Austevoll Seafood ASA


© Copyright 2026