
Document 399091
WEEK OF NOVEMBER 3 - 7, 2014
DAIRY MARKET NEWS
VOLUME 81, REPORT 45
NATIONAL DAIRY MARKET NEWS AT A GLANCE
CME GROUP CASH MARKETS (11/7)
BUTTER: Grade AA closed at $2.0075. The weekly average for Grade
AA is $2.0085 (+.1685).
CHEESE: Barrels closed at $2.1200 and 40# blocks at $2.2000. The
weekly average for barrels is $2.1290 (+.0945) and blocks, $2.1780
(+.0520).
BUTTER HIGHLIGHTS: The butter market is firming as sales into
retail and food service accounts grow seasonally. Production decisions for
churn operators vary largely on incoming orders. Butter makers are putting
increased emphasis on managing inventories closely to ensure that
minimal stock building occurs over the last two months of 2014. Export
orders are lackluster, given higher U.S. butter prices compared to
competing global markets. Domestic buyer interest is strong for retail and
food service segments, while being at moderate levels for ingredient
butter. Bulk butter prices ranged from 5 cents under to 6 cents over
market, with various time frames and averages used. Friday at the CME
Group, Grade AA butter closed at $2.0075, up $0.1175 from last Friday.
The NASS Dairy Products report noted September U.S. butter production
totaled 130.1 million pounds, up 1.2% from last month, but 1.6% lower
than a year ago. January-September U.S. production totals 1.378 billion
pounds, 2.5% behind 2013 during the same time span. According to FAS,
January–September U.S. butter exports total 139.6 million pounds, a 2%
increase compared to last year.
CHEESE HIGHLIGHTS: Cheese orders are increasing from retail
buyers but manufacturers are being cautious about allowing inventories to
get too far beyond order requirements. Milk is readily available in all
regions and many cheese plants have active current schedules to fill preholiday orders. A concern of manufacturers is the lower price levels of
foreign cheese relative to prevailing prices in the U.S. Nevertheless, in
some plants with committed milk supplies, manufacturing cheese is
preferred to using milk to manufacture other dry dairy products at current
pricing. The Foreign Agricultural Service (FAS), reports that September
2014 U.S. cheese and curd exports totaled 61.4 million pounds, a 9%
increase from a year ago. Dairy Products (NASS) reports total 2014 U.S.
cumulative cheese production through September, 8.47 billion pounds,
leads last year through September by 2.7%. Friday at the CME Group,
barrels closed at $2.1200 up 1 cent from a week ago and 40# blocks at
$2.2000, up 6 cents from a week ago.
FLUID MILK: On farm milk production is steady across the
northern tier of states. Milk haulers serving those regions indicated
declines in milk load volumes have tapered down. In the South Central
and Southwest areas, California and Florida, milk production is increasing.
Milder weather throughout this southern tier has improved cow comfort.
Bottler orders are generally steady to declining as some school systems
will not operate meal programs next Tuesday. However, orders for
Thanksgiving week are increasing as that is generally an active week for
consumer sales of milk products.
DRY PRODUCTS: Dry dairy product prices are weakening as
nearing year end accountings have sparked a need for sales to lessen
inventories. Low/medium heat nonfat dry milk markets have been
unsettled during the last month, but buyers and sellers connected at lower
prices during the week. High heat NDM markets are mixed. Dry
buttermilk markets are weak, and regional supplies are uneven. Buyers are
shopping based on price, location, and destination. Dry whey markets are
soft, with Western, Central, and Northeast prices trending lower. As lower
international prices stanch export sales, domestic dry whey inventories are
building. The lactose market is soft. Inventories at some locations are
building and many offshore buyers are content to negotiate slowly. The
whey protein concentrate 34% market is seeking support near the price
level of NDM. FOB spot trading was at generally lower prices. Dry
whole milk and casein prices are steady.
INTERNATIONAL DAIRY MARKET NEWS (DMN):
WESTERN AND EASTERN EUROPE: WESTERN OVERVIEW:
Western Europe milk production has declined to its lowest levels of the
season. Week to week production levels are mixed with some countries
continuing to decline, others are showing steady production, and a few are
showing some marginal increases. Demand for fresh milk products is
good. Milk prices have declined but are still at profitable levels which
encourage milk production. Production in most countries is above year
ago levels. Estat - Newcronos reported EU-28 January to August milk
deliveries are 5.6% higher than the same period in 2013. Various member
states showed the following January to August increases compared to last
year: Germany, 4.3%; France, 6.8%; UK, 9.8%; Belgium, 7.8%; Italy,
3.5%; and Ireland, 6.4%. January-August milk delivery data showed
increases for all countries in Western Europe with the exception of Greece
-4.6%. EASTERN OVERVIEW: Milk production in Eastern Europe
continues to decline, but remains significantly above year ago levels. An
undetermined amount of cream and raw milk is making its way to Belarus
manufacturing plants. Skim milk powder manufacturers in Poland and
Finland saw increased exports to China during September. European milk
deliveries for January-August reported by Estat - Newcronos, showed the
CONTINUED ON PAGE 1 A
*****SPECIALS THIS ISSUE*****
SEPTEMBER DAIRY PRODUCTS (PAGE 14)
OCTOBER FMMO CLASS AND COMPONENT PRICING (PAGE 15)
SEPTEMBER CONSUMER PRICE INDEX (PAGE 16)
DAIRY GRAPHS (G1 - G4)
INTERNATIONAL DAIRY MARKET NEWS (PAGE 8 - 8B)
DAIRY FUTURES (PAGE 9)
OCTOBER MONTHLY AVERAGES (PAGES 10-12)
OCTOBER AGRICULTURAL PRICES PAGE 13)
CME GROUP CASH TRADING
COMMODITY
CHEESE
BARRELS
40# BLOCKS
MONDAY
NOV 03
WEDNESDAY
NOV 05
THURSDAY
NOV 06
FRIDAY
NOV 07
::
::
WEEKLY
CHANGE*
:: WEEKLY
:: AVERAGE#
$2.1100
(N.C.)
$2.1100
(N.C.)
$2.1600
(+.0500)
$2.1450
(-.0150)
$2.1200 ::
(-.0250) ::
(+.0100)
:: $2.1290
:: (+.0945)
$2.1400
(N.C.)
$2.1700
(+.0300)
$2.1800
(+.0100)
$2.2000
(+.0200)
$2.2000
(N.C.)
::
::
(+.0600)
:: $2.1780
:: (+.0520)
$1.2425
(N.C.)
$1.1950
(-.0475)
$1.1800
(-.0150)
$1.1600 ::
(-.0200) ::
(-.0825)
:: $1.2040
:: (-.0370)
$2.0200
(+.0900)
$2.0500
(+.0300)
$2.0350
(-.0150)
$2.0075 ::
(-.0275) ::
(+.1175)
:: $2.0085
:: (+.1685)
NONFAT DRY MILK
GRADE A
$1.2425
(N.C.)
BUTTER
GRADE AA
TUESDAY
NOV 04
$1.9300
(+.0400)
CHEESE: carload = 40,000 lbs., BUTTER: carlot = 40,000-43,000 lbs. *Sum of daily changes. # Weekly averages are simple averages of the daily closing prices for the calendar week.
Computed by Dairy Market News for informational purposes. This data is available on the Internet at WWW.AMS.USDA.GOV/DAIRYMARKETNEWS.
WEEK OF NOVEMBER 3 - 7, 2014
DAIRY MARKET NEWS
VOLUME 81, REPORT 45
NATIONAL DAIRY MARKET NEWS AT A GLANCE
CONTINUED FROM PAGE 1
following year over year changes for selected countries: Poland,+7.4%;
Lithuania, +8.0%; Latvia, +11.5%; Estonia, +8.4%; and the Czech
Republic, +0.6%.
OCEANIA OVERVIEW:
Australian milk
production has peaked in most states with intakes above year ago levels.
Domestic dairy commodity stocks are rebuilding with additional supplies
available for the export market. Concerns are growing regarding the dry
conditions, especially in southwest Victoria. The dry conditions will
reduce grazing and force producers to start supplemental feeding if rains do
not come soon. The dairy markets have a bearish undertone with some
analysts not anticipating a rebound in the current trends until mid-2015.
Some cooperatives have scaled back their financial profit outlooks for the
2014-15 production year noting expanded global milk supplies, lower
dairy commodity prices and greater market uncertainty as contributing
factors. According to Dairy Australia, September 2014 milk production in
Australia was 4.2% above September 2013. The state changes from a year
earlier are: New South Wales, +1.8%; Victoria, +3.9%; Queensland, 4.4%; South Australia, +0.4%; Western Australia, +6.1% and Tasmania
+16.2%. Dairy Australia reports Australian production of various dairy
commodities for August 2014 showed the following percentage changes
compared to 2013: butter, -3.1%; butteroil, +10.4%; skim milk powder,
+0.4%; whole milk powder, -42.6%; buttermilk powder, -1.8%; cheese,
+9.6%; and whey powder, +1.1%. Dairy Australia reports dairy product
exports for the July-September period totaling 161.8 thousand MT, up
8.3% from the year ago period. The skim milk powder (SMP) exports were
up 54% for the same period last year. The total value of exports for the
July-September period is down 2.5%. New Zealand milk production is
very strong with volumes above year ago levels. The seasonal peak in
production will be reached this week in some areas with volumes at or
exceeding historic highs. Weather conditions are favorable and pastures
and feed supplies are in good condition. Processors are attempting to clear
the heavy milk volumes as quickly as possible. August milk production as
reported by DCANZ was 1.39 million MT, up 4.5% from August 2013 and
14.1% higher than the level two years ago. August milksolids reflected a
6.2% increase compared August 2013. At the November 4 GDT event
#127, average prices ranged from 9.2% lower to 1.6% higher from the
prior event across categories. The all contracts price averages (US$ per
MT) and percent changes from the previous average are: anhydrous milk
fat, $3,292 -1.6%; butter, $2,505 -4.1%; buttermilk powder, $2,426 -6.9%;
cheddar cheese, $2,728 -9.2%; lactose, n.a.; rennet casein, $7,608 -2.2%;
skim milk powder, $2,457 -1.2%; sweet whey powder, n.a.; and whole
milk powder, $2,522 +1.6%.
-1A-
OCTOBER AGRICULTURAL PRICES (NASS): The All Milk
price received by farmers was $25.30 in October, down $0.40 from
September 2014, but up $4.40 from October 2013. Milk Cows price was
$2,120 in October, up $710 from October 2013. Alfalfa hay price was
$194.00 in October, up $1.00 from October 2013. Corn price was $3.28 in
October, down $1.35 from October 2013. Soybean price was $9.64 in
October, down $2.86 from October 2013. The milk-feed price ratio was
3.07 in October, up 0.94 from October 2013. The index of prices received
by farmers for dairy products during the month of October 2014 was down
2 points to 126. Compared to October 2013, the index was up 22 points
(21.2%). The index of prices paid by farmers for commodities and
services, interest, taxes, and wage rates in October 2014 was unchanged at
112. Compared with October 2013, the index was up 6 points (5.7%).
SEPTEMBER DAIRY PRODUCTS (NASS): Butter production
was 130.1 million pounds, 1.6% below September 2013, but 1.2% above
August 2014. American type cheese production totaled 361.1 million
pounds, 4.0% above September 2013, but 3.4% below August 2014. Total
cheese output (excluding cottage cheese) was 941.6 million pounds, 4.7%
above September 2013 and 0.2% above August 2014. Nonfat dry milk
production, for human food, totaled 114.1 million pounds, 54.1% above
September 2013, but 3.3% below August 2014. Dry whey production, for
human food, was 68.2 million pounds, 2.5% below September 2013 and
0.6% below August 2014. Ice cream regular (hard) production totaled 61.7
million gallons, 1.8% below September 2013 and 6.5% below August
2014.
OCTOBER FEDERAL MILK ORDER CLASS AND
COMPONENT PRICES (DAIRY PROGRAMS): The following are
the October 2014 prices under the Federal Milk Order pricing system and
the changes from the previous month: Class II $21.93 (-$4.18), Class III
$23.82 (-$0.78), and Class IV $21.35 (-$1.23). Under the Federal milk
order pricing system, the butterfat price for October 2014 is $2.8507 per
pound. Thus, the Class II butterfat price is $2.8577 per pound. The
protein and other solids prices for October 2014 are $3.7362 and $0.4670
per pound, respectively. These component prices set the Class III skim
milk price at $14.34. The October 2014 Class IV skim milk price is
$11.78, which is derived from the nonfat solids price of $1.3090 per
pound. The product price averages for October 2014 are: butter: $2.5255,
nonfat dry milk: $1.4900, cheese: $2.2914, and dry whey: $0.6525.
CONSUMER PRICE INDEX (BLS): The CPI for all food is 244.6,
up 3.0% from 2013. The dairy products index is 227.6, up 4.9% from a
year ago. The following are the September to September changes for
selected products: fresh whole milk is +8.7%; cheese, +6.8%; and butter,
+23.7%.
-2-
DAIRY MARKET NEWS, NOVEMBER 3 - 7, 2014
VOLUME 81, REPORT 45
CME GROUP
MONDAY, NOVEMBER 3, 2014
CHEESE -- SALES: NONE; LAST BID UNFILLED: NONE; LAST OFFER UNCOVERED: NONE
NONFAT DRY MILK -- SALES: NONE; LAST BID UNFILLED: 2 CARS GRADE A @ $1.2300; LAST OFFER UNCOVERED: NONE
BUTTER -- SALES: 1 CAR GRADE AA @ $1.9000; LAST BID UNFILLED: 1 CAR GRADE AA @ $1.9300; LAST OFFER UNCOVERED: NONE
TUESDAY, NOVEMBER 4, 2014
CHEESE -- SALES: NONE; LAST BID UNFILLED: 1 CAR 40# BLOCKS @ $2.1700; LAST OFFER UNCOVERED: NONE
NONFAT DRY MILK -- SALES: NONE; LAST BID UNFILLED: 1 CAR GRADE A @ $1.1900; LAST OFFER UNCOVERED: NONE
BUTTER -- SALES: NONE; LAST BID UNFILLED: 1 CAR GRADE AA @ $2.0200; LAST OFFER UNCOVERED: NONE
WEDNESDAY, NOVEMBER 5, 2014
CHEESE -- SALES: NONE; LAST BID UNFILLED: 1 CAR BARRELS @ $2.1600; 1 CAR 40# BLOCKS @ $2.1800; LAST OFFER UNCOVERED: NONE
NONFAT DRY MILK -- SALES: 5 CARS GRADE A: 1 @ $1.2200, 1 @ $1.2100, 3 @ $1.1950; LAST BID UNFILLED: NONE; LAST OFFER UNCOVERED: NONE
BUTTER -- SALES: 4 CARS GRADE AA: 1 @ $2.0300, 3 @ $2.0500; LAST BID UNFILLED: 1 CAR GRADE AA @ $2.0500; LAST OFFER UNCOVERED: NONE
THURSDAY, NOVEMBER 6, 2014
CHEESE -- SALES: NONE; LAST BID UNFILLED: 1 CAR 40# BLOCKS @ $2.2000; LAST OFFER UNCOVERED: 1 CAR BARRELS @ $2.1450
NONFAT DRY MILK -- SALES: 1 CAR GRADE A @ $1.1800; LAST BID UNFILLED: 1 CAR GRADE A @ $1.1700; LAST OFFER UNCOVERED: 1 CAR GRADE A @ $1.1950
BUTTER -- SALES: NONE; LAST BID UNFILLED: NONE; LAST OFFER UNCOVERED: 1 CAR GRADE AA @ $2.0350
FRIDAY, NOVEMBER 7, 2014
CHEESE -- SALES: NONE; LAST BID UNFILLED: NONE; LAST OFFER UNCOVERED: 1 CAR BARRELS @ $2.1200
NONFAT DRY MILK -- SALES: 2 CARS GRADE A @ $1.1600; LAST BID UNFILLED: 1 CAR GRADE A @ $1.1300; LAST OFFER UNCOVERED: NONE
BUTTER -- SALES: NONE; LAST BID UNFILLED: NONE; LAST OFFER UNCOVERED: 1 CAR GRADE AA @ $2.0075
BUTTER MARKETS
NORTHEAST
Most churning facilities are realizing a reduction in available cream
volumes this week. As a result, butter production is steady to slightly
lower. Holiday butter orders are good and growing for manufacturers, as
seasonal demands accelerate purchases. Short term buying for retail is
active. Manufacturers are fulfilling customer obligations, as inventories
track lower. The market undertone is firming. The current bulk butter
prices for domestic sales are reported 4-6 cents over the market of the CME
Group, with various time frames and averages used. At the CME, Grade
AA butter closed Tuesday at $2.0200, up $0.2500 from a week ago. The
Foreign Agricultural Service (FAS) reports that September 2014 U.S.
exports of butter and milk fat totaled 5.3 million pounds, a 79% decrease
from last year.
DAIRY PRODUCTS: According to NASS, U.S. butter production for
September 2014 totals 130.1 million pounds, down 1.6% from last year, but
up 1.2% from a month ago. Butter output in the Atlantic region totals 12.4
million pounds, up 20.1% from September 2013 and up 71.3% from a
month ago.
CENTRAL
Butter prices are strengthening while minimally impacting sales, which are
dramatically increasing particularly into the retail market segment. The
undertone is firming. Some manufacturers are adding to production lines by
churning additional spot loads of cream to keep up with incoming print
orders. Suppliers note retailers are pushing butter promotions more than in
previous weeks. Buyers describe interest and offerings for unsalted, 82% as
limited. Purchasers commented butterfat imports available in the spot
market. Manufacturers’ supplies are largely linked to orders, with marginal
stock building taking place. For the most part bulk butter end users are
working current inventories lower unless orders call for additional
ingredient purchases. Bulk butter prices reported ranged from market to 6
cents over the market, with various time frames and averages used.
Wednesday at the CME Group, Grade AA butter closed at $2.0500, up
$0.2000 from last Wednesday. The CME Group monthly average price for
Grade AA butter during October was $2.3184, compared to $1.5267 a year
ago. The NASS Dairy Products report noted September U.S. butter
production totaled 130.1 million pounds, up 1.2% from last month, but
1.6% lower than a year ago. January-September U.S. production totals
1.378 billion pounds, 2.5% behind 2013 during the same time span. October
production in the Central region totaled 51.4 million pounds, 2.0% lower
than a month ago and 2.3% less than last year. The Central region
accounted for 39.5% of U.S. production in September. January-September
Central production totals 533.8 million pounds, 2.2% behind the same time
span in 2013.
WEST
Churning in the West is active but manufacturers are also interested in
avoiding carrying inventories into next year. Many manufacturers are quite
conscious of keeping tight control over inventory levels. Some are actively
working to clear butter stocks by the end of the year. Current orders are
being met but production beyond that level is avoided. There is more than
enough cream available for churning requirements. In fact, some western
cream is moving between states in the region. Dairy Products (NASS)
reports total 2014 U.S. cumulative total butter production through
September, 1.378 billion pounds, lags last year through September by 2.5%.
Total U.S. September butter production, 130.1 million pounds, is 1.6%
below production during September last year. In the West, total butter
production for September 2014, 66.3 million pounds, was down 4.4% from
September 2013. Bulk butter prices range from market to -5 cents under,
based on the CME with various time frames and averages used. Butter
prices at the CME Group at midweek closed at $2.0500. Compared to last
Wednesday, butter prices are 20.0 cents higher.
CONTINUED ON PAGE 2A
NATIONAL DAIRY PRODUCTS SALES REPORT
U.S. AVERAGES AND TOTAL POUNDS
WEEK ENDING
November 1, 2014
BUTTER
CHEESE 40# BLOCKS
CHEESE BARRELS
38% MOISTURE
DRY WHEY
NDM
1.9882
3,814,843
2.2372
11,369,321
2.1271
8,972,580
0.6417
7,446,164
1.4578
17,067,915
Further data and revisions may be found on the internet at: http://www.ams.usda.gov/AMSv1.0/DairyProductMandatoryReporting
-2A-
DAIRY MARKET NEWS, NOVEMBER 3 - 7, 2014
CONTINUED FROM PAGE 2
2014 U.S. Butter and Milk Fat Exports, (USDA-FAS)
(Million Lb.)
September Total
Total, Jan – Sep
1
2
3
4
5
Saudi Arabia
Morocco
Iran
Egypt
Mexico
% Change From
1 Year Ago
5.3
-
79
139.6
+
2
32.6
17.8
14.0
10.5
6.9
+
+
+
6
56
26
14
81
VOLUME 81, REPORT 45
DAIRY MARKET NEWS, NOVEMBER 3 – 7, 2014
-3-
VOLUME 81, REPORT 45
CHEESE MARKETS
WISCONSIN WHOLESALE SELLING PRICES: DELIVERED,
DOLLARS PER POUND (1000 - 5000 POUNDS MIXED LOTS)
NORTHEAST
Cheese plants are maintaining busy schedules. Milk intakes continue
to encourage production volumes. Manufacturing stocks are sufficient.
Buyers who are careful of year-end inventory are holding back from
additional purchases. Last week, the weekly average cheese prices on
the CME Group were mixed. Wholesale prices for 40# block and
muenster moved lower $0.1375, as process 5# sliced moved higher
$0.0100. Grade A Swiss prices are steady. Tuesday’s CME Group
cash closing saw barrels end the day unchanged at $2.1100, up
$0.1000 from a week ago, while blocks closed at $2.1700, up $0.0700
from a week ago. The Foreign Agricultural Service (FAS), reports that
September 2014 U.S. cheese and curd exports totaled 61.4 million
pounds, a 9% increase from a year ago. Dairy Products (NASS) reports total U.S. cheese production in September 2014 was 941.6 million pounds, 4.7% more than a year ago. In the Atlantic region, total
cheese production for September was 121.3 million pounds, 1.8% less
than a year ago, but 3.2% more than the previous month. The region
produced 13% of U.S. cheese in September, unchanged from the previous month. Total cheese production and percent changes from one
year ago are the following: New York 69.1 million pounds, - 3.0%,
Pennsylvania 36.1 million pounds, + 6.0%, Vermont 10.0 million
pounds, + 2.5%.
WHOLESALE SELLING PRICES: DELIVERED,
DOLLARS PER POUND (1000 - 5000 POUNDS MIXED LOTS)
Cheddar 40# Block
Process 5# Sliced
Muenster
Grade A Swiss Cuts 10 - 14#
:
:
:
:
2.5200-2.8050
2.2575-2.7375
2.5400-2.9000
3.8500-4.1725
MIDWEST
Cheese orders leading into the end of year holiday season are being
filled by manufacturers. Orders this week are slightly increased. Production is steady, but not at capacity in some plants because manufacturers, being uneasy about cheese prices in coming months, are scheduling production to avoid getting too far ahead of orders. Some plants
are drawing on inventories to fill current orders. Milk going into
cheese is primarily patronage milk although, spot loads are available if
needed. Whether barrels or blocks are more readily available depends
on the plant in question. It is a mixed situation. Dairy Products
(NASS) reports total 2014 U.S. cumulative cheese production through
September, 8.47 billion pounds, leads last year through September by
2.7%. For various types of cheese, U.S. production through September
compared with the same period last year includes: American, +1.4%;
cheddar, +1.8%; total Italian, +4.9%; mozzarella, +6.9%; and other
Italian cheese types, +7.5%. Total U.S. Cheese production for September, 941.6 million pounds, was 0.2% above August and 4.7% above
September last year. In the Central region, cheese production for September 2014 compared with September 2013 was: total cheese, +3.2%;
American cheese, +6.0%; cheddar cheese, +8.1%; total Italian cheese,
+1.1%; and mozzarella cheese, -2.6%. Wisconsin wholesale prices
for 1,000 to 5,000 pound mixed lots of process cheese increased
$.0100, Swiss was unchanged and the remaining varieties decreased
$.1375. CME Group trading closed Wednesday with barrels at
$2.1600 up $.0950 from last Wednesday and blocks at $2.1800, up
$.0650 from last Wednesday.
Process American 5# Loaf
Brick And/Or Muenster 5#
Cheddar 40# Block
Monterey Jack 10#
Blue 5#
Mozzarella 5 - 6# (Low Moisture, Part Skim)
Grade A Swiss Cuts 6 - 9#
:
:
:
:
:
:
:
2.1350-2.4950
2.5000-2.9250
2.2050-2.6225
2.4750-2.6800
2.7675-3.7550
2.3450-3.2400
3.3675-3.4850
WEST
Cheese orders are increasing from retail buyers to build inventories in
advance of year-end holidays. Many manufacturers are meeting orders
but remain wary about allowing inventory levels to increase much
above what keeping the flow of orders moving requires. Lower price
levels of foreign cheese concerns manufacturers and deters inventory
building. Some manufacturers, who have been exporting cheese to
Mexico, are increasingly being challenged on a price basis by cheese
moving from other regions at prices that are very difficult for U.S.
manufacturers to profitably meet. Dairy Products (NASS) reports total
U.S. cheese production for September, 941.6 million pounds, was .2%
above August and 4.7% above September last year. U.S. production of
Swiss cheese during September, 23.0 million pounds, was 2.2% above
August 2014. Total Western cheese production for September 2014,
407.0 million pounds, was up .8% from August and 8.4% from September 2013. Western September 2014 production compared with
September 2013 for various varieties includes American cheese,
+2.1%; cheddar cheese, +4.6%; Italian cheese, +16.9%; and mozzarella
cheese, +20.6%. Western wholesale prices for 1,000 to 5,000 pound
mixed lots of process cheese increased $.0100, Swiss was unchanged
and the remaining varieties decreased $.1375. CME Group trading
closed Wednesday with barrels at $2.1600 up $.0950 from last
Wednesday and blocks at $2.1800, up $.0650 from last Wednesday. WHOLESALE SELLING PRICES: DELIVERED, DOLLARS PER POUND
(1000 - 5000 POUNDS MIXED LOTS)
Process 5# Loaf
Cheddar 40# Block
Cheddar 10# Cuts
Monterey Jack 10#
Grade A Swiss Cuts 6 - 9#
:
:
:
:
:
2.1650-2.4225
2.2475-2.6000
2.4275-2.6475
2.4375-2.5975
3.4275-3.8575
2014 U.S. Cheese and Curd Exports, (USDA-FAS)
(Million Lb.)
September
% Change From
1 Year Ago
61.4
+
9
Total Jan.-Sep.
640.2
+
26
1
2
3
4
5
136.4
122.0
98.2
32.8
31.2
+
+
+
+
+
7
50
87
68
63
Mexico
South Korea
Japan
Australia
Saudi Arabia
CONTINUED ON PAGE 3A
DAIRY MARKET NEWS, NOVEMBER 3 – 7, 2014
-3ACHEESE MARKETS
CONTINUED FROM PAGE 3
FOREIGN
Prices for domestic foreign type cheeses declined significantly this
week, while imported and Swiss cheese prices were unchanged. The
bulk of retail orders for the yearend holiday season have been made.
Wholesalers will augment their current supplies with additional orders
as demand for November and December dictate. Orders will be closely scrutinized as wholesalers will not want to carry heavy supplies into
2015. Imported and domestic foreign type cheese supplies are adequate to meet needs. Demand from retailers has been good.
WHOLESALE SELLING PRICES: FOB DISTRIBUTORS DOCK
DOLLARS PER POUND (1000 - 5000 POUNDS, MIXED LOTS)
VARIETY
Blue
Gorgonzola
Parmesan (Italy)
Provolone (Italy)
Romano (Cows Milk)
Sardo Romano (Argentine)
Reggianito (Argentine)
Jarlsberg-(Brand)
Swiss Cuts Switzerland
Swiss Cuts Finnish
*= Price change.
:
:
:
:
:
:
:
:
:
:
:
:
:
NEW YORK
IMPORTED
: DOMESTIC
:
2.6400-5.3800
: 2.6600-4.1475*
3.6900-6.9700
: 3.1625-3.8650*
-0: 4.0500-6.1400*
-0: 2.7025-2.9550*
-0: 3.8500-6.0000*
2.8500-4.4900
:
-03.2900-4.4900
:
-02.9500-6.0800
:
-0-0: 3.9475-4.2700
2.6700-2.9300
:
-0-
WEEKLY COLD STORAGE HOLDINGS - SELECTED STORAGE CENTERS
IN THOUSAND POUNDS - INCLUDING GOVERNMENT STOCKS
BUTTER
11/03/14
11/01/14
CHANGE
% CHANGE
12,189
12,593
-404
-3
: CHEESE
:
: 95,175
: 95,011
:
164
:
0
VOLUME 81, REPORT 45
DAIRY MARKET NEWS, NOVEMBER 3 - 7, 2014
-4-
VOLUME 81, REPORT 45
FLUID MILK AND CREAM
EAST
SPOT SHIPMENTS OF GRADE A MILK INTO OR OUT OF FLORIDA & SOUTHEASTERN STATES
THIS WEEK
FLORIDA
SOUTHEAST STATES
LAST WEEK
LAST YEAR
IN
OUT
IN
OUT
IN
OUT
58
0
170
0
88
0
0
0
0
0
0
0
Milk production in the Northeast and Mid-Atlantic regions is steady.
Bottling orders are steady to increasing, due to holiday demand.
Class II sales vary. Manufacturing milk supplies are heavy in some
instances, as designated pools of Thanksgiving milk clear to area
balancing plants. Florida is experiencing an uptick in milk
production. Spot shipments of Grade A milk into the state totaled 58
loads, 112 fewer than last week. Class I demand is seasonally
declining, although sales are expected to increase from short-term
retail buying as Thanksgiving draw nearer. Eastern cream supports a
seller’s market. Cream demand is strong, while supplies are tight.
Buyers short on supplies are finding it difficult to locate enough
cream to fulfill current contracts. As a result, delays in shipments are
occurring, as well as bids to redeem loads from previous spot
transactions. Tight supplies have pushed multiples higher. Cream
multiples for all Classes ranged 1.28–1.40. Cream cheese orders are
strong, with a considerable amount of last minute orders. Class II
demand is mostly steady for dairy products such as sour cream and
whipping cream. Last week, the CME Group Grade AA weekly
average butter price was $1.8400, down $0.1095 from the previous
week. DAIRY PRODUCTS: According to NASS, U.S. hard ice
cream production in the Atlantic region for September 2014 totaled
12.5 million gallons, 1.4% more than a year ago but, 6.6% less than
the previous month. U.S. yogurt production for September 2014
totaled 460.8 million pounds, up 6.2% from a year ago and up 14.7%
from the previous month. Cumulative 2014 production through
September totals 3.688 billion pounds, 1.8% higher than a year ago.
Condensed skim supplies are steady. Spot sales of condensed skim
are limited.
Contract volumes are increasing.
Class IV
manufacturing is mixed, as nonfat dry milk production rates show
some decline in the Mid-Atlantic region.
FLUID CREAM AND CONDENSED SKIM PRICES IN TANKLOT QUANTITIES
SPOT PRICES OF CLASS II CREAM, DOLLARS PER LB. BUTTERFAT:
F.O.B. producing plants: Northeast 2.3552-2.5760
F.O.B. producing plants: Upper Midwest 2.2080-2.4288
PRICES OF CONDENSED SKIM, DOLLARS PER LB. SOLIDS,
F.O.B. PRODUCING PLANTS:
Northeast - Class II - includes monthly formula prices 1.55-1.58
Northeast - Class III - spot prices 1.46-1.60
MIDWEST
Milk production is mostly steady with a few noted marginal
increases. Milk supplies are growing and curtailing prices on extra
loads. Milk spot loads ranged from $2.50 under Class to $0.50 over.
Bottling sales are mostly flat. Class II manufacturers are ramping up
production in light of holiday orders. Cream demand improved,
coming most notably from cream cheese makers. Cream multiples
ranged from 1.20 to 1.32. Wednesday at the CME Group, Grade AA
butter closed at $2.05, up $0.20 from last Wednesday. The DMN
monthly average of the range price series for Upper Midwest Class II
cream during October was $3.0600. The NASS Dairy Products report
noted September U.S. regular (hard) ice cream production totaled
61.7 million gallons, down 6.5% from a month ago and 1.8% below
last year. January-September U.S. production totals 594.8 million
gallons, 5.7% behind 2013 during the same time span. September
production in the Central region totaled 33.9 million gallons, 5.8%
lower than last month and 0.1% less than a year ago. The Central
region accounted for 55% of U.S. production in September. JanuarySeptember Central production totals 331.7 million gallons, 5.8%
behind the same time span in 2013. The weekly Cow Slaughter under
Federal Inspection report shows U.S. dairy cow slaughter for the
week ending October 18, at 55,700 head, 4,900 head or 8.1% less
than the comparable week a year ago. The NASS Crop Progress
report noted corn harvested in the 18 selected states as of November 2
was at 65%, equal to the 5-year average of 73% for the comparable
week. Soybeans harvested was at 83%, compared to the
5-year average of 83%.
WEST
Milk production in CALIFORNIA is inching upward, and remains
ahead of last year’s production. Rain arrived in many areas of the
state over the weekend, recording totals of up to 1 inch in some areas.
Although the moisture is welcome, the improvement on the drought
rating is minimal. The National Drought Mitigation Center shows
55.08% of California continues to experience Exceptional Drought.
Milk sales to bottlers are unchanged to slightly lower as some
educational institutions will not serve meals during next week’s
holiday. Retail orders are unchanged for the week, but bottlers are
working up orders for the Thanksgiving holiday when sales are
expected to climb.
The October 4a price butter/powder) in
CALIFORNIA is $21.51, down $1.21 from September 2014, but
$1.51 higher than last year. This compares to the Federal Order Class
IV price of $21.35 for October. The October 4b price (cheese) is
$20.94, $1.45 less than last month and $4.12 higher than last year.
This compares to the Federal Order Class III price for October at
$23.82. ARIZONA dairy operators report the uptick in milk
production is more noticeable and the new milk production season is
underway. Processors report the volumes of milk clearing to
manufacturing is rising as fluid milk demand is unchanged.
Condensed skim sales into Class II are steady to lower overall, but
orders moving toward production of some holiday cultured, whipped,
and aerated products is creeping higher. In NEW MEXICO, handlers
indicate tankers are leaving dairy farms with more milk volumes on
board. Interstate milk loads are also clearing through New Mexico
facilities. Sales into fluid accounts moved lower, but some milk is
stair-stepping eastward to fill fluid demand across the Southeast.
Class II sales are slightly higher as cultured and specialty product
manufacturing picks up ahead of the holidays. Western cream
markets are under less pricing pressure at the bottom of the multiples
range. The range now stretches from 1.07 – 1.15, differing by
location and basing points. Cream sales into soft serve mix are
seasonally lower. Western churn operators are shopping for cream to
add to in-house supplies as holiday print orders will run for a few
more weeks. Some sellers report trucks, drivers, and tanker trailers
are more difficult to obtain for moving cream loads. At the CME,
Grade AA butter closed on Wednesday at $2.0500, a 20 cent increase
compared to last week.
-CONTINUED ON PAGE 4A-
DAIRY MARKET NEWS, NOVEMBER 3 - 7, 2014
- 4AFLUID MILK AND CREAM
-CONTINUED FROM PAGE 4-
Cool but seasonal weather has been good for maintaining PACIFIC
NORTHWEST milk production. Washington has been wet in the
western part of the state, but dry further inland. Oregon has been wet
and rainy much of the week, with dryer weather expected over the
weekend. Milk demand has been steady and milk supplies are
adequate for manufacturing needs. UTAH and IDAHO milk
production is mostly steady, but at seasonal low levels. Much of the
fall harvesting is near completion and dairies are assessing feed
quantities and making decisions concerning herd size adjustments.
Snow has fallen in Utah but subsequent temperatures reaching the
60s have mitigated the impact. Idaho weather has been mild,
reaching the 50s during the day and barely freezing at night.
VOLUME 81, REPORT 45
DAIRY MARKET NEWS, NOVEMBER 3 - 7, 2014
VOLUME 81, REPORT 45
-5-
NONFAT DRY MILK, BUTTERMILK & WHOLE MILK
Prices represent carlot/trucklot quantities for domestic and export sales packaged in 25 kg. or 50 lb. bags, or totes, spray process, dollars per pound.
NONFAT DRY MILK - WEST
NONFAT DRY MILK - CENTRAL AND EAST
CENTRAL: Rising milk supplies are pushing low/medium heat
nonfat dry milk (NDM) production schedules to generally higher
rates, with a few nearing capacity levels. Prices moved lower as
various indices declined and some sellers moved large quantities at
discounts in light of growing inventories. Current prices have spurred
some cheese makers to buy supplies for fortifying. Various end users
who can, have switched to using NDM as an alternative ingredient.
However, overall buyer interest is light. Export orders are limited as
U.S. prices are not competitive with competing global markets. High
heat NDM prices are higher on moderate F.O.B. spot trading.
Demand is exceeding current supply offerings. Some manufacturers
note busy drying schedules are limiting high heat NDM production.
The DMN monthly average of the mostly price series for Central and
East low/medium heat NDM during October was $1.4277. The
October monthly average of the range price series for Central and
East high heat was $1.5494. The NASS Dairy Products report noted
U.S. human NDM production during September was 114.1 million
pounds, down 3.3% from a month ago, but 54.1% higher than last
year. January-September, U.S. human NDM production totals 1.311
billion pounds, 12.5% more than the same time span in 2013. Total
U.S. NDM human month ending stocks for September was 171.0
million pounds, 29.5% lower than last month, but 17.9% higher than a
year ago. September production in the Central region totaled 18.3
million pounds, 9.7% less than last month, but 60.2% higher than a
year ago. The Central region accounted for 16% of the total U.S.
production. Cumulative 2014 production in the Central region totals
212.6 million pounds, 3.1% more than the same time span in 2013.
Wednesday at the CME Group, Grade A NDM closed at $1.1950,
down $0.0450 from last Wednesday. The CME Group monthly
average price for Grade A NDM during October was $1.3345,
compared to $1.8601 a year ago. According to FAS, JanuarySeptember U.S. NDM exports totaled 949.1 million pounds, an
increase of 4% compared to the same time span in 2013.
EAST: Prices for the nonfat dry milk mostly series are lower, due to
declines in F.O.B. spot sale prices and indices. The market continues
to soften. Low/medium heat nonfat dry milk production is flat.
Inventories are growing. Spot transactions are more active on
discounted trades. High heat nonfat dry milk prices advanced through
the range. Some manufacturers are focused on drying high heat
nonfat dry milk, increasing the region’s production rates. Inventories
are adequate. Buyers are becoming more active in procuring product.
The Foreign Agricultural Service (FAS), reports that September 2014
U.S. nonfat dry milk exports totaled 70.8 million pounds, a 29%
decrease from a year ago.
DAIRY PRODUCTS: According to NASS, U.S. cumulative nonfat
dry milk production through September totaled 1.311 billion pounds,
12.5% more than 2013 during the same time span. The Atlantic
region production of nonfat dry milk totaled 14.9 million pounds,
68.5% more than a year ago. The September 2014 U.S. production
of skim milk powder, totaled 40.9 million pounds, 24.5% less than a
year ago. Cumulative YTD through September skim milk powder
production totals 417.8 million pounds, a 7.9% decrease from 2013.
F.O.B. CENTRAL/EAST: Includes EXTRA GRADE and GRADE A
LOW/MEDIUM HEAT: 1.1700 - 1.5625
MOSTLY: 1.2300 - 1.4850
HIGH HEAT:
1.4950 - 1.6300
Prices for Western low/medium heat nonfat dry milk are lower across
all price series. A few manufacturers took action to lessen holdings as
the end of the calendar year approaches. Buyers were willing to take
ownership of multiple NDM loads, as long as pricing was
comfortable for the near term. Low/medium heat NDM production is
active, and increasing at some plants as out of state milk loads were
sent to the closest drying plant. Western high heat prices are mixed
and movement outside of contracts is light. High heat NDM
production is intermittent. Inventories are steady. According to
NASS, in September 2014, California produced 43.7 million pounds
of NDM, about 38% of the national monthly production. NDM
production in the West region totaled 80.8 million pounds, 50.4%
more than one year ago. This is about 71% of total September
production in the U.S. Cumulative Western region 2014 production
totals 890.4 million pounds, a 13.1% increase compared to 2013. The
October 2014 Dairy Market News average of the mostly price series
for Western low/medium heat nonfat dry milk was $1.3886. The
average for Western high heat nonfat dry milk was $1.5398.
DAIRY PRODUCTS: NASS reports U.S. production of human food
NONFAT DRY MILK during September 2014 totaled 114.1 million
pounds, a 54.1% increase from one year ago. Cumulative nonfat dry
milk production for 2014 totals 1.311 billion pounds, 12.5% higher
than 2013. Month ending stocks, at 171.0 million pounds, are 17.9%
higher than one year ago. September 2014 production of SKIM
MILK POWDERS, which includes protein standardized and blended
product, totaled 40.9 million pounds, 24.5% lower than one year ago.
Cumulative 2014 skim milk powder production totals 417.8 million
pounds, a 7.9% decrease compared to 2013.
F.O.B. WEST: Includes EXTRA GRADE and GRADE A
LOW/MEDIUM HEAT: 1.1200 - 1.5325 MOSTLY:
1.1500 - 1.4500
HIGH HEAT:
1.4700 - 1.6000
U.S. NDM Exports, H.S. Code 0402100000(FAS)
2014 Exports
(Million Lb.)
September Total
TOTAL, JAN – SEP
1
2
3
4
5
Mexico
Philippines
China
Indonesia
Vietnam
70.8
% Change From
1 Year Ago
- 29
949.1
+ 4
330.0
126.1
93.8
75.8
70.7
+
+
+
+
10
21
1
19
33
DRY BUTTERMILK - CENTRAL AND EAST
CENTRAL: Dry buttermilk prices are unchanged on the bottom of
the range, while declining on the top of the range. The undertone is
weak as supplies are becoming increasingly available and discounts in
the F.O.B spot market more prevalent. Domestic interest is light,
while export demand is marginal. Some buyers are hesitant to take a
position. Production rates are steady to higher. The DMN monthly
average of the range price series for Central and East dry buttermilk
during October was $1.2393. The NASS Dairy Products report noted
U.S. dry buttermilk production during September totaled 8.3 million
pounds, 7.6% higher than last month and 21.2% above a year ago.
Total U.S. dry buttermilk month ending stocks for September was
18.6 million pounds, 33.2% more than a month ago and 139.9%
above last year.
-CONTINUED ON PAGE 5A-
DAIRY MARKET NEWS, NOVEMBER 3 - 7, 2014
VOLUME 81, REPORT 45
-5A-
NONFAT DRY MILK, BUTTERMILK & WHOLE MILK
Prices represent carlot/trucklot quantities for domestic and export sales packaged in 25 kg. or 50 lb. bags, or totes, spray process, dollars per pound.
-CONTINUED FROM PAGE 5-
CALIFORNIA MANUFACTURING PLANTS - NDM
EAST: Dry buttermilk prices are steady to lower. Production
stepped back somewhat this week, as a tight cream market and heavy
demand for available loads pulled volumes away from the churns.
New production is adding to inventory levels that are adequate for
near-term customer orders. Dry buttermilk is difficult to source
through the spot market, with prospective buyers limiting purchases
as prices decline. The market undertone continues to weaken.
DAIRY PRODUCTS: According to NASS, U.S. production of dry
buttermilk during September 2014 totaled 8.3 million pounds, 21.2%
more than a year ago and 7.6% more than the previous month. Month
ending stocks were 18.6 million pounds, 139.9% more than a year
ago and 33.2% more than the previous month.
F.O.B. CENTRAL/EAST:
1.0800 - 1.2250
DRY BUTTERMILK - WEST
Western dry buttermilk prices are lower on the mostly, and
unchanged to lower on the range. Buyers are perplexed at the seeming
shortage of dry buttermilk FOB spot loads while butter production is
active. Resellers seeking 2015 contracting opportunities report that
manufacturers continue to offer prices above the international market.
Those conversations are stalling out because of the current perception
by many buyers in the marketplace that the NDM/BM complex will
shift lower during the balance of Q4 to approximate world prices.
The October 2014 Dairy Market News average of the mostly price
series for West dry buttermilk was $1.3887.
DAIRY PRODUCTS: NASS reports dry buttermilk production in the
U.S. for September 2014 totals 8.3 million pounds, up 21.2% from
one year ago. Cumulative 2014 dry buttermilk production totals 83.6
million pounds, a 9% decrease compared to 2013. Stocks at the end
of September were 18.6 million pounds, a 140% increase from one
year ago.
F.O.B. WEST:
1.1600 - 1.4100 MOSTLY: 1.2900 - 1.3500
DRY WHOLE MILK - NATIONAL
Dry whole milk prices are steady on light trading. Market participants
are grappling with the preference to trade domestically and the
inability to find U.S. dry whole milk loads priced closer to
international pricing. Oceania dry whole milk is filling some domestic
demand for Q4, and a few contracts are in place for 2015 Q1.
Production is slow as manufacturers indicate stocks on hand are
enough to fill near term contracts. Most producers are unwilling to
schedule dry whole milk production for speculative inventory
buildup. The October 2014 Dairy Market News average of the price
series for dry whole milk was $1.7282.
DAIRY PRODUCTS: NASS reports U.S. dry whole milk production
during September 2014 totaled 12.9 million pounds, 171.9% higher
than one year ago. Cumulative 2014 production totals 82.3 million
pounds, a 52.7% increase compared to 2013. Month ending stocks, at
24.9 million pounds, are 251.1% higher than stocks of one year ago.
F.O.B. PRODUCING PLANT:
1.6000 - 1.8200
WEEK ENDING
PRICE
TOTAL SALES
October 31
October 24
$1.4892
$1.4939
8,539,287
9,290,632
Prices are weighted averages for Extra Grade and Grade A Nonfat Dry Milk, f.o.b.
California manufacturing plants. Prices for both periods were influenced by effects
of long-term contract sales. Total sales (pounds) include sales to CCC. Compiled by
Dairy Marketing Branch, California Department of Food and Agriculture.
-6-
DAIRY MARKET NEWS, NOVEMBER 3 - 7, 2014
VOLUME 81, REPORT 45
WHEY, WPC 34%, LACTOSE & CASEIN
Prices represent carlot/trucklot quantities for domestic and export sales packaged in 25 kg. or 50 lb. bags, or totes, spray process, dollars per pound.
DRY WHEY - CENTRAL
Prices of dry whey declined on lower F.O.B. spot trade prices and
weaker contract basing points. The market tone is weakening as
supply offering are increasing, while discounts are becoming deeper.
The export markets as well as cheaper alternative proteins are
causing some suppliers to adjust prices lower to remain competitive.
Production levels are generally steady to higher with ample milk
supplies going into cheese production. Domestic interest is light.
Export orders are declining. Animal feed whey prices are unchanged
to lower. Buyers note prices generally shifting towards the bottom
of the range. The DMN monthly average of the mostly price series
for Central dry whey during October was $0.6105. The monthly
average of the range price series for Central animal feed whey
during October was $0.4755. The NASS Dairy Products report
noted U.S. total dry whey production for September was 69.5
million pounds, down 0.1% from last month and 3.9% lower than a
year ago. January-September U.S. total dry whey production totals
653.7 million pounds, 10.6% behind the same time span in 2013.
U.S. total dry whey month ending stocks for September was 57.1
million pounds, 2.2% lower than a month ago and 5.0% less than
last year. September dry whey (human) production in the Central
region totaled 30.6 million pounds, 4.2% lower than last month and
8.3% less than a year ago. The Central region accounted for 45% of
the U.S. production. January-September Central dry whey (human)
production totals 305.2 million pounds, 11.9% behind the same time
span in 2013. According to FAS, January-August U.S. whey exports
total 393.4 million pounds, equal to the same time span in 2013.
F.O.B. CENTRAL: .4000 - .6800
MOSTLY:
F.O.B. CENTRAL: ANIMAL FEED MILK REPLACER:
potential. This leaves a weaker undertone to whey markets looking
forward. Current inventory levels are mixed, with some concern
with increased inventory in some locations. The October 2014
Dairy Market News monthly average price for Western dry whey
range was $0.5974; the Western dry whey mostly series averaged
$.5991. According to the NASS Dairy Products report, West total
dry whey production in September was 15.9 million pounds, up
1.6% from last month and 3.9% from a year ago. Edible whey
production for the U.S. in September totaled 68.2 million pounds,
down 2.5% from last year. The West produced 23.3% of the dry
whey in the U.S. in September. Cumulative total dry whey
production for the first nine months of the year is 653.7 million
pounds, down 10.6% from the same period in 2013. Manufacturers'
stocks at the end of September for edible whey are 56.3 million
pounds, down 1.6% from last year and 2.2% from last month.
NONHYGROSCOPIC:
.4800 - .6775
MOSTLY:
.5400 - .6375
U.S. Dry Whey Exports. H.S. Code 0404104000(FAS)
2014 Exports
% Change From
(Million Lb.)
1 Year Ago
September Total
36.7
- 13
TOTAL, JAN – SEP
393.4
N.C.
129.4
50.3
32.2
28.5
23.5
+
+
+
1
2
3
4
5
China
Mexico
Canada
Japan
Malaysia
2
61
10
8
41
.5400 - .6375
.3500 - .5775
WHEY PROTEIN CONCENTRATE - CENTRAL AND WEST
Prices for dry whey are lower at the top of the range due to indices
adjusting lower. Dry whey production is unchanged. Loads are
primarily clearing through contracts. Inventories are growing. The
market undertone continues to weaken. The September 2014 Dairy
Market News monthly average for Northeast dry whey range series
is $0.6671. The Foreign Agricultural Service (FAS), reports that
September 2014 U.S. dry whey exports totaled 36.7 million pounds,
a 13% decrease from a year ago. DAIRY PRODUCTS: According
to NASS, U.S. production of human food dry whey in September
2014 totaled 68.2 million pounds, 2.5% less than a year ago. Month
ending stocks of human food dry whey totaled 56.3 million pounds,
1.6% less than a year ago. In the Atlantic region, September
production of human food dry whey totaled 21.7 million pounds,
2.1% more than a year ago. Cumulative 2014 total dry whey
production is 653.7 million pounds, 10.6% less than 2013 during the
same time span.
Whey protein concentrate (WPC) 34% prices shifted lower on active
F.O.B spot trading. The market tone is unsettled with increased
downward pressure from cheaper alternatives. Domestic demand
from infant formula manufacturers is steady, while most other end
users show light interest. Export interest is reduced, with a few
exceptions of sellers noting some upticks in demand from Asian
countries. Production rates are steady to higher. The DMN monthly
average of the mostly price series for Central and West WPC extra
grade 34% protein during October was $1.3358. The NASS Dairy
Products report noted U.S. total WPC production for September was
42.1 million pounds, down 6% from last month, but 7.0% higher
than a year ago. January-September U.S. total WPC production
totals 400.9 million pounds, 10.6% ahead of the same time span in
2013. U.S. total WPC month ending stocks for September were 58.1
million pounds, 1.2% lower than a month ago, but 20.6% higher
than last year. According to FAS, January-August U.S. WPC less
than 80% exports total 172.0 million pounds, 11% below the same
time span in 2013.
F.O.B. NORTHEAST:
F.O.B. EXTRA GRADE 34% PROTEIN: 1.1000 - 1.5300 MOSTLY: 1.2000-1.3975
DRY WHEY - NORTHEAST
EXTRA GRADE AND GRADE A:
.6100 - .6900
DRY WHEY - WEST
Western whey prices are weaker with few spot loads. Cheese
production is strong, with some manufacturers moving milk through
cheese plants to capacity levels in preference to other manufacturing
options. Manufacturers are very conscious of U.S. prices being
higher than foreign whey prices and thereby limiting export
CONTINUED ON TO PAGE 6A
DAIRY MARKET NEWS, NOVEMBER 3 - 7, 2014
-6A-
VOLUME 81, REPORT 45
WHEY, WPC 34%, LACTOSE & CASEIN
Prices represent carlot/trucklot quantities for domestic and export sales packaged in 25 kg. or 50 lb. bags, or totes, spray process, dollars per pound.
CONTINUED FROM TO PAGE 6
CASEIN - NATIONAL
U.S. WPC < 80% Exports, H.S. Code 0404100500(FAS)
2014 Exports
% Change From
(Million Lb.)
1 Year Ago
Prices for both casein types are unchanged. The seasonally heavy
milk supplies in New Zealand have casein plants operating at near
capacity levels and stocks are building. European supplies are
readily available for rennet, somewhat tighter for acid casein.
Buyers are in no hurry to build inventories, knowing supplies will
likely be available in the future. Some rennet contracts have been
finalized for Q1 with prices under $4.00/lb. The market has a weak
undertone. At the November 4 GDT event 127, the average
winning price for rennet casein for all contract periods declined
2.2% to $7,608/MT or $3.4510/lb.
September Total
15.0
- 19
TOTAL, JAN – SEP
172.0
- 11
1
2
3
4
5
China
Canada
Mexico
Singapore
Indonesia
64.3
28.7
27.5
7.8
6.6
+
+
+
+
20
42
66
25
3
LACTOSE - CENTRAL AND WEST
Prices of lactose are mostly weaker on a soft market. Supplies
continue to outpace demand. The market is having an expanding
variance between the export and domestic markets along with other
factors such as brands and mesh sizes. Some suppliers are shifting
additional focus to domestic sales due to increased competition and
regulations in the export market. Production continues to be strong.
The DMN monthly average of the mostly price series for Central
and West lactose during October was $0.4218. The NASS Dairy
Products report noted U.S. lactose, human and animal, production
for September was 100.1 million pounds, up 1.5% from last month
and 13.7% higher than a year ago. January-September U.S. lactose
production totals 876.5 million pounds, 13.7% ahead of the same
time span in 2013. U.S. total lactose month ending stocks for
September was 119.3 million pounds, 0.7% lower than a month
ago, but 36.6% higher than last year. According to FAS, JanuaryAugust U.S. lactose exports total 349.4 million pounds, 9% below
the same time span in 2013.
Including spot sales and up to 3 month contracts.
F.O.B. EDIBLE, NON PHARMACEUTICAL .2500-.6200
MOSTLY: .3400-.4800
U.S. Lactose Exports, H.S. Code 1702110000(FAS)
2014 Exports
% Change From
(Million Lb.)
1 Year Ago
September Total
40.9
+
7
TOTAL, JAN – SEP
349.4
-
9
53.2
48.1
39.9
34.3
25.7
+
+
+
2
31
21
26
20
1
2
3
4
5
New Zealand
China
Mexico
Japan
Indonesia
SPOT SALES AND UP TO 3 MONTH CONTRACTS. PRICES ARE F.O.B., U.S.
WAREHOUSE FOR EDIBLE NONRESTRICTED AND VARY ACCORDING
TO MESH SIZE AND QUALITY.
RENNET:
ACID:
4.2000 - 4.8000
4.4000 - 5.0000
2014 U.S. Casein Imports (USDA-FAS)
(Million Lb.)
% Change From
1 Year Ago
Sep. Quota Imports
11.2
+ 18
Jan. – Sep.
Imports
New Zealand
Netherlands
Ireland
India
Uruguay
132.9
47.4
32.1
12.0
10.6
7.8
2
unchanged + 56 +
4 - 27 + 122
DAIRY MARKET NEWS, NOVEMBER 3 - 7, 2014
-7-
VOLUME 81, REPORT 45
U.S. Dairy Cow Slaughter (1000 head) under Federal Inspection & Comparable Week 2013
2014 WEEKLY
DAIRY COWS
55.7
WEEK ENDING
10/18/2014
2014
CUMULATIVE DAIRY COWS
2,257.3
2013 WEEKLY
DAIRY COWS
60.6
2013
CUMULATIVE DAIRY COWS
2,523.2
WEBSITE: http://www.ams.usda.gov/mnreports/sj_ls714.txt
SOURCE: The slaughter data are gathered and tabulated in a cooperative effort by the Agricultural Marketing Service,
The Food Safety and Inspection Service, and the National Agricultural Statistics Service, all of USDA.
CLASS III MILK PRICES (3.5% BF)
YEAR
2009
2010
2011
2012
2013
JAN
10.78
14.50
13.48
17.05
18.14
FEB
9.31
14.28
17.00
16.06
17.25
MAR
10.44
12.78
19.40
15.72
16.93
APR
10.78
12.92
16.87
15.72
17.59
MAY
9.84
13.38
16.52
15.23
18.52
JUN
9.97
13.62
19.11
15.63
18.02
JUL
9.97
13.74
21.39
16.68
17.38
AUG
11.20
15.18
21.67
17.73
17.91
SEP
12.11
16.26
19.07
19.00
18.14
OCT
12.82
16.94
18.03
21.02
18.22
NOV
14.08
15.44
19.07
20.83
18.83
DEC
14.98
13.83
18.77
18.66
18.95
AUG
10.38
15.61
20.14
15.76
19.07
SEP
11.15
16.76
19.53
17.41
19.43
OCT
11.86
17.15
18.41
18.54
20.17
NOV
13.25
16.68
17.87
18.66
20.52
DEC
15.01
15.03
16.87
17.83
21.54
SEP
23.63
26.11
24.60
22.58
OCT
24.19
21.93
23.82
21.35
NOV
24.06
DEC
CLASS IV MILK PRCES (3.5%)
YEAR
2009
2010
2011
2012
2013
JAN
9.59
13.85
16.42
16.56
17.63
FEB
9.45
12.90
18.40
15.92
17.75
MAR
9.64
12.92
19.41
15.35
17.75
APR
9.82
13.73
19.78
14.80
18.10
MAY
10.14
15.29
20.29
13.55
18.89
JUN
10.22
15.45
21.05
13.24
18.88
JUL
10.15
15.75
20.33
14.45
18.90
FEDERAL MILK ORDER CLASS PRICES FOR 2014 (3.5%)
CLASS
I 1/
II
III
IV
JAN
21.48
22.21
21.15
22.29
FEB
22.02
23.73
23.35
23.46
MAR
23.64
24.22
23.33
23.66
APR
23.65
24.74
24.31
23.34
MAY
24.47
24.44
22.57
22.65
JUN
22.86
23.94
21.36
23.13
JUL
23.02
24.41
21.60
23.78
AUG
23.87
25.34
22.25
23.89
1/ Specific order differentials to be added to this base price can be found by going to: www.ams.usda.gov/DairyMarketingStatistics; then
select “Prices”; and then select “Principal Pricing Points.”
Class I
Class II
$26.00
$26.00
$24.00
$24.00
$22.00
$22.00
$20.00
$20.00
$18.00
$18.00
2012
2013
$16.00
2014
$14.00
2012
$16.00
2013
$14.00
2014
$12.00
Jan
Feb
Mar
Apr
May
Jun
Jul
Aug
Sep
Oct
Nov
Dec
Jan
Feb
Mar
Apr
Class III
May
Jun
Jul
Aug
Sep
Oct
Nov
Dec
Class IV
$26.00
$24.00
$24.00
$22.00
$22.00
$20.00
$20.00
$18.00
$18.00
$16.00
2012
2013
$14.00
$16.00
2012
$14.00
2013
2014
$12.00
Jan
Feb
Mar
Apr
May
Jun
Jul
Aug
Sep
Oct
Nov
Dec
2014
$12.00
Jan
Feb
Mar
Apr
May
Jun
Jul
Aug
Sep
Oct
Nov
Dec
DAIRY MARKET NEWS, NOVEMBER 3 – 7, 2014
-8-
VOLUME 81, REPORT 45
INTERNATIONAL DAIRY MARKET NEWS - EUROPE
Information gathered October 27 – November 7, 2014
Prices are U.S. $/MT, F.O.B. port. Information gathered for this report is from trades, offers to sell, and secondary data. This bi-weekly report may not always contain the same
products and/or regions. Future reports may be included or withdrawn depending on availability of information. MT = metric ton = 2,204.6 pounds.
WESTERN OVERVIEW: Western European milk production
has declined to its lowest levels of the season. Week to week
production levels are mixed with some countries continuing to
decline, others are showing steady production, and a few are
showing some marginal increases. Demand for fresh milk
products is good. Milk prices have declined but are still at
profitable levels which encourage milk production. Production
in most countries is above year ago levels. Estat - Newcronos
reported EU-28 January to August milk deliveries are 5.6%
higher than the same period in 2013. Various member states
showed the following January to August increases compared to
last year: Germany, 4.3%; France, 6.8%; UK, 9.8%; Belgium,
7.8%; Italy, 3.5%; and Ireland, 6.4%. January-August milk
delivery data showed increases for all countries in Western
Europe with the exception of Greece -4.6%.
BUTTER/BUTTEROIL: Butter prices were unchanged this
reporting period. The bulk butter market has a firm undertone
and is being supported by good seasonal domestic demand and
reduced butter production. PSA stocks for butter in late October
were over 18,000 MT with Ireland, the Netherlands and Belgium
the top three contributors. Spot sales for export are quiet.
Negotiations for Q1 2015 orders are ongoing with buyers and
sellers a little closer in their pricing, but to date only a few
agreements have been transacted. Some export buyers are
holding off purchases, expecting supplies to increase in the
future with the possibility of lower prices. Butteroil prices
increased marginally on the low end of the range. Export sales
continue to be slow with most buyers favoring lower priced New
Zealand product.
82% BUTTERFAT:
99% BUTTERFAT:
3,550 - 3,950
4,325 - 5,000
SKIM MILK POWDER (SMP): Skim milk powder prices
moved lower this period. Production remains active with
manufacturing milk volumes above year ago levels. Exports
have been fairly active with interest coming from Asia, North
Africa and the Middle East. Inventory levels are not burdensome
at this time. SMP storage going into PSA in late October was
just over 11,800 MT, with Germany recording the largest
volumes. Some buyers are taking a wait and see approach to
future purchases, knowing that global SMP production is
increasing and supplies will be readily available at possibly
lower prices. Negotiations are ongoing for Q1 2015, but the
price gap between buyers and sellers impedes agreements being
finalized. According to GTIS, Germany, Poland and Finland
saw increased SMP exports into China during September.
1.25% BUTTERFAT:
2,225 - 2,600
WHOLE MILK POWDER (WMP): Prices for whole milk
powder moved lower. A majority of the market activity is being
transacted through existing contracts. Negotiations are ongoing
for Q1 2015, but buyers and sellers are having difficulty agreeing
on price. Domestic market activity is steady to light, while
export activity is limited. Nearly all export activity is being
conducted through existing contracts. Most buyers are looking
to the lower priced Oceania market to fill their orders.
Production has declined as milk production volumes and export
demand have decreased.
26% BUTTERFAT:
2,800 - 3,075
SWEET WHEY POWDER: Sweet dry whey prices moved
lower this week. Production has declined as cheese making has
slowed in response to the Russian import ban. Supplies are
mostly in balance with need. Demand is steady for both food
and feed grade whey.
NONHYGROSCOPIC:
1,100 - 1,325
EASTERN OVERVIEW: Milk production in Eastern Europe
continues to decline, but remains significantly above year ago
levels. An undetermined amount of cream and raw milk is
making its way to Belarus manufacturing plants. Skim milk
powder manufacturers in Poland and Finland saw increased
exports to China during September. European milk deliveries for
January-August reported by Estat - Newcronos, showed the
following year over year changes for selected countries:
Poland,+7.4%; Lithuania, +8.0%; Latvia, +11.5%; Estonia,
+8.4%; and the Czech Republic, +0.6%.
Exchange rates for selected foreign currencies:
November 3, 2014
.1175 Argentina Peso
.8681 Australian Dollar
.8804 Canadian Dollar
1.2482 Euro
.0163 India Rupee
.0088 Japan Yen
.0735 Mexican Peso
.7720 New Zealand Dollar
.2955 Poland Zloty
To compare the value of 1 US Dollar to Mexican Pesos:
(1/.0735) = 13.6054 Mexican Pesos. Source: "Wall Street
Journal"
DAIRY MARKET NEWS, NOVEMBER 3 – 7, 2014
VOLUME 81, REPORT 45
-8A-
INTERNATIONAL DAIRY MARKET NEWS - OCEANIA
Information gathered October 27 - November 7, 2014
Prices are U.S. $/MT, F.O.B. port. Information gathered for this report is from trades, offers to sell, and secondary data. This bi-weekly report may not always contain the same
products and/or regions. Future reports may be included or withdrawn depending on availability of information. MT = metric ton = 2,204.6 pounds.
AUSTRALIAN milk production has peaked in most states with intakes
above year ago levels. Domestic dairy commodity stocks are rebuilding with additional supplies available for the export market. Concerns
are growing regarding the dry conditions, especially in southwest Victoria. The dry conditions will reduce grazing and force producers to
start supplemental feeding if rains do not come soon. The dairy markets have a bearish undertone with some analysts not anticipating a
rebound in the current trends until mid-2015. Some cooperatives have
scaled back their financial profit outlooks for the 2014-15 production
year noting expanded global milk supplies, lower dairy commodity
prices and greater market uncertainty as contributing factors. According to Dairy Australia, September 2014 milk production in Australia
was 4.2% above September 2013. The state changes from a year earlier
are: New South Wales, +1.8%; Victoria, +3.9%; Queensland, -4.4%;
South Australia, +0.4%; Western Australia, +6.1% and Tasmania
+16.2%. Dairy Australia reports Australian production of various dairy
commodities for August 2014 showed the following percentage changes compared to 2013: butter, -3.1%; butteroil, +10.4%; skim milk powder, +0.4%; whole milk powder, -42.6%; buttermilk powder, -1.8%;
cheese, +9.6%; and whey powder, +1.1%. Dairy Australia reports dairy
product exports for the July-September period totaling 161.8 thousand
MT, up 8.3% from the year ago period. The skim milk powder (SMP)
exports were up 54% for the same period last year. The total value of
exports for the July-September period is down 2.5%. NEW ZEALAND milk production is very strong with volumes above year ago
levels. The seasonal peak in production will be reached this week in
some areas with volumes at or exceeding historic highs. Weather conditions are favorable and pastures and feed supplies are in good condition. Processors are attempting to clear the heavy milk volumes as
quickly as possible. August milk production as reported by DCANZ
was 1.39 million MT, up 4.5% from August 2013 and 14.1% higher
than the level two years ago. August milksolids reflected a 6.2% increase compared August 2013. At the November 4 GDT event 127,
average prices ranged from 9.2% lower to 1.6% higher from the prior
event across categories. The all contracts price averages (US$ per MT)
and percent changes from the previous average are: anhydrous milk fat,
$3,292 -1.6%; butter, $2,505 -4.1%; buttermilk powder, $2,426 -6.9%;
cheddar cheese, $2,728 -9.2%; lactose, n.a.; rennet casein, $7,608 2.2%; skim milk powder, $2,457 -1.2%; sweet whey powder, n.a.; and
whole milk powder, $2,522 +1.6%.
BUTTER: Butter prices declined on both ends of the range. Production is strong and supplies are building. Butter production is significantly outpacing demand. Export interest from North Africa and the
Middle East is good. Japan has become an opportunity for increased
exports as Japanese authorities have announced plans to import 3,000
MT of butter to augment supplies for the yearend holidays. According
to GTIS, China’s January to September butter imports show a 94%
increase, compared to last year with AMF imports up 93% for the same
period. New Zealand’s September butter exports to China were comparable to year ago levels. New Zealand continues to be the major exporter of butter and AMF to China. At the November 4 GDT event 127,
NZ butter averaged $2,525/MT for the January, 2015 contracts, -3.1%
from the prior event. Butter for all regions and contracting periods
averaged $2,505/MT, -4.1%. New Zealand AMF prices averaged
$3,253/MT for the January, 2015 contracts, -2.1% from the prior event.
For all contract periods, the AMF price average was $3,292/MT, -1.6%.
82% BUTTERFAT:
2,425 - 3,200
SKIM MILK POWDER (SMP): Prices moved lower on both ends of
the range with a more significant decline on the upper end of the range.
Manufacturing milk volumes are very heavy and production is at capacity levels at most plants. Supplies are building with some manufacturers becoming anxious to get sales on the books as supplies are expanding. Buyers, knowing that global supplies are increasing, are more
often than not, in no hurry to purchase and willing to wait for possible
lower prices in the future. Japanese authorities have announced plans
to import 10,000 MT of SMP to expand supplies for the yearend holidays. A majority of the Japanese imports are expected to come from
Oceania. According to GTIS, China’s imports of skim milk powder
decreased again in September, following declines in August. New
Zealand saw its share of exports to China decline with increased shares
going to the U.S. and Europe. The January to September totals show
China’s SMP imports 35% over year ago levels. At the November 4
GDT event 127, SMP for all regions and contracting periods averaged
$2,457 per MT, -1.2%. For trading in contract period 2, January 2015,
prices averaged $2,370 for NZ sourced medium heat product, down
$65 from the prior event.
1.25% BUTTERFAT:
2,350 - 2,800
CHEDDAR CHEESE: Cheese prices moved lower on the upper end
of the range. Production is active due to heavy seasonal milk volumes
and also because cheddar is providing a better return compared to other
commodities. Australian cheese stocks remain fairly tight and are under good domestic demand. Australian mozzarella production has increased, due to good Asian demand, and is reducing cheddar production. Supplies for export are more readily available from New Zealand
than from Australia. According to GTIS, New Zealand doubled its
cheese exports into China during September. January to September
cheese imports into China are 51% above year ago levels.
39% MAXIMUM MOISTURE:
3,500 - 4,200
WHOLE MILK POWDER (WMP): The whole milk powder price
range decreased with the upper end of the range declining more than
the lower end. Whole milk powder production is strong as milk production is near the seasonal peak. Supplies are building and demand
remains weak. Expectations for a strong return to the market by China
are diminishing as supplies in that country appear to be ample. The
lower tariff rates in January for China are less of a factor this year on a
downward trending market than they were last year when prices were
near record highs. According to GTIS, China’s whole milk powder
imports have declined for six consecutive months with September imports at the lowest level of the year. January to September whole milk
powder imports into China are cited at 57% above year ago levels. At
the November 4 GDT event 127, the WMP pricing index, across all
contracting periods, averaged $2,522 per MT, up 1.6% compared to the
prior event. For contract periods 1 and 2, December 2014 and January
2015, NZ regular WMP averaged $2,525 and $2,440 per MT.
26% BUTTERFAT:
2,425 - 2,850
DAIRY MARKET NEWS, NOVEMBER 3 – 7, 2014
-8B-
VOLUME 81, REORT 45
INTERNATIONAL DAIRY MARKET NEWS - OCEANIA
Global/Dairy Trading (gDT) Event 127 Recap ‐ November 4, 2014 US$/MT Anhydrous Milk Fat Bu er Bu ermilk Powder Cheddar Lactose Rennet Casein Contract 1 Dec‐14 n.a. n.a. n.a. n.a. n.a. n.a. Contract 2 Jan‐15 $3,253 ‐2.1% $2,525 ‐3.1% $2,415 ‐6.8% $2,625 ‐13.0% n.a. $7,590 ‐1.5% Skim Milk Powder n.a. $2,424 Sweet Whey Powder n.a. Whole Milk Powder $2,547 ‐5.7% $2,469 Contract 3 Feb‐15 $3,303 ‐1.3% $2,425 ‐6.2% $2,530 ‐7.0% $2,756 ‐8.3% n.a $7,625 ‐3.4% ‐1.0% $2,475 n.a. ‐0.6% $2,506 Contract 4 Contract 5 Contract 6 Mar‐15 Apr‐15 May‐15 $3,273 ‐1.3% $3,372 ‐1.4% $3,455 0.2% $2,530 ‐4.2% $2,600 ‐2.6% n.a. n.a. n.a. n.a. $2,823 ‐5.5% n.a. n.a. n.a. n.a. n.a. $7,625 ‐2.5% n.a. n.a. ‐1.4% $2,438 n.a ‐0.2% $2,664 ‐4.5% $2,616 n.a. 0.2% $2,822 n.a. 6.0% $2,457 7.5% $2,794 10.4% $2,788 All Contracts $3,292 ‐1.6% $2,505 ‐4.1% $2,426 ‐6.9% $2,728 ‐9.2% n.a. $7,608 ‐2.2% n.a. ‐1.2% n.a. 1.6% $2,522 1.6% Average price US$/MT and % change in indices from previous event. Global/Dairy Trading (gDT) Event 127 Recap ‐ November 4, 2014 US$/Pound Anhydrous Milk Fat Bu er Bu ermilk Powder Cheddar Lactose Rennet Casein Contract 1 Contract 2 Contract 3 Contract 4 Contract 5 Contract 6 All Contracts Dec‐14 Jan‐15 Feb‐15 Mar‐15 Apr‐15 May‐15 n.a. $1.4756 ‐2.1% $1.4982 ‐1.3% $1.4846 ‐1.3% $1.5295 ‐1.4% $1.5672 0.2% $1.4932 ‐1.6% n.a. $1.1453 ‐3.1% $1.1000 ‐6.2% $1.1476 ‐4.2% $1.1794 ‐2.6% n.a. $1.1363 ‐4.1% n.a. $1.0954 ‐6.8% $1.1476 ‐7.0% n.a. n.a. n.a. $1.1004 ‐6.9% n.a. $1.1907 ‐13.0% $1.2501 ‐8.3% $1.2805 ‐5.5% n.a. n.a. $1.2374 ‐9.2% n.a. n.a. n.a n.a. n.a. n.a. n.a. n.a. $3.4428 ‐1.5% $3.4587 ‐3.4% $3.4587 ‐2.5% n.a. n.a. $3.4510 ‐2.2% Skim Milk Powder n.a. $1.0995 Sweet Whey Powder n.a. Whole Milk Powder $1.1553 ‐5.7% $1.1199 Average price US$/pound and % change from previous event. ‐1.0% $1.1227 n.a. ‐0.6% $1.1367 ‐1.4% $1.1059 n.a ‐0.2% $1.2084 ‐4.5% $1.1866 n.a. 0.2% $1.2801 n.a. 7.5% $1.2674 10.4% $1.2646 6.0% $1.1145 n.a. ‐1.2% n.a. 1.6% $1.1440 1.6% DAIRY MARKET NEWS, NOVEMBER 3 - 7, 2014
-9-
VOLUME 81, REPORT 45
CME GROUP, INC FUTURES
Selected settling prices, (open interest)
Month
10/23
10/24
CLASS III MILK FUTURES (Pit-Traded) ($/cwt)
10/27
10/28
10/29
10/30
10/31
OCT 14
NOV 14
DEC 14
JAN 15
FEB 15
MAR 15
APR 15
MAY 15
JUN 15
JUL 15
23.90 (5510)
21.22 (4499)
19.05 (3906)
18.04 (3452)
17.22 (3383)
17.07 (3016)
16.88 (2545)
16.83 (2430)
16.98 (2227)
17.00 (1644)
23.90 (5483)
21.31 (4517)
19.12 (3908)
18.07 (3471)
17.33 (3396)
17.10 (3016)
16.89 (2550)
16.90 (2460)
17.04 (2253)
17.08 (1656)
23.90 (5427)
21.37 (4511)
19.36 (3924)
18.34 (3500)
17.66 (3443)
17.26 (3064)
17.00 (2538)
17.04 (2494)
17.11 (2281)
17.13 (1673)
23.79 (5430)
21.25 (4545)
19.28 (3960)
18.24 (3514)
17.57 (3453)
17.21 (3102)
17.02 (2552)
17.02 (2536)
17.10 (2303)
17.15 (1708)
23.79 (5425)
21.25 (4599)
18.99 (4102)
17.85 (3557)
17.41 (3525)
17.06 (3151)
16.90 (2567)
16.91 (2543)
17.01 (2320)
17.10 (1711)
21.80 (1016)
18.02 (975)
16.93 (971)
21.80 (1016)
17.75 (992)
17.00 (970)
21.84 (1013)
17.72 (1002)
16.98 (974)
21.50 (1013)
17.46 (1030)
16.98 (974)
260.93 (1154)
178.00 (1192)
170.75 (982)
261.98 (1141)
177.25 (1191)
172.75 (985)
151.23 (537)
145.00 (624)
137.00 (724)
151.20 (537)
144.55 (626)
137.00 (725)
65.18 (404)
63.00 (347)
59.10 (424)
2.30 (1755)
2.06 (2197)
1.86 (2348)
1.79 (1997)
1.73 (2036)
1.75 (2020)
23.94 (5563)
21.01 (4510)
18.66 (3970)
17.76 (3422)
17.10 (3303)
17.09 (2971)
16.93 (2504)
16.85 (2383)
16.96 (2167)
17.02 (1580)
23.88 (5589)
20.79 (4517)
18.63 (3927)
17.83 (3450)
17.00 (3343)
17.06 (3001)
16.92 (2523)
16.85 (2407)
16.95 (2199)
17.02 (1594)
11/03
11/04
11/05
23.79 (5377)
21.27 (4606)
18.94 (4174)
17.52 (3653)
17.12 (3585)
16.83 (3183)
16.75 (2599)
16.79 (2565)
16.92 (2381)
17.02 (1729)
23.78 (5382)
21.42 (4593)
19.19 (4130)
17.58 (3698)
17.21 (3719)
16.85 (3218)
16.75 (2649)
16.76 (2608)
16.86 (2416)
17.05 (1746)
23.82 (4779)
21.82 (4494)
19.50 (4098)
17.60 (3709)
17.12 (3739)
16.79 (3254)
16.70 (2674)
16.73 (2623)
16.84 (2440)
17.00 (1768)
21.43 (1013)
17.46 (1033)
16.98 (974)
21.43 (1013)
17.46 (1050)
16.98 (974)
21.43 (1011)
17.64 (1055)
17.10 (973)
21.35 (1106)
17.83 (1068)
17.13 (973)
253.00 (1142)
175.88 (1198)
174.50 (990)
253.00 (1142)
178.00 (1203)
175.75 (990)
253.00 (1142)
178.75 (1206)
175.25 (990)
252.75 (1142)
183.75 (1199)
179.65 (994)
252.55 (1089)
189.50 (1212)
180.50 (990)
151.00 (536)
144.30 (630)
137.00 (724)
150.70 (535)
142.75 (626)
136.50 (724)
149.70 (526)
141.50 (624)
135.25 (719)
149.70 (526)
140.70 (624)
135.25 (719)
149.70 (526)
140.70 (624)
135.25 (719)
149.00 (439)
140.60 (626)
134.98 (719)
65.38 (405)
63.35 (347)
61.28 (426)
65.38 (405)
63.50 (347)
61.08 (425)
65.08 (404)
61.00 (346)
58.75 (414)
65.08 (404)
59.50 (345)
57.00 (415)
65.08 (404)
59.50 (345)
55.88 (423)
65.08 (404)
60.13 (344)
56.25 (425)
65.25 (457)
60.13 (344)
56.25 (424)
2.30 (1728)
2.07 (2187)
1.86 (2357)
1.79 (2005)
1.74 (2043)
1.75 (2024)
2.30 (1734)
2.09 (2188)
1.89 (2360)
1.81 (2009)
1.76 (2037)
1.76 (2029)
2.29 (1734)
2.08 (2186)
1.89 (2377)
1.82 (2022)
1.77 (2044)
1.75 (2043)
2.29 (1734)
2.09 (2188)
1.87 (2402)
1.78 (2064)
1.76 (2094)
1.75 (2083)
2.29 (1732)
2.09 (2191)
1.88 (2472)
1.76 (2135)
1.73 (2133)
1.73 (2136)
2.29 (1732)
2.11 (2193)
1.90 (2471)
1.77 (2167)
1.76 (2165)
1.74 (2165)
2.29 (1805)
2.14 (2198)
1.93 (2482)
1.76 (2202)
1.74 (2197)
1.73 (2207)
CLASS IV MILK FUTURES (Pit-Traded) ($/cwt)
OCT 14
NOV 14
DEC 14
21.92 (1023)
18.45 (974)
17.10 (971)
21.76 (1022)
18.15 (974)
17.07 (967)
CASH SETTLED BUTTER FUTURES (Electronic-Traded) (¢/lb)
OCT 14
NOV 14
DEC 14
261.68 (1143)
190.00 (1188)
175.50 (970)
60.93 (1155)
185.00 (1189)
172.75 (970)
260.93 (1154)
183.00 (1184)
174.00 (976)
NONFAT DRY MILK FUTURES (Pit-Traded) (¢/lb)
OCT 14
NOV 14
DEC 14
151.23 (537)
145.00 (624)
138.50 (723)
151.23 (537)
145.00 (624)
137.75 (721)
WHEY (Electronic-Traded) (¢/lb)
OCT 14
NOV 14
DEC 14
65.25 (405)
61.50 (350)
59.45 (425)
65.18 (404)
61.50 (350)
59.50 (424)
CHEESE CSC (Electronic-Traded) ($/lb)
OCT 14
NOV 14
DEC 14
JAN 15
FEB 15
MAR 15
2.30 (1692)
2.05 (2220)
1.82 (2378)
1.78 (1952)
1.73 (1974)
1.75 (1938)
2.30 (1744)
2.03 (2231)
1.82 (2348)
1.78 (1985)
1.73 (2016)
1.75 (2005)
Source: http://www.cmegroup.com/market-data/daily-bulletin.html
DAIRY MARKET NEWS, NOVEMBER 3 - 7, 2014
-10-
VOLUME 81, REPORT 45
MONTHLY SUMMARY AND AVERAGES FOR OCTOBER 2014 1/ - (UNLESS OTHERWISE NOTED, PRICES ARE DOLLARS PER POUND, CL/TL)
COMMODITY
::REPORT NUMBER 40 ::REPORT NUMBER 41 ::REPORT NUMBER 42 ::REPORT NUMBER 43 ::REPORT NUMBER 44 ::
2014 :
2013
::-----------------::-----------------::-----------------::-----------------::-----------------:: Monthly : Monthly
:: OCT 01 - 03 :: OCT 06 - 10 :: OCT 13 - 17 :: OCT 20 - 24 :: OCT 27 - 31 :: Average : Average
CHEESE
WISCONSIN (WSP, Delivered, LTL)
-- Process American 5# Loaf
-- Brick And/Or Muenster 5#
-- Cheddar 40# Block
-- Monterey Jack 10#
-- Blue 5#
-- Mozzarella 5 - 6#
-- Grade A Swiss Cuts 6 - 9#
::
::
::
::
::
::
::
2.5525
2.7175
2.4225
2.6925
2.9850
2.5625
3.3400
-
2.9125
3.1425
2.8400
2.8975
3.9725
3.4575
3.4575
::
::
::
::
::
::
::
2.2725
2.5550
2.2600
2.5300
2.8225
2.4000
3.3675
-
2.6325
2.9800
2.6775
2.7350
3.8100
3.2950
3.4850
::
::
::
::
::
::
::
2.2150
2.5400
2.2450
2.5150
2.8075
2.3850
3.3675
-
2.5750
2.9650
2.6625
2.7200
3.7950
3.2800
3.4850
::
::
::
::
::
::
::
2.2050
2.6125
2.3175
2.5875
2.8800
2.4575
3.3675
-
2.5650
3.0375
2.7350
2.7925
3.8675
3.3525
3.4850
::
::
::
::
::
::
::
2.1250
2.6375
2.3425
2.6125
2.9050
2.4825
3.3675
-
2.4850
3.0625
2.7600
2.8175
3.8925
3.3775
3.4850
::
::
::
::
::
::
::
2.4314
2.8188
2.5200
2.6838
3.3675
2.8988
3.4225
:
:
:
:
:
:
:
NORTHEAST (WSP, Delivered, LTL)
-- Cheddar 40# Block
-- Process 5# Sliced
-- Muenster
-- Grade A Swiss Cuts 10 - 14#
::
::
::
::
2.7375
2.6750
2.7575
3.8225
-
3.0225
3.1550
3.1175
4.1450
::
::
::
::
2.5750
2.3950
2.5950
3.8500
-
2.8600
2.8750
2.9550
4.1725
::
::
::
::
2.5600
2.3375
2.5800
3.8500
-
2.8450
2.8175
2.9400
4.1725
::
::
::
::
2.6325
2.3275
2.6525
3.8500
-
2.9175
2.8075
3.0125
4.1725
::
::
::
::
2.6575
2.2475
2.6775
3.8500
-
2.9425
2.7275
3.0375
4.1725
::
::
::
::
2.7688
2.6139
2.8263
4.0075
:
:
:
:
WEST COAST (WSP, Delivered, LTL)
-- Process 5# Loaf
-- Cheddar 40# Block
-- Cheddar 10# Cuts
-- Monterey Jack 10#
-- Grade A Swiss Cuts 6 - 9#
::
::
::
::
::
2.5825
2.4650
2.6450
2.6550
3.4000
-
2.8400
2.8175
2.8650
2.8150
3.8300
::
::
::
::
::
2.3025
2.3025
2.4825
2.4925
3.4275
-
2.5600
2.6550
2.7025
2.6525
3.8575
::
::
::
::
::
2.2450
2.2875
2.4675
2.4775
3.4275
-
2.5025
2.6400
2.6875
2.6375
3.8575
::
::
::
::
::
2.2350
2.3600
2.5400
2.5500
3.4275
-
2.4925
2.7125
2.7600
2.7100
3.8575
::
::
::
::
::
2.1550
2.3850
2.5650
2.5750
3.4275
-
2.4125
2.7375
2.7850
2.7350
3.8575
::
::
::
::
::
2.4101
2.5300
2.6438
2.6238
3.6388
:
:
:
:
:
FLUID PRODUCTS
SPOT PRICES OF CLASS II CREAM ($ per lb. butterfat)
-- Northeast - f.o.b
:: 3.6696 - 3.9754 :: 3.3442 - 3.7222 :: 3.0062 - 3.4883 :: 2.3020 - 2.8084 :: 2.1639 - 2.4954 :: 3.0249 :
-- Upper Midwest - f.o.b
:: 3.4555 - 4.0060 :: 3.1988 - 3.7804 :: 3.1196 - 3.5450 :: 2.5322 - 2.8315 :: 2.2419 - 2.5344 :: 3.0600 :
PRICES OF CONDENSED SKIM - NORTHEAST ($ per lb. wet solids) - f.o.b.
-- Class II
:: 1.52 - 1.55 :: 1.52 - 1.55
-- Class III
:: 1.57 - 1.60 :: 1.67 - 1.70
:: 1.52
:: 1.46
- 1.55
- 1.60
:: 1.52
:: 1.46
- 1.55
- 1.60
:: 1.55
:: 1.46
- 1.58
- 1.60
:: 1.5418 :
:: 1.5727 :
NO
OCTOBER
2013
MONTHLY
AVERAGES
2/
DAIRY MARKET NEWS, NOVEMBER 3 - 7, 2014
-11-
VOLUME 81, REPORT 45
MONTHLY SUMMARY AND AVERAGES FOR OCTOBER 2014 1/ - (UNLESS OTHERWISE NOTED, PRICES ARE DOLLARS PER POUND, CL/TL)
::REPORT NUMBER 40 ::REPORT NUMBER 41 ::REPORT NUMBER 42 ::REPORT NUMBER 43 ::REPORT NUMBER 44 ::
2014 :
2013
COMMODITY
::-----------------::-----------------::-----------------::-----------------::-----------------:: Monthly : Monthly
:: OCT 01 - 03 :: OCT 06 - 10 :: OCT 13 - 17 :: OCT 20 - 24 :: OCT 27 - 31 :: Average : Average
DRY PRODUCTS
NONFAT DRY MILK
-- Central And East (f.o.b.)
-- Low/Medium Heat
-- Mostly
-- High Heat
-- West (f.o.b)
-- Low/Medium Heat
-- Mostly
-- High Heat
:: 1.1900 - 1.5500 :: 1.3500 - 1.5000 :: 1.2200 - 1.5600 :: 1.2200 - 1.5825 :: 1.2000 - 1.5850 :: 1.3984 : NO
:: 1.3800 - 1.5000 :: 1.3800 - 1.4700 :: 1.3800 - 1.5025 :: 1.3500 - 1.5050 :: 1.3200 - 1.5050 :: 1.4277 : OCTOBER
:: 1.5150 - 1.6000 :: 1.5400 - 1.6200 :: 1.5250 - 1.6200 :: 1.4350 - 1.6200 :: 1.4350 - 1.6000 :: 1.5494 : 2013
AVERGES
:: 1.2350 - 1.5625 :: 1.3300 - 1.5000 :: 1.3000 - 1.5300 :: 1.2600 - 1.5400 :: 1.2000 - 1.5350 :: 1.3986 : 2/
:: 1.3300 - 1.4625 :: 1.3300 - 1.4425 :: 1.3200 - 1.4700 :: 1.3200 - 1.4700 :: 1.2800 - 1.4700 :: 1.3886 :
:: 1.4825 - 1.6100 :: 1.4825 - 1.6100 :: 1.4800 - 1.6100 :: 1.4800 - 1.5800 :: 1.4800 - 1.5900 :: 1.5398 :
WHEY POWDER (Nonhygroscopic)
-- Central (f.o.b.)
-- Mostly
-- West (f.o.b.)
-- Mostly
-- Northeast (f.o.b.)
::
::
::
::
::
WHEY PROTEIN CONCENTRATE
-- Central And West (f.o.b.)
-- Extra Grade 34% Protein
-- Mostly
:: 1.2000 - 1.5875 :: 1.2000 - 1.5750 :: 1.2000 - 1.5375 :: 1.2000 - 1.5350 :: 1.2000 - 1.5325 :: 1.3756 :
:: 1.2800 - 1.4675 :: 1.2500 - 1.4250 :: 1.2500 - 1.4175 :: 1.2500 - 1.4150 :: 1.2300 - 1.4025 :: 1.3358 :
ANIMAL FEED - WHEY
-- Central (f.o.b.)
-- Milk Replacer
:: 0.3500 - 0.6100 :: 0.3500 - 0.6100 :: 0.3500 - 0.6100 :: 0.3500 - 0.5900 :: 0.3500 - 0.5900 :: 0.4755 :
BUTTERMILK (Min. 30% protein)
-- Central And East (f.o.b.)
-- West (f.o.b.)
-- Mostly
:: 1.1500 - 1.3800 :: 1.1500 - 1.4100 :: 1.2100 - 1.3500 :: 1.0800 - 1.3500 :: 1.0800 - 1.2700 :: 1.2393 :
:: 1.2500 - 1.5800 :: 1.3000 - 1.5200 :: 1.2700 - 1.4600 :: 1.1600 - 1.4300 :: 1.1600 - 1.4300 :: 1.3502 :
:: 1.3800 - 1.5675 :: 1.3800 - 1.4600 :: 1.3500 - 1.4400 :: 1.3000 - 1.4000 :: 1.3000 - 1.3800 :: 1.3887 :
WHOLE MILK POWDER
-- National (f.o.b.)
:: 1.7000 - 1.8200 :: 1.7000 - 1.8200 :: 1.6000 - 1.8200 :: 1.6000 - 1.8200 :: 1.6000 - 1.8200 :: 1.7282 :
LACTOSE
-- Central And West (f.o.b.)
-- Mostly
:: 0.2700 - 0.6450 :: 0.2700 - 0.5300 :: 0.2600 - 0.5200 :: 0.2600 - 0.5775 :: 0.2525 - 0.6075 :: 0.4171 :
:: 0.4000 - 0.5225 :: 0.3900 - 0.4600 :: 0.3500 - 0.4600 :: 0.3500 - 0.4800 :: 0.3500 - 0.4800 :: 0.4218 :
0.4800
0.5800
0.5200
0.5500
0.6625
-
0.7125
0.6800
0.6875
0.6600
0.7300
::
::
::
::
::
0.4800
0.5600
0.5200
0.5500
0.6100
-
0.7075
0.6650
0.6875
0.6500
0.7275
::
::
::
::
::
0.4800
0.5600
0.5000
0.5500
0.6100
-
0.7050
0.6600
0.6875
0.6450
0.7150
::
::
::
::
::
0.4800
0.5600
0.5000
0.5500
0.6100
-
0.7050
0.6600
0.6875
0.6450
0.7150
::
::
::
::
::
0.4800
0.5500
0.5000
0.5500
0.6100
-
0.6925
0.6450
0.6875
0.6450
0.7025
::
::
::
::
::
0.5919
0.6105
0.5974
0.5991
0.6671
:
:
:
:
:
CASEIN - Edible - National (f.o.b.)
-- Nonrestricted - Rennet
:: 4.2000 - 4.8000 :: 4.2000 - 4.8000 :: 4.2000 - 4.8000 :: 4.2000 - 4.8000 :: 4.2000 - 4.8000 :: 4.5000 :
-- Nonrestricted - Acid
:: 4.4000 - 5.0000 :: 4.4000 - 5.0000 :: 4.4000 - 5.0000 :: 4.4000 - 5.0000 :: 4.4000 - 5.0000 :: 4.7000 :
--------------------------------------------------------------------------------------------------------------------------------------------------------1/ Prices for all products are issued once a week and represent a value for the entire week. Monthly averages are based on weekly prices and are time-weighted according to the number
of workdays in the month - Saturdays, Sundays and National Holidays excluded. No monthly average is computed if one or more weekly prices are missing. 2/ USDA Dairy Market News
resumed operations on Thursday, October 17, 2013. Until that date, no prices were collected or released after the October 1st government shutdown. This affected September 2013 and
October 2013 averages.
DAIRY MARKET NEWS, NOVEMBER 3 – 7, 2014
-12-
VOLUME 81, REPORT 45
CME GROUP AVERAGES FOR OCTOBER 2014
-----------------------------------------------------------------------------------------------------------------------------------::REPORT NUMBER 40::REPORT NUMBER 41::REPORT NUMBER 42::REPORT NUMBER 43::REPORT NUMBER 44:: 2014 * : 2013 *
COMMODITY
::----------------::----------------::----------------::----------------::----------------:: Monthly : Monthly
:: OCT 1 - 3
:: OCT 6 - 10 :: OCT 13 - 17 :: OCT 20 - 24 :: OCT 27 - 31 :: Average : Average
-----------------------------------------------------------------------------------------------------------------------------------BUTTER*
-- GRADE AA
--Monday
--Tuesday
--Wednesday
--Thursday
--Friday
::
::
::
::
::
2.8950
2.8950
2.8950
::
::
::
::
::
2.8700
2.8650
2.8200
2.8200
2.8050
::
::
::
::
::
2.6400
2.4750
2.2650
2.1300
2.0000
::
::
::
::
::
2.0150
2.0325
1.9900
1.9000
1.8100
::
::
::
::
::
1.8000
1.7700
1.8500
1.8900
1.8900
::
::
::
::
:: 2.3184
:
:
:
:
: 1.5267
--Weekly Average** ::
2.9080
::
2.8360
::
2.3020
::
1.9495
::
1.8400
::
:
::
::
::
::
::
2.1400
2.1000
2.1700
::
::
::
::
::
2.1700
2.1000
2.1000
2.1000
2.1000
::
::
::
::
::
2.1000
2.1650
2.0950
2.0900
2.0700
::
::
::
::
::
2.1075
2.0350
2.0700
1.9900
1.9225
::
::
::
::
::
1.9225
2.0100
2.0650
2.0650
2.1100
::
::
::
::
:: 2.0782
:
:
:
:
: 1.7714
--Weekly Average** ::
2.1720
::
2.1140
::
2.1040
::
2.0250
::
2.0345
::
:
::
::
::
::
::
2.1825
2.1400
2.1500
::
::
::
::
::
2.1500
2.1600
2.1600
2.1650
2.1975
::
::
::
::
::
2.1975
2.2275
2.2275
2.2500
2.2875
::
::
::
::
::
2.3250
2.3250
2.3700
2.1575
2.1400
::
::
::
::
::
2.1400
2.1000
2.1150
2.1350
2.1400
::
::
::
::
:: 2.1932
:
:
:
:
: 1.8236
--Weekly Average** ::
2.1820
::
2.1665
::
2.2380
::
2.2635
::
2.1260
::
:
::
::
::
::
::
1.3950
1.3950
1.3950
::
::
::
::
::
1.3950
1.3900
1.3800
1.3800
1.3800
::
::
::
::
::
1.3800
1.3800
1.3800
1.3800
1.3800
::
::
::
::
::
1.3200
1.3100
1.3100
1.2925
1.2450
::
::
::
::
::
1.2400
1.2400
1.2400
1.2425
1.2425
::
::
::
::
:: 1.3345
:
:
:
:
: 1.8601
--Weekly Average** ::
1.3950
::
1.3850
::
1.3800
::
1.2955
::
1.2410
::
:
CHEESE*
-- BARRELS
--Monday
--Tuesday
--Wednesday
--Thursday
--Friday
-- 40# BLOCKS
--Monday
--Tuesday
--Wednesday
--Thursday
--Friday
NONFAT DRY MILK*
-- *** EXTRA GRADE
-- GRADE A
--Monday
--Tuesday
--Wednesday
--Thursday
--Friday
-----------------------------------------------------------------------------------------------------------------------------------* Monthly averages are a simple average of all the closes during the month. Weekly and monthly averages are independent
calculations.
** Weekly averages are simple averages of the closes during the calendar week and are for information purposes. Should the
week be split between two months, the weekly average will appear in the monthly report in which the Friday close is reported.
*** NOTICE: Effective January 26, 2014, the Extra Grade NDM no longer trades.
DAIRY MARKET NEWS, NOVEMBER 3 - 7, 2014
-13-
VOLUME 81, REPORT 45
OCTOBER AGRICULTURAL PRICES HIGHLIGHTS
The All Milk price received by farmers was $25.30 in October, down $0.40 from September 2014 but up $4.40 from October 2013. Milk Cows price was
$2,120 in October, up $710 from October 2013. Alfalfa hay price was $194.00 in October, up $1.00 from October 2013. Corn price was $3.28 in October,
down $1.35 from October 2013. Soybean price was $9.64 in October, down $2.86 from October 2013. The milk-feed price ratio was 3.07 in October, up 0.94
from October 2013.
The index of prices received by farmers for dairy products during the month of October 2014 was down 2 points to 126. Compared to October 2013, the
index was up 22 points (21.2 percent). The index of prices paid by farmers for commodities and services, interest, taxes, and wage rates in October 2014 was
unchanged at 112. Compared with October 2013, the index was up 6 points (5.7 percent).
SELECTED M ILK PRI CES, M ILK COWS, AND FEED PRI CES, SELECTED STATES AND U.S., OCTOBER 2014 WITH COM PARISONS
State
All-Milk price 1/ 2/
Dollars per cwt.
September
October
2013
2014
2013
2014 4/
Milk cows 3/
Dollars per head
October
2013
2014 4/
AZ
CA
CO
ID
IN
19.90
18.50
20.30
19.10
20.90
24.60
23.32
25.60
25.10
26.30
20.30
19.41
21.20
20.10
21.40
24.60
22.40
25.70
25.10
26.30
1,500
1,300
1,520
1,350
1,450
2,200
2,200
2,260
2,150
2,050
185.00
198.00
238.00
190.00
---
IA
MI
MN
NM
NY
20.40
20.60
20.10
18.90
21.40
26.40
26.20
26.70
23.80
27.10
21.20
21.00
21.10
19.80
22.00
26.30
26.20
26.40
23.90
26.50
1,380
1,600
1,350
1,440
1,420
2,100
2,100
2,070
2,100
2,010
OH
PA
TX
WA
WI
21.10
21.70
20.50
20.60
20.20
26.30
27.40
26.10
26.70
26.60
21.60
22.20
21.60
21.50
20.90
26.30
26.80
26.00
25.60
26.20
1,400
1,450
1,450
1,300
1,490
U.S.
20.10
25.70
20.90
25.30
1,410
Alfalfa hay, baled
Dollars per ton
October
2013
2014 4/
Corn for Grain
Dollars per bushel
October
2013
2014 4/
Soybeans
Dollars per bushel
October
2013
2014 4/
180.00
230.00
215.00
200.00
---
----5.02
--4.34
----3.73
--3.50
--------12.60
--------9.50
195.00
185.00
180.00
250.00
208.00
152.00
165.00
133.00
250.00
190.00
4.64
4.46
5.20
-----
3.20
3.30
3.20
-----
12.50
12.40
12.50
-----
9.50
9.70
10.00
-----
1,950
2,000
2,100
2,050
2,220
205.00
194.00
236.00
195.00
200.00
190.00
234.00
234.00
215.00
157.00
4.36
4.15
5.28
--4.68
3.50
3.65
3.88
--3.30
12.30
------12.20
9.75
------9.80
2,120
193.00
194.00
4.63
3.28
12.50
9.64
1/
Prices are shown at reported butterfat test. 2/ Before deductions for hauling. Includes quality, quantity, and other premiums. Excludes hauling subsidies.
3/
Animals sold for dairy herd replacement only. Prices estimated in January, April, July, and October. 4/ Preliminary.
MILK-FEED PRICE RATIO, SELECTED STATES AND U.S., OCTOBER 2014 WITH COMPARISONS
State 2/
Milk-feed: pounds of 16% mixed dairy feed equal in value to 1 pound of whole milk 1/
October 2013
September 2014
October 2014 3/
IA
MI
MN
OH
WI
2.14
2.21
2.09
2.26
2.09
3.38
3.19
3.79
3.44
3.43
3.60
3.41
3.79
3.23
3.48
U.S.
2.10
2.97
3.07
1/
The price of commercial prepared dairy feed is based on current United States prices received for corn, soybeans, and alfalfa. The modeled feed uses
51 percent corn, 8 percent soybeans, and 41 percent alfalfa hay. 2/ Available states that provided all necessary data to compute milk feed price ratios.
3/
Preliminary.
GENERAL PRICE MEASURES, U.S., OCTOBER 2014 WITH COMPARISONS
Item
INDEX NUMBERS (1990-92=100):
Prices received by farmers for dairy products
Prices paid by farmers for commodities and services, interest taxes, and wage rates
1/
Preliminary.
October
2013
September
2014
October
2014 1/
104
106
128
112
126
112
Source: U.S. Department of Agriculture. National Agricultural Statistics Service. Agricultural Statistics Board. Agricultural Prices, October 2014.
DAIRY MARKET NEWS, NOVEMBER 3 - 7, 2014
-14-
VOLUME 81, REPORT 45
SEPTEMBER 2014 DAIRY PRODUCTS HIGHLIGHTS
BUTTER production was 130.1 million pounds, 1.6 percent below September 2013 but 1.2 percent above August 2014. AMERICAN TYPE CHEESE production totaled 361.1 million pounds, 4.0 percent above September
2013 but 3.4 percent below August 2014. TOTAL CHEESE output (excluding cottage cheese) was 941.6 million pounds, 4.7 percent above September 2013 and 0.2 percent above August 2014. NONFAT DRY MILK
production, for human food, totaled 114.1 million pounds, 54.1 percent above September 2013 but 3.3 percent below August 2014. DRY WHEY production, for human food, was 68.2 million pounds, 2.5 percent below
September 2013 and 0.6 percent below August 2014. ICE CREAM REGULAR (hard) production totaled 61.7 million gallons, 1.8 percent below September 2013 and 6.5 percent below August 2014.
SEP 2014
PRODUCT
1,000 LBS.
BUTTER
CHEESE
AMERICAN TYPES 2/
CHEDDAR
OTHER AMERICAN
BRICK & MUENSTER
CREAM & NEUFCHATEL
HISPANIC
TOTAL ITALIAN TYPES
MOZZARELLA
ALL OTHER ITALIAN
SWISS
ALL OTHER TYPES
TOTAL
COTTAGE CHEESE, CURD 3/
COTTAGE CHEESE, CREAM 4/
COTTAGE CHEESE, LOWFAT 5/
DRY BUTTERMILK
DRY WHOLE MILK
MILK PROTEIN CONC. (MPC), TOTAL 6/
NONFAT DRY MILK (NDM), HUMAN
SKIM MILK POWDERS (SMP) 7/
SOUR CREAM
130,079
361,141
255,966
105,175
13,834
75,885
20,694
414,945
330,044
84,901
23,046
32,035
941,580
28,710
25,510
29,274
8,277
12,889
5,895
114,073
40,931
84,155
PRODUCTION OF DAIRY PRODUCTS
PERCENT CHANGE FROM:
YEAR
PRODUCT
SEP
AUG
TO
2013
2014
DATE 1/
-1.6
1.2
-2.5
YOGURT (PLAIN AND FLAVORED)
DRY WHEY, HUMAN FOOD
4.0
-3.4
1.4
DRY WHEY, ANIMAL FEED
5.9
-3.3
1.8
DRY WHEY, TOTAL 8/
-0.6
-3.7
--REDUCED LACTOSE AND MINERALS
-2.9
-8.6
--HUMAN FOOD
-4.8
3.5
--ANIMAL FEED
---6.3
--LACTOSE, HUMAN FOOD & ANIMAL FEED
7.9
3.5
4.9
WHEY PROTEIN CONCENTRATE
9.3
3.5
6.9
HUMAN FOOD 9/
2.8
3.7
--ANIMAL FEED 9/
0.2
2.2
--TOTAL 9/
7.0
-0.6
--25.0-49.9 PERCENT 10/
4.7
0.2
2.7
50.0-89.9 PERCENT 10/
-1.9
-3.8
--WHEY PROTEIN ISOLATES 11/
4.6
3.0
-1.7
0.7
1.8
-3.1
FROZEN PRODUCTS
21.2
7.6
--ICE CREAM, REGULAR (HARD)
171.9
2.4
--ICE CREAM, LOWFAT (HARD)
7.1
12.6
--ICE CREAM, LOWFAT (SOFT)
54.1
-3.3
12.5
ICE CREAM, LOWFAT (TOTAL)
-24.5
-24.3
-7.9
SHERBET, HARD
1.3
-3.0
1.0
FROZEN YOGURT (TOTAL)
DRY WHEY, HUMAN FOOD
DRY WHEY, ANIMAL FEED
REDUCED LACTOSE & MINERALS—HUMAN & ANIMAL 13/
LACTOSE, HUMAN FOOD & ANIMAL FEED
DRY BUTTERMILK
MANUFACTURERS' STOCKS, END OF MONTH 12/
SEP
PERCENT OF:
2014
PRODUCT
1,000
SEP
AUG
LBS.
2013
2014
WHEY PROTEIN CONCENTRATE
56,335
-1.6
-2.2
HUMAN FOOD 9/
785
-72.9
4.7
ANIMAL FEED 9/
11,326
75.3
9.2
TOTAL 9/
119,324
36.6
-0.7
18,635
139.9
33.2
25.0-49.9 PERCENT 10/
NONFAT DRY MILK (NDM), HUMAN FOOD
171,024
PRODUCT
17.9
-29.5
50.0-89.9 PERCENT 10/
WHEY PROTEIN ISOLATES 11/
SEP 2014
460,807
68,201
1,311
69,512
PERCENT CHANGE FROM:
YEAR
SEP
AUG
TO
2013
2014
DATE 1/
6.2
14.7
1.8
-2.5
-0.6
---45.5
35.7
---3.9
-0.1
-10.6
3,041
6,018
100,056
184.5
28.5
13.7
-0.3
-5.3
1.5
----13.7
41,475
656
42,131
21,226
20,905
6,529
6.8
15.5
7.0
5.7
8.3
-6.5
-5.8
-12.4
-6.0
-6.0
-5.9
1.4
----10.6
-------
1,000 LBS.
1,000 GALLONS
61,671
17,565
14,638
32,203
3,225
4,585
PERCENT CHANGE FROM:
-1.8
-6.5
-5.7
12.5
-2.0
---17.1
-22.3
---3.2
-12.4
-3.1
3.9
3.6
-8.1
-19.1
-15.3
-21.2
SEP
2014
1,000
LBS.
PERCENT OF:
SEP
2013
AUG
2014
56,638
1,474
58,112
26,785
21.0
5.7
20.6
51.2
-1.3
5.9
-1.2
-6.4
31,327
2.8
3.8
10,547
8.0
9.4
1/ 2014 cumulative as percent change of 2013 cumulative. 2/ Includes Cheddar, Colby, Monterey and Jack. 3/ Mostly used for processing into cream or lowfat cottage cheese. 4/ Fat content 4 percent or more. 5/ Fat content
less than 4 percent. 6/ Dry milk protein concentrate, 40-89.9 percent. 7/ Includes protein standardized and blends. 8/ Excludes all modified dry whey products. 9/ Whey protein concentrate, 25.0 to 89.9 percent. 10/ Whey
protein concentrate, human and animal. 11/ Whey protein isolates, 90.0 percent or greater. 12/ Stocks held by manufacturers at all points and in transit. 13/ Reduced lactose and minerals stocks combined to avoid disclosure of
individual operations.
Source: U.S. Department of Agriculture. National Agricultural Statistics Service. Agricultural Statistics Board. Dairy Products, November 2014.
DAIRY MARKET NEWS, NOVEMBER 3 - 7, 2014
-15-
VOLUME 81, REPORT 45
FEDERAL MILK ORDER CLASS AND COMPONENT PRICES, OCTOBER
Class Prices: The following are the October 2014 class prices under the Federal milk order pricing system and changes from the previous month: Class II: $21.93 (-$4.18),
Class III: $23.82 (-$0.78), and Class IV: $21.35 (-$1.23).
Component Price Information:
Under the Federal milk order pricing system, the butterfat price for October 2014 is $2.8507 per pound. Thus, the Class II butterfat
price is $2.8577 per pound. The protein and other solids prices for October 2014 are $3.7362 and $0.4670 per pound, respectively. These component prices set the Class
III skim milk price at $14.34 per cwt. The October 2014 Class IV skim milk price is $11.78, which is derived from the nonfat solids price of $1.3090 per pound.
Product Price Averages:
The product price averages for October 2014 are: butter: $2.5255, nonfat dry milk: $1.4900, cheese: $2.2914, and dry whey: $0.6525.
FEDERAL MILK ORDER MINIMUM CLASS PRICES FOR MILK OF 3.5 PERCENT BUTTERFAT1/ 2/
October 2014
Federal Milk Order
Order
Class I
Class II
Class III
Class IV
3/
Number
Marketing Areas
Dollars Per 100 Pounds
001
27.44
21.93
23.82
21.35
Northeast (Boston)4/
5/ 6/
005
27.59
21.93
23.82
21.35
Appalachian (Charlotte)
006
29.59
21.93
23.82
21.35
Florida (Tampa)6/ 7/
007
27.99
21.93
23.82
21.35
Southeast (Atlanta)6/ 8/
030
25.99
21.93
23.82
21.35
Upper Midwest (Chicago)9/
032
26.19
21.93
23.82
21.35
Central (Kansas City)10/
033
26.19
21.93
23.82
21.35
Mideast (Cleveland)11/
124
26.09
21.93
23.82
21.35
Pacific Northwest (Seattle)12/
126
27.19
21.93
23.82
21.35
Southwest (Dallas)13/
131
26.54
21.93
23.82
21.35
Arizona (Phoenix)
--All-Market Average
27.08
21.93
23.82
21.35
1/
November 2014
Class I
27.31
27.46
29.46
27.86
25.86
26.06
26.06
25.96
27.06
26.41
26.95
To convert the Class I price per 100 pounds to the Class I price per gallon, divide by 11.63 - the approximate number of gallons in 100 pounds of milk.
The mandatory $0.20 per cwt. processor assessment under the Fluid Milk Promotion Order is not included in the Class I prices shown on this table.
3/ Names in parentheses are the major city in the principal pricing point of the markets.
4/ Class I prices at other cities are: New York City, minus $0.10; Philadelphia, minus $0.20; Baltimore, minus $0.25, and Washington, DC, minus $0.25.
5/ Class I prices at other cities are: Knoxville, minus $0.20 and Louisville, minus $1.10.
6/ Effective May 1, 2008, the Class I price surface in these orders were temporarily adjusted.
7/ Class I prices at other cities are: Orlando, same; Miami, plus $0.60; and Jacksonville, minus $0.40.
8/ Class I prices at other cities are: New Orleans, same; Memphis, minus $0.90; Nashville, minus $0.90; and Springfield, MO, minus $1.40.
9/ Class I prices at other cities are: Milwaukee, minus $0.05; and Minneapolis, minus $0.10.
10/ Class I prices at other cities are: Des Moines, minus $0.20; Omaha, minus $0.15; Oklahoma City, plus $0.60; St. Louis, same; and Denver, plus $0.55.
11/ Class I prices at other cities are: Indianapolis, same; Cincinnati, plus $0.20; Pittsburgh, plus $0.10; and Detroit, minus $0.20.
12/ Class I prices at other cities are: Portland, same; and Spokane, same.
13/ Class I prices at other cities are: Houston, plus $0.60; San Antonio, plus $0.45; Albuquerque, minus $0.65; and El Paso, minus $0.75.
2/
DAI RY M ARKET NEWS, NOVEM BER 3 – 7, 2014
-16-
VOLUM E 81, REPORT 45
CONSUM ER PRI CE I NDEX (CPI-U) AND AVERAGE RETAI L PRICES FOR SELECTED PRODUCTS, U.S. CI TY AVERAGE 1/
All Food
Month
CPI
2/
Dairy Products
Pct.
Chg. 3/
CPI
Fresh Whole Milk
Pct.
Chg. 3/
2/
CPI
2/
Pct.
Chg. 3/
Cheese
CPI
2/
Meat, Poultry,
Fish, and Eggs
Butter
Pct.
Chg. 3/
CPI
2/
Pct.
Chg. 3/
CPI
2/
Pct.
Chg. 3/
JUL
243.0
2.5
225.1
4.3
227.4
6.3
236.3
7.1
231.6
16.5
253.8
7.6
AUG
243.8
2.7
226.4
4.4
228.7
7.2
237.8
7.0
237.2
18.8
258.4
8.8
SEP
244.6
3.0
227.6
4.9
231.6
8.7
236.9
6.8
245.6
23.7
260.8
9.4
U.S. City Average Retail Prices
Whole Milk 4/
Butter
5/
Process Cheese 6/
Natural Cheese 7/
Ice Cream 8/
Month
2014
2013
2014
2013
2014
2013
2014
2013
2014
2013
JUL
3.645
3.449
N/A
N/A
4.426
Dollars
4.092
5.560
5.434
4.719
4.840
AUG
3.673
3.448
N/A
N/A
4.482
4.135
5.580
5.465
4.751
5.034
3.732
3.428
N/A
N/A
4.450
4.137
5.565
5.390
4.987
4.795
SEP
1/
N/A = Not available. " CPI Detailed Report," "Consumer Prices: Energy and Food," BLS, U.S. Department of Labor. According to BLS, average prices are best used to
measure the price level in a particular month. To measure price change over time, the CPI is more appropriate. 2/ The standard reference base period for these indexes is
1982-1984 = 100. 3/ Percent change over previous year. 4/ Per gallon. 5/ Per pound. Grade AA, salted, stick butter. 6/ Per pound, any size and type of package. 7/ Per
pound, cheddar cheese in any size and type of package and variety (sharp, mild, smoked, etc. ). 8/ Per 1/2 gallon prepackaged regular.
DAIRY MARKET NEWS, NOVEMBER 3 – 7, 2014
-G1-
VOLUME 81, REPORT 45
CENTRAL & EAST LOW/MEDIUM HEAT
NONFAT DRY MILK MONTHLY AVERAGE MOSTLY PRICES
PER POUND
$2.20
$2.10
$2.00
$1.90
$1.80
$1.70
$1.60
$1.50
$1.40
$1.30
$1.20
$1.10
$1.00
JAN
FEB
MAR
APR
MAY
JUN
GRAPH/SOURCE USDA, AMS, DMN
JUL
2010
AUG
2011
SEP
OCT
2012
NOV
2013
DEC
2014
WESTERN LOW/MEDIUM HEAT
NONFAT DRY MILK MONTHLY AVERAGE MOSTLY PRICES
PER POUND
$2.20
$2.10
$2.00
$1.90
$1.80
$1.70
$1.60
$1.50
$1.40
$1.30
$1.20
$1.10
$1.00
$0.90
JAN
FEB
MAR
APR
MAY
JUN
JUL
AUG
2010
GRAPH/SOURCE USDA, AMS, DMN
SEP
2011
OCT
2012
NOV
2013
DEC
2014
WESTERN DRY BUTTERMILK MONTHLY AVERAGE MOSTLY PRICES
PER POUND
$2.00
$1.90
$1.80
$1.70
$1.60
$1.50
$1.40
$1.30
$1.20
$1.10
$1.00
$0.90
$0.80
JAN
FEB
MAR
GRAPH/SOURCE USDA, AMS, DMN
APR
MAY
JUN
JUL
2010
AUG
SEP
2011
OCT
2012
NOV
2013
DEC
2014
DAIRY MARKET NEWS, NOVEMBER 3 – 7, 2014
MILLION POUNDS
200
-G2-
VOLUME 81, REPORT 45
U.S. NONFAT DRY MILK (NDM) PRODUCTION, HUMAN
190
180
170
160
150
140
130
120
110
100
90
80
70
JAN
FEB
MAR
APR
MAY
DATA SOURCE, USDA, NASS; GRAPH, USDA, AMS, DMN
MILLION POUNDS
65
JUN
JUL
2010
AUG
SEP
OCT
2012
2011
NOV
2013
DEC
2014
U.S. SKIM MILK POWDER PRODUCTION
60
55
50
45
40
35
30
25
20
15
10
JAN
FEB
MAR
APR
MAY
DATA SOURCE, USDA, NASS; GRAPH, USDA, AMS, DMN
JUN
JUL
2010
AUG
2011
SEP
2012
OCT
NOV
2013
DEC
2014
U.S. MILK PROTEIN CONCENTRATE PRODUCTION,
40.0 - 89.9% PROTEIN
MILLION POUNDS
18
17
16
15
14
13
12
11
10
9
8
7
6
5
4
3
JAN
FEB
MAR
APR
MAY
DATA SOURCE, USDA, NASS; GRAPH, USDA, AMS, DMN
JUN
JUL
2010
AUG
2011
SEP
2012
OCT
NOV
2013
DEC
2014
DAIRY MARKET NEWS, NOVEMBER 3 – 7, 2014
-G3-
VOLUME 81, REPORT 45
U.S. BUTTER PRODUCTION
MILLION POUNDS
200
190
180
170
160
150
140
130
120
110
100
JAN
FEB
MAR
APR
MAY
JUN
JUL
AUG
2010
DATA SOURCE, USDA, NASS; GRAPH, USDA, AMS, DMN
SEP
2011
MILLION POUNDS
U.S. DRY WHOLE MILK PRODUCTION
13.5
13.0
12.5
12.0
11.5
11.0
10.5
10.0
9.5
9.0
8.5
8.0
7.5
7.0
6.5
6.0
5.5
5.0
4.5
4.0
3.5
3.0
JAN
FEB
MAR
APR
MAY
JUN
JUL
AUG
SEP
2010
2011
DATA SOURCE, USDA, NASS; GRAPH, USDA, AMS, DMN
OCT
2012
OCT
2012
NOV
2013
NOV
2013
DEC
2014
DEC
2014
U.S. REGULAR HARD ICE CREAM PRODUCTION
MILLION GALLONS
88
84
80
76
72
68
64
60
56
52
48
44
40
JAN
FEB
MAR
APR
MAY
DATA SOURCE, USDA, NASS; GRAPH, USDA, AMS, DMN
JUN
JUL
AUG
2010
SEP
2011
OCT
2012
NOV
2013
DEC
2014
DAIRY MARKET NEWS, NOVEMBER 3 – 7, 2014
-G4-
VOLUME 81, REPORT 45
U.S. TOTAL DRY WHEY PRODUCTION
MILLION POUNDS
96
92
88
84
80
76
72
68
64
60
JAN
FEB
MAR
APR
MAY
JUN
DATA SOURCE, USDA, NASS; GRAPH, USDA, AMS, DMN
JUL
2010
AUG
2011
SEP
OCT
2012
NOV
2013
DEC
2014
U.S. DRY WHEY PROTEIN CONCENTRATE PRODUCTION,
HUMAN (25.0 - 89.9% PROTEIN)
MILLION POUNDS
48
46
44
42
40
38
36
34
32
30
28
JAN
FEB
MAR
APR
MAY
JUN
JUL
2010
DATA SOURCE, USDA, NASS; GRAPH, USDA, AMS, DMN
AUG
SEP
2011
OCT
2012
NOV
2013
DEC
2014
U.S. DRY LACTOSE PRODUCTION, HUMAN & ANIMAL
MILLION POUNDS
104
100
96
92
88
84
80
76
72
68
64
60
JAN
FEB
MAR
APR
MAY
DATA SOURCE, USDA, NASS; GRAPH, USDA, AMS, DMN
JUN
JUL
2010
AUG
2011
SEP
OCT
2012
NOV
2013
DEC
2014
DAIRY MARKET NEWS
GENERAL NUMBER
(608)278-4200
Elizabeth Frederick
(608) 278-4150
[email protected]
EAST
Daniel Johnson
(608) 278-4156
[email protected]
CENTRAL
Ryan Studnicka
(608) 278-4155
[email protected]
VOLUME:
81
REPORT:
45
DATE:
11/07/2014
INTERNATIONAL
Rick Whipp
(608) 278-4151
[email protected]
ORGANIC
Eric Graf
(608) 278-4153
[email protected]
INTERNET ADDRESS
SOUTHWEST
Janet Linder
(608) 278-4157
[email protected]
www.ams.usda.gov/DairyMarketNews
MARKET NEWS PORTAL
NORTHWEST/MOUNTAIN
(608) 278-4200
NATIONAL SUPERVISOR
Butch Speth
(608) 278-4152
[email protected]
www.marketnews.usda.gov
RECORDED INFORMATION SYSTEM
(608) 278-4142
FAX
(608) 278-4141
________________________
USDA, Dairy Market News
2920 Marketplace Drive, STE 202
Fitchburg, WI 53719-5337
U.S. DEPARTMENT OF AGRICULTURE – AGRICULTURAL MARKETING SERVICE – DAIRY PROGRAMS


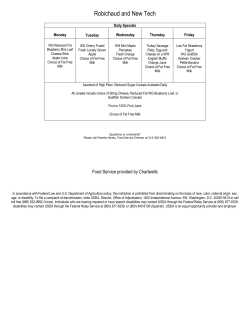


© Copyright 2026