
Who Is Peeping at Your Passwords at Starbucks? Texas A&M University
Who Is Peeping at Your Passwords at Starbucks?
– To Catch an Evil Twin Access Point
Yimin Song, Chao Yang, and Guofei Gu
Texas A&M University
{songym,yangchao,guofei}@cse.tamu.edu
Abstract—In this paper, we consider the problem of “evil twin”
attacks in wireless local area networks (WLANs). An evil twin is
essentially a phishing (rogue) Wi-Fi access point (AP) that looks
like a legitimate one (with the same SSID name). It is set up
by an adversary, who can eavesdrop on wireless communications
of users’ Internet access. Existing evil twin detection solutions
are mostly for wireless network administrators to verify whether
a given AP is in an authorized list or not, instead of for a
wireless client to detect whether a given AP is authentic or evil.
Such administrator-side solutions are limited, expensive, and not
available for many scenarios. For example, for traveling users
who use wireless networks at airports, hotels, or cafes, they need
to protect themselves from evil twin attacks (instead of relying
on those wireless network providers, which typically may not
provide strong security monitoring/management service). Thus, a
lightweight and effective solution for these users is highly desired.
In this work, we propose a novel user-side evil twin detection
technique that outperforms traditional administrator-side detection methods in several aspects. Unlike previous approaches, our
technique does not need a known authorized AP/host list, thus it
is suitable for users to identify and avoid evil twins. Our technique
does not strictly rely on training data of target wireless networks,
nor depend on the types of wireless networks. We propose to
exploit fundamental communication structures and properties
of such evil twin attacks in wireless networks and to design
new active, statistical and anomaly detection algorithms. Our
preliminary evaluation in real-world widely deployed 802.11b and
802.11g wireless networks shows very promising results. We can
identify evil twins with a very high detection rate while keeping
a very low false positive rate.
I. I NTRODUCTION
Wireless networks are becoming extremely popular with
the rapid advance of wireless LAN techniques and the wide
deployment of Wi-Fi equipment. Users can easily access
the Internet wirelessly when they are at home, at work, or
even traveling. However, there is an emerging threat that can
severely compromise the security of wireless users – evil
twin attacks. An evil twin in a wireless LAN is essentially
a phishing (rogue) Wi-Fi access point (AP) that looks like a
legitimate one (with the same SSID name), but actually has
been set up by an adversary, who can eavesdrop on wireless
communications of users’ Internet access.
An evil twin attack is easy to launch. First, by using specific
readily-available software [4], an attacker can simply configure
a laptop to be an access point in a wireless network. Then,
the attacker can figure out the SSID and the radio frequency
that the legitimate AP is using. Finally, the attacker can phish
victim users, by deploying her own access point with the
same SSID as the legitimate AP is utilizing. An evil twin
attack is easy to be successful. The attacker typically positions
(physically) the “evil twin” closer to the victim users than a
trusted AP (good twin) so that the evil twin has the strongest
signal within the range of the victim machine. Many users
will be tempted by the higher signal strength if they want
to manually choose an AP. In many cases, the end-users’
computers will automatically choose the evil twin connection
when there are multiple APs associated with the same SSID.
This is because when the wireless card senses local available
wireless networks, most operating systems will choose the one
with the best Received Signal Strength Indication (RSSI) [2]
for each unique SSID based on the belief that all APs that have
the same SSID and different frequency channels are organized
under the same centralized server. Thus, such an evil twin
attack is also very stealthy. In addition, these attacks are hard
to trace because they can be launched and shut off suddenly
or randomly, and last only for a short time after the attacker
achieves her goal.
An attacker typically launches evil twin attacks near free
hotspots, such as airports, cafes, hotels and libraries. Through
setting up the evil twin, the attack can intercept sensitive data such as passwords or credit card information by
snooping at the communication links, or launching man-inthe-middle attacks. The attacker can also manipulate DNS
servers/communications, control the routing, and launch more
severe phishing or other attacks. In short, evil twin is a serious
threat to wireless LAN security.
All existing evil twin detection solutions can be classified
into two categories. The first approach [12], [5], [8], [10], [7],
[6], [9], [1], [3], [13] monitors Radio Frequency (RF) airwaves
and/or additional information gathered at router/switches and
then compares with a known authorized list. The second
approach [33], [35], [34], [24], [32], [14], [31] monitors traffic
at wired side (a traffic aggregation point such as gateway) and
determines if a machine uses wired or wireless connections.
Such information is further compared with an authorization list
to detect if the associated AP is a rogue one. These approaches
are limited because they all require the knowledge of an
authorization list of APs and/or users/hosts. We consider these
solutions to be network administrator oriented, as opposed
to user oriented. That is, they are designed for a wireless
network administrator to perform authorization and access
control policies for wireless APs/users. However, for a client
user, it is of particular importance to be able to identity
evil twins. For example, traveling users who use wireless
networks at airports, hotels, or cafes need to protect themselves
from evil twin attacks (instead of relying on those wireless
network providers, which typically may not provide strong
security monitoring/management service). Thus, a lightweight
and effective solution for these client users is highly desired
but is currently missing.
In this paper, we propose a novel user-side evil twin detection technique which has the following advantages compared
to a traditional administrator-side solution: (i) Our technique
does not require a known authorized AP/user list; (ii) An end
user can be warned of an evil twin immediately to prevent
being exposed to the attacker, even when the attack may last
for a short time and a typical administrator-side solution may
not help that much; (iii) From the user side, the parameters
in a detection system can be customized according to local
environment which may lead to a more accurate result; (iv)
The user-side detection is resource-saving. The system can be
activated only once when the users are trying to connect a
new wireless AP. In addition, there is no need to modify the
network architecture or any client- or server-side applications.
Our technique exploits the fundamental communication
structure and properties of an evil twin attack: an evil twin
typically still requires the good twin for Internet access. That
is, an evil twin sits in the middle of the victim host and the
good twin to relay communications. Thus, the wireless hops
for a user to access Internet are actually increased (from one
to two). In contrast, although legitimate wireless providers
may use wireless bridges to extend the coverage, they do
not change the single hop physical layer wireless channel
to users. Based on this observation, we design new, active,
statistical and anomaly detection algorithms to detect evil
twins by differentiating the wireless hops (one or two hops).
In addition, we consider the effect of throughput variance
due to wireless network saturation and different RSSI ranges.
We propose two algorithms: one is named Trained Mean
Matching (TMM), requiring training knowledge of one-hop
and two-hop wireless channels; and the other one is named
Hop Differentiating Technique (HDT), which does not rely
on any training information or knowledge. We apply these
algorithms in the forms of sequential probability ratio test
(SPRT) [30].
In short, our paper makes the following contributions:
• We propose the first user-side evil twin detection solution,
to the best of our knowledge. Our technique does not rely
on “fingerprint” checking of suspect devices nor require
a known authorized AP/host list. Thus, this solution is
particularly attractive to traveling users.
• We propose to exploit the intrinsic communication structure and property of evil twin attacks. Furthermore, we
propose two statistical anomaly detection algorithms for
evil twin detection, TMM and HDT. In particular, our
HDT improves TMM by removing the training requirement. HDT is resistant to the environment change such
as network saturation and RSSI fluctuation.
• We implement our techniques in a prototype system, ETSniffer (Evil Twin sniffer). We have extensively evaluated
ETsniffer in several real-world wireless networks, including both 802.11b and 802.11g. Our evaluation results
show that ETSniffer can detect an evil twin quickly and
with high accuracy (a high detection rate and a low false
positive rate).
II. R ELATED W ORK
Existing rogue AP detection solutions can be classified
into two categories. The first approach monitors RF airwaves
and/or additional information gathered at routers/switches and
then compares with a known authorized list. For example,
AirDefense [12], similar to several other studies [5], [8],
[10], [7], [6], [9], [1], [3], [13], scans RF from the Intranet
APs to locate suspicious ones, and then compares specific
“fingerprints” of the RF with an authorized list to verify.
Specifically, for the scanning part, some studies [9], [1], [3]
rely on sensors instead of sniffers to scan the RF, and some
studies such as [13] propose a method to turn existing desktop
computers into wireless sniffers to improve the efficiency. For
verification, these studies verify MAC addresses, SSID, and/or
location information of the AP by using an authorized list.
However, these studies still have the risk of falsely claiming a
normal neighbor AP as a rogue AP with a high probability. To
solve this problem, they need to further verify whether such
a rogue AP is indeed in the internal network. For example,
Beyah’s work [15] uses a verifier to send packets to the
wireless side, if such packets are received by the internal
sensor, the associated AP is internal and thus an Evil Twin.
The second approach of rogue AP detection, proposed
in [33], [35], [34], [24], [32], [14], [31], detects evil twins by
differentiating whether clients come from wireless networks or
wired networks, relying on the differences in diverse network
protocols. If a client comes from a wireless network while it
is not authorized to do so (comparing with an authorized list),
the AP attached to this host is considered as a rogue AP. Wei’s
work [34] is one of the earliest studies. [32], [24], [14] use
some statistical features of the traffic time ([14] relies on the
entropy, [32] relies on the median and the entropy, and [24]
relies on the mean) to make decisions. [33], [19] detect rogue
AP by analyzing the TCP-ACK pairs in their mathematical
model. [31] treats different ranges of a TCP connection
separately. [22] relies on the RTT sent to hosts to distinguish
WLAN, and it takes some traffic factors into consideration
to increase the precision. [17], [28] rely on the frequent rate
adaptation in the wireless network to distinguish it with wired
networks. However, this line of work should solve the problem
of falsely claiming an authorized wireless user who connects
to Intranet with wireless networks. Thus, they may still need
to further verify a wireless device is an authentic AP or not
with some “fingerprint” from authorized lists. [20], [26] are
two hybrid studies that provide the fingerprint comparisons in
the integrated systems.
Our work, ETSniffer, is different from all previous
(administrator-oriented) work, since we do not require the
knowledge of an authorized AP/host list. This is the first userside evil twin detection scheme, to the best of our knowledge.
III. P ROBLEM S TATEMENT
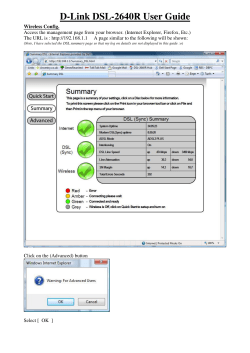
(a) Normal AP scenario
(b) Evil twins AP scenario
Fig. 1: Illustration of the target problem in this paper.
The goal of our work is to detect evil twin attacks in real
time under real wireless network environments, i.e., we aim to
detect whether there sits an evil twin AP between a normal AP
and the user. Considering the normal AP scenario, depicted in
Figure 1(a), a user communicates with a remote server through
a normal AP using 802.11 WLAN; on the other hand, in the
evil twin AP scenario, depicted in Figure 1(b), the victim
client communicates with a remote server through an evil
twin AP and a normal AP. In both two scenarios, the normal
AP connects with the remote server through wired (Ethernet)
networks. Obviously, compared with the normal AP scenario,
the evil twin AP scenario has one more wireless hop. This
observation gives us the intuition to detect evil twin attacks
by differentiating one-hop and two-hop wireless channels.
To achieve the goal, we must answer the following three
questions: (1) What statistics can be used to effectively distinguish one-hop and two-hop wireless channels on the user
side? (2) Are there any dynamic factors in a real network
environment that can affect such statistics? (3) How to design
robust and efficient detection algorithms with the consideration
of these influencing factors? Next, we provide a high-level
description about our solutions to these questions and then
explain details in Section IV and V.
For the first question, we choose Inter-packet Arrival Time
(IAT) as the detection statistic. IAT is a time interval between
two consecutive data packets sent from the same device (the
remote server or the connected AP) to the client. In order to
compute IAT more effectively and accurately, we adopt a new
ACK-packet sending policy – an immediate-ACK policy, i.e.,
ETSniffer always immediately acknowledges every data packet
received and the server sends next data packet only when
receiving an acknowledge for the previous one.1 It is different
from traditional delayed-ACK policy in wireless networks,
in which a receiver sends an ACK packet after receiving
two continuous packets (or after the delayed-ACK timer is
triggered) [21], [23]. Under the immediate-ACK policy, if
ETSniffer receives two consecutive data packets P1 and P2 ,
and sends corresponding ACK packets A1 and A2 . Then,
on the client side the packet sequence is in an order of
P1 A1 P2 A2 . If we let TP1 and TP2 be the time when the
1 Note that this is not a global policy. It only affects the specific probing
sessions initialized by ETSniffer for detection. We discuss our implementation
to enforce such policy in Section VI-A.
client receives P1 and P2 , respectively. Then the IAT can be
computed as TP2 − TP1 .
For the second question, in a real wireless network environment, two main factors will affect IAT: Received Signal
Strength Indication (RSSI) [2] and wireless network saturation.
In wireless networks, RSSI fluctuates due to the multi-path
and fading effects of the radio signal propagation. Since most
wireless network cards have a transmission rate adaptation
mechanism to adjust to different RSSI levels, the fluctuation
of RSSI directly influences the practical available wireless
bandwidth, causing the fluctuation of IAT. In addition, wireless network saturation is another influencing factor. When
multiple devices synchronously attempt to send packets to the
same AP, the medium access collisions emerge and spur the
phenomenon of network saturation. This phenomenon stochastically increases the time for transmitting packets from a client
to the AP. Specifically, according to CSMA/CD mechanism,
the collisions set the exponential back-off time and account for
an additional distributed inter-frame spacing (DIFS) [11], [29]
time and a short inter-frame spacing (SIFS) [11], [29] time.
Previous work such as [18], [16] shows that the throughput
decreases with the increased number of the wireless clients,
leading to larger IAT.
For the last question, we develop two new algorithms:
Trained Mean Matching (TMM) and Hop Differentiating Technique (HDT). Both algorithms utilize wireless IAT network
statistic, consider the influencing factors of RSSI and saturation, and employ Sequential Probability Ratio Test (SPRT)
technique to make the final detection.
IV. S ERVER IAT A NALYSIS
A. Theoretic Analysis of Server IAT
In this section, we show the theoretic analysis of Server IAT
(IAT computed by the data packets sent from the server) and
further demonstrate that Server IAT can be used to differentiate
one-hop wireless channels and two-hop wireless channels, and
thus it can be used to detect evil twin attacks.
First, we list used variables in our detection model and
their settings (based on IEEE 802.11 standard [19]) in Table I.
Since we consider both influencing factors (RSSI and network
saturation), to better describe our model, we define the special
wireless network environment with a perfect signal strength
(RSSI = 100%) and no wireless collisions as “an ideal network
e S be one Server IAT under
environment”. Let ∆AS and ∆A
the “real network environment” and the “ideal network environment”, respectively. BW and BE denote the bandwidth of
wireless network and Ethernet, respectively. Let ρ denote the
bandwidth occupancy of Ethernet. W0 is the initial contention
window size. TDIF S is one DIFS time and TSIF S is one
SIFS time. TBF denotes the back-off time which follows a
uniform distribution in terms of the contention window size.
LACK(MAC) and LACK(T CP ) are the size of an ACK-packet
in the MAC layer and in the TCP layer, respectively. LP
denotes the size of one data packet that the client receives
and LPe is the average packet size on the Internet, which is
usually between 300 and 400 bytes [27].
Thus, from Figure 2, we can get that
TABLE I: Variables and settings in our model
Protocol
BW
BE
W0
TDIF S
TSIF S
LACK(M AC)
LACK(T CP )
LP
LP̃
802.11b
11MBps
100MBps
32
50µs
10µs
278Bytes
338Bytes
402Bytes
375Bytes
802.11g
54MBps
100MBps
16
50µs
10µs
278Bytes
338Bytes
402Bytes
375Bytes
e
∆A
S = TP2 − TP1
LACK(T CP )
LACK(M AC)
+ TDIF S + TBF +
= TSIF S +
BW
BW
LP
+ TM AX + TDIF S + TBF +
BW
= 2TDIF S + TSIF S + 2TBF
+
LACK(M AC) + LACK(T CP ) + LP
BW
+ TM AX
LACK(M AC) + 2LACK(T CP ) + 2LP
BW
W here, TM AX = max
TSIF S +
LACK(M AC)
BW
Le
ρ
P
∗
and E(Twait ) =
BE
2(1−ρ)
Fig. 2: Server IAT illustration in the normal AP scenario (onehop wireless channel) in an ideal network environment.
e S )one−hop as the mean of
Theorem 1. If we denote E(∆A
e
Server IAT ∆AS in a one-hop wireless channel, then in the
normal AP scenario, we can get
e
E(∆A
S )one−hop = 2TDIF S + TSIF S + 2E(TBF )
LACK(M AC) + LACK(T CP ) + LP
+ E(TM AX )
+
BW
(1)
LACK(M AC)
LACK(T CP ) +LP
,
+ Twait
BW
BE
Le
ρ
P
∗
and E(Twait ) =
BE
2(1−ρ)
!
Proof: In the normal AP scenario, considering the procedure that the client receives two consecutive data packets P1
and P2 from the remote server and it sends ACK packets A1
and A2 correspondingly, we show the analysis in Figure 2.
When A1 arrives at the AP, the AP will wait for one TSIF S
time and then send an ACK-packet in the MAC layer back
to the client. Since in the Ethernet, packets from other traffic
may occupy the wired link, the AP will have to wait for some
extra time to finish transmitting A1 . We denote this extra time
as Twait . Commonly, the packets to the server will form an
M/D/1 queue. Based on the M/D/1 queue theory, we can get
ρ
2(1 − ρ)
∗
Le
P
BE
After receiving A1 , the server will send P2 to the AP. If the
AP has not finished sending the ACK packet in the MAC layer
to the client, the AP could not begin to send P2 to the client.
Thus, after A1 arrives at the AP from the client, the AP will
have to use TMAX time to begin to prepare sending P2 to the
client, where
TM AX = max
TSIF S +
LACK(M AC)
BW
,
LACK(T CP ) + LP
BE
+ Twait
!
(5)
˜ S )two−hop as the mean of
Theorem 2. If we denote E(∆A
˜ S in a two-hop wireless channel, then in the
Server IAT ∆A
evil twin AP scenario, we can get
+
E(Twait ) =
(4)
e
E(∆A
S )one−hop = 2TDIF S + TSIF S + 2E(TBF )
LACK(M AC) + LACK(T CP ) + LP
+ E(TM AX )
+
BW
e
E(∆A
S )two−hop = 4TDIF S + TSIF S + 4E(TBF )
TSIF S +
(3)
Thus,
Then, based on IEEE 802.11 standard and our settings, we
can show that the mean of ∆AS is theoretically differentiable
between the normal AP scenario and the evil twin scenario.
W here, TM AX = max
(2)
,
+ E(TM AX )
LACK(T CP ) +LP
BE
(6)
+ Twait
!
Proof: (See our extended version [25] due to space
limitation of this paper)
˜ S ) be the difference
From theorem 1 and 2, if we let E(∆
˜
˜
of E(∆AS )one−hop and E(∆AS )two−hop , then
˜ S ) = E(∆A
˜ S )two−hop − E(∆A
˜ S )one−hop
E(∆
LACK(T CP ) + LP
(7)
= 2TDIF S + 2E(TBF ) +
BW
Under the real network environment, either the decrease
of RSSI or the increment of wireless collisions can increase
Server IAT, causing the distribution of Server IAT not so steady
as that under the ideal network environment. However, the
evil twin scenario has one more wireless hop leading to a
larger probability of increasing Server IAT than that of the
normal AP scenario. Therefore, if we let E(∆AS )one−hop and
E(∆AS )two−hop as two means of ∆AS in one-hop and twohop wireless channels under the real network environment, we
can get
˜ S)
E(∆S ) = E(∆AS )two−hop − E(∆AS )one−hop ≈ E(∆
LACK(T CP ) + LP
(8)
= 2TDIF S + 2E(TBF ) +
BW
We can see that the mean of ∆AS in the evil twin AP
scenario is larger than that in the normal AP scenario, thus
this observation can be used to detect evil twin attacks.
B. Practical Validation of Server IAT
In this section we show our experimental results to validate
whether Server IAT is an indeed suitable and effective statistic
to differentiate one-hop and two-hop wireless channels.
To minimize data bias, for both one-hop and two-hop
wireless situations, we build our datasets under real network
environments at three different times. We compute Server IAT
in one-hop and two-hop wireless channels by collecting the
packets under the conditions of RSSI = 100 and RSSI =
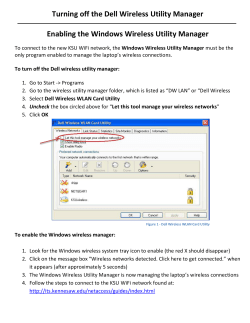
50. The result is shown in Figure 3. We can see that the
distribution of Server IAT keeps stable when RSSI is 100%.
The two means of IAT in one-hop and two-hop wireless
channels are about 1,300ms and 3,300ms, respectively. The
gap of these two means is obvious. Although when the signal
strength decreases (e.g., RSSI at 50%), the distribution of
Server IAT is not so stable as that when RSSI is 100, this
gap can still be legibly observed.
Probability
Probability
IAT in the two-hop (evil twin AP) scenario, denoted as
µ2,EAP . We compute the average of µ2,N AP and µ2,EAP ,
as Tθ , set as the boundary to differ one-hop and two-hop
Server IAT. In addition, in order to use SPRT technique, we
obtain two probabilities of a Server IAT in these two scenarios
exceeding the trained threshold, denoted as P1 and P2 , by
computing the percentage of collected Server IATs deviating
from Tθ in the normal and evil twin AP scenario, respectively.
In the detection phase, given a sequence of Server IAT
observations, represented by {δ}ni=1 , we use a binary random
0.1
0.25
variable γi to denote whether the ith observed Server IAT beone−hop; RSSI=100%(1)
one−hop; RSSI=50%(1)
one−hop; RSSI=50%(2)
one−hop; RSSI=100%(2)
longs to evil twin AP scenario or not. Specifically, if δi ≥ Tθ ,
0.08
0.2
one−hop; RSSI=50%(3)
one−hop; RSSI=100%(3)
two−hops; RSSI=50%(1)
two−hops; RSSI=100%(1)
then
γi = 1, indicating an estimated evil twin Ap scenario;
two−hops;
RSSI=50%(2)
two−hops; RSSI=100%(2)
0.06
0.15
two−hops; RSSI=50%(3)
two−hops; RSSI=100%(3)
otherwise, γi = 0, indicating an estimated normal AP scenario.
n
0.1
0.04
Thus, we get a sequence of {γ}i=1 . Let H1 be the hypothesis
0.05
0.02
that it belongs to an evil twin AP scenario and H0 be the
hypothesis
that it belongs to a normal AP scenario. We denote
0
0
0
2000
4000
6000
8000
0
2000
4000
6000
8000
10000
Server IAT (ms)
Server IAT (ms)
P (γi = 1|H1 ) = θ1 and P (γi = 1|H0 ) = θ0 . According to
(a) RSSI=100%
(b) RSSI=50%
the training data, we can set θ0 = P1 and θ1 = P2 . We
can
compute the log-likelihood ratio Λn with the assumption
Fig. 3: IAT distribution in one- and two-hop wireless channels.
that the Server IAT observations are i.i.d. (independent and
identically-distributed) as the following formula:
Qn
V. D ETECTION A LGORITHM
P r(γi |H1 )
P r(γ1 . . . γn |H1 )
= ln Qni=1
Λn = ln
Based on our theoretical analysis and practical validation
P r(γ1 . . . γn |H0 )
i=1 P r(γi |H0 )
in the previous section, we present two algorithms to detect
n
X
P r(γi |H1 )
evil twin attacks: Trained Mean Matching (TMM) and Hop
(9)
ln
=
P r(γi |H0 )
Differentiating Technique (HDT). Both algorithms utilize Sei=1
quential Probability Ratio Test (SPRT) technique [30]. TMM
According to SPRT [30], we perform a threshold random
algorithm requires knowing the distribution of Server IAT as
walk
to calculate the log-likelihood ratio. The walk starts from
a priori (trained) knowledge. However, HDT algorithm does
zero.
If γi = 1, then it goes up with a length of ln(θ1 )−ln(θ0 );
not need such a requirement. Instead, it is directly based on
if
γ
=
0, then it goes down with a length of ln(1−θ1 )−ln(1−
i
theoretical analysis. Thus, it is more suitable for scenarios
θ
).
We
define every random walk as one decision round. Let
0
where the distribution of IAT is either unknown, instable, or
us
denote
α and β as the user-chosen false positive rate and
unable to be (perfectly) trained.
false negative rate, respectively. If the random walk reaches the
A. Trained Mean Matching Algorithm
upper boundary B = ln(1 − β) − ln α, we report evil twin AP
scenario;
if it reaches the lower boundary A = ln β−ln(1−α),
1) TMM Algorithm Description: We have demonstrated
we
report
normal AP scenario; otherwise, it is pending and we
that the distributions of Server IAT in one-hop and twowatch
for
the next decision round.
hop wireless channels differ significantly. According to this
2)
Discussions
of TMM Algorithm: Based on the training
observation, in this section, we develop a detection algorithm
technique,
TMM
algorithm
affords an effective approach to
named Trained Mean Matching (TMM). Specifically, given a
detect
evil
twin
attacks.
However,
in some cases, it is too timesequence of observed Server IATs, if the mean of these Server
consuming
or
impractical
for
a
normal
user to acquire a priori
IATs has a higher likelihood of matching the trained mean of
knowledge,
particularly
the
training
data
for two-hop wireless
two-hop wireless channels, we conclude that the client uses
channels.
In
addition,
the
trained
knowledge
in one wireless
two wireless network hops to communicate with the remote
network is hardly directly applicable to another network. These
server indicating a likely evil twin attack, and vice versa.
In the training phase, we adopt a quadratic-mean tech- limitations motivate us to design a new effective and practical
nique to train a detection threshold. First, we collect non-training-based algorithm to detect evil twin attacks – Hop
Server IAT in both one-hop and two-hop wireless chan- Differentiating Technique (HDT).
nels. Then, we compute the mean and the standard deviation of Server IAT collected in the one-hop (normal B. Hop Differentiating Technique
In HDT algorithm, instead of using the absolute value of
AP) scenario, denoted as µ1,N AP and σ1,N AP , respectively.
Then, we filter out the Server IATs beyond the range IAT, we adopt another metric – the ratio of a Server IAT to
[µ1,N AP − σ1,N AP , µ1,N AP + σ1,N AP ]. Next, we derive the an AP IAT. We define it as SAIR (Server-to-AP IAT Ratio).
second mean using the residual Server IAT, denoted as Next, we theoretically prove that it can be used to robustly
µ2,N AP . Similarly, we can obtain the second mean of Server detect evil twin attacks.
1) Theoretic Analysis of SAIR: Before illustrating our theoretical analysis of SAIR, we first make three reasonable
assumptions:
• The wireless network environment does not change extremely dramatically, which implies a relatively steady
RSSI and collision number at least during the period
when we collect one pair of Server IAT and AP IAT
to compute a SAIR.
• In the evil twin AP scenario, the RSSI and the situation of
network saturation of the link between the victim client
and the evil twin AP are not worse than that between the
victim and the normal AP.
• The Ethernet is not under the situation of severe network
congestion.
For the first assumption, since the time cost during collecting one pair of Server IAT and AP IAT is in seconds, it is
reasonable to assume the wireless network environment does
not change dramatically during such a short time interval. For
the second one, since the attacker wants to successfully allure
victim clients to connect with the evil twin AP, it is more
likely for the attacker to provide a better RSSI and a smaller
wireless collision probability. For the last one, if there is a
severe network congestion in the Ethernet, few people would
choose the normal AP to surf the Internet.
Next, we introduce some variables to better describe our
model. Let ∆AA be the AP IAT and α be the SAIR, under
˜ A be the AP IAT and α̃
the real network environment. Let ∆A
be the SAIR under the ideal network environment. Then, we
can get
α=
∆AS
and α̃ =
∆AA
˜ S
∆A
˜ A
∆A
(10)
Then, based on IEEE 802.11 standard and our settings, we
next prove that the mean of α is theoretically differentiable
between the normal AP scenario and the evil twin AP scenario,
and thus can be used to effectively detect the evil twin attacks.
Similar to Theorem 1, we can get the mean of AP IAT as
illustrated in Figure 4.
e A )one−hop = 2TDIF S + 2TSIF S + 2E(TBF )
E(∆A
2LACK(MAC) + LACK(T CP ) + LP
+
BW
(11)
Fig. 4: AP IAT illustration in an ideal network environment.
We have the following two theorems that give us theoretic
evidence on the effectiveness of this detection statistic.
Theorem 3. If we denote E(αone−hop ) and E(α̃one−hop ) as
the mean of α and α̃ in one-hop wireless channels, then we
can get: for WLAN 802.11b, E(αone−hop ) ≤ E(α̃one−hop ) =
1.00; for WLAN 802.11g, E(αone−hop ) ≤ E(α̃one−hop ) =
1.11.
Proof: (See our extended version [25])
Theorem 4. If we denote E(αtwo−hop ) and E(α̃two−hop ) as
the mean of α and α̃ in two-hop wireless channels, then we
can get: for WLAN 802.11b, E(αtwo−hop ) ≥ E(α̃two−hop ) =
1.74; for WLAN 802.11g, E(αtwo−hop ) ≥ E(α̃two−hop ) =
1.94.
Proof: (See our extended version [25])
From Theorem 3 and 4, we can see that the theoretical mean
of α in evil twin AP scenario is significantly larger than that
in the normal AP scenario, thus it can be used to detect evil
twin attacks.
2) HDT Algorithm Description: In the previous section,
we have proved that SAIRs in one-hop and two-hop wireless
channels differ significantly. Even under the real network
environment, we can still compute a theoretical SAIR bound to
distinguish these two scenarios. According to this observation,
in this section, we develop a non-training-based detection
algorithm named Hop Differentiating Technique (HDT).
Different from the TMM algorithm, in HDT algorithm, we
use a theoretical value of threshold rather than a trained threshold to detect evil twin attacks. In the theoretical computation
phase, we theoretically compute a threshold αθ as the SAIR
boundary to differentiate one-hop SAIR and two-hop SAIR.
Besides, in order to use SPRT technique, we also compute the
upper bound for the probability of the SAIR exceeding the
threshold αθ in the normal AP scenario, and the lower bound
for the probability of the SAIR exceeding the threshold αθ
in the evil twin AP scenario. The specific explanations about
the computation of these three parameters will be discussed
shortly.
In the detection phase, similar to the TMM algorithm, we
also use SPRT technique to make the final decision. The main
difference from TMM algorithm is that HDT algorithm uses
the observed SAIR rather than IAT in one decision round to
perform the threshold random walk.
3) Threshold Setting For HDT Algorithm: In this section,
we develop a discrete numerical algorithm to theoretically
compute the SAIR threshold αθ for HDT algorithm, with
a goal of minimizing the probability of making a wrong
decision. According to Theorem 3 and 4, we can know that
the threshold αθ should be between 1 and 2. So, if we denote
P1 = P (αone−hop ≥ αθ ) and P2 = P (αtwo−hop ≥ αθ ), the
problem can be transformed to compute E(α̂θ ),
s.t.,
α̂θ = arg min1≤αθ ≤2 (P1 + 1 − P2 )
(12)
In the process of our computation, we let αθ increase from 1
to 2 in fine-grained steps. In every step, we increase αθ by
0.01 and compute P1 +1−P2 . Once αθ reaches 2, we can find
the value of α̂θ leading to the minimal P1 + 1 − P2 . According
to 802.11 standard, we can derive the following results (details
regarding to this computation can be found in our extended
version [25]):
• If we consider the packets without any collisions, then,
- for Protocol 802.11b, αθ = 1.31, P1 ≤ 21.8%, P2 ≥
76.9%;
- for Protocol 802.11g, αθ = 1.48, P1 ≤ 27.3%, P2 ≥
71.5%;
• If we consider the packets whose collision numbers are
under three, then,
- for Protocol 802.11b, αθ = 1.34, P1 ≤ 21.2%, P2 ≥
74.9%;
- for Protocol 802.11g, αθ = 1.48, P1 ≤ 27.3%, P2 ≥
71.2%;
C. Improvement by Data Preprocessing
In this section, we describe two data preprocessing techniques to improve the results: data filtering and data smoothing. For the first technique, we filter noisy data (according
to the theoretical Server IAT) with large number of network
collisions. For the second technique, we use the mean of
multiple collected input data, rather than only one collected
data, to smooth the input.
1) Data Filtering: In order to filter noisy data, we only
consider the packets whose collision number is at most three.
(According to [29], when the number of users is under 20,
the probability that a packet has at most 3 collisions is over
85%). In this way, we can both filter the noisy data and keep
sufficient data to implement the detection. Thus, according to
IEEE 802.11 standard and our filter policy, we filter out the
packets whose AP IATs exceeding 21,000µs or Server IAT
exceeding 39,800µs.
2) Data Smoothing: To further improve the result, we also
use the mean of multiple input data rather than only one input
data in one decision round. Specifically, we use the mean of
multiple Server IATs or the mean of multiple SAIRs instead
of only one Server IAT or one SAIR in one decision round to
perform the threshold random walk. We name TMM algorithm
and HDT algorithm using multiple Server IATs and multi
SAIRs as multi-TMM algorithm and multi-HDT algorithm,
respectively.
VI. EVALUATION
We evaluate the results and the performance of our evil twin
attack detection algorithms through implementing a detection
prototype system named ETSniffer (Evil Twin Sniffer). In this
section, we describe our evaluation methodology, including
the experimental setup, datasets, effectiveness, efficiency and
cross-validation.
A. Implementation and Experimental Setup
We have implemented ETSniffer using Windows raw socket,
since we need packet level control (including TCP parameters). As mentioned earlier, in order to guarantee the efficiency
and accuracy of the computation of IAT, we adopt a new
acknowledgment mechanism, named immediate-ACK policy.
We achieve the immediate-ACK policy by setting the TCP
Maximum Segment Size (MSS) in the TCP header equal to
the TCP Window Size. In this way, a TCP server should wait
to receive the ACK packet for the previous data packet before
sending out the next data packet. Note, since our immediateACK policy is only applicable to the specific probing connections initialized and controlled by ETSniffer, this policy will
not devour network bandwidth. In addition, we use a fixed and
small number for MSS setting in every connection to guarantee
sufficient data packets received to detect evil twin attacks. By
initiating TCP connection with customized TCP option and
setting to make the server respond in the way we desire (e.g.,
sending packets with small size), ETSniffer can collect enough
packets needed for detection even from a small-sized web page
(which may only result in one or two packets in the normal
setting).
Fig. 5: Experimental environment setting for the evaluation of
the normal AP scenario.
We set up our ETSniffer in the campus network of the
Texas A&M University. To achieve user-side detection, we
install ETSniffer in a laptop with a wireless network card.
The ETSniffer can capture the packets, along with the current
timestamp, to compute IAT and SAIR. To simulate a normal
AP scenario, we use a laptop installed with ETSniffer as a
user/detection client to communicate with a campus server
through TAMULink (an official Texas A&M’s campus wireless network Access Point). To simulate an evil twin AP
scenario, we deploy another laptop as a wireless access point
to act as an evil twin AP near to the detection client. The evil
twin AP has the same SSID as the TAMULink, yielding a good
RSSI to the detection client between 80% and 100%. And
the evil twin AP connects to the server through the campus
TAMULink AP. Thus, in this scenario, the detection client
communicates with the server through a two-hop wireless
channel. The actual experimental environment setting can be
seen in Figure 5 and 6.
B. Datasets
We have collected data in real network environments, and
built our datasets at different time and with different RSSI
levels. To better evaluate our results, in our experiments, we
denote different RSSI levels into 6 ranges: A, B+, B-, C+,
TABLE V: False positive rate for HDT and TMM
A
2.19%
8.39%
1.08%
0.78%
802.11g(HDT)
802.11b(HDT)
802.11g(TMM)
802.11b(TMM)
B+
1.41%
8.76%
1.76%
1%
B2.06%
5.39%
1.97%
1.07%
C+
1.93%
6.96%
1.48%
1.27%
C2.48%
5.27%
1.75%
6.65%
D
6.52%
5.15%
1.73%
7.01%
round. But once the number of input data attains to some
bound (in our experiment, the bound is 70), the performance
become relatively steady.
1
Fig. 6: Experimental environment setting for the evaluation of
the evil twin AP scenario.
0.98
C-, and D, as illustrated in Table II. As described in Section
TABLE II: RSSI ranges and corresponding levels
Range
Upper
Lower
A
100%
80%
B+
80%
70%
B70%
60%
C+
60%
50%
C50%
40%
D
40%
20%
E
20%
0%
Probability
0.96
0.94
0.92
RSSI Range: A
0.9
RSSI range: B+
0.88
RSSI Range: B−
RSSI Range: C+
0.86
0.82
10
V-C1, we filter the packets whose collision numbers exceed
three. The percentages of filtered packets are shown in Table
III.
TABLE III: The percentage of filtered packets
Tech
HDT
TMM
Protocol
802.11g
802.11b
802.11g
802.11b
A
0.80%
1.38%
0.62%
0.99%
B+
0.86%
1.44%
0.68%
1.04%
B3.91%
5.61%
2.59%
3.33%
C+
3.72%
6.17%
2.66%
4.82%
C4.69%
9.42%
3.30%
7.44%
D
7.09%
10.36%
6.02%
8.29%
RSSI range: C−
RSSI range: D
0.84
20
30
40
50
60
70
80
Number of input data in one Decision Round
90
100
Fig. 7: Detection rate for multi-HDT using different numbers
of input data in one decision round.
The results, obtained by setting the number of input data in
one decision round as 50 and 100, are shown in Table VI, VII,
VIII. From these tables, we can see that for both algorithms,
the results computed by using 100 input data are better than
that using 50 input data. Especially, when we use 100 input
data in one decision round, we can get a nearly perfect result.
C. Effectiveness
We evaluate the effectiveness of our algorithms based on
different RSSI ranges and two IEEE WLAN protocols –
802.11b and 802.11g. In the normal AP scenario, the RSSI
refers to the link between the user and the normal AP; in the
evil twin AP scenario, the RSSI refers to the link between
the user and the evil twin AP. The results are shown in
Table IV and V, which clearly verify the effectiveness of
our algorithms. In addition, we can also find that the results
obtained in 802.11g are better than those obtained in 802.11b.
This is caused by the low bandwidth and larger initial window
size in 802.11b protocol, leading to a larger variance of IAT
distribution.
TABLE IV: Detection rate for HDT and TMM
802.11g(HDT)
802.11b(HDT)
802.11g(TMM)
802.11b(TMM)
A
99.08%
99.92%
99.39%
99.81%
B+
98.72%
99.99%
99.97%
95.43%
B93.53%
99.96%
99.49%
94.81%
C+
94.31%
99.95%
99.5%
96.09%
C87.29%
96.05%
98.32%
91.94%
D
81.39%
94.64%
94.36%
85.71%
As described in Section V-C2, we use multi-TMM and
multi-HDT to improve the results. The results of these two
algorithms are shown in Figure 7. We can find that the
detection rate increases with more input data in one decision
TABLE VI: Detection rate for multi-TMM and multi-HDT,
when the number of input data in one decision round is 50
802.11g(multi-TMM)
802.11b(multi-TMM)
802.11g(multi-HDT)
802.11b(multi-HDT)
A
99.62%
100%
100%
100%
B+
100%
100%
99.11%
100%
B100%
100%
98.73%
100%
C+
99.95%
100%
99.88%
100%
C100%
100%
95.83%
100%
D
100%
100%
88%
100%
TABLE VII: False positive rate for multi-TMM and multiHDT, when the number of input data in one decision round is
50
802.11g(multi-TMM)
802.11b(multi-TMM)
802.11g(multi-HDT)
802.11b(multi-HDT)
A
0%
0%
0%
0%
B+
0.77%
0.03%
0.96%
1.07%
B0%
0.02%
0.16%
1.16%
C+
0%
0.11%
0.13%
1.02%
C0%
0.73%
0.55%
1.36%
D
0%
0.1%
0.96%
1.41%
D. Time Efficiency
In this section, we evaluate the time efficiency of our
algorithms. We use the average number of decision rounds
to output a correct decision as the evaluation metric. We also
use cumulative probability to express the process of the loglikelihood ratio to reach the bounds. The result is shown in
Figure 8.
B+
0%
0%
0%
0%
B0%
0.01%
0%
0.02%
C+
0%
0.01%
0%
0.02%
C0%
0.02%
0%
0.03%
D
0%
0.01%
0%
0.03%
1
1
0.9
0.9
Detection Rate
802.11g(multi-TMM)
802.11b(multi-TMM)
802.11g(multi-HDT)
802.11b(multi-HDT)
A
0%
0%
0%
0%
Training RSSI range: D
Training RSSI Range: A
Detecton Rate
TABLE VIII: False positive rate for multi-TMM and multiHDT, when the number of input data in one decision round is
100 (detection rate is always 100% in this case)
0.8
0.7
0.7
original
0.6
original
0.5
cross
0.5
B+
0.4
A
0.4
A
B−
C+
C−
D
RSSI
1
0.8
0.6
(a) Training RSSI range is A
cross
B+
B−
RSSI
C+
C−
D
(b) Training RSSI range is D
Fig. 9: The detection rate for TMM algorithm under different
RSSI ranges.
0.9
0.85
0.8
RSSI Range A
RSSI Range B+
0.75
RSSI Range B−
RSSI Range C+
0.7
RSSI Range C−
0.65
5
RSSI Range D
10
15
20
25
30
35
40
45
Number of Decision Rounds to output a correct result
50
we conduct a cross-validation under different locations. For
TMM algorithm, we train the Server IAT threshold using the
data collected in one wireless environment, and execute the
detection in another location. From Figure 10 and 11, we can
see that, if we train and test in different environments, the performance of TMM algorithm decreases obviously. However,
the performance of HDT algorithm keeps steady.
From Figure 8, we can see that when RSSI is high, our
HDT algorithm can output a correct decision within a few
decision rounds. Although when RSSI drops, it needs more
decision rounds, even under a low RSSI (e.g. RSSI range is
D), our algorithm can obtain a correct result within 45 decision
rounds, consuming a very short time. TMM has a very similar
performance.
Detection Rate
Fig. 8: Cumulative probability of the number of decision
rounds for HDT algorithm to output a correct result.
1
1
0.9
0.9
Detection Rate
Cumulative Probability
0.95
0.8
0.7
original
0.6
0.5
cross
0.4
A
B+
B−
C+
C−
D
RSSI
0.8
0.7
0.6
original
0.5
cross
0.4
A
B+
B−
C+
C−
D
RSSI
(a) TMM algorithm
(b) HDT algorithm
Fig. 10: Detection rate under different 802.11g networks.
E. Cross-Validation
0.2
0.2
0.15
0.15
False Positive
original
False Positive
Form Section VI-C, we can find that both TMM algorithm
and HDT algorithm demonstrate high efficiency and effectiveness. Especially, TMM algorithm, based on the trained
knowledge, performs a little bit better than HDT algorithm.
However, as described in Section V-A2, in many practical
cases, the prior knowledge is difficult to be obtained. In
addition, TMM algorithm does not accommodate well to
the changes of the wireless network environment. Thus, to
evaluate such limitations of TMM algorithm, in this section,
we design cross-validation experiments under different levels
of RSSI and different locations.
1) Cross-validation under different RSSI: In this section, we implement the cross-validation under different RSSI
ranges. Specifically, we train the Server IAT threshold for
TMM algorithm using the data from only one RSSI range
and execute the detection phase using the data from all RSSI
ranges. We show two scenarios in Figure 9 in this paper (a
complete result can be found in [25]). From Figure 9, we can
see that the detection rate drops dramatically, revealing TMM
algorithm’s tight dependency on the (perfect) training data.
2) Cross-validation under different locations: To validate
the performance of TMM and HDT in different environments,
0.1
original
cross
0.05
0
A
B+
B−
C+
C−
cross
0.1
0.05
D
RSSI
0
A
B+
B−
C+
C−
RSSI
(a) TMM algorithm
(b) HDT algorithm
Fig. 11: False positive rate under different networks.
VII. D ISCUSSION
AND
F UTURE W ORK
Several relevant studies (e.g., [33], [34]) showed that the
delays from the wired link is not comparable to those in the
wireless link. In our experiment, the (remote) server is four
(wired) hops away from the AP. While more wired hops will
involve likely more “noise”, we note that SPRT technique can
tolerate reasonable noise if we trade off for more decision
rounds. In reality, we recommend to use a server within small
hops. However, if the user has to use a server with many hops,
D
we could consider using techniques similar to “traceroute” to
know the (wired) transfer time and then exclude/subtract them
to minimize the (noisy) effect at wired side.
It is possible that once attackers know our algorithm, they
attempt to evade the detection. Since they are in the middle
of the user and normal AP, they can attempt to manipulate the
packet relay time to affect IAT. They cannot decrease IAT, but
they can delay the forwarding to increase IAT. For example,
in order to evade HDT, the attacker should intentionally
increase AP IAT to make it less differentiable than Server
IAT. However, this actually violates the attacker’s intention
to be a fast AP because the user will definitely favor an AP
will good speed and if the evil twin chooses to do so it may
lose the attraction to the victims. In addition, in such situation,
the user is still easy to detect such anomaly by using TMM
algorithm. Thus, we conclude that our detection algorithms
are still reasonably effective.
Our current work focuses on evil twin AP detection, where
the evil twin AP will utilize the normal AP to connect to
Internet. This is a very realistic threat faced by public WLANs
provided at airports, hotels, libraries, or cafes, etc. In our future
work, we plan to extend our evil twin AP detection to more
general malicious AP detection, where a malicious AP may
not require the normal AP to relay traffic, or may not need to
impersonate a normal AP. We also plan to study the problem in
wireless infrastructures (e.g., 3G or WiMax) that have multihop legitimate wireless channels.
VIII. C ONCLUSION
In this paper, we have proposed a novel lightweight userside evil twin attack detection technique. We presented two
algorithms, TMM and HDT. Through our prototype system
implementation and extensive evaluation in several real-world
wireless networks, we showed that our proposed technique is
effective and efficient. HDT is particularly attractive because
it does not rely on trained knowledge or parameters, and is
resilient to changes in wireless environments.
ACKNOWLEDGMENT
We thank Mahesh Sabbavarapu and Radu Stoleru for helpful
discussions on an early version of this paper.
R EFERENCES
[1] Cisco Wireless LAN Solution Engine (WLSE). White paper, http://
www.cisco.com/en/US/products/sw/cscowork/ps3915/.
[2] Received Signal Strength Indication.
http://en.wikipedia.org/wiki/
Received signal strength indication.
[3] Rogue access point detection: Automatically detect and manage wireless
threats to your network. White paper, http://www.proxim.com.
[4] Soft AP solutions. White paper, http://www.marvell.com/products/
wireless/softap.jsp.
[5] The Airmagnet project. http://www.airmagnet.com/.
[6] The Airwave project. http://www.airwave.com.
[7] The Inssider software. http://www.metageek.net/products/inssider.
[8] The Netstumbler project. http://www.netstumbler.com.
[9] Wavelink. http://www.wavelink.com.
[10] WiSentry - Wireless Access Point Detection System. http://www.
wimetrics.com/Products/WAPD.htm.
[11] IEEE Standard for Wireless LAN Medium Access Control (MAC)
and physical layer (PHY) specifications: Higher-speed physical layer
extension in the 2.4 GHz band, 1999.
[12] AirDefense.
TIRED OF ROGUES? Solutions for Detecting
and Eliminating Rogue Wireless Networks.
White paper, http://
wirelessnetworkchannel-asia.motorola.com/pdf/.
[13] P. Bahl, R. Chandra, J. Padhye, L. Ravindranath, M. Singh, A. Wolman,
and B. Zill. Enhancing the security of corporate Wi-Fi networks using
DAIR. In Proc. MobiSys’06, 2006.
[14] V. Baiamonte, K. Papagiannaki, G. Iannaccone, and P. D. Torino.
Detecting 802.11 wireless hosts from remote passive observations. In
Proc. IFIP/TC6 Networking, 2007.
[15] R. Beyah, S. Kangude, G. Yu, B. Strickland, and J. Copeland. Rogue
access point detection using temporal traffic characteristics. In IEEE
Global Telecommunications Conference (GLOBECOM’04), 2004.
[16] G. Bianchi and D. e Inf. IEEE 802.11-saturation throughput analysis.
IEEE communications letters, 2(12):318–320, 1998.
[17] C. Corbett, R. Beyah, and J. Copeland. A passive approach to wireless
NIC identification. In IEEE International Conference on Communications (ICC’06), 2006.
[18] C. Foh and J. Tantra. Comments on IEEE 802.11 saturation throughput
analysis with freezing of backoff counters. IEEE Communications
Letters, 9(2):130–132, 2005.
[19] S. Garg and M. Kappes. An experimental study of throughput for UDP
and VoIP traffic in IEEE 802.11 b networks. In 2003 IEEE Wireless
Communications and Networking (WCNC’03), 2003.
[20] L. Ma, A. Teymorian, and X. Cheng. A hybrid rogue access point
protection framework for commodity Wi-Fi networks. In Proc. IEEE
Infocom’08, 2008.
[21] D. MacDonald and W. Barkley. Microsoft Windows 2000 TCP/IP Implementation Details. White paper, http://technet.microsoft.com/en-us/
library/bb726981.aspx.
[22] C. Mano, A. Blaich, Q. Liao, Y. Jiang, D. Cieslak, D. Salyers, and
A. Striegel. RIPPS: Rogue identifying packet payload slicer detecting
unauthorized wireless hosts through network traffic conditioning. ACM
Transactions on Information and System Security (TISSEC), 11(2):1–23,
2008.
[23] P. Sarolahti and A. Kuznetsov. Congestion control in linux tcp. In
Proceedings of the FREENIX Track: 2002 USENIX Annual Technical
Conference, 2002.
[24] S. Shetty, M. Song, and L. Ma. Rogue access point detection by analyzing network traffic characteristics. In IEEE Military Communications
Conference (MILCOM’07), 2007.
[25] Y. Song, C. Yang, and G. Gu. Who Is Peeping at Your Passwords at
Starbucks? – To Catch an Evil Twin Access Point (Extended Version).
http://faculty.cs.tamu.edu/guofei/etsniffer tr09.pdf. Technical report.
[26] S. Srilasak, K. Wongthavarawat, and A. Phonphoem. Integrated Wireless
Rogue Access Point Detection and Counterattack System. In International Conference on Information Security and Assurance, pages 326–
331, 2008.
[27] K. Thompson, G. Miller, and R. Wilder. Wide-area Internet traffic
patterns and characteristics. IEEE network, 11(6):10–23, 1997.
[28] A. Venkataraman and R. Beyah. Rogue Access Point Detection Using
Innate Characteristics of the 802.11 MAC. In International Conference
on Security and Privacy in Communication Networks (SecureComm’09),
2009.
[29] H. Vu and T. Sakurai. Collision probability in saturated IEEE 802.11
networks. In Australian Telecommunication Networks and Applications
Conference, 2006.
[30] A. Wald. Sequential Analysis. Dover Publications, 2004.
[31] L. Watkins, R. Beyah, and C. Corbett. A passive approach to rogue
access point detection. In Proc. IEEE Globecom’07, 2007.
[32] W. Wei, S. Jaiswal, J. Kurose, and D. Towsley. Identifying 802.11 traffic
from passive measurements using iterative Bayesian inference. In Proc.
IEEE INFOCOM’06, 2006.
[33] W. Wei, K. Suh, B. Wang, Y. Gu, J. Kurose, and D. Towsley. Passive
online rogue access point detection using sequential hypothesis testing
with TCP ACK-pairs. In Proceedings of the 7th ACM SIGCOMM
conference on Internet measurement (IMC’07), 2007.
[34] W. Wei, B. Wang, C. Zhang, J. Kurose, and D. Towsley. Classification
of access network types: Ethernet, wireless LAN, ADSL, cable modem
or dialup? Computer Networks, 52(17):3205–3217, 2008.
[35] H. Yin, G. Chen, and J. Wang. Detecting protected layer-3 rogue APs. In
Proceedings of the Fourth IEEE International Conference on Broadband
Communications, Networks, and Systems (BROADNETS’07), 2007.


© Copyright 2026