
EVALUATION OF STATE-LEVEL U.S. ELECTRIC VEHICLE INCENTIVES WHITE PAPER OCTOBER 2014
WHITE PAPER
OCTOBER 2014
EVALUATION OF STATE-LEVEL
U.S. ELECTRIC VEHICLE INCENTIVES
LINGZHI JIN, STEPHANIE SEARLE, AND NIC LUTSEY
www.theicct.org
[email protected]
BE I J I N G
|
BERLIN
|
B R USS E LS
|
SAN FRANCIS CO
|
WAS H INGTO N
ACKNOWLEDGEMENTS
This project was supported by the ClimateWorks Foundation. The authors thank
Zifei Yang, Zhenghong Lin, and Nathan Marwell for advice and Chris Malins,
Anup Bandivadekar, and Zifei Yang for their critical reviews.
For additional information:
International Council on Clean Transportation
1225 I Street NW, Suite 900
Washington DC 20005 USA
[email protected] | www.theicct.org
© 2014 International Council on Clean Transportation
TABLE OF CONTENTS
Executive Summary.................................................................................................................... ii
Abbreviations.............................................................................................................................. v
Introduction.................................................................................................................................1
Overview of state-level EV incentives.................................................................................... 3
Direct incentives........................................................................................................................................ 3
Indirect incentives ................................................................................................................................... 5
Disincentives............................................................................................................................................... 6
Summary of incentives........................................................................................................................... 6
Other incentives........................................................................................................................................ 6
Methodology to quantify electric vehicle policy benefits................................................... 9
Electric vehicle sales data..................................................................................................................... 9
Direct incentives........................................................................................................................................ 9
Indirect incentives ..................................................................................................................................14
Disincentives..............................................................................................................................................16
Benefit-cost ratio of incentives..........................................................................................................16
Analysis of the impact of state-level incentives.................................................................. 19
Variation in state electric vehicle incentives.................................................................................19
Statistical analysis of impact of policies on electric vehicle sales share...........................23
Results from basic benefit-cost analysis of state-level policies............................................24
Discussion .................................................................................................................................26
Conclusions...............................................................................................................................29
References..................................................................................................................................31
Annex A. References for review of state electric vehicle incentives...............................35
A.1. Source of information for incentives by state......................................................................35
A.2. Full reference details....................................................................................................................39
i
ICCT WHITE PAPER
EXECUTIVE SUMMARY
Governments around the world have established electric vehicle incentives with the aim
of reducing petroleum use, greenhouse gas (GHG) emissions, and local air pollutant
emissions. In 2013, nearly 100,000 plug-in hybrid electric vehicles (PHEVs) and battery
electric vehicles (BEVs) were sold in the U.S., but that number falls well short of national
policy targets. In addition to federal efforts to promote electric vehicles, state and
local governments have begun offering electric vehicle incentives in recent years. This
upwelling of support for electric vehicles raises several questions. One basic question is
the total value of state-level actions terms of per-vehicle consumer benefits that could
tip the scales toward higher electric vehicle sales. Further, are the various state electricvehicle incentives beginning to significantly influence electric vehicle adoption rates? In
this early stage of electric vehicle market development, governments could benefit from
an improved understanding of best-practice policies emerging to cost-effectively spur
electric vehicle sales.
This paper seeks to answer these questions by comparing the total monetary benefit
available to consumers through U.S. state incentives to electric vehicle sales in 2013. In
order to quantitatively compare the total benefit offered by different states, this study
introduces a methodology to monetize all major direct and indirect incentives. This
paper is the first to monetize specific consumer-oriented U.S. state-level incentives,
including purchase subsidies, license tax and fee reductions, annual fees for EVs, electric
vehicle supply equipment financing, free electricity at public chargers, free parking, and
emissions testing exemptions. We also make first attempts at quantifying the indirect
incentives associated with carpool vehicle lane access, emissions testing exemption time
savings, and range confidence from public charger availability.
Figure ES-1 summarizes the various electric vehicle consumer benefits and the sales
shares for the ten states with the largest consumer incentives for PHEVs and BEVs. As
shown, the average incentive offered PHEV and BEV purchasers across the U.S. is less
than $1,000 per vehicle, whereas states like Colorado, Illinois, Louisiana, and California
offer $2,000–$6,000 per vehicle in incentives. Some states, like Georgia and Washington,
offer some of the largest benefits in one category, but not both. In several states with
major incentive policies in place—California for both PHEVs and BEVs, Georgia for BEVs,
and Hawaii for BEVs–electric vehicle market shares are about 3–4 times the national
average. On the other hand, as also illustrated, many states (e.g., Colorado, Louisiana, and
Illinois) offer high incentives but are still seeing very low electric vehicle deployment.
ii
STATE-LEVEL U.S. ELECTRIC-VEHICLE INCENTIVES
1.0%
4000
0.8%
3000
0.6%
2000
0.4%
1000
0.2%
0
0.0%
C
ol
or
ad
o
New vehicle share
5000
H
aw
ai
Pe
i
nn
sy
lv
an
ia
N
ew
Je
rs
So
ey
ut
h
C
ar
ol
in
a
A
riz
on
a
U
.S
.a
ve
ra
ge
1.2%
Ill
in
oi
s
6000
G
eo
rg
ia
C
al
ifo
rn
ia
Lo
ui
si
an
a
Consumer benefit ($)
BATTERY ELECTRIC VEHICLE
PLUG-IN HYBRID ELECTRIC VEHICLE
1.4%
5000
1.0%
3000
0.8%
0.6%
2000
0.4%
1000
New vehicle share
Consumer benefit ($)
1.2%
4000
0.2%
0
Emission test exemption
Annual fee
ge
d
ra
ve
.a
.S
U
M
ar
yl
n
to
ng
hi
Carpool
Subsidies
an
C
D
in
ol
ar
W
as
So
ut
h
C
sy
nn
Pe
a
a
va
to
ng
hi
W
as
Free parking
License fee reduction
ni
n
i
ai
aw
H
rn
ifo
al
C
Lo
ui
si
an
ia
a
s
oi
in
Ill
C
ol
or
ad
o
0.0%
Public charger
Home charger
New vehicle share (right axis)
Figure ES-1. Consumer benefit and new vehicle share for U.S. states with largest total battery
electric and plug-in hybrid electric incentives (2013 electric vehicle registration data provided by
IHS Automotive).
This analysis of state-level electric vehicle sales and policy implementation data point to
three key findings and conclusions.
State electric vehicle incentives are playing a significant early role in reducing the
effective cost of ownership and driving electric vehicle sales. Some of the states with
the largest electric vehicle incentives—California, Georgia, Hawaii, Oregon, and Washington—have electric vehicle sales shares that are approximately 2–4 times the national
average. A statistical regression was performed, revealing that the total monetary ben-
iii
ICCT WHITE PAPER
efit to consumers from state incentives significantly positively correlates with BEV sales
when all 50 states and the District of Columbia are included. These findings suggest that
future state efforts to incentivize BEV sales through incentives that substantially drive
down the total cost of owning and operating electric vehicles are likely to be effective.
Some types of incentives appear to be more effective in driving electric vehicle sales
than others. Based on this novel quantification of many state-level policies, it appears
that not all types of incentives affect BEV sales equally. A stepwise regression analysis
shows that the most effective incentives are subsidies, carpool lane access, and emissions testing exemptions initiatives. In addition, a basic benefit-to-cost analysis that
compares incentives’ benefits to consumers to state spending shows that public charger
availability is an especially cost-effective incentive for BEV owners, and carpool lane
access is cost effective for electric vehicle owners.
Further research is needed to more deeply analyze the impact of other factors on
electric vehicle sales. As we show, some state governments offer a wide variety of
incentives to electric vehicle consumers, while others have few or no incentives at all,
and electric vehicle deployment ranges widely across states. In these early days of automakers introducing new electric vehicles and governments implementing electric vehicle
promotion policies, there are still more unknowns than knowns. Many factors remain
outside the scope of this state-level assessment. Examples of electric vehicle promotion
actions that we did not include are those related to R&D programs, fleet-specific policy,
vehicle regulations, low-carbon fuel policy, zero emission vehicle requirements, as well as
incentives offered by cities, utilities, workplaces, automakers, and insurance companies.
Tracking how the level of automaker marketing activity or the limited geographic
electric vehicle roll-out strategies play a role in connecting policy actions to market
uptake of the new technology is also a key unexplored question. This study, a snapshot
of 2013, does not include how technology costs could decline with battery innovation,
greater mass-market economies of scale, or other technical factors. Further study on
these factors may help explain how some cities and states are more or less effective at
accelerating electric vehicle adoption in the future.
iv
STATE-LEVEL U.S. ELECTRIC-VEHICLE INCENTIVES
ABBREVIATIONS
AFV
Alternative fuel vehicle
EVElectric vehicle, including battery electric vehicle and plug-in hybrid
electric vehicle
BEV
Battery electric vehicle
DCFC Direct current fast charger
EVSE Electric vehicle supply equipment
GHG
Green house gas
HOV
High-occupancy vehicle
PHEV Plug-in electric vehicle
v
ICCT WHITE PAPER
INTRODUCTION
The U.S. light-duty vehicle fleet is responsible for about half the petroleum consumed
and about 17 percent of greenhouse gas (GHG) emissions in the nation (National Research Council (NRC), 2013). Electric vehicles are a critical strategy in reducing petroleum dependence and GHG emissions from road transport (NRC, 2013). In 2013, almost
100,000 plug-in hybrid electric vehicles (PHEV) and battery electric vehicles (BEVs)
were sold in the U.S. (Hybridcars, 2014). However, electric vehicle uptake has lagged
policy targets. In order to meet the Obama Administration’s goal of one million electric
vehicles in the U.S. fleet by 2015, the market share would have to increase from less than
1% in 2013 to roughly 6 percent of the auto market (Rascoe & Seetharaman, 2013).
One reason for the slow uptake of electric vehicles is their higher cost compared to
conventional vehicles. For example, the Manufacturer’s Suggested Retail Price of the
2013 Nissan LEAF is $28,880, while that of the comparable Nissan Sentra is $15,990
(Cars.com, 2014). Lower operating costs, especially in terms of electric vehicles’ reduced
fuel and maintenance costs, can reduce the total cost of owning and operating plug-in
electric vehicles (Electric Power Research Institute (EPRI), 2013). However, depending
on the exact vehicle pricing and specifications, vehicle ownership period, annual vehicle
use patterns, and other factors, electric vehicle fuel savings may not be sufficient to
overcome the upfront price differential for most mainstream consumers. In addition, the
long recharge time and shorter range of electric vehicles limit the potential consumer
base for BEVs especially, but there is still room for the electric vehicle market to grow as
the new technology’s lifetime costs decline.
Various forms of policy incentives can contribute to making electric vehicles more
attractive to consumers (see, e.g., Collantes & Eggert, 2014). Direct subsidies, such as
tax credits and rebates, or indirect incentives, such as carpool lane access and public
charging infrastructure, can reduce the effective total cost of electric vehicle ownership
through direct financial savings and through time savings. The U.S. federal government
offers a tax credit for up to $7,500 for electric vehicles, substantially reducing the
purchase price (U.S. Internal Revenue Service (IRS), 2014). Before 2014, it also offered
a tax credit of up to $1,000 for charger installation in homes and up to $30,000 for
businesses. State governments are offering an additional suite of direct and indirect
incentives to electric vehicle consumers. As more and more states consider adding
electric vehicle incentives, it is important to examine state-level policy actions’ relative
impact at driving down electric vehicle costs and driving electric vehicle sales.
This paper seeks to answer this question by comparing the total monetary benefit available to consumers through U.S. state incentives to electric vehicle sales in those states
in 2013. Along the way, this work systematically collects information on all the state-level
electric vehicle promotion policies at play in the U.S. In order to quantitatively compare
the total benefit for electric vehicle consumers offered by different states, this study
introduces a methodology to monetize the major direct and indirect incentives.
This work builds on a previous study that suggested fiscal incentives could potentially
be driving electric vehicle sales on a national level when comparing countries around
the globe but did not include the value of sub-national level and indirect incentives to
consumers (Mock & Yang, 2014). Few previous attempts have been made to monetize
indirect incentives such as high-occupancy vehicle (HOV, i.e. carpool lane) access and
public charger availability. Lin & Greene (2011) made a contribution to this area with an
1
STATE-LEVEL U.S. ELECTRIC-VEHICLE INCENTIVES
assessment of the potential impact of improved recharge availability and range anxiety
alleviation on electric vehicle market development. A report from the Transportation
Energy Futures project (Stephens, T., 2013) discussed non-cost barriers to consumer
adoption of new light-duty vehicle technologies. In addition, several recent policy works
have begun to catalogue policy action and distill best practices from states and cities to
promote electric vehicle readiness (see, e.g., U.S. DOE (2014) and ZEV Program Implementation Task Force (2014)). These studies have been helpful in addressing certain
quantitative and policy issues, but to the best of our knowledge no previous attempts
have been made to monetize specific incentives offered across U.S. states.
The paper first presents a summary of our review of various direct and indirect electric
vehicle incentives available to consumers at the state level in the U.S. In the following
section, we describe our methodology to quantify the effective consumer benefits from
the various state-level direct and indirect electric vehicle incentives. In the analysis, we
conduct statistical regressions and present a comparison between total incentive value
and electric vehicle sales. The discussion section provides in-depth analysis on specific
state policies. Finally, conclusions are presented.
2
ICCT WHITE PAPER
OVERVIEW OF STATE-LEVEL EV INCENTIVES
The focus of this study is on benefits provided by state governments to individual electric
vehicle consumers in 2013. We include direct incentives, as well as indirect incentives that
require an additional level of analysis to quantify their monetary impact on electric vehicle
consumers. This section describes the basic features of the state electric vehicle incentives
that are included in this study and some examples of the policies. Main sources of information on electric vehicle-related incentives in each state are utilized in this work, most
notable U.S. Department of Energy’s Alternative Fuels Data Center (AFDC, 2014c) and
various state government websites. Information on emission test requirements is sourced
largely from DMV.ORG (DMV.ORG, 2014) as well as state Department of Motor Vehicles
(DMV) websites. A full list of references is included in Annex A.
We note that many electric vehicle promotion policies are outside the scope of this study.
Incentives for research and development (R&D), fleets and businesses, workplaces, and
incentives offered by utilities and private companies are not included in our analysis, but
are summarized in this section to give a fuller picture of the varieties of measures that
governments and other organizations have taken to expand the electric vehicle market
share. Local incentives at the county and city level, as well as federal incentives, are not
included. Others examples of electric vehicle promotion actions that we do not discuss are
those related to vehicle regulations, low-carbon fuel policy, zero emission vehicle requirements, utility or workplace incentives, and automaker marketing efforts.
DIRECT INCENTIVES
Direct incentives are those that have a direct monetary value to consumers, reducing
payments electric vehicle owners would otherwise have been required to make. The
direct incentives that we consider in this study are purchase subsidies, license tax/fee
reductions, Electric Vehicle Supply Equipment (EVSE) financing, free electricity, free
parking and emission test exemptions.
Purchase subsidies
Purchase subsidies are usually offered in the form of tax credits and rebates, either for
electric vehicles specifically or for alternative fuel vehicles (AFVs) generally. Subsidies
generally impact both buying and leasing. In the case of leasing, the subsidy stays with
the leasing company, and in most cases, it has been factored into the cost of the lease to
benefit the customer (Dell, 2011). For example, the federal income tax credit is incorporated
into the monthly lease payment, thus avoiding the paperwork and up to 15 months of
waiting for a refund (Voelcker, 2013). A California study (Tal & Nicholas, 2013) has found
that 71% of the sample of 3,800 PEV owners who acquired their car from early 2012 bought
the car and only 29% leased it. The same study found that out of the three main models,
Volt owners have the highest lease share at 38%, compared to the LEAF lease share of
31% and the Plug-in Prius lease share of 18%. The timeline for the refund can also affect the
consumer benefit. Tax credits may take up to a year, while rebates generally take a shorter
time. For example, California’s rebate checks are issued within 90 days of application
approval (Center for Sustainable Energy, 2014). Some states offer the same subsidies to all
types of electric vehicles, some provide a different amount to PHEVs and BEVs (sometimes
based on battery capacity), and others offer the benefit only to BEVs. Examples are
Illinois’s Alternative Fuel Rebate Program, which provides 80% of the incremental cost of
purchasing an AFV, up to $4,000; California’s Clean Vehicle Rebate Project, which offers
3
STATE-LEVEL U.S. ELECTRIC-VEHICLE INCENTIVES
$2,500 for BEV and $1,500 for PHEV purchases; Colorado’s innovative motor vehicle credit,
which offers up to $6,000 based on battery capacity and purchase year; and Georgia’s
income tax credit for zero-emission vehicle (ZEV) purchases of 20% of the vehicle cost,
up to $5,000. In addition to income tax credits, purchase subsidies include state sales tax
exemptions for electric vehicle purchases and related services. For example, New Jersey
offers a sales and use tax exemption for the purchase, rental or lease of a ZEV, and the
District of Columbia (D.C.) has an excise tax exemption for high fuel economy vehicles.
Note that subsidies for electric vehicle conversions (e.g., in Colorado, Illinois, Louisiana and
Montana) are not considered here. Based on our research, 12 states include some kind of
purchase subsidy for electric vehicles that is included in this analysis.
License tax and fee reductions
This category includes license tax reductions and registration fee reductions. For
example, D.C. offers a $36 reduction in the registration fee for new motor vehicles with a
U.S. Environmental Protection Agency (EPA) estimated average city fuel economy of at
least 40 miles per gallon. Arizona, D.C., and Illinois offer this type of incentive.
EVSE financing
Many states offer subsidies for home chargers and public chargers in the form of tax
credits, rebates, and grants. Generally, a state covers a percentage of the cost, capped at
a certain amount. Some states subsidize both hardware and installation cost, while some
only subsidize hardware or only installation cost. Some examples are given below. For
home chargers, Maryland offers an income tax credit equal to 20% of the cost of qualified EVSE, with a cap of $400 or the state income tax imposed for that tax year. Georgia
offers a subsidy for business enterprises that install public chargers, worth 10% of the
cost of the charger and its installation or $2,500, whichever is less. The EV Infrastructure
Rebate Program in Illinois covers 50% of the cost of equipment and installation, with a
cap depending on types of stations; more than $350,000 was awarded in 2013, funding
a total of 130 stations in that program. Based on research into the state electric vehicle
charging infrastructure programs, we included 13 states’ EVSE programs.
Free electricity
When charging at a public Level 2 charging station1, electric vehicle owners often benefit
from free electricity that they otherwise would have paid for at home, especially when
using a charger owned by the state or city. For example, Washington allows electric
vehicles to be charged at no cost at state office locations. A 2013 survey reported
that 90% of electric vehicle owners in California had access to free public chargers
(California Center for Sustainable Energy (CCSE), 2013). There are about 8,000 public
Level 2 stations in the U.S. as of 2013 (AFDC, 2014a). Among these, about 2,000 are
free non-networked stations. Many of the 3,000 stations in the ChargePoint network are
free (Berman, 2014). With the exception of Tesla’s superchargers (free for Tesla owners),
most direct current fast chargers (DCFCs)2 charge a fee for usage and so the provision
of the electricity from DCFCs is not included in this analysis of state incentives. Only
Level 2 charging stations are included in the monetization of free electricity as described
further below.
1 Charging equipment for PHEVs and BEVs is classified by the rate at which the batteries are charged. AC
Level 2 equipment (often referred to as Level 2) charges through 240V (typical in residential applications) or
280V (typical in commercial applications) electrical service, and adds about 10-20 miles of range per hour of
charging time (AFDC, 2014b).
2 Typically 480V DC input, adding 60 to 80 miles of range in about 20 minutes (AFDC, 2014b).
4
ICCT WHITE PAPER
Free parking
Two states provide free parking for electric vehicles. In Hawaii, electric vehicle drivers
can park at meters free of charge (except under specific circumstances). Nevada
requires all local authorities with public metered parking areas to establish a program
for AFVs to park in these areas without paying a fee. The decal (label) for the parking
fee exemption is less than $10 per year. We acknowledge but do not include all electric
vehicle parking incentives. For example, Hawaii requires public parking systems with
one hundred parking spaces or more to include at least one electric vehicle designated
parking space and provide an electric vehicle charging system, but this incentive is not
included in our analysis. We also, for example, did not include free parking in carpool
lots for AFVs in Arizona. In addition to state-level incentives, several local authorities
provide free parking for electric vehicles that were not included in this analysis, for
example, in San Jose, Sacramento, Santa Monica and Hermosa Beach in California, and
New Haven in Connecticut.
Emissions testing exemption
Twenty states require annual or biennial emissions inspections and exempt electric
vehicles, and thus electric vehicle owners do not need to pay for the inspection fees
required of other vehicle owners. For example, Connecticut exempts electric vehicles
from a required biennial emissions inspection, which typically costs $20. A few states,
including Indiana and New Jersey, offer free inspections, while others, such as Missouri
and North Carolina, only require testing in major urban areas.
INDIRECT INCENTIVES
Indirect incentives are those that do not have a direct monetary value to the
consumer. Rather, these incentives save time and provide convenience, which are
sometimes much valued by consumers. Indirect incentives include high-occupancy
vehicle (HOV, i.e. carpool lane) access, emissions testing exemption time savings, and
public charger availability.
Carpool lane access
Ten states offer unrestricted access to HOV or carpool lanes for electric vehicle drivers.
California and Florida also exempt electric vehicles from toll charges on high occupancy
toll (HOT) lanes, sometimes called ‘express lanes’ (essentially HOV lanes that single
occupancy vehicle drivers can access by paying a toll). Access to HOV and HOT lanes
saves electric vehicle drivers time as these routes are typically less congested during
peak hours than other lanes. Some states require a separate sticker, decal, or license
plate to use HOV lanes, which usually cost a small amount of money. We note that HOV
access stickers can be limited in numbers and command a substantial effective cost
among used vehicles with a valid sticker (Blanco, 2009)
Emissions testing time savings
As mentioned above, 20 states offer exemptions from vehicle emission inspections
for users of electric vehicles. Exemption from emissions testing saves electric vehicle
owners time in addition to not paying a fee.
Public charger availability
Because electric vehicles typically have a lower driving range than conventional gasoline
or diesel vehicles, consumers may not feel comfortable driving long distances without
recharge capability. Availability of charging stations can provide consumers range
5
STATE-LEVEL U.S. ELECTRIC-VEHICLE INCENTIVES
confidence and preclude the need to rent a longer-range vehicle on days when driving
longer distances is necessary. Eight states provide funding or other financial incentives
for the installation of publicly available chargers.
DISINCENTIVES
Annual fee
In recent years, some states have begun to charge electric vehicle drivers an annual
fee to make up for lost gasoline tax revenue. States that have enacted such legislation
in 2013 include Nebraska ($75 per vehicle), Virginia ($64) and Washington ($100, for
BEVs but not PHEVs). Similar fees are effective from 2014 onward in Colorado ($50) and
North Carolina ($100) and are not considered in this analysis.
SUMMARY OF INCENTIVES
As shown in Table 1, the direct incentives that we have covered in this analysis are
subsidies, license tax/fee reductions, annual electric vehicle fees, EVSE financing, free
electricity offered at public Level 2 chargers and emissions testing exemptions, and
the indirect incentives are high-occupancy vehicle lane access, emissions testing time
savings and public charger availability. All incentives except public charger availability
apply to both BEVs and PHEVs. As PHEVs may refuel at conventional gasoline stations,
it is assumed that PHEV drivers do not experience range anxiety. Some incentives may
give a different level of benefits to BEVs versus PHEVs, for example, a higher subsidy
for BEVs than PHEVs in some states. These cases are taken into account and treated
individually in the analysis.
Table 1. Incentives applied to BEVs/PHEVs
BEV
PHEV
Subsidies
✓
✓
License tax/fee reduction
✓
✓
EVSE financing
✓
✓
Free electricity
✓
✓
Free parking
✓
✓
Emissions testing exemption
✓
✓
Carpool lane access
✓
✓
Emissions testing time savings
✓
✓
Public charger availability
✓
Annual electric vehicle fee
✓
Type
Direct
Indirect
Disincentive
Incentive
✓
OTHER INCENTIVES
State governments and other organizations utilize a wide variety of resources and
approaches to help expand the market of electric vehicles. Some major categories of
incentives that were researched but not included in this quantitative evaluation are
mentioned below.
Zero Emission Vehicle (ZEV) programs
California adopted the first state ZEV program in 1990, which now requires that electric
vehicles constitute 10% of all vehicle sales in the state in 2025 (Transportpolicy.net,
6
ICCT WHITE PAPER
2014). Nine other states (Oregon, Maine, Vermont, New York, Massachusetts, Rhode
Island, Connecticut, New Jersey, and Maryland) have since adopted ZEV programs
(C2ES, 2014). Although we were unable to include ZEV programs in our monetization
analysis, this may be a rich area for future research.
Incentives provided by utilities
Some utilities offer discounted or time-of-use (TOU) rates for electric vehicle charging
for charging at off-peak hours. TOU rates can reduce costs for electric vehicle owners
who recharge at night. For example, the Maryland Public Service Commission has
established two pilot programs for electricity customers to charge electric vehicles at
lower rates during off-peak hours, offered by Pepco and Baltimore Gas and Electric.
The Los Angeles Department of Water and Power, Georgia Power, and Hawaiian Electric
Company offer similar TOU rates. Some utilities, such as the Orlando utilities commission, also offer rebates for home and commercial charging stations (AFDC, 2014c).
Incentives for electric vehicle fleets
Several states offer monetary incentives for electric vehicle fleets, many in the form of
vouchers. For example, the California Hybrid and Zero-Emission Truck and Bus Voucher
Incentive Project (HVIP) offers $8,000 to $45,000 vouchers (based on Gross Vehicle
Weight Rating) for new medium- and heavy-duty electric vehicle fleets (California
Hybrid Truck & Bus Voucher Incentive Project, 2014).
Incentives for businesses and manufacturers
Some states support electric vehicle businesses and manufacturers by providing incentives to expedite the development and encourage the manufacture of electric vehicles.
Some of these incentives are specifically for electric vehicle manufacturers, while others
are for alternative energy technology and manufacture generally. They come in various
forms, for example, job creation tax credits based on employee number, tax credits
based on the number of vehicles manufactured, grants, and reduced taxable fair market
value of manufacturing machinery and equipment. Other states offer incentives for
businesses to offer workplace charging equipment.
Research and development (R&D)
States offer various forms of incentives for R&D of electric vehicles, including grants
and loans. Some of these incentives are specifically for electric vehicles, while most are
for AFVs or more general programs supporting transportation technologies. Examples
include a tax credit for 10% of qualified research expenses in Wisconsin, New York’s
Transportation Research and Development Funding, and Indiana’s Vehicle Research and
Development Grants (AFDC, 2014c). California’s Alternative and Renewable Fuel and
Vehicle Technology Program supports both R&D and commercialization.
Insurance discounts and protections
Several insurance providers in California offer a discount on insurance coverage for
electric vehicle owners. For example, Farmers Insurance provides a discount of up
to 10% on all major insurance coverage for hybrid electric vehicle and AFV owners
(AFDC, 2014c).
7
STATE-LEVEL U.S. ELECTRIC-VEHICLE INCENTIVES
Others
State governments offer some incentives that are not captured in the categories above.
For example, Delaware provides a vehicle-to-grid energy credit in which retail customers
can receive electricity credits for energy discharged from an electric vehicle battery to
the grid at the same rate that the customer pays to charge the battery (AFDC, 2014c).
As another example, in D.C., some certified clean fuel vehicles are exempt from measures
that restrict vehicle usage based on temporal considerations, such as time-of-day and
day-of-week restrictions and commercial vehicle bans (AFDC, 2014c).
8
ICCT WHITE PAPER
METHODOLOGY TO QUANTIFY ELECTRIC
VEHICLE POLICY BENEFITS
This section describes our approach to quantify the benefits to consumers from the
electric vehicle incentives described in the previous section. First, we monetize the
direct incentives by evaluating the ‘effective’ benefit available to consumers—for
example, if a state covers 50% of the cost of a home charger installation, the effective
benefit is equal to half the cost of a typical home charger. Second, indirect incentives are
monetized based on the type of benefit provided to consumers, which is assumed to be
time savings for HOV lane access and emissions testing exemptions and avoidance of
rental car cost for public charger availability. Benefits are calculated over the duration of
ownership of the vehicle; this is assumed to be six years based on the average length of
time a new vehicle is retained by the purchaser (Polk, 2012).
Purchase subsidies, home Level 2 charger subsidies and one-time registration fee
reductions are all assumed to be upfront benefits, with the value of the benefit realized
at the time of purchase. Benefits from annual registration fees, annual license fees,
annual or biennial emission test fees, free parking, HOV lane access, and the value of
public charger availability are summed over a period of six years, assuming a discount
rate of 5% per year for future-year benefits. The value of free electricity at public Level 2
chargers is not discounted as it is assumed that electricity prices increase over time at a
rate comparable to the discount rate (actual electricity rate increases have been1.4% to
3.1% per year in recent years (U.S. Energy Information Administration (US EIA), 2014)).
ELECTRIC VEHICLE SALES DATA
The sales dataset used in this study was purchased from IHS, and includes electric
vehicle regulations by make and model in each state in 2013. We assume new vehicle
registrations as being approximately equivalent to, and synonymous with, vehicle sales
over 2013.
DIRECT INCENTIVES
Purchase subsidies
Purchase subsidies include rebates and tax credits, including income tax credits and
sales tax exemptions. The subsidies in four states, Colorado, Maryland, Pennsylvania, and
South Carolina depend on battery capacity. These credits can be very different for the
Prius Plug-in and the Chevrolet Volt, for example. For these states, the level of subsidies
is calculated based on a sales-weighted average. The majority of the sales in three of the
four states (Colorado, Pennsylvania, and South Carolina) are the Volt. The average subsidies for the Volt and Prius Plug-in, respectively, are $2,516 and $891 in these four states.
Several states require that a comparable conventional non-electric vehicle be used to
estimate the level of subsidy. When a counterpart conventional vehicle is required for
calculation of subsidy value, the Nissan Sentra is used. This is determined to be the most
similar Nissan vehicle model to the LEAF (see 1.1.1A.1.1Table 2). 2013 models are used in
all cases. For example, the excise tax for conventional vehicles in D.C. is calculated based
on fair market value, which depends on gross vehicle weight; in this case, the value of
D.C.’s excise tax exemption for electric vehicles is calculated as the excise tax that would
be levied on a Nissan Sentra. When the incentive covers a percentage of the cost with a
cap, the lesser of these values is used.
9
STATE-LEVEL U.S. ELECTRIC-VEHICLE INCENTIVES
Table 2. Characteristics of the Nissan LEAF and Sentra
Characteristic
Leaf
Sentra
Length (in)
175.0
182.1
Internal volume (ft3)
116.4
111.0
Horsepower
107
130
Torque
187
128
Time from 0–60 mph
10.2
9.1
Sources: Edmunds (2014a,b), zeroto60times (2014), Plug-in Cars (2014)
License tax/fee reductions
Generally, states reduce the license fee by a certain amount for electric vehicle owners
in one or several registration periods. For reductions in first time registration fees such
as in D.C., the monetary value of the fee is assumed to be a direct, one-time benefit
to electric vehicle owners. For reductions in recurring registration fees, for example
in Illinois, the value is discounted accordingly. In Arizona the reduction in license tax
for AFVs (including BEVs but not PHEVs) is proportional to the tax for conventional
vehicles; here the benefit is calculated as the difference in the total license tax over
the average length of ownership time (6 years) between a BEV and its counterpart
conventional vehicle.
EVSE financing
Typical costs of chargers are taken as the averages of the ranges given in a study by the
Rocky Mountain Institute (Agenbroad & Holland, 2014). This study includes the cost of
charging station hardware and installation cost, including other materials, labor, mobilization, and permitting. The average cost of a Level 2 public station is derived from the
average costs of curbside and parking garage single stations. The total installed retail
cost of a Level 2 home charger, a Level 2 public charger, and a DCFC are estimated to be
$1,175, $7,250, and $54,900, respectively. The actual costs of chargers vary depending
on specific charger types and labor cost.
A) HOME CHARGERS
If a state only provides a certain amount of subsidy for home chargers, then that amount
is used as the benefit. If a state covers a percentage of the cost without a cap, then
the benefit is calculated by multiplying this percentage by the typical cost of a home
charger. Most state incentives cover a certain percentage of the cost up to a cap. In this
case, the benefit is calculated as the lesser of the cap or the percentage multiplied by
the typical cost of a home charger.
California survey results are used to estimate the percentage of BEV and PHEV owners
who install a home charger. According to CA PEV driver survey results (CCSE, 2013),
90% of all respondents installed a home Level 2 charger. This analysis implicitly assumes that electric vehicle owners would purchase a home charger regardless of the
availability of state funding, due to their particular driving habits and preferences. In
order to calculate the benefit of home charger subsidies for BEV and PHEV owners
separately, it is necessary to estimate the percentage of owners installing home
chargers for each vehicle type. 97% of respondents of the CA PEV survey were Nissan
LEAF owners and we assume the remaining 3% were mainly Volt owners, since the
survey was performed in 2012. 47% of Volt owners installed a home charger according
10
ICCT WHITE PAPER
to Tal, et al (2013). The percentage of Nissan LEAF owners that installed a Level 2
home charger is thus calculated by the following equation, yielding an estimate of 91%:
PLEAF_hc = (Phc - Pvolt x Pvolt_hc)/ PLEAF
Where
PLEAF_hc = percentage of Nissan LEAF owners that installed a Level 2 home charger
Phc = percentage of respondents of CA PEV survey that installed a home charger
Pvolt = percentage of respondents that are Volt owners
Pvolt_hc = percentage of Volt owners that installed a home charger
PLEAF = percentage of respondents that are LEAF owners
Average benefits to BEV owners and PHEV owners are derived by multiplying the effective
home charger subsidies by the percentage of BEV or PHEV owners who installed a home
charger respectively. For example, if a state provides an effective home charger subsidy of
$100, the average benefit to BEV and PHEV owners would be $91 and $47 respectively.
B) PUBLIC CHARGERS
The benefits of publicly available chargers to consumers are in providing range confidence and free electricity (discussed below). Both factors are related to the number of
public chargers for which that the state provides funding. This subsection details the
calculation of the ‘effective number’ of public chargers funded by the state. If a state
fully funds a specific number of stations, that number is used. In some cases the state
incentive covers some but not all of the cost of the installation of a publicly available
charger—the remainder of the cost may be covered by businesses, city governments,
or other non-state entities. As such, only the fraction of the charger cost paid by the
state government is attributed to the state in this analysis. For these cases, the effective
number of public chargers that the state funded is calculated as:
Ne_sps = Nsps x (Aa / Ct)
Where
Ne_sps = effective number of public stations funded by the state
Nsps = number of public stations funded by the state
Aa = award amount
Ct = total project cost
This last term is essentially the percentage of the cost that the state funded. If the total
project cost is not given, an estimate is derived from the typical cost of a station. Some
states cover a percentage of the cost of the station up to a cap. This is treated the same
as in the case of home chargers. In some cases, the number of stations funded by the
state in 2013 alone is sometimes not given, and is estimated by multiplying by the total
number of public stations in that state by the fraction of state-funded public stations
that were installed in 2013. Although consumers benefit from chargers installed before
the year 2013, these were not included in this analysis because we estimate the benefit
of state funding for electric vehicles in the year 2013 only. This latter term is estimated
from data on chargers installed per year available for Illinois’s incentive program, and the
total number of public stations in that state is taken from the AFDC database. Calculations above apply to both public Level 2 and DCFC stations.
11
STATE-LEVEL U.S. ELECTRIC-VEHICLE INCENTIVES
Free electricity
As discussed in the section on electric vehicle incentives at the state level, most public
Level 2 stations are free as of 2013, especially public meters and state/city owned
stations. We assume 80% of public Level 2 stations are free, and will continue to be free
for at least three years for all states. The monetary value of free electricity is calculated
by estimating the amount of electricity used per vehicle owner per year (from average
numbers of charging events and average amount of energy used per event for BEV and
PHEV owners separately). We use data on the charging patterns of LEAF and Volt owners collected by the EV project to estimate charging frequency and energy consumption
of BEV and PHEV owners. The equation for calculating the benefit of free electricity is:
Be = Nce x PL2 x Ev x Re x D x Pfs x Y x (NsL2/NL2)
Where
Be = benefit of free electricity for electric vehicle owner
Nce = average number of charging events per day
PL2 = percentage charging events at public Level 2 chargers
Ev = average energy charged per event
Re = electricity rates
D = days per year (365)
Pfs = percentage of stations that are free
Y = years of free charging
NsL2 = number of state-funded public Level 2 stations
NL2 = number of all public Level 2 stations
The first three terms of the equation are different for BEV and PHEV owners (Schey,
2013; U.S. DOE, 2013a,b). Due to restrictions on data availability, the average energy
charged per event at public chargers and the proportion of total charging events per
kWh that occurs by LEAFs versus Volts are calculated from other data given in EV
Project reports (Schey, 2013; U.S. DOE, 2013a,b). The average energy per event at public
chargers for BEV owners specifically is calculated as:
Ev_BEV = kWhv x Pv/kWh x PkWh_BEV
Where:
Ev_BEV = average energy charged per event at public chargers for BEV owners (kWh)
kWhv = energy consumed per public charging event in kWh
Pv/kWh = proportion of charging events per kWh by LEAFs and Volts
PkWh_BEV = percentage of all kWh consumed at public stations by BEV owners
And where:
Pv/kWh = (Pv_BEV + Pv_PHEV) / [(Pv_BEV x PkWh_BEV) + (Pv_PHEV x PkWh_PHEV)]
Pv/kWh = proportion of charging events per kWh by LEAFs and Volts
Pv_BEV = percentage of all charging events at public stations by BEV owners
Pv_PHEV = percentage of all events at public stations by PHEV owners
Pv_BEV = percentage of all charging events at public stations by BEV owners
12
ICCT WHITE PAPER
PkWh_BEV = percentage of kWh consumed at public stations charged by BEV owners
Pv_PHEV = percentage of all charging events at public stations by PHEV owners
PkWh_PHEV = percentage of kWh consumed at public stations by PHEV owners
To calculate the benefit of free electricity for PHEV owners, the relevant terms in the
equation are substituted with PHEV-specific data. This benefit is not discounted as
mentioned before because the electricity rate is assumed to increase over time.
Free parking
Two states, Hawaii and Nevada, offer free parking to electric vehicles. For both states,
we assume that parking is a real benefit only in major population centers and urban
areas, which are Oahu and Hawaii Island in Hawaii, and Las Vegas and Reno in Nevada.
The weighted hourly parking rate for a state is derived by multiplying the typical hourly
rate in each urban area (i.e., county or city) by the percentage of the state’s population
that resides in that area, and summing the contribution of all areas. For example, the
typical hourly rates in Oahu and Hawaii islands are $1 and $0.5 respectively, and their
populations are 72% and 12% of the total population in Hawaii. The weighted hourly
parking rate for the state would thus be $0.78 (i.e., $1 x 72% + $0.5 x 12%).
The typical rate at meters or municipal parking lots is used to represent the hourly
rate of parking in each area (Parkopedia, 2014; Downtown parking finder, 2014; Hawaii
Department of Accounting and General Services, 2014; Lee, 2013). State population and
area population data are taken from the U.S. Census Bureau (U.S. Census Bureau, 2014).
An assumption is made that an average electric vehicle owner would park at meters
or municipal parking lot for 5 hours per week, and this is used to calculate the total
monetary benefit of free parking to an electric vehicle owner in a year. This assumption
is roughly consistent with survey results showing that 21% of Honolulu residents and
10% of Hawaii Island residents pay for parking at work or school (Coffman & Flachsbart,
2009). This value is discounted in the 5 years following the year of the vehicle purchase
and summed to give the total monetary benefit over the length of time of ownership.
Emission test exemption
In some states, electric vehicles are exempted from the compulsory emissions testing
required for most conventional vehicles, saving both money from the test fee and
time spent during testing (time savings is discussed under Indirect incentives below).
This benefit is not taken into account for states that do not require emissions testing
for any vehicle. We use the typical fee (DMV.ORG, 2014) or the maximum fee of an
emission inspection as the fiscal value of this benefit per electric vehicle owner for the
first year. A few states do not require emissions testing for any new vehicles for the
first few years; this exemption for new conventional (i.e., non-electric) vehicles in these
cases is not considered in this analysis. Some states only require emission testing in
some counties, which usually include major metropolitan areas. In this case, we multiplied the emissions test fee by the percentage of the state’s population that is urban
(U.S. Census Bureau, 2011) to approximate the percentage of drivers who reside in
areas requiring emissions testing. Examples are Colorado and Pennsylvania. Emissions
tests are generally required either annually or biennially, and testing fees after the year
of purchase are discounted accordingly.
13
STATE-LEVEL U.S. ELECTRIC-VEHICLE INCENTIVES
INDIRECT INCENTIVES
Carpool lane access
The main benefit of carpool lane access for electric vehicles is time savings, as carpool,
or HOV, lanes are typically less congested than non-HOV lanes on similar routes, and
thus allow reduced commute time. The value of the effective benefit of access to the
carpool lane for a single-occupancy electric vehicle user varies greatly. This benefit
is approximated for each state offering carpool lane access incentives based on factors including states’ overall congestion, population in applicable metropolitan areas,
availability of carpool lanes, and the relative relief offered for use of the HOV lanes.
Congestion cost estimates by city were used to estimate the cost of time spent in traffic
and thus the monetary benefit of time savings. In some cities with several HOV lanes on
key congested routes, HOV access may alleviate a large fraction of a typical commuter’s
congestion cost, while in others with few or poorly placed HOV routes, this benefit may
not be as important. In order to account for this, we estimate the percent of congestion
avoided through HOV access. We also consider the percentage of each state’s population that resides in metropolitan areas with HOV lanes and may thus benefit from HOV
access. The benefit per consumer of HOV access is calculated based on the equation:
VHOV = sum across cities [(Pt x (POPm / POPs)] x Cc x Pr
Where:
VHOV = value of HOV lane access for electric vehicles
Pt = percent traffic alleviated by HOV access
POPm = metropolitan population
POPs = state population
Cc = congestion cost
Pr = percent HOV relief
Percent traffic alleviated by HOV access is estimated as the percent of congested
highways in a metropolitan region that have HOV lanes. This is roughly calculated as the
number of roads with HOV lanes that had significant traffic during the weekday morning
rush hour divided by the total number of state and interstate highways with significant
traffic in the metropolitan region. Congestion cost is taken from TTI’s Urban Mobility Report (Schrank et al, 2012), which is based on time spent in traffic in each city and other
factors. Percent HOV relief is an rough approximation factor that is included to account
for the fact that only some fraction of congestion during an average commute occurs
on highways and may thus be relieved by HOV lane access (i.e. drivers may experience
congestion on smaller roads that were not included in the analysis). We apply a 50%
HOV relief factor in this analysis.
Our approach for estimating the percent of traffic alleviated by HOV access is as follows.
First, we take Google map traffic images of each city during rush hour (8:30–9am local)
on five separate weekdays. Second, the number of HOV routes in the metropolitan
region with at least 25% traffic is counted, indicated by yellow or red sections on Google
maps. Then, the number of interstate and state highways in the metropolitan region with
at least 25% congestion is counted. Last, we divide the number of congested HOV roads
by the total number of congested highways in a metropolitan area, which gives us the
percentage of traffic alleviated by HOV access.
14
ICCT WHITE PAPER
For California, extremely short HOV lanes (i.e., those less than 5 miles) are excluded. Ten
percent toll discounts during off-peak hours on the New Jersey Turnpike and New York
State Thruway were also excluded since these discounts are small and variable (depending on travel length) and these routes appear to have low travel volume compared
to most HOV lanes analyzed here. Plate and sticker fees are subtracted from the final
benefit of HOV lane access (discounted if they are annual fees).
We compared the benefit calculated with this approach to results with other estimates
of the value of HOV access in California. In California, a hybrid vehicle with a HOV sticker
was worth about $1,200 more than one without a sticker in 2009 (Blanco, 2009), which
is equivalent to about $1,300 in 2013 dollars according to the U.S. Bureau of Labor
Statistics CPI inflation calculator. In our analysis, we calculate the HOV lane access
benefit to be around $1,400 for a 6-year period in California; this monetary benefit is
very similar to the $1,300 price premium of hybrid with a HOV sticker. We also calculate
the value of HOT access based on HOT lane toll rates in California and Florida, and these
values are within 5% difference of our results on average.
Emissions testing exemption time savings
Here, the benefit of time savings is essentially the value of the time saved that is not
required for the emissions tests. According to the U.S. Department of Transportation
guidance (U.S. DOT, 2011), the recommended hourly values of surface modes travel time
savings is $12.50 for all purpose local travel and $18.00 for all purpose intercity travel.
The average is $15.25 in 2009 dollars per person-hour, which is $16.6 in 2013 dollars; this
value is used here. We assume that the time savings of an emission testing exemption is
half an hour, which results in a $8.30 monetary value for an emissions testing exemption.
This value is discounted for years after the year of purchase. Unlike the direct benefit of
emissions testing exemption, this indirect benefit also applies to states like New Jersey
and Ohio, which offer free inspections.
Different people value their time differently. While it may be true that BEV/PHEV buyers
have generally higher income than average at present, and their time may be deemed
more valuable, we did not attempt to account for this in this analysis, instead opting to
value all motorists time consistently, as described above. We note though that this approach is more conservative in approximating a lower monetary benefit than assuming a
higher-than-average value of time.
Public charger availability
The value of increased range confidence from increased electric charger availability is
approximated for BEVs but not for PHEVs. As PHEVs may refuel at conventional gasoline
stations, it is assumed that PHEV drivers do not experience range anxiety.
Deployment of public chargers to improve range confidence reduces the probability that
daily travel could exceed the effective range of the vehicle. The benefit for the median
driver under ideal charger availability is adjusted from a study that calculated days of
insufficient range of EVs based on BEV drivers’ daily travel distance distributions from
National Household Travel Survey 2001 data (Lin & Greene, 2011). This study also gave a
monetary value for range confidence by assuming a $15 penalty per day of insufficient
range. The upper bound of this daily penalty is the daily rate of a rental car based on
the assumption that a BEV driver must rent a higher-range vehicle on days of insufficient range. The monetary value for median BEV drivers with a 100-mile range vehicle
(representing a Nissan LEAF) in this study is for 10 years with a discount rate of 7%. We
15
STATE-LEVEL U.S. ELECTRIC-VEHICLE INCENTIVES
adjusted the results of Lin & Greene to match our assumptions for vehicle retention and
discount rate, and adjusted for the actual average cost of a car rental in the U.S of $51.08
per day (Auto Rental News, 2014). The value of range confidence given in Lin & Greene
is based on ideal charger availability, meaning that a BEV owner can charge whenever
and wherever needed. As state incentives for publicly available chargers only partially
meet this need, the effective number of public chargers supported by state incentives
is divided by the number of gasoline stations available in a state. This assumption could
underestimate the benefit of charger availability as actual gasoline station availability
may exceed ‘ideal availability’ in many locations. Public Level 2 chargers and DCFCs are
both included in this analysis. The benefit is summed over 6 years and discounted for
years after the year of purchase.
The calculation of this benefit is based on the equation:
Brc = Bmed x (Nsps / Ng)
Where:
Brc = benefit of range confidence for electric vehicle owners in the first year
Bmed = benefit for median driver under ideal charger availability
Nsps = number of state-funded stations
Ng = number of gasoline stations in the state
DISINCENTIVES
Annual electric vehicle fee
This term is negative in the benefit analysis since it is a fee paid specifically by electric
vehicle owners and not by non-electric vehicle owners. States that imposed a fee on electric
vehicles in 2013 include Nebraska ($75), Virginia ($64) and Washington ($100, only applies
to BEVs). These values are discounted in future years and summed over 6 years.
BENEFIT-COST RATIO OF INCENTIVES
Here, the benefit that each incentive provides to consumers is compared to the incentive’s cost to the state. This benefit-cost ratio only includes the consumer benefits
described above, and does not account for externalities such as health benefits and
environmental benefits that electric vehicles provide to society as a whole.
The cost to the state of implementing each incentive is estimated on a per-consumer
basis. For direct incentives, the cost is assumed to be equal to the benefit to consumers—for example, awarding a $2,500 rebate to an electric vehicle consumer costs the
state of California $2,500. The cost of indirect incentives is detailed below.
The cost of HOV lanes per consumer is calculated by spreading the cost of constructing
HOV lanes over the total number of people with access (including both electric vehicle
owners and conventional vehicle owners who carpool), following the equation:
CHOV= Cconstx MHOV / {[NEV+ (Nvx Pcp)] x Pb} / (Yhwy / Yvo)
Where:
CHOV = cost of HOV lanes
Cconst = cost of HOV lane construction
16
ICCT WHITE PAPER
MHOV = HOV lane miles in a state
NEV = total number of electric vehicles
Nv = total number of vehicles
Pcp = percentage of all commuters that carpool
Pb = percentage of all commuters that benefit from HOV lanes
Yhwy = lifetime of the highway
Yvo = length of vehicle ownership
And where the percentage of commuters that benefit from HOV lanes is defined as:
Pb = Ppc x Pt x (POPm / POPs) x Pr
Where:
Pb = percent age of all commuters that benefit from HOV lanes
Ppc = percentage of people who commute by private car
Pt = percent traffic alleviated by HOV access
POPm = metropolitan population
POPs = state population
Pr = percent HOV relief
HOV lanes are generally newly constructed. California and North Carolina explicitly state
that “regular mixed-flow lanes are never converted to HOV lanes. Rather, HOV lanes are
always added to existing facilities” (CA DOT, 2014; NC DOT, 2014). Simply converting
existing general traffic lanes to HOV lanes would result in greater congestion for the remaining general traffic lanes. Therefore, we assume new construction for HOV lanes in all
states here. One study (Railstotrails, 2008) summarizes the cost of adding a single lane
to an existing highway based on a 2003 FHWA study. The model in this study assumes
higher construction costs in areas where widening might be especially difficult or costly,
such as densely developed urban areas or environmentally sensitive rural areas. These
‘high cost lanes’ can cost from $7.3 million to $15.4 million per lane-mile for construction
in urban areas and from $5.8 million to $9.9 million per lane-mile in rural areas. Since
our analysis is focused on HOVs in major metropolitan areas, the average cost of these
‘high cost lanes’, which is $9.6m per lane-mile, is used as the cost of constructing HOV
lanes. Actual cost of a project varies depending on geographic location, terrain type,
development type, and other factors. For example, the SR 16 HOV lane improvements in
WA cost $3.1m per lane mile, while the I-5 Tacoma HOV lane cost $14.5m per lane mile
(WA DOT, 2014). In addition, only the initial construction cost is assumed here; maintenance and other improvement cost are not included. Data on HOV lane miles in a state
are largely taken from state and federal government websites.
As detailed above, the total number of electric vehicles in each state is calculated
based on the percent of all electric vehicles rebates that were claimed in 2013 in
California (CVRP rebate data). The total number of vehicles is calculated as vehicle
registrations in 2009 (U.S. Federal Highway Administration, 2011) multiplied by average vehicle survivability, which is 13 years (Lu, 2006). The percent of Americans who
carpool (Statisticbrain, 2014), which is 10%, is assumed to be the percent of total
vehicles using HOV lanes. A 30-year lifetime of a highway is assumed, and the length
of vehicle ownership is 6 years.
17
STATE-LEVEL U.S. ELECTRIC-VEHICLE INCENTIVES
We make several other notes regarding our benefit-cost assessment. The percentage
of people who drive to work is the sum of the percentage of people who drive to work
solo and those who carpool (Statisticbrain, 2014); this totals 88%. The other three terms
in the equation are detailed above for the HOV benefit analysis, and the average values
of all the states that offer this benefit are used here. The cost of chargers is based on
the number of effective chargers funded by a state multiplied by the typical cost of a
charger. The cost of free electricity is assumed to be half the benefit of free electricity,
as some state-funded stations were installed on private properties and thus the cost
of free electricity is borne by the private property owner. The cost of emissions testing
exemptions to the state is assumed to be zero because the testing fee is typically paid
to an independent party. Because the benefit-to-cost ratio of this incentive would be
infinite, it is not reported in the results section.
18
ICCT WHITE PAPER
ANALYSIS OF THE IMPACT OF
STATE-LEVEL INCENTIVES
This section includes descriptive results from the previous section, including quantification of the direct and indirect benefits of electric vehicle promotion policies across
the states. In addition, here the electric vehicle policy and electric vehicle sales data
are analyzed for statistical correlations in order to discern the relative impact of the
consumer incentive. Finally we provide a basic, first-order benefit-cost analysis of the
electric vehicle incentives to provide a measure of the relative cost-effectiveness of the
various policies.
VARIATION IN STATE ELECTRIC VEHICLE INCENTIVES
Figure 1 shows the total benefit and electric vehicle sales share for the top 10 states by
monetized incentives compared to the U.S. average for BEVs and PHEVs, broken down
by incentive type. Some states incentivize both BEVs and PHEVs heavily, and we can see
these appear in both top 10 lists: Colorado, California, Louisiana, Illinois, Hawaii, Pennsylvania and South Carolina. There is a large range in the magnitude of total benefits even
within the top 10: the highest ranking state (Colorado) provides about three times the
total benefit as the 10th state for BEVs, and about five times for PHEVs. The composition
of incentives varies substantially across states. For most states, the majority of the monetary benefit is in subsidies. Some states show a more balanced combination of different
incentives (e.g. California), whereas states like Hawaii or New Jersey are dominated by
one or two kinds of incentives. Arizona and Hawaii do not have subsidies but still make it
to the top 10 list by offering combinations of incentives.
19
STATE-LEVEL U.S. ELECTRIC-VEHICLE INCENTIVES
1.0%
4000
0.8%
3000
0.6%
2000
0.4%
1000
0.2%
0
0.0%
C
ol
or
ad
o
New vehicle share
5000
H
aw
ai
Pe
i
nn
sy
lv
an
ia
N
ew
Je
rs
So
ey
ut
h
C
ar
ol
in
a
A
riz
on
a
U
.S
.a
ve
ra
ge
1.2%
Ill
in
oi
s
6000
G
eo
rg
ia
C
al
ifo
rn
ia
Lo
ui
si
an
a
Consumer benefit ($)
BATTERY ELECTRIC VEHICLE
PLUG-IN HYBRID ELECTRIC VEHICLE
1.4%
5000
1.0%
3000
0.8%
0.6%
2000
0.4%
1000
New vehicle share
Consumer benefit ($)
1.2%
4000
0.2%
0
Emission test exemption
Annual fee
ge
d
ra
ve
.a
.S
U
M
ar
yl
n
to
ng
hi
Carpool
Subsidies
an
C
D
in
ol
ar
W
as
So
u
th
C
sy
nn
Pe
a
a
va
to
ng
hi
W
as
Free parking
License fee reduction
ni
n
i
ai
aw
H
rn
ifo
al
C
Lo
ui
si
an
ia
a
s
oi
in
Ill
C
ol
or
ad
o
0.0%
Public charger
Home charger
New vehicle share (right axis)
Figure 1. Consumer benefit and new vehicle share for U.S. states with largest total battery electric and
plug-in hybrid electric incentives (2013 electric vehicle registration data provided by IHS Automotive).
Figure 2 shows the total benefit and electric vehicle sales share for the ten states with
the highest sales share of BEVs and PHEVs. Some states show high BEV and PHEV sales
shares and high consumer benefits from state-level policies. However, it is also apparent
from this figure that some states have achieved high electric vehicle sales without offering the types of incentives included in this analysis. For example, for BEVs, Oregon in
particular has a relatively high sales share (over 0.8%) while providing very little benefit to
prospective electric vehicle consumers based on the policies analyzed here. For PHEVs, as
shown in the figure, there are several states that are achieving relatively high sales shares
with relatively little consumer benefits from the policies analyzed here. Four states ranking in the top ten for PHEV sales shares offer none of the consumer incentives analyzed
20
ICCT WHITE PAPER
here. Especially high BEV sales are seen in five states (i.e., Washington, California, Hawaii,
Georgia, and Oregon), while four of the states in the top ten for BEV share are actually
below the national average in sales. The distribution of PHEV sale shares in the top-ten
states, apart from high sales in California and Vermont, is more even across the states.
4000
1.0%
3000
0.8%
2000
0.6%
1000
0.4%
0
0.2%
ge
ra
oi
.S
.a
Ill
ve
in
ut
0.0%
U
C
on
ne
ne
ct
ss
ic
h
ta
Te
n
ad
or
ol
C
U
o
n
go
re
O
eo
rg
ai
G
H
aw
rn
ifo
al
W
as
hi
ng
to
n
-1000
New vehicle share
1.2%
s
5000
ee
1.4%
ia
6000
i
1.6%
ia
7000
C
Consumer benefit ($)
BATTERY ELECTRIC VEHICLE
1.4%
3000
1.2%
2500
1.0%
2000
0.8%
1500
0.6%
1000
New vehicle share
3500
0.4%
500
0.2%
-500
0.0%
O
re
go
n
M
ic
hi
ga
n
W
as
hi
ng
to
C
n
on
ne
ct
ic
ut
D
el
aw
ar
e
Emission test exemption
Annual fee
Free parking
License fee reduction
Carpool
Subsidies
M
ai
ne
M
as
sa
ch
us
et
ts
H
aw
ai
U
i
.S
.a
ve
ra
ge
0
C
al
ifo
rn
ia
V
er
m
on
t
Consumer benefit ($)
PLUG-IN HYBRID ELECTRIC VEHICLE
Public charger
Home charger
New vehicle share (right axis)
Figure 2. Consumer benefit and new vehicle share for U.S. states with largest total new battery
electric and plug-in hybrid electric vehicle shares (2013 electric vehicle registration data provided
by IHS Automotive).
21
STATE-LEVEL U.S. ELECTRIC-VEHICLE INCENTIVES
Some states that offer high incentives see a larger sales share in sales of electric vehicles
than other states. For BEVs, 5 out of the top 10 states are also among the top 10 for sales
share (California, Hawaii, Georgia, Colorado and Illinois). For PHEVs, 3 out of the top 10 are
among the top 10 for sales share (California, Washington and Maryland). The average sales
share of states that have a total benefit more than the national average is 0.51%, and that
of states that have a total benefit less than the national average is 0.08%. Figure 3 shows
the sales share by total benefit for all states and D.C. Negative benefit values are the result
of an annual fee. We see high scatter in the relationship between incentives and sales
share. For BEVs, there is a general trend of states that offer a higher total level of benefits
exhibiting a higher electric vehicle sale share, but for PHEVs there is not such a clear-cut
relationship. As shown in the figure, there are three states for which BEV sales stand out
at above 0.8%; these are California, Hawaii, and Georgia. The one state with greater than a
1% PHEV sales share is California, which may be due to that state’s Zero Emissions Vehicle
program and other state incentives we were not able to capture in the benefit analysis.
BATTERY ELECTRIC VEHICLE
1.60%
1.40%
New vehicle share
1.20%
1.00%
0.80%
0.60%
0.40%
0.20%
0.00%
-1000
0
1000
2000
3000
4000
5000
6000
5000
6000
7000
Consumer benefit ($)
PLUG-IN HYBRID ELECTRIC VEHICLE
1.40%
1.20%
New vehicle share
1.00%
0.80%
0.60%
0.40%
0.20%
0.00%
-1000
0
1000
2000
3000
4000
Consumer benefit ($)
Figure 3. New vehicle share by total available incentive benefit for all states and D.C. for BEVs and
PHEVs (2013 electric vehicle registration data provided by IHS Automotive).
22
ICCT WHITE PAPER
STATISTICAL ANALYSIS OF IMPACT OF POLICIES ON ELECTRIC
VEHICLE SALES SHARE
A statistical analysis is conducted using stepwise regressions to test the relationship
between electric vehicle sales and total benefit for BEVs and PHEVs. A stepwise
regression is a bidirectional selection process of building a model by successively
adding or removing variables. The selection process starts by adding the variable with
the largest explanatory value in the model, according to its t-statistic. Other variables
are successively added into the regression; at each step the variable with the strongest
effect (lowest p-value) is retained. At each step after the third variable is added, the
significance of each previously added variable is evaluated. If their contributions to
the model become insignificant (p-value >0.05), the variable with the weakest effect
(highest p-value) is removed. The procedure continues until no more variables can be
added or removed. The threshold for significance is p < 0.05 in this analysis. Multicollinearity was not detected in either regression.
Stepwise regression analysis is performed for BEV and PHEV sales, separately. Two
control variables, total vehicle sales and the percentage of residents with an income
over $100,000 in each state (U.S. Census Bureau, 2011) are included in the regression
to separate the influence of these variables on electric vehicle sales from the effect of
incentives on BEV and PHEV sales. As the benefit and sales datasets are both skewed
with values clustered near zero, all variables in the analysis are logged (base 10) to
provide an even distribution.
The results of the stepwise regression analyses indicate that total monetary benefit
available to BEV owners is significantly positively correlated with BEV sales, but that
PHEV benefit is not correlated with PHEV sales. The following discussion focuses on
the results for the BEV regression only. Table 3 summarizes the results of this stepwise
regression. The coefficients in a log-log transformation reflect the percent change in Y
as a result in the percent change in X. In this case, a 10% in the total benefit offered by
a state would increase that state’s electric vehicle sales by around 1.8%. The adjusted
R2 for the regression is 0.773.
Table 3. Results of stepwise regression of BEV sales to total benefits
Coefficient
P value
Intercept
-3.155
< 0.0001
Log (total benefit)
0.185
0.044
Log (total vehicle sales)
0.114
< 0.0001
Log (percent income >$100k)
1.688
< 0.0001
This relationship can be expressed as:
Log(BEV sales) = -3.155 + 0.185 x log(total benefit) + 0.114 x log(total vehicle sales) +
1.688 x log(percent income>$100k)
A second stepwise regression is conducted for the BEV data, breaking the total
benefit apart into eight kinds of incentives (independent variables). The two control
variables described above are included. Again, all variables were logged. The purpose
of this regression is to compare the effectiveness of the different types of incentives in
driving BEV sales.
23
STATE-LEVEL U.S. ELECTRIC-VEHICLE INCENTIVES
The regression results indicate that 5 of the 10 variables are significant: subsidies,
HOV lane access, emissions testing exemption, annual fee, and total vehicle sales. The
adjusted R2 for the regression is 0.668. Figure 4 illustrates the relative magnitude of
the effect of each variable on BEV sales. The higher the absolute value of a coefficient,
the greater impact that variable has on BEV sales. The value is zero for insignificant
variables. Of all the different types of incentives, subsidies contribute the most to BEV
sales share, followed by HOV lane access, emissions testing exemptions and annual
fees. As shown, annual BEV-specific fees have a negative impact on BEV sales, while
all other four variables have a positive impact.
0.5
Subsidies
Annual Fee
Carpool
Emission
exemption
Standardized coefficients
0.4
0.3
0.2
0.1
0
-0.1
-0.2
-0.3
-0.4
Variable
Figure 4. Standardized coefficients of variables in the stepwise regression of BEV registrations to
individual incentives in the 50 states and D.C. Error bars show the 95% confidence interval.
RESULTS FROM BASIC BENEFIT-COST ANALYSIS OF STATE-LEVEL POLICIES.
A basic, first-order benefit-cost analysis is conducted in order to provide a measure
of the relative cost-effectiveness of the various policies. Only the monetized benefit
of each incentive to consumers is considered; environmental, health, and network
benefits to society are not included. Table 4 shows approximations for the benefit-cost
ratio for BEVs and PHEVs. ‘Other direct subsidies’ includes subsidies, registration fee
exemptions, annual license tax/fee exemptions and free parking. Since most emissions
testing is performed by private facilities, emission testing exemptions generally do
not affect the revenue of state governments and are thus not included in the graph.
For BEVs, the benefit of home chargers refers to home charger subsidies, and that of
public chargers includes free electricity and range confidence. For PHEVs, the benefit
is the same as BEVs, excluding range confidence.
As shown in Table 4, for BEVs, the public charger benefit has the highest benefit-cost
ratio (about 2.5), followed by HOV lane access (about 1.2). This is consistent with
the benefit-cost ratio of the I-10 HOV lane, which is estimated to have a benefit-cost
ratio of 1.5 from Puente Ave to Citrus St. (4.1 miles), and of 1.2 from Citrus St. to Route
57 (4.9 miles) (Los Angeles County Metropolitan Transportation Authority, 2014).
For PHEVs, HOV access has the highest benefit/cost ratio, which is about 1.2. Public
chargers have a ratio less than 1 for PHEVs. The largest difference in this benefit-cost
24
ICCT WHITE PAPER
ratio for BEVs and PHEVs is in the approximation of how public charger availability
results in greatly increased range confidence for BEV users and how BEVs consume
more free electricity from public Level 2 chargers than PHEVs. The benefit-cost ratio of
HOV access is estimated to be about the same for BEVs and PHEVs.
Table 4. Ratio of consumer benefit-to-state-cost for major incentive types for BEVs and PHEVs.
Direct subsidies*
Hov lanes
Public chargers
Home chargers
BEVs
1
1.19
2.45
1
PHEVs
1
1.17
0.41
1
* ‘Direct subsidies’ includes subsidies, license tax and fee reduction, and free parking
25
STATE-LEVEL U.S. ELECTRIC-VEHICLE INCENTIVES
DISCUSSION
To the best of our knowledge, this study is the first attempt to monetize and compare
direct and indirect incentives for electric vehicles at the U.S. state level at this level of
detail. States offer a wide range of incentives for BEVs and PHEVs, from direct subsidies
like rebates and tax credits, to indirect benefits like HOV lane access. After monetizing
each of the available incentives, the total level of benefit offered to electric vehicle consumers is found to vary greatly across states. Some of those states offering the highest
incentives to BEV and PHEV owners—notably California, Georgia, and Hawaii—appear to
clearly be effective in driving electric vehicle sales.
Looking closer at the incentives offered in these states tells us about their strategies for
promoting electric drive. For example, the majority of the benefit offered by California
and Georgia is comprised of subsidies and HOV lane access together. Following a slightly
different strategy, Hawaii complements its strong HOV benefit with free and dedicated
parking for electric vehicles, but does not offer direct subsidies like California and Georgia.
Comparing California and states with little EV incentives or sales also helps illustrate
the effect of total electric vehicle incentives on sales. California offers an assortment of
different benefit types, ranking #3 in the total incentive benefit offered to consumers
for BEVs and #4 for PHEVs, and it has the highest electric vehicle sales and sales share
overall. Subsidies and HOV lane access, two major incentives offered in California, have
a higher benefit-cost ratio than some other incentives. In addition, California’s Zero
Emission Vehicle (ZEV) program requires that an increasing share of auto sales be
electric vehicles in that state and this, as well as similar programs in other ZEV-adopting
states, is not included in this analysis. The ZEV program clearly contributes to automakers’ deployment and marketing efforts. On the other hand, Mississippi, Oklahoma, North
Dakota, and Wyoming are examples of states offering nearly no benefits to electric
vehicle owners, and have nearly no EV sales. Whereas California has over 2.4% combined PHEV and BEV sales share, these four low-EV-incentive states each have less than
0.08% combined PHEV and BEV sales share.
Overall, the total monetary benefit to consumers of state incentives is significantly correlated with BEV sales in 2013. In other words, these incentives are effective at driving
BEV sales. While the federal tax credit of $7,500 per vehicle may be thought to be the
major factor in consumer decision making in the U.S., our analysis shows that adding up
the value of all state incentives together can nearly approach this value for the states
that are offering the highest incentives for electric vehicles. Based on this analysis, these
suites of state-level incentives are impacting BEV sales. These results suggest that state
electric vehicle incentives are playing a significant early role in reducing the effective
cost of ownership and driving electric vehicle sales.
Not all types of incentives affect BEV sales equally. A stepwise regression analysis
shows that the most effective incentives are subsidies, HOV lane access, and emissions
testing exemption initiatives. Public charger availability, home charger subsidies, license
fee exemptions, and free parking do not appear to have as strong of an effect on BEV
sales, and imposing an annual fee on BEVs to compensate for the gasoline tax is actually
effective at discouraging EV sales. These results could help explain why, for example,
Nevada ranks lower in BEV sales share than Utah, despite having a similar level of total
benefits; Nevada relies heavily on free parking (an insignificant driver in this analysis),
while Utah offers a purchase subsidy and HOV lane access (significant drivers). However,
26
ICCT WHITE PAPER
caution should be taken in interpreting these specific results. While the correlation
between total benefits and BEV sales is robust, the regression of sales to individual
incentives may be over-fitting our relatively small sample size (51 states) with a high
number of variables. Further, we note that the statistical regressions on the relative
importance of various policies are based on early, very low numbers of electric drive
sales. We note that there are many confounding factors and many other electric vehicle
promotion actions that are also likely to be found to critically important in the years
ahead. Additional analysis would be needed to more conclusively determine the relative
importance of different incentive types.
Overall, total benefit from state incentives is linked with sales, but there are some
outliers to this trend. For example, Washington ranks #1 in sales share, but its total level
of benefits (#11) is not as high as some other states. On the other hand, Colorado tops
the list in total benefits offered is not seeing a such a high electric vehicle sales share
(ranking #6). Louisiana also has high benefits (#4), but its sales share is lower than the
national median. Four areas in particular may help explain why these states deviate from
the trend: (a) year incentives were introduced, (b) demographic variables, (c) other
incentives and actions not included in this analysis, and (d) automaker’s electric vehicle
deployment and marketing plans. Washington is one of the key areas of the EV Project
(a public-private partnership installing home and public electric vehicle chargers in
some areas of the country; EV Project, 2013), which could partially explain high electric
vehicle sales in this state. Not only does the EV Project provide additional benefits
to consumers, but it may help with consumer outreach and education about electric
vehicles in general. Washington also has other incentives, some private or local, that
were not included in this analysis. In Louisiana, demographic factors such as a relatively
rural and politically conservative population could help explain its low electric vehicle
sales share compared to the level of benefits offered. Colorado’s incentives may not
be as well known and established as some other states like California, which has been
publicly supporting electric vehicles with strong outreach efforts for many years.
Georgia serves as an interesting case study because this state offers high incentives for
BEVs (ranking #2), but its PHEV incentives are below the U.S. average. Georgia has an
apparent strategy towards promoting BEVs and not PHEVs, and its sales share of BEVs
versus PHEVs reflects this. Our regression analysis suggests that state-level incentives
are more effective at driving sales of BEVs than PHEVs, so it is possible that even were
Georgia to incentivize PHEVs as heavily as is does BEVs, it would not necessarily see
comparable results. Still, we note that the potential for PHEVs to contribute to state and
national goals of reductions in petroleum consumption and greenhouse gas emissions
should not be ignored. PHEVs contribute greatly to total electric miles driven—for
example, Chevrolet Volts passed the 1 million electric mile mark before Nissan LEAFs did
(Voelcker, 2012a,b), and Volts also appear to be accruing similar electric-powered miles
per month to LEAFs (INL, 2014).
In some cases state benefits for PHEVs depend on battery size, but the effect of this
differential treatment appears to be small. In Colorado, Maryland, Pennsylvania, and
South Carolina, Chevrolet Volts receive a larger subsidy than Prius Plug-ins, and in each
of these states except Maryland, the majority of PHEV sales were Volts. For all other
states and incentive types, PHEVs with different battery sizes are treated the same.
Lastly, we examine the ratio of consumer benefit-to-state-cost of the different types of
incentives. We find that support for public charger installation offers the highest benefit
27
STATE-LEVEL U.S. ELECTRIC-VEHICLE INCENTIVES
to BEV consumers compared to the amount of money it costs the state to implement.
Direct subsidies and HOV lane access availability all have benefit-cost ratios around or
slightly above 1. Comparing the benefit-cost ratios with the importance of each incentive
in driving electric vehicle sales could potentially help states decide where government
spending would be most effective in accelerating electric vehicle adoption. Subsidies,
HOV lane access, and public charger installation for BEVs may offer the greatest
effectiveness per dollar. Offering emissions testing exemptions for electric vehicles
is particularly cost effective for the state, as this incentive typically does not require
any government spending (and has minimal risk, as BEVs have zero and PHEVs low
tailpipe emissions). However, we emphasize that caution should be taken in interpreting
these results of the effectiveness of different incentives before additional research is
conducted. This analysis only considered the benefits to consumers we were able to
approximately monetize. The total benefit to society of promoting electric vehicles is
much higher, as electric vehicles reduce negative externalities that are associated with
conventional vehicles’ impacts on local air pollution, contribution to climate change, and
consumption of petroleum.
28
ICCT WHITE PAPER
CONCLUSIONS
The focus of this study is to help inform on the extent and variation of U.S. state-level
electric vehicle promotion policies and to analyze the impact of those policies on
electric vehicle sales. The findings clearly indicate how states are offering a wide
variety of incentives to accelerate electric vehicle adoption. We found a positive
correlation between the total level of benefits from state-level incentives for battery
electric vehicles and registrations of these vehicles, and we sought to further assess this
relationship by comparing the effectiveness and benefit-cost ratio of different types of
electric vehicle incentives. Three main conclusions are drawn from this study.
Conclusion 1: State electric vehicle incentives are playing a significant early role in
reducing the effective cost of ownership and driving electric vehicle sales. Some of the
states with the largest electric vehicle incentives—California, Georgia, Hawaii, Oregon,
and Washington—have electric vehicle sales shares that are approximately 2–4 times
the national average. The statistical regression findings reveal that the total monetary
benefit to consumers from state incentives significantly positively correlates with BEV
sales. These findings suggest that future state efforts to incentivize BEV sales through
incentives that substantially drive down the total cost of owning and operating electric
vehicles are likely to be effective.
Conclusion 2: Some types of incentives appear to be more effective in driving electric
vehicle sales than others. Based on this novel quantification of many state-level policies,
it appears that not all types of incentives affect BEV sales equally. A stepwise regression
analysis shows that the most effective incentives are subsidies, carpool lane access, and
emissions testing exemptions initiatives. In addition, a basic benefit-to-cost analysis
that compares an incentive’s benefit to consumers to state spending shows that public
charger availability is an especially cost-effective incentive for BEV owners, and carpool
lane access is cost effective for electric vehicle owners.
Conclusion 3: Further research is needed to more deeply analyze the impact of other
factors on electric vehicle sales. As we show, some state governments offer a wide variety
of incentives to electric vehicle consumers, while others have few or no incentives at all, and
electric vehicle deployment ranges widely across states. In these early days of automakers
introducing new electric vehicles and governments implementing electric vehicle promotion
policies, there are still more unknowns than knowns. Many factors remain outside the scope
of this state-level assessment. Examples of electric vehicle promotion actions that we did
not include are those related to R&D programs, fleet-specific policy, vehicle regulations,
low-carbon fuel policy, zero emission vehicle programs, as well as incentives offered by
cities, utilities, workplaces, automakers, and insurance companies. Tracking how the level of
automaker marketing activity or the limited geographic electric vehicle roll-out strategies
play a role in connecting policy actions to market uptake of the new technology is also a key
unexplored question. This study, a snapshot in 2013, does not include how technology costs
could decline with battery innovation, greater mass-market economies of scale, second-life
battery benefits, or other technical factors. Further study on these factors may help explain
how some cities and states are more or less effective at accelerating electric vehicle adoption with a given suite of incentives in the future.
Based on the findings from this study it is clear that it is still early in the development
of the market—and policies—for electric vehicles. Including both PHEVs and BEVs, the
overall U.S. light-duty vehicle share of electric drive vehicles in 2013 was about 0.6%.
29
STATE-LEVEL U.S. ELECTRIC-VEHICLE INCENTIVES
States like California, Georgia, and Hawaii that have greater electric vehicle promotion
policies have approximately 3–4 times the national average electric vehicle share to
show for it. On the other hand, other states offer incentives but have little electric
vehicle market traction at this stage. Other states have relatively high electric vehicle
shares but relatively few consumer policy benefits. This state-level analysis is but an
early step to help inform the extent to which state actions, fiscal incentives and beyond,
are helping to drive the early electric vehicle market, while economies of scale work to
bring down the advanced technology costs. This work also alludes to how many other
potential actions (e.g., by the federal government, cities, automakers, businesses) could
also be critical in understanding the if, how, when, and where of electric vehicles’ breakthrough to greater market shares.
30
ICCT WHITE PAPER
REFERENCES
Agenbroad, J., & Holland, B. (2014). Pulling Back the Veil on EV Charging Station Costs.
Retrieved June 20, 2014, from http://blog.rmi.org/blog_2014_04_29_pulling_back_
the_veil_on_ev_charging_station_costs
Alternative Fuels Data Center. (2014a). Alternative Fueling Station Locator. Retrieved
June 20, 2014, from http://www.afdc.energy.gov/locator/stations/
Alternative Fuels Data Center. (2014b). Developing Infrastructure to Charge Plug-In
Electric Vehicles. Retrieved June 17, 2014, from http://www.afdc.energy.gov/fuels/
electricity_infrastructure.html
Alternative Fuels Data Center. (2014c). State Laws and Incentives. Retrieved June 16,
2014, from http://www.afdc.energy.gov/laws/state
Auto Rental News. (2014). Airport Rates Dip Amid Positive Trend. Retrieved June
20, 2014, from http://www.autorentalnews.com/channel/rental-operations/news/
story/2014/06/may-airport-rates-down-second-time-in-19-months.aspx
Berman, B. (2014). The Ultimate Guide to Electric Car Charging Networks. Retrieved
June 20, 2014, from http://www.plugincars.com/ultimate-guide-electric-car-chargingnetworks-126530.html
Blanco, S. (2009). HOV Sticker on Clean Cars Worth a solid $1200 From Your Insurance
Company. Retrieved June 20, 2014, from http://green.autoblog.com/2009/06/18/hovstickers-on-clean-cars-worth-a-solid-1-200-from-your-insura/
C2ES. (2014). ZEV program. Retrieved September 24, 2014, from http://www.c2es.org/
us-states-regions/policy-maps/zev-program
California Center for Sustainable Energy (CCSE). (2013). California Plug-in Electric Vehicle
Driver Survey Results. Retrieved June 20, 2014, from www.energycenter.org/cvrp
CCSE (2014). Frequently Asked Questions. Retrieved June 20, 2014, from http://energycenter.org/clean-vehicle-rebate-project/faq#general7
California Department of Transportation. (2014). HOV lanes. Retrieved August 15, 2014,
from http://www.dot.ca.gov/hq/paffairs/faq/faq79.htm
California Hybrid Truck & Bus Voucher Incentive Project. (2014). About the Hybrid Truck
& Bus Voucher Incentive Project (HVIP). Retrieved June 18, 2014, from http://www.
californiahvip.org/about-the-project
Cars. (2014a). 2013 Nissan Leaf. Retrieved July 1, 2014, from http://www.cars.com/nissan/
leaf/2013/snapshot
Cars. (2014b). 2014 Nissan Leaf. Retrieved July 1, 2014, from http://www.cars.com/nissan/
sentra/2013/snapshot
Coffman, M. & Flachsbart, P. (2009). Energy Efficient Transportation Strategies: Assessment of Public Attitudes and Behaviors. Presentation to Hawaii Congress of Planning
Officials, 24 September 2009.
Collantes, G. & A. Eggert. (2014). The Effect of Monetary Incentives on Sales of
Advanced Clean Cars in the United States: Summary of the Evidence. University of
California, Davis. Retrieved September 11, 2014, from http://policyinstitute.ucdavis.edu/
files/ZEMAP-Policy-Memo-Vehicle-Incentives.pdf
31
STATE-LEVEL U.S. ELECTRIC-VEHICLE INCENTIVES
Davis, M., M. Alexander, & M. Duvall. (2013). Total cost of Ownership Model for Current Plug-in Electric Vehicles. Retrieved June 20, 2014, from http://www.epri.com/
abstracts/Pages/ProductAbstract.aspx?ProductId=000000003002001728
Dell, O. J. Electric Vehicle Tax Credits: What You Need To Know. Retrieved June 20, 2014,
from http://www.edmunds.com/fuel-economy/the-ins-and-outs-of-electric-vehicletax-credits.html
DMV. ORG. Retrieved June 29, 2014, from http://www.dmv.org/
Downtown Parking Finder. (2014). Retrieved August 3, 2014, from http://clvplaces.
appspot.com/apps/pkngfinder/index.html
Edmunds. (2014a). 2013 Nissan Leaf—Features & Specs. Retrieved July 10, 2014, from
http://www.edmunds.com/nissan/leaf/2013/features-specs.html?style=200446072
Edmunds. (2014b). 2013 Nissan Sentra—Features and Specs. Retrieved July
10, 2014, from http://www.edmunds.com/nissan/sentra/2013/features-specs.
html?style=200440359
EV Project. (2013). Overview. Retrieved September 19, 2014, from http://www.theevproject.com/overview.php
Hybridcars (2014). Monthly Sales Dashboard. Retrieved June 20, 2014, from
http://www.hybridcars.com/market-dashboard/ and http://www.hybridcars.com/
december-2013-dashboard/
Idaho National Laboratory (INL) (2014). How many electric miles do Nissan Leafs and
Chevrolet Volts in The EV Project travel? Retrieved September 19, 2014, from http://
avt.inel.gov/pdf/EVProj/eVMTMay2014.pdf. May.
Lee, D. (2013). Downtown Honolulu: Where to park now. Retrieved June 20, 2014, from
http://www.honolulumagazine.com/Honolulu-Magazine/February-2013/DowntownHonolulu-Where-to-park-now/#.VAdk1D5gZXJ
Lin, Z., & Greene, D. (2011). Promoting the Market for Plug-In Hybrid and Battery Electric
Vehicles. Transportation Research Record: Journal of the Transportation Research
Board, No. 2252, Transportation Research Board of the National Academies, Washington, D.C. pp. 49–56.
DOI: 10.3141/2252-07
Los Angeles County Metropolitan Transportation Authority. CMIA Supplemental
Application Information. Retrieved August, 25, 2014, from http://media.metro.net/
projects_studies/cmia/images/MI-10%20Web.pdf
Lu, S. (2006). Vehicle Survivability and Travel Mileage Schedules. Retrieved June 20,
2014, from http://www-nrd.nhtsa.dot.gov/Pubs/809952.pdf
Mock, P., & Yang, Z. (2014). Driving Electrification: A Global Comparison of Fiscal Incentive Policy for Electric Vehicles. Retrieved June 20, 2014, from http://www.theicct.org/
sites/default/files/publications/ICCT_EV-fiscal-incentives_20140506.pdf
National Research Council. Transitions to Alternative Vehicles and Fuels. Retrieved June
20, 2014, from http://www.nap.edu/catalog.php?record_id=18264
North Carolina Department of Transportation. (2014). High Occupancy Vehicle Lanes.
Retrieved August 15, 2014, from http://www.ncdot.gov/projects/hov/
Parkopedia. (2014). Retrieved August 3, 2014, from http://en.parkopedia.com/parking/
garage/fremont_street_experience_garage_red_garage/89101/las_vegas/
32
ICCT WHITE PAPER
Plug-in Cars. (2014). 2014 Nissan LEAF Review. Retrieved July 10, 2014, from http://www.
plugincars.com/nissan-leaf
Polk. (Febuary, 2012). U.S. Consumers Hold on to New Vehicles Nearly Six Years, an
All-Time High. Retrieved June 20, 2014, from https://www.polk.com/company/
news/u.s._consumers_hold_on_to_new_vehicles_nearly_six_years_an_all_time_high
Railstotrails. (2008). Adding a Single Lane to an Existing Highway. Retrieved June
20, 2014, from http://www.railstotrails.org/resources/documents/whatwedo/
policy/07-29-2008%20Generic%20Response%20to%20Cost%20per%20Lane%20
Mile%20for%20widening%20and%20new%20construction.pdf
Rascoe, A., & Seetharaman D. (January, 2013). U.S. backs off goal of one million electric
cars by 2015. Retrived June 20, 2014, from http://www.reuters.com/article/2013/01/31/
us-autos-greencars-chu-idUSBRE90U1B020130131
Schey, S. (2013). Phoenix, AZ: Q2 2013 Report The EV Project. Electric Transportation
Engineering Corporation. Retrieved June 20, 2014, from http://www.theevproject.com/
cms-assets/documents/127233-901153.q2-2013-rpt.pdf
Schrank, D., Eisele, B., & Lomax, T. (2012). TTI’s 2012 Urban Mobility Report. College
Station, TX: Texas A&M Transportation Institute. Retrieved June 20, 2014, from
http://mobility.tamu.edu/ums/
State of Hawaii Department of Accounting and General Services. (2014). Public Parking
Locations. Retrieved August 3, 2014, from http://ags.hawaii.gov/automotive-management/parking-control-branch/public-parking-locations/
Statisticbrain. (2014). Carpool Statistics. Retrieved June 20, 2014, from http://www.
statisticbrain.com/carpool-statistics/
Stephens, T. (2013). Non-Cost Barriers to Consumer Adoption of New Light-Duty Vehicle
Technologies. Transportation Energy Future Series. Prepared for the U.S. Department
of Energy by Argonne National Laboratory, Argonne, IL. DOE/GO-102013-3709. 47 pp.
Tal, G., Nicholas, M.A. (2013). Studying the PEV Market in California: Comparing the PEV,
PHEV and Hybrid Markets. Davis, CA: Institute of Transportation Studies, University of
California, Davis. Retrieved June 20, 2014, from http://www.arb.ca.gov/html/ca_pevmarket_study_ucdits.pdf
Tal, G., Nicholas, M.A., Davies, J., & Woodjack, J. (2013). Charging Behavior Impacts on
Electric Vehicle Miles Travel: Who is Not Plugging in?. Davis, CA: Institute of Transportation Studies, University of California, Davis.
Transportpolicy.net. (2014). California: ZEV. Retrieved September 24, 2014, from
http://transportpolicy.net/index.php?title=California:_ZEV
U.S. Census Bureau. (2011). 2009 American Community Survey. Retrieved June 20, 2014,
from http://www.census.gov/acs/www/
U.S. Census Bureau. (2014). State & County QuickFacts. Retrieved August 3, 2013, from
http://quickfacts.census.gov/qfd/states/32000.html
U.S. Census Bureau. (2013). Population, population change, and estimated components
of population change: April 1, 2010 to July 1, 2013. Retrieved June 20, 2014, from
http://www.census.gov/popest/data/state/totals/2013/index.html
U.S. Department of Energy (DOE). (2013a). EV Project Nissan Leaf Vehicle Summary
Report. Retrieved June 20, 2014, from http://www1.eere.energy.gov/vehiclesandfuels/
avta/pdfs/evproj/evproj_nissanleaf_q22013.pdf
33
STATE-LEVEL U.S. ELECTRIC-VEHICLE INCENTIVES
U.S. Department of Energy (DOE). (2013b). EV Project Chevrolet Volt Vehicle Summary
Report. Retrieved June 20, 2014, from http://www1.eere.energy.gov/vehiclesandfuels/
avta/pdfs/evproj/evproj_gmvolt_q22013.pdf
U.S. Department of Energy (DOE) (2014). A Guide to the Lessons Learned from the
Clean Cities Community Electric Vehicle Readiness Projects. Clean Cities program.
Retrieved September 10, 2014, from http://www.afdc.energy.gov/uploads/publication/
guide_ev_projects.pdf
U.S. Department of Transportation. (2011). The Value of Travel Time Savings: Departmental Guidance for Conducting Economic Evaluations Revision 2. Washington DC:
Belenky, P., & Trottenberg, P. Retrieved June 20, 2014, from http://www.dot.gov/sites/
dot.dev/files/docs/vot_guidance_092811c.pdf
U.S. Energy Information Administration. (2014). Short-Term Energy Outlook. Retrieved
June 20, 2014, from http://www.eia.gov/forecasts/steo/report/electricity.cfm
U.S. Federal Highway Administration, Highway Statistics, annual. (2011). Retrieved June
20, 2014, from http://www.fhwa.dot.gov/policyinformation/statistics.cfm
U.S. Internal Revenue Service (IRS). (2014). Plug-In Electric Drive Vehicle Credit (IRC
30D). Retrieved July 1, 2014, from http://www.irs.gov/Businesses/Plug-In-ElectricVehicle-Credit-(IRC-30-and-IRC-30D)
Voelcker, J. (2012a) 100 Million Electric Miles Driven By Chevy Volt Owners. Retrieved
June 20, 2014, from http://www.greencarreports.com/news/1080806_100-millionelectric-miles-driven-by-chevy-volt-owners
Voelcker, J. (2012b) Nissan Leaf Electric Car Owners Cover 100 Million Miles Too.
Retrieved June 20, 2014, from http://www.greencarreports.com/news/1081069_nissanleaf-electric-car-owners-cover-100-million-miles-too
Voelcker, J. (2013). Electric Car: Lease Or Buy? Retrieved June 20, 2014, from http://
www.greencarreports.com/news/1084985_electric-car-lease-or-buy
Washington DOT. (2006). Project Case Studies. Retrieved June 20, 2014, from http://
www.wsdot.wa.gov/NR/rdonlyres/B8A26ABB-11CE-40D6-8B00-CBABA9CB3944/0/
Project_Case_Studies.pdf
Zeroto60times. (2014). Retrieved July 10, 2014, from http://www.zeroto60times.com/
Nissan-0-60-mph-Times.html
ZEV Program Implementation Task Force. (2014). Multi-State ZEV Action Plan. Retrieved
September 10, 2014, from http://governor.maryland.gov/documents/MultiStateZEVActionPlan.pdf
34
ICCT WHITE PAPER
ANNEX A. REFERENCES FOR REVIEW OF STATE
ELECTRIC VEHICLE INCENTIVES
A.1. SOURCE OF INFORMATION FOR INCENTIVES BY STATE
Subsidies
Federal
License
tax/fee
Annual fee
EVSE Financing
HOV
Parking
EMISSIONS
TESTING
EXEMPTION
State Government
of Connecticut
(2013)
IRS (2014)
Alabama
AFDC (2014)
AFDC
(2014)
AFDC (2014)
AFDC (2014)
AFDC (2014)
AFDC
(2014)
DMV.ORG (2014),
Wikipedia (2014)
Alaska
AFDC (2014)
AFDC
(2014)
AFDC (2014)
AFDC (2014)
AFDC (2014)
AFDC
(2014)
DMV.ORG (2014),
Wikipedia (2014)
Arizona
AFDC (2014), State
Government of Arizona
(2014a,b, &c), Arizona
Department of Revenue
(DOR)
AFDC
(2014)
AFDC (2014)
AFDC (2014)
AFDC (2014),
Arizona
Department of
Transportation
(2013)
AFDC
(2014)
DMV.ORG (2014),
Wikipedia (2014)
Arkansas
AFDC (2014)
AFDC
(2014)
AFDC (2014)
AFDC (2014)
AFDC (2014)
AFDC
(2014)
DMV.ORG (2014),
Wikipedia (2014)
California
AFDC (2014),Center
for Sustainable Energy
(2014), California
Environmental
Protection Agency
(EPA) (2012)
AFDC
(2014)
AFDC (2014)
AFDC (2014),
California Energy
Commission (2013),
ClipperCreek (2014)
AFDC (2014),
California Air
Resources Board
(2014), California
Department of
Transportation
(2014)
AFDC
(2014)
DMV.ORG (2014),
Wikipedia (2014)
AFDC (2014), Colorado
DOR (2014), State
Government of
Colorado (2013)
AFDC
(2014)
AFDC
(2014), U.S.
Department of
Energy(DOE)
(2013), State
Government
of Colorado
(2013)
AFDC (2014), Clean
Air Fleets (2013),
Regional Air Quality
Council (2013),
Refuel Colorado
(2014)
AFDC (2014)
AFDC
(2014)
DMV.ORG (2014),
Wikipedia (2014)
Connecticut
AFDC (2014)
AFDC
(2014)
AFDC (2014)
AFDC (2014)
AFDC (2014)
AFDC
(2014)
DMV.ORG (2014),
Wikipedia (2014)
Delaware
AFDC (2014)
AFDC
(2014)
AFDC (2014)
AFDC (2014)
AFDC (2014)
AFDC
(2014)
DMV.ORG (2014),
Wikipedia (2014)
AFDC (2014), DC
Deparment of Motor
Vehicles (DMV) (2014)
AFDC
(2014)
AFDC (2014)
AFDC (2014)
AFDC (2014)
AFDC
(2014)
DMV.ORG (2014),
Wikipedia (2014)
AFDC (2014)
AFDC (2014),
Florida
Department of
Highway Safety
and Motor
Vehicles (2014),
U.S. Department
of Transportation
Federal Highway
Administration
(2013)
AFDC
(2014)
DMV.ORG (2014),
Wikipedia (2014)
AFDC (2014)
AFDC (2014),
Georgia DOR
(2014), Georgia
Department of
Public Safety
(2014)
AFDC
(2014)
DMV.ORG (2014),
Wikipedia (2014)
Colorado
DC
Florida
AFDC (2014)
Georgia
AFDC (2014)
35
AFDC
(2014)
AFDC
(2014)
AFDC (2014)
AFDC (2014)
STATE-LEVEL U.S. ELECTRIC-VEHICLE INCENTIVES
Subsidies
License
tax/fee
Annual fee
EVSE Financing
HOV
Parking
EMISSIONS
TESTING
EXEMPTION
AFDC
(2014)
DMV.ORG (2014),
Wikipedia (2014)
Hawaii
AFDC (2014)
AFDC
(2014)
AFDC (2014)
AFDC (2014)
AFDC (2014),
Government of
the County of
Hawaii (2012),
Chang, Wiegmann
& Bilotto(2008)
Idaho
AFDC (2014)
AFDC
(2014)
AFDC (2014)
AFDC (2014)
AFDC (2014)
AFDC
(2014)
DMV.ORG (2014),
Wikipedia (2014)
Illinois
AFDC (2014),
(Caitlyn Barnes,
Illinois Department of
Commerce & Economic
Opportunity, personal
correspondence),
(Darwin Burkhart,
Illinois EPA, personal
correspondence)
AFDC
(2014)
AFDC (2014)
AFDC (2014)
AFDC (2014)
AFDC
(2014)
DMV.ORG (2014),
Wikipedia (2014)
Indiana
AFDC (2014)
AFDC
(2014)
AFDC (2014)
AFDC (2014)
AFDC (2014)
AFDC
(2014)
DMV.ORG (2014),
Wikipedia (2014),
Clean Air Car
Check (2014)
Iowa
AFDC (2014)
AFDC
(2014)
AFDC (2014)
AFDC (2014)
AFDC (2014)
AFDC
(2014)
DMV.ORG (2014),
Wikipedia (2014)
Kansas
AFDC (2014)
AFDC
(2014)
AFDC (2014)
AFDC (2014)
AFDC (2014)
AFDC
(2014)
DMV.ORG (2014),
Wikipedia (2014)
Kentucky
AFDC (2014)
AFDC
(2014)
AFDC (2014)
AFDC (2014)
AFDC (2014)
AFDC
(2014)
DMV.ORG (2014),
Wikipedia (2014)
Louisiana
AFDC (2014),
State Government
of Louisiana
(2014),Louisiana DOR
(2014)
AFDC
(2014)
AFDC (2014)
AFDC (2014)
AFDC (2014)
AFDC
(2014)
DMV.ORG (2014),
Wikipedia (2014)
AFDC (2014)
AFDC
(2014)
AFDC (2014)
AFDC (2014)
AFDC (2014)
AFDC
(2014)
DMV.ORG (2014),
Wikipedia (2014),
DMV.com (2011)
AFDC (2014)
AFDC (2014),
(Chris Rice,
Maryland Energy
Administration,
personal
correspondence)
AFDC (2014),
Maryland
Department of
Transportation
State Highway
Administration
(2014)
AFDC
(2014)
DMV.ORG (2014),
Wikipedia (2014)
DMV.ORG (2014),
Wikipedia (2014),
State Government
of Massachusetts
(2014)
Maine
AFDC (2014)
AFDC
(2014)
Massachusetts
AFDC (2014)
AFDC
(2014)
AFDC (2014)
AFDC (2014)
AFDC (2014)
AFDC
(2014)
Michigan
AFDC (2014)
AFDC
(2014)
AFDC (2014)
AFDC (2014)
AFDC (2014)
AFDC
(2014)
DMV.ORG (2014),
Wikipedia (2014)
Minnesota
AFDC (2014)
AFDC
(2014)
AFDC (2014)
AFDC (2014)
AFDC (2014)
AFDC
(2014)
DMV.ORG (2014),
Wikipedia (2014)
Mississippi
AFDC (2014)
AFDC
(2014)
AFDC (2014)
AFDC (2014)
AFDC (2014)
AFDC
(2014)
DMV.ORG (2014),
Wikipedia (2014)
Missouri
AFDC (2014)
AFDC
(2014)
AFDC (2014)
AFDC (2014)
AFDC (2014)
AFDC
(2014)
DMV.ORG (2014),
Wikipedia (2014)
Montana
AFDC (2014),
(Garrett Martin,
Montana Department
of Environmental
Quality, personal
correspondence)
AFDC
(2014)
AFDC (2014)
AFDC (2014)
AFDC (2014)
AFDC
(2014)
DMV.ORG (2014),
Wikipedia (2014)
Nebraska
AFDC (2014)
AFDC
(2014)
AFDC (2014),
U.S. DOE (2013)
AFDC (2014)
AFDC (2014)
AFDC
(2014)
DMV.ORG (2014),
Wikipedia (2014)
Maryland
36
ICCT WHITE PAPER
Subsidies
License
tax/fee
Annual fee
EVSE Financing
HOV
Parking
EMISSIONS
TESTING
EXEMPTION
Nevada
AFDC (2014)
AFDC
(2014)
AFDC (2014)
AFDC (2014)
AFDC (2014)
AFDC
(2014)
DMV.ORG (2014),
Wikipedia (2014),
Nevada DMV
(2014)
New
Hampshire
AFDC (2014)
AFDC
(2014)
AFDC (2014)
AFDC (2014)
AFDC (2014)
AFDC
(2014)
DMV.ORG (2014),
Wikipedia (2014)
New Jersey
AFDC (2014), New
Jersey Department of
the Treasury (2014a,b)
AFDC
(2014)
AFDC (2014)
AFDC (2014)
AFDC (2014)
AFDC
(2014)
DMV.ORG (2014),
Wikipedia (2014)
New Mexico
New York
AFDC (2014)
AFDC
(2014)
AFDC (2014)
AFDC
(2014)
North
Carolina
AFDC (2014)
AFDC
(2014)
North Dakota
AFDC (2014)
AFDC
(2014)
AFDC (2014)
AFDC (2014)
AFDC
(2014)
DMV.ORG (2014),
Wikipedia (2014),
New Mexico Motor
Vehicle Department
(2014), Government
of the City of
Albuouerque
(2014)
AFDC (2014)
AFDC (2014)
AFDC (2014), New
York Department
of Transportation
(2014), LeSage
(2012)
AFDC
(2014)
DMV.ORG (2014),
Wikipedia (2014)
AFDC (2014),
U.S. DOE (2013)
AFDC (2014), North
Carolina State
University (2013)
AFDC (2014),
North Carolina
Department of
Transporation
(2014), Google
Map (2014)
AFDC
(2014)
DMV.ORG (2014),
Wikipedia (2014),
North Carolina
DMV (2014)
AFDC (2014)
AFDC (2014)
AFDC (2014)
AFDC
(2014)
DMV.ORG (2014),
Wikipedia (2014)
AFDC (2014)
AFDC
(2014)
DMV.ORG (2014),
Wikipedia (2014),
DMV.com (2013)
AFDC (2014)
AFDC
(2014)
DMV.ORG (2014),
Wikipedia (2014)
AFDC (2014)
Ohio
AFDC (2014)
AFDC
(2014)
AFDC (2014)
AFDC (2014),
(Hannah Smith,
Ohio Development
Services Agency,
personal
correspondence)
Oklahoma
AFDC (2014)
AFDC
(2014)
AFDC (2014)
AFDC (2014),
Oklahoma Clean
Cities (2014)
AFDC (2014)
AFDC (2014)
AFDC (2014)
AFDC
(2014)
DMV.ORG (2014),
Wikipedia
(2014), Oregon
Department of
Environmental
Quality (2014)
AFDC (2014)
AFDC (2014), Carter
(2012), Pennsylvania
Department of
Environmental
Protection (2014b)
AFDC (2014)
AFDC
(2014)
DMV.ORG (2014),
Wikipedia (2014),
Warner (2011)
AFDC (2014)
AFDC (2014)
AFDC
(2014)
DMV.ORG (2014),
Wikipedia (2014),
Rhode Island
Emissions &Testing
website (2014)
AFDC (2014)
AFDC (2014)
AFDC (2014)
AFDC
(2014)
DMV.ORG (2014),
Wikipedia (2014)
AFDC (2014)
AFDC (2014)
AFDC (2014)
AFDC
(2014)
DMV.ORG (2014),
Wikipedia (2014)
AFDC (2014)
AFDC
(2014)
AFDC (2014),
Pennsylvania
Department of
Environmental
Protection
(2013),Pennsylvania
Department of
Environmental
Protection (2014a)
AFDC
(2014)
Rhode Island
AFDC (2014)
AFDC
(2014)
AFDC (2014)
South
Carolina
AFDC (2014)
AFDC
(2014)
South Dakota
AFDC (2014)
AFDC
(2014)
Oregon
Pennsyvania
37
STATE-LEVEL U.S. ELECTRIC-VEHICLE INCENTIVES
Subsidies
Tennessee
Texas
License
tax/fee
AFDC (2014)
AFDC
(2014)
AFDC (2014)
AFDC
(2014)
Annual fee
AFDC (2014)
AFDC (2014)
EVSE Financing
HOV
Parking
EMISSIONS
TESTING
EXEMPTION
AFDC (2014)
AFDC (2014),
Tennessee
Department of
Transportation
(2013)
AFDC
(2014)
DMV.ORG (2014),
Wikipedia (2014)
AFDC (2014)
AFDC (2014)
AFDC
(2014)
DMV.ORG (2014),
Wikipedia (2014),
Texas Department
of Public Safety
(2011)
AFDC
(2014)
DMV.ORG (2014),
Wikipedia (2014),
Utah Motor Vehicle
Division (2014)
Utah
AFDC (2014)
AFDC
(2014)
AFDC (2014)
AFDC (2014)
AFDC (2014),
Utah Department
of Transportation
(2014), Chang,
Wiegmann &
Bilotto(2008)
Vermont
AFDC (2014)
AFDC
(2014)
AFDC (2014)
AFDC (2014)
AFDC (2014)
AFDC
(2014)
DMV.ORG (2014),
Wikipedia (2014)
Virginia
AFDC (2014)
AFDC
(2014)
AFDC (2014),
U.S. DOE (2013)
AFDC (2014)
AFDC (2014)
AFDC
(2014)
DMV.ORG (2014),
Wikipedia (2014),
Virginia DMV
(2014)
AFDC (2014)
AFDC
(2014)
DMV.ORG (2014),
Wikipedia (2014)
AFDC (2014)
AFDC
(2014)
DMV.ORG (2014),
Wikipedia (2014)
Washington
West Virginia
AFDC (2014), JUSTIA
US Law (2013)
AFDC
(2014)
AFDC (2014),
U.S. DOE (2013)
AFDC (2014), Le
(2013), Hartman
(2013), (Patti MillerCrowley, Washington
State Department of
Commerce, personal
correspondence)
AFDC (2014)
AFDC
(2014)
AFDC (2014)
AFDC (2014)
Wisconsin
AFDC (2014)
AFDC
(2014)
AFDC (2014)
AFDC (2014)
AFDC (2014)
AFDC
(2014)
DMV.ORG (2014),
Wikipedia (2014),
Wisconsin
Department of
Transportation
(2013)
Wyoming
AFDC (2014)
AFDC
(2014)
AFDC (2014)
AFDC (2014)
AFDC (2014)
AFDC
(2014)
DMV.ORG (2014),
Wikipedia (2014)
38
ICCT WHITE PAPER
A.2. FULL REFERENCE DETAILS
Arizona Department of Revenue. (2013). Arizona Form 319: 2013 Credit for Solar
Hot Water Heater Plumbing Stub Outs and Electric Vehicle Recharge Outlets.
Retrieved July 15, 2014, from http://www.azdor.gov/LinkClick.aspx?fileticket=Jkxk8Z_d48%3d&tabid=252&mid=870
Arizona Department of Transportation. (2013). HOV Lanes Restricted During Certain
Times And for Certain Vehicles. Retrieved July 15, 2014, from http://www.azdot.gov/
media/News/news-release/2013/06/26/hov-lanes-restricted-during-certain-timesand-for-certain-vehicles
Alternative Fuels Data Center. (2014). State Laws and Incentives. Retrieved June 15,
2014, from http://www.afdc.energy.gov/laws/state
California Air Resources Board. (2014). Single Occupant Carpool Lane Stickers. Retrieved July 15, 2014, from http://www.arb.ca.gov/msprog/carpool/carpool.htm
California Department of Transportation. (2014). Summary of High-Occupancy Vehicles.
Spreadsheet published by the State of California
California Energy Commission. (2013). Electric Drive Projects. Retrieved July 15, 2014,
from http://www.energy.ca.gov/drive/projects/electric.html
California Environmental Protection Agency. (2012). Facts about California Clean Vehicle
Rebate. Retrieved July 15, 2014, from http://www.arb.ca.gov/msprog/zevprog/factsheets/clean_vehicle_incentives.pdf
California Hybrid Truck & Bus Voucher Incentive Project. (2014). About the Hybrid Truck
& Bus Voucher Incentive Project (HVIP). Retrieved June 18, 2014, from http://www.
californiahvip.org/about-the-project
Carter, S. (2012). Amerigreen Energy Installs Free EV Charging Stations. Retrieved July
15, 2014, from http://nissan-leaf.net/2012/11/23/amerigreen-energy-installs-free-evcharging-stations/
Center for Sustainable Energy. (2014). Retrieved July 15, 2014, from http://energycenter.
org/clean-vehicle-rebate-project
Chang, M., Wiegmann, J., & Bilotto, C. (2008). A Compendium of Existing HOV Lane
Facilities in the United States. Retrieved July 15, 2014, from http://www.ops.fhwa.dot.
gov/publications/fhwahop09030/fhwahop09030.pdf
Clean Air Car Check. (2014). About Emissions Testing. Retrieved June 26, 2014, from
http://www.cleanaircarcheck.com/about_emissions_testing.php
Clean Air Fleets. (2013). Charge Ahead Colorado Awarded Projects. Retrieved July
15, 2014, from http://cleanairfleets.org/documents/electric/charge_ahead_colorado_awarded_projects
ClipperCreek. (2014). Reconnect California Grant Program. Retrieved July 15, 2014, from
http://www.clippercreek.com/pdf/Reconnect_Ca_program_details_v7.pdf
Colorado DOR. (2014). Income67: Innovative Motor Vehicle and Alternative Fuel Vehicle
Credits. Retrieved June 20, 2014, from http://www.colorado.gov/cs/Satellite?blobcol=u
rldata&blobheader=application%2Fpdf&blobkey=id&blobtable=MungoBlobs&blobwher
e=1251986038233&ssbinary=true
DC Department of Motor Vehicles (DMV). (2014). Vehicle Title Fees. Retrieved June 25,
2014, from http://dmv.dc.gov/book/vehicle-fees/vehicle-title
39
STATE-LEVEL U.S. ELECTRIC-VEHICLE INCENTIVES
DMV. ORG. Retrieved June 29, 2014, from http://www.dmv.org/
DMV.com. (2011). Vehicle Emissions Testing in Maine. Retrieved July 15, 2014, from
http://www.dmv.com/me/maine/emissions-testing
DMV.com. (2013). Vehicle Emissions Testing in Ohio. Retrieved July 15, 2014, from
http://www.dmv.com/oh/ohio/emissions-testing
Florida Department of Highway Safety and Motor Vehicles. (2014). High Occupancy
Vehicle Decal. Retrieved June 25, 2014, from http://www.flhsmv.gov/dmv/HOV.html
Georgia Department of Public Safety. (2014). High Occupancy Lanes. Retrieved August
10, 2014, from https://dps.georgia.gov/high-occupancy-vehicle-lanes
Georgia DOR. (2014). Alternative Fuel Vehicle Plate. Retrieved June 25, 2014, from
http://motor.etax.dor.ga.gov/motor/plates/PlateDetails.aspx?pcode=AF
Google Map. (2014).
Government of the City of Albuouerque. (2014). Emissions Testing Cost. Retrieved June
26, 2014, from http://www.cabq.gov/environmentalhealth/emissions-testing/emissionstesting/emissions-testing-locations
Government of the County of Hawaii. (2012). Motor Vehicles General Information.
Retrieved July 15, 2014, from http://www.hawaiicounty.gov/finance-vrl-generalinfo#Special License Plates
Hartman, K. (2013). State Hybrid and Electric Vehicle Incentives. Retrieved July 15, 2014,
from http://www.ncsl.org/research/energy/state-electric-vehicle-incentives-statechart.aspx
Internal Revenue Services. (2014). Plug-In Drive Vehicle Credit (IRC-30D). Retrieved
June 15, 2014, from http://www.irs.gov/Businesses/Plug-In-Electric-Vehicle-Credit(IRC-30-and-IRC-30D)
JUSTIA US Law. (2013). 2005 Washington Revised Code RCW 82.08.809: ExemptionsVehicles Using Clean Alternative Fuels. Retrieved August 8, 2014, from http://law.justia.
com/codes/washington/2005/title82/82.08.809.html
Le, P. (2013). Report: More Drivers Using Electric-Car-Charging Stations. Retrieved July
15, 2014, from http://seattletimes.com/html/localnews/2022180758_chargingstationsxml.html
LeSage, J. (2012) Ford C-Max Energi Gains Access to New York HOV Lanes. Retrieved
July 15, 2014, from http://green.autoblog.com/2012/12/11/ford-c-max-energi-gainsaccess-to-new-york-hov-lanes/
Louisiana DOR. (2014). Notice of Intent: Alternative Fuel Credit. Retrieved June 26, 2014,
from http://www.rev.state.la.us/forms/lawspolicies/LAC61_I_1913.pdf
Maryland Department of Transportation State Highway Administration. (2014). High
Occupancy Vehicle Lanes FAQs. Retrieved August 10, 2014, from http://www.roads.
maryland.gov/Index.aspx?PageId=249
Nevada DMV. (2014). Emissions Testing Fees for 2014. Retrieved July 15, 2014, from
http://www.dmvnv.com/emission_fees.htm
New Jersey Department of the Treasury. (2014a). Sales Tax Collection Schedule. Retrieved June 26, 2014, from http://www.state.nj.us/treasury/taxation/pdf/other_forms/
sales/st75.pdf
40
ICCT WHITE PAPER
New Jersey Department of Treasury. (2014b). Sales Tax Exemption-Zero Emission
Vehicles. Retrieved July 15, 2014, from http://www.state.nj.us/treasury/taxation/
zevnotice.shtml
New Mexico Motor Vehicle Department. (2014). Emission Testing. Retrieved June 26,
2014, from http://www.mvd.newmexico.gov/emission-testing.aspx
New York Department of Transportation. (2014). New York’s Clean Pass Program.
Retrieved July 15, 2014, from https://www.dot.ny.gov/portal/page/portal/programs/
clean-pass?nd=nysdot
North Carolina DMV. (2014). Vehicle Emissions &Safety Inspection. Retrieved June 26,
2014, from http://www.ncdot.gov/dmv/vehicle/registration/inspection/
North Carolina Department of Transporation. (2014). HOV Lanes. Retrieved August 10,
2014, from http://www.ncdot.gov/projects/hov/
North Carolina State University. (2013). 2013 Clean Fuel Advanced Technology Awards.
Retrieved June 27, 2014, from http://ncsc.ncsu.edu/wp-content/uploads/2013-CFATAwardee-List.pdf
Oklahoma Clean Cities. (2014). State Tax Incentives. Retrieved June 26, 2014, from
http://www.okcleancities.org/state-tax-incentives
Oregon Department of Environmental Quality. (2014). Vehicle Inspection Program.
Retrieved June 23, 2014, from http://www.deq.state.or.us/aq/vip/prepare.htm
Pennsylvania Department of Environmental Protection. (2013). 2012-13 Annual Report to
the Pennsylvania Legislature Alternative Fuels Incentive Act Program. Retrieved June
15, 2014, from http://www.elibrary.dep.state.pa.us/dsweb/Get/Document-97965/0340RE-DEP4427.pdf
Pennsylvania Department of Environmental Protection. (2014a). Alternative Fuel Vehicle
Rebate Program. Retrieved June 15, 2014, from http://www.portal.state.pa.us/portal/
server.pt/community/alternative_fuels_incentive_grant/10492/alternative_fuel_vehicles/553206
Pennsylvania Department of Environmental Protection. (2014b). Grants, Loans and
Rebates. Retrieved June 16, 2014, from http://www.portal.state.pa.us/portal/server.pt/
community/grants%2C_loans_and_rebates/6012
Refuel Colorado. (2014). Grants, Tax Credits, and Incentives. Retrieved July 15, 2014, from
http://refuelcolorado.com/incentives
Regional Air Quality Council. (2013). Regional Air Quality Council and Colorado Energy
Office Electric Vehicle and Charging Station Grant Application. Retrieved July 15,
2014, from http://raqc.org/postfiles/clean_air_fleets/documents/cac_resources_page/
DEH%20Application%20February%202013.pdf
Rhode Island Emissions &Testing website. (2014). FAQs about the Rhode Island Emissions and Safety Testing Program. Retrieved June 27, 2014, from http://www.riinspection.org/riinspection/faq.htm
State Government of Arizona. (2014a). Arizona Revised Status 28-5808. Retrieved June
18, 2014, from http://www.azleg.gov/FormatDocument.asp?inDoc=/ars/28/05805.
htm&Title=28&DocType=ARS
State Government of Arizona. (2014b). Arizona Revised Status 28-5801. Retrieved June
18, 2014, from http://www.azleg.gov/FormatDocument.asp?inDoc=/ars/28/05801.
htm&Title=28&DocType=ARS
41
STATE-LEVEL U.S. ELECTRIC-VEHICLE INCENTIVES
State Government of Arizona. (2014c). Arizona Revised Status 43-1090. Retrieved June
18, 2014, from http://www.azleg.gov/FormatDocument.asp?inDoc=/a rs/43/01090.
htm&Title=43&DocType=ARS
State Government of Colorado. (2013). House Bill 13-1247. Retrieved July 15, 2014, from
http://www.leg.state.co.us/clics/clics2013a/csl.nsf/fsbillcont3/C64EAF0A2C033F4987
257AFE0063369A?Open&file=1247_enr.pdf
State Government of Connecticut. (2013). Electric Vehicle Charging Stations Tax Credit
Fact Sheet. Retrieved July 15, 2014, from http://www.ct.gov/deep/lib/deep/air/electric_vehicle/evse_fact_sheet.pdf
State Government of Hawaii. (2014) Designation of parking spaces for electric vehicles;
charging system. Retrieved June 25, 2014, from http://www.capitol.hawaii.gov/hrscurrent/Vol05_Ch0261-0319/HRS0291/HRS_0291-0071.htm
State Government of Illinois. (2012). Electric Vehicle Initiatives. Retrieved July 15, 2014,
from https://www2.illinois.gov/gov/green/Pages/ElectricVehicleInitiatives.aspx
State Government of Louisiana. (2014). Revised Status 47:6035. Retrieved June 26, 2014,
from http://www.legis.state.la.us/lss/lss.asp?doc=672160
State Government of Massachusetts. (2014). Information for Motorists: Basic Inspection
Information. Retrieved June 26, 2014, from http://massvehiclecheck.state.ma.us/
motorist_basicinfo.html
Tennessee Department of Transportation. (2013). Tennessee HOV Lanes. Retrieved July
15, 2014, from http://www.tdot.state.tn.us/smartcommute/docs/HOVLanes.pdf
Texas Department of Public Safety. (2011). Cost of Inspection. Retrieved June 27, 2014,
from http://www.txdps.state.tx.us/rsd/vi/CostOfInsp.htm
U.S. Department of Energy. (2013). States Beginning to Tax Electric Vehicles for Road
Use. Retrieved July 15, 2014, from http://energy.gov/eere/vehicles/fact-790-july29-2013-states-beginning-tax-electric-vehicles-road-use
U.S. Department of Transportation Federal Highway Administration. (2013). Tolling and
Pricing Program. Retrieved July 15, 2014, from http://www.ops.fhwa.dot.gov/publications/fhwahop09029/sec2_operational.htm
Utah Department of Transportation. (2014). C Decal Permit FAQs. Retrieved July 15,
2014, from http://www.udot.utah.gov/main/f?p=100:pg::::1:T,V:2280,68970
Utah Motor Vehicle Division. (2014). Vehicle Inspections. Retrieved July 15, 2014, from
http://dmv.utah.gov/vehicles-services-menu/registration/safety-emissions-inspections
Virginia DMV. (2014). Emissions Inspections. Retrieved June 30, 2014, from http://www.
dmv.state.va.us/vehicles/#emissions.asp
Warner, D. (2011). Despite Other States’ Moves, Pennsylvania’s Vehicle Inspection Program Going Strong. Retrieved July 15, 2014, from http://www.pennlive.com/midstate/
index.ssf/2011/01/despite_other_states_moves_pen.html
Wikipedia. (2014). Vehicle Inspection in the United States. Retrieved July 15, 2014, from
http://en.wikipedia.org/wiki/Vehicle_inspection_in_the_United_States
Wisconsin Department of Transportation. (2013). Vehicle Emission Testing. Retrieved
July 15, 2014, from http://www.dot.state.wi.us/drivers/vehicles/im.htm
42


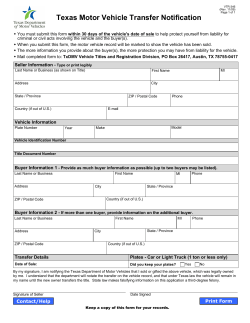
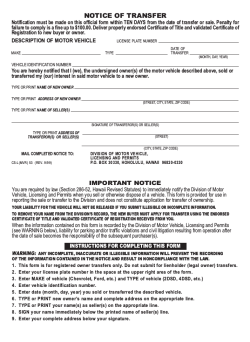
© Copyright 2026