
THE UNITED STATES-CENTRAL AMERICA- DOMINICAN REPUBLIC FREE TRADE AGREEMENT (CAFTA):
LIMITED
LC/CAR/L.124
16 July 2007
ORIGINAL: ENGLISH
THE UNITED STATES-CENTRAL AMERICADOMINICAN REPUBLIC
FREE TRADE AGREEMENT (CAFTA):
Issues, implications and lessons for the
smaller economies of Latin America and the Caribbean
__________
This document has been reproduced without formal editing.
Table of contents
Introduction............................................................................................................................................ 1
I.
The treatment of regional trading agreements in economic theory............................................ 2
II.
Trade policies of Central American countries ........................................................................... 3
III.
Central American preferential trading arrangements and free trade agreements....................... 9
IV.
Main features of the CAFTA-Dominican Republic-United States free trade agreement ........ 13
V.
The investment chapter ............................................................................................................ 15
VI.
Labor and environment ............................................................................................................ 16
VII.
The major stylized facts of regional trade agreements ............................................................ 17
VIII.
The effects and implications of CAFTA for Central American countries and the
Dominican Republic ................................................................................................................ 19
IX.
The effects of CAFTA on the environment ............................................................................. 23
Selected references................................................................................................................................ 25
THE UNITED STATES-CENTRAL AMERICA-DOMINICAN REPUBLIC
FREE TRADE AGREEMENT (CAFTA):
Issues, implications and lessons for the
smaller economies of Latin America and the Caribbean
Introduction
Central American countries and the Dominican Republic negotiated and ratified (with
the exception of Costa Rica) a free trade agreement with the United States (i.e. CAFTA). The
agreement which entered into force in 2006 is very comprehensive. It includes chapters on
trade in goods and services, investment, labor and environment.
The agreement is seen as important for both partners. Central America and the
Dominican Republic represent the 14th largest overall export market and the second largest
export market in Latin America, respectively, for the United States.
Also the free trade agreement between the United States, Central America and the
Dominican Republic is meant to ‘level the playing field’ for the United States. Indeed, the
United States exhibits very low average tariffs for most imports while Central American
countries and the Dominican Republic apply comparatively higher tariffs on imported goods
from the United States.1
For their part, Central America and the Dominican Republic benefit from special duty
preference programmes such as the Caribbean Basin Initiative (CBI) and the Generalized
System of Preferences (GSP). CAFTA will then allow the United States to trade on the same
footing with Central American countries and the Dominican Republic.
In the case of Central America and the Dominican Republic, CAFTA will solidify in a
more permanent manner the current temporary advantages of market access that these
countries receive in the form of special duty preference programmes.
This document, which is divided into nine sections, analyses some of the key issues of
CAFTA and tries to extract implications and lessons for smaller economies.
The first section presents the arguments and assumptions underlying the benefits of
regional integration agreements, such as CAFTA. The second and third sections focus on the
trade policy of Central America and the Dominican Republic. Sections four to six explain and
summarize the main provisions of CAFTA focusing on investment and the environment.
Section six analyses the stylized facts of regional integration agreements. Building on these
stylized facts, the final section ascertains the potential effects of CAFTA on Central
American countries and the Dominican Republic in terms of macroeconomic performance
and the environment.
1
The agreement also forms part of a concerted effort by the United States to reduce its current account deficit
which is on its way to becoming unsustainable, by raising foreign demand. Since the United States issues the
international reserve currency, sustainability should be understood in this context as the capacity to maintain
ownership of domestic assets. That is, the greater the current deficit the greater the number of assets and
percentage of sources of economic activity that are owned by foreigners.
2
I. The treatment of regional trading agreements (RTAs) in economic theory
According to mainstream economic theory, free trade creates welfare gains by
allowing consumers and firms to purchase from the cheapest source of supply ensuring that
production is located according to comparative advantage. In other words, free trade allows
the operation of the principle of comparative advantage by suppressing the discrimination
among the existing sources of supply.
The properties of the standard mainstream free trade model based on comparative
advantage, the Hecksher-Ohlin model or H-O-S model2, are found in four well-known
theorems: (a) the Hecksher-Ohlin theorem; (b) the Stolper-Samuelson theorem ;(c) the
Rybczynski theorem; and (d) the factor-price equalisation theorem.
The Hecksher-Ohlin theorem establishes a relationship between the factor scarcity
and factor embodiment in a commodity such that countries export the commodity that
intensively uses the abundant factor. This provides the basis for the gains from trade
argument. These refer to the increase in output and real income that result from trade for a
given set of inputs or domestic resources..
The Stolper-Samuelson theorem complements the above theorem by stating that the
intensive use of a factor of production for export (i.e., the abundant factor) raises its rate of
return above all other prices. In turn, the consequent increase in the supply of that factor of
production will lead to an increase in the output of the commodity intensive in that factor of
production (the Rybczynski theorem). Finally, the factor price-equalization theorem stating
that trade equalizes commodity and factor prices across countries rounds up the case for free
trade.3
Contrarily, RTAs shift the discrimination between the existing sources of supply
among trading partners by granting preferential market access to its signatory members. As a
result, these do not necessarily lead to the creation of welfare gains. The standard approach to
RTAs or more precisely to a particular form of RTA’s that of a customs unions states that
these are welfare enhancing when their trade creation capacity exceeds that of trade
diversion. 4 However, this applies only to the static case. The literature on the subject is
2
The Hecksher-Ohlin (H-O) model was renamed Hecksher-Ohlin-Samuelson (H-O-S) model as Samuelson
formalized the basic properties of the H-O model.
3
Under conditions of perfect competition, trade in goods acts as a substitute for factor mobility. Under
conditions of imperfect competition, free trade does not result in the full equalization of commodity and factor
prices. However, free trade reduces commodity and factor price differentials among countries and thus acts as a
force of convergence.
4
See, Jacob Viner (1950). In his seminal contribution, Viner identified the conditions that if met by the
RTA could improve its efficiency. These included the geographical extension of the RTA, the level of external
tariff adopted by the members following the formation of the RTA relative to the previous tariff level, the
degree of complementarity, differences in unit costs, and the level of tariffs prevailing outside the RTA. The
greater the geographical extension, the greater are the opportunities for trade creation. A greater geographical
extension means a greater extension of the market and thus a greater scope for trade specialization and the
generation of economies of scale. A greater geographical area can also involve a greater stock of natural
resources implying the possibility of a more diversified export base. The relationship between the degree of
complementarity and that of trade diversion and trade creation effects of an RTA can be seen from different
perspectives. A low degree of complementarity in the production structures of States forming an RTA reduces
the scope for trade diversion. Notwithstanding the formation of the RTA, member States will continue to trade
with the rest of the world. In the same way, a high degree of complementarity may enhance intraregional trade
3
careful to note that customs unions do not fulfil all the conditions of a Paretian Optimum. As
a result the, a priori, welfare effects of RTAs are not, aside from the static case, known with
certainty.5
In the static case, trade creation refers to the substitution of a high-cost domestic
source by a lower-cost source in a partner country.6 Trade diversion results from the
substitution away from a lower-cost producer outside the customs area to a higher cost
supplier within the customs union area.
Customs unions and in general RTAs can exemplify cases where the principle of
comparative advantage operates within a confined geographical area when trade creation is
greater than trade diversion.7 In this sense, according to neo-classical theory, customs unions
and RTAs are an approximation, and thus a special case, of a full-fledged, global, free trade
situation.8
The introduction of dynamic factors, such as the existence of spillover effects, does
not alter the validity of the basic analysis. Indeed, it can be shown that if knowledge is freely
mobile and equally accessible among countries, patterns of specialization are determined by
comparative advantage.9 That is, by construction in mainstream theory, static and dynamic
trade theories are one and the same thing when free trade (implying laissez-faire and laissezpasser) prevails.
While as indicated above, the analysis of trade creation and trade diversion referred to
the formation of a customs union, the current trade literature uses both concepts to analyze
the static welfare creation and diversion effects of the formation of a free trade area or to
estimate the impact of tariff reductions.
II. Trade policies of Central American countries
Central American countries have followed a three-tiered trade policy strategy
consisting of: (a) the slow but steady consolidation of their intraregional trade integration
policy; (b) the maintenance of existing trade preferences and an emerging tendency to
participate in preferential trade agreements; and (c) their adhesion and increasing compliance
with multilateral agreements.
widening the possibilities for trade diversion. Contrarily, it may also be stated that countries with a low degree
of complementarity are also more vulnerable to asymmetric shocks, reducing thus the possibilities for trade.’
5
See, Lipsey, R.G & Lancaster, K. (1956-1957) The General Theory of Second Best. The Review of Economic
Studies, Vol. 24, No1., pp.11-32.
6
This case assumes a discriminatory tariff reduction giving a member of the RTA a comparative cost advantage
over a non-member by reducing its production costs. As a result, the member increases its production efficiency
over the non-member.
7
RTAs maximise welfare when their number equals one, that is, when the geographical area of the RTA
coincides with that of the world.
8
In the limit, when a given geographical area coincides with that of the world there is only scope for trade
creation. Using a very simple model where the world is divided into regional blocs (i.e., customs union).
9
See Helpman (2004). Trade creation can be enhanced when an RTA member faces high tariffs from the rest of
the world in products where it has decreasing costs or when, due to size considerations, the scale of production
is too small to yield an optimum scale of production. The existence of economies of scales can lead to trade
creation through production, consumption and cost reduction effects. The production effect allows the transfer
of production to the lower cost trade partner. The consumption effect refers to the gain in the consumer surplus
due to a decline in price. The cost reduction effect denotes a change to cheaper sources of supply.
4
The regional integration process which has produced an increase in intraregional trade
(see tables 1 and 2 below) was originally guided by the Central American countries’ objective
to seek conformation to a Central American Common Market (CACM). This objective was
adopted in 1960 following a series of attempts to increase the existing level of integration
among these economies. These attempts included the formation of a customs and monetary
union. Initially as it was delineated, the CACM strategy sought to integrate the countries
commercially with the long-term view of pursuing the more complex goal of economic
integration.
Although Central American countries made some progress especially during the
1980s in the reduction of internal and external trade barriers, commercial integration among
its member States remained a distant and, according to some, an impossible goal to attain.
Table 1
Central American Isthmus: Intraregional exports (000'of US$)
1995
1996
1997
1998
1999
2000
2001
2002
2003
Costa Rica
349,649
411,121
448,499
961,855
576,531
622,281
661,420
686,387
765,678
El Salvador
415,747
455,034
578,432
616,558
626,870
740,572
722,345
739,165
746,138
Guatemala
554,643
577,878
683,275
748,486
789,790
815,213
1,059,278
873,591
1,089,219
Honduras
117,931
138,705
159,444
305,259
298,935
310,650
211,038
240,541
252,196
Nicaragua
83,005
101,162
121,263
122,496
145,037
164,207
173,867
270,059
222,743
Panama
83,386
76,436
100,521
111,011
104,018
111,596
123,139
114,210
94,295
2,437,163
2,652,923
2,827,948
2,809,743
3,075,974
2,541,181
2,764,519
2,951,087
2,923,953
3,170,269
Central America
1,520,975 1,683,900 1,990,913 2,754,654
Central American
Isthmus
1,604,361 1,760,336 2,091,434 2,865,665
Source: Banco de Datos Estadísticos de Comercio Exterior, CEPAL, 2007
Table 2
Central American Isthmus
Intraregional exports as a percentage of the total, 1995-2003
1995
1996
1997
1998
1999
2000
2001
2002
2003
Costa Rica
12.94
El
Salvador
Guatemala
42.21
44.43
42.55
49.05
53.85
55.21
59.53
59.91
59.46
28.84
28.46
29.15
28.99
32.13
30.20
43.91
39.23
41.35
Honduras
9.67
10.54
11.03
19.92
25.67
23.50
16.10
25.01
25.42
Nicaragua
16.30
15.32
18.19
22.16
28.53
26.09
32.67
42.54
36.81
Panama
14.56
13.69
15.60
16.06
14.71
14.47
15.24
15.16
11.81
12.06
11.52
18.67
9.18
11.34
14.03
13.87
13.20
Source: Base de datos estadísticos de comercio exterior (CEPAL), 2007
For one thing, the high levels of economic growth that the region experienced in the
1960s and 1970s came to a halt. At the same time, social and political discontent planted the
seeds of a political crisis that was marked by the assassination of Joaquín Chamorro (January
1978).10 Both Nicaragua (1978-1979) and El Salvador (1980-1985) were to some extent
ravaged by the effects of civil war while Guatemala struggled with civil and military strife
brought about partly by the complex ethnic composition of the country. For their part,
Honduras and Costa Rica did not suffer domestic armed conflict but the latter was a center
for anti-Sandinista operations. Costa Rica does not have a standing army since 1954 and has
always considered itself to be an exception to the problems faced by other Central American
countries. This has often materialized into a status of exception and indeed of exclusion by
10
Joaquín Chamorro was the owner of a well-known Nicaraguan free press newspaper
5
choice, which has not necessarily been beneficial to the Central American integration
process.
Low growth, high levels of indebtedness and the internal situation of Central America
shifted the whole integration process to a low gear and indeed it became a ‘second rank’
priority goal. The 1990s saw a renewed impetus to advance towards Central American unity.
It was the product of the efforts of Guatemala and especially El Salvador.
This initiative was not unexpected. Throughout Central American history, El Salvador
has often played the role of ‘leader’, ‘initiator’, and ‘avant-garde’ member State. El Salvador
was the first country to implement the Central American common external tariff parameters,
the first Central American country to adopt market-oriented economic policies, to engage and
also to applaud initiatives such as the one engineered by Michael Porter to create competitive
clusters in Central America.
While in some cases this attitude has proved to be a positive one as the country
becomes endowed with a certain dynamism and vision for the future, it also led to the
adoption of ‘radical’ measures. Two such radical measures have been the proposal for the
adoption of a zero tariff rate on inputs, which is part of the Central American parameters of
the common external tariff, and the decision to dollarize the economy in 2001. The 0 per cent
tariff rate did create some opposition from the entrepreneurial class. The most fundamental
argument was that it deprived them of any negotiating leverage. The arguments sustaining the
decision to dollarize were never clearly stated. The main consequence of this radicalism has
been to pull the rest of Central American countries in that direction. In some cases it has
united Central American countries while in some others it has created friction at the regional
level.
The 1990s push for integration led by El Salvador and Guatemala focused mainly on
the implementation of the CACM tariff parameters. The aim of a more complete commercial
and eventually economic integration remained in the countries’ agendas but in most cases
only at the formal level. Commercial and economic integration other than the common
external tariff became part of the regular political speeches and in many cases the main
subject of the Central American heads of government meetings.
Table 3
Degree of Convergence Criteria Compliance for Central American Countries
Country
1997
1998
2000
2005
Average
Costa Rica
63
63
38
63
57
El Salvador
63
63
63
63
63
Guatemala
63
63
50
38
54
Honduras
38
25
50
50
41
Nicaragua
50
25
50
38
41
Central
55
48
50
51
America
Dominican
…
…
…
75
…
Republic
Source: Consejo Monetario Centroamericano. Informe Económico Regional. Several Issues.
The most that this attempt at a deeper level of integration accomplished was the
gradual adoption of legal texts aiming at the harmonization of trade legislation among Central
6
American countries and compliance with multilateral trade obligations. These legal texts
include the Central American Agreement on Normalization Measures, Metrology and
Proceedings (1999); the Agreement on Sanitary and Phytosanitary Measures and Proceedings
(1999); the Central American Agreement on Safeguard Measures (1996); and the Protocol to
the Central American Agreement for the Protection of Industrial Property (1999). More
recently Central American countries have signed several additional agreements comprising
those pertaining to the rules origin on merchandise trade (2006), and merchandise customs
valuation (2004). Since 2002 Central American countries have also revised the regular
computation of convergence indicators (see table 3 above).11
The Central American common external tariff was perfected between 1992 and 1996.
It consisted of a 0 per cent tariff floor for capital goods and a 15 per cent ceiling applied to
final consumer goods (see table 4 below). It also distinguishes between inputs and final
goods. All Central American countries have adopted different tariff reduction calendars for
achieving the parameters of the CACM (0 per cent and 15 per cent). The last Central
American country to adopt it was Honduras in 2001. Currently the Central American
common external tariff covers 95 per cent of the entire tariff line universe.
On the one hand, the tariff structure is ‘protectionist’ as final goods are taxed at higher
rates than inputs. The evidence on effective rates of protection shows that the implementation
of the common external tariff parameters reduced the overall rate of effective protection
slightly (see table 5) and increased the rate of effective protection for some sectors.
On the other hand, the tariff structure does not necessarily favor the development of
intraregional trade because inputs imported from the Central American region are taxed at
rates that exceed those for inputs produced outside Central America. Similarly, intraregional
capital goods had to pay tariffs ranging from 5 per cent to 10 per cent whereas extraregional
capital goods pay a nominal tariff rate of 0 per cent.
Table 4
Central America
The Common External Tariff Parameters and the Average Tariff Rate (percentages)
Costa Rica
El Salvador Guatemala
Honduras Nicaragua
Capital goods
0
0
0
1
0
Raw materials
0
0
0
1
0
Intermediate goods
5-10
5-10
5-10
5-10
5
Final goods
15
15
15
15
15
Average simple tariff
7.0
7.4
7.0
7.1
5.9
rate
Note: 0% applies to capital goods and raw materials produced outside the Central American region. 5%
applies to raw materials produced in Central America. 10% applies to intermediate inputs produced in Central
America. 15% applies to final goods.
Source: Based on information provided by the Ministerio de Comercio de Costa Rica and the WTO.
11
The convergence criteria refer to a set of well-defined parameters that establish a reference framework for
macroeconomic policy and the facilitation of regional integration. It includes, among others, the rate of growth
of real GDP, the inflation rate, the real effective exchange rate, real lending rate, fiscal and external deficit as
percentages of GDP and the debt stock to GDP ratio. The Dominican Republic became a member of the Consejo
Monetario Centroamericano in 2002. See, Informe Economico Regional 2005. Secretaria Ejecutiva del Consejo
Monetario Centroamericano. San Jose, Costa Rica.
7
Table 5
Average Effective Protection Rate and Dispersion for the Central American
Common External Tariff
Country
Average rate of protection
Dispersion
Costa Rica
El Salvador
Guatemala
Nicaragua
10.8
9.6
12.9
8.3
8.7
8.2
10.1
6.9
14.2
8.7
10.6
6.4
11.0
7.3
9.3
5.8
Source: Author’s own calculations based on official data.
The common external tariff also has a number of exceptions. Most of them are
contained under the so-called list A. Presently list A includes two products, sugar cane and
coffee not roasted, whose trade restrictions apply to all Central American countries and a
series of bilateral restrictions. The latter are summarized in table 6 below.
Country
(ies)imposing
restrictions
El Salvador
and
Guatemala
El Salvador
Nicaragua
Guatemala
Honduras
Guatemala
El Salvador
Honduras
Nicaragua
Costa Rica
Table 6
Bilateral Trade Restrictions within Central America, 2006
Partner country
Product
Honduras
Oranges
Costa Rica
El Salvador
El Salvador
Costa Rica
Costa Rica
Rest of Central American countries
Rest of Central American countries
Rest of Central American countries
Rest of Central American countries
Rest of Central American countries
Rice
Pharmaceutical products
Absence of uniform application of
rules of origin to all products
Meat and meat products
Sugar
Sugar
Sugar
Sugar
Sugar and coffee (not roasted)
Source: Ministerio de Comercio de Costa Rica (2006)
Other exceptions not included in list A, but agreed upon by the Central American
countries, include tires, footwear, and textiles and apparel. The push for intraregional free
trade was accompanied by regulations concerning safeguard clauses and rules of origin. Most
of these were eliminated because they were used as a means to target the development of
specific firms and industries. In addition, Central American countries have a tendency to
impose ad hoc trade restrictions often as a result of political retaliation or pressure and
political lobbying of a specific group of producers engaged in a given activity. Central
American countries decided to publish these restrictions periodically as an attempt to increase
the transparency of the Central American integration process. The Ministry of Commerce of
Costa Rica used to publish the list of restrictions on its webpage. The list of restrictions is
now available to the general public in the Secretaria de Integracion Economica
Centroamericana (SIECA) webpage as well as in the webpage of the Ministry of Commerce
8
of Costa Rica. The last edition shows that there are several reported and identified obstacles
to intraregional trade. The obstacles include non-tariff and tax barriers (sanitary and
phytosanitary measures), compensatory tax measures and other arbitrary charges. These also
comprise the lack of uniform application of Central American rules of origin.
More recently the discourse on integration has changed and Central American
countries refer to the process of integration as a customs union and not a common market.
The framework for the negotiation of a customs union was approved in June 2004. The
customs union aims at harmonizing trade taxes and at defining a common foreign trade
policy. Currently not all tariff items have been harmonized (according to official sources, if
vehicles are excluded 94 per cent of all tariff lines have in fact been harmonized).
In 2001, the World Trade Organization (WTO) claimed that Central American
countries used different tariff codes which in fact invalidated the common external tariff. The
report stated that Guatemala used the Central American Uniform Customs Code III
(CAUCA) (1999), Costa Rica and Nicaragua used an earlier version of 1993 and Honduras
applied the domestic legislation. More recently, Central American countries have undertaken
efforts to harmonize their customs legislation and have approved the new Central American
Uniform Customs Code in 2002 (CAUCA, 2002), which is currently being implemented in El
Salvador, Guatemala and Nicaragua. Costa Rica and Honduras are in the process of adopting
this new piece of legislation. In 2006, Central American countries undertook further
modifications of the Central American Customs Code.
Table 7
Nominal Tariff Rates of Central American Countries, (2001)
Costa Rica El Salvador Guatemala Nicaragua
Total
7.0
7.4
7.0
5.9
Agricultural products
14.8
12.0
10.2
8.7
12.4
21.9
29.9
Live animals; animal products
11.0
13.2
26.9
67.4
Dairy produce
12.7
12.5
Coffee and tea
13.5
13.4
13.4
14.8
Fruit and vegetables
12.0
11.0
Cereals
9.4
24.8
19.1
13.6
Beverages and spirits
10.0
7.9
11.2
Tobacco
Non-agricultural products
5.6
6.7
6.4
Fish and fish products
10.4
9.8
Textiles and clothing
10.3
17.8
16.0
12.2
Transport equipment
8.6
Source: WTO and MAGIC.
9
III. Central American preferential trading arrangements and free trade agreements
At the same time that Central American countries have re-shaped their integration
efforts, they have also sought to solidify existing preferential trade agreements and to engage
in bilateral free trade agreements.
Central American countries benefit from unilateral trade preferences from the United
States and Europe within the frameworks of the GSP, the CBI and the latter’s most recent
modification, the Law of Commerce and Development, which expands the preferences
granted to Central American countries and others for products such as footwear and textiles
that had been originally excluded from the CBI.12
The CBI (1983) gave preferential access to a gamut of export products from the
Caribbean (including the countries belonging to the Caribbean Community - CARICOM) 13
and Central American countries in order to enhance the development and growth of these
economies. Initially, the CBI was put in place for a period of 12 years ending in September
1995. The law excluded textiles and garments, leather products, canned tuna, and petroleum
and its derivatives.
On account of the disadvantage in the competitive positioning of Caribbean and Latin
American countries after the entry into force of the North American Free Trade Agreement
(NAFTA) (1994) and the adverse consequences of Hurricane Mitch for Central American
countries, the CBI was expanded in May 2000 to include the products that had been excluded
in the previous legislation. The new legislation, titled the Law of Commerce and
Development, that entered into force on October 2000 provides the same tariff treatment to
canned tuna and leather footwear as received by Mexico. In the case of textiles, the situation
is more complex.
The law allows free of tariff market access and quotas to garments that are fabricated
in the region using United States fabric and string. It also permits free market access for
garments which are cut in the countries that benefit from the CBI but which use United States
fabric and strings. Furthermore, it allows free access to the United States market of 250
million square meters of knitted garments made with regional fabric but United States strings.
Finally, it allows the free market access of 4.2 million square meters of knitted shirts made
with regional fabric and United States strings. The quotas of 250 and 4.2 million square
meters were distributed among Central American and Caribbean economies as shown in table
8 below.
12
The Generalized System of Preferences (GSP) was adopted in 1974 and grants trade preferences to
manufactured and semi-manufactured goods and to some agricultural products. Textiles are excluded from the
GSP. There are 16 different GSP schemes granted by 28 developed countries.
13
The treaty establishing CARICOM (1973) provided for the creation of two distinct entities: the Caribbean
Community and the Common Market. The Caribbean Community (CARICOM) has 15 member States (Antigua
and Barbuda, The Bahamas, Barbados, Belize, Dominica, Grenada, Guyana, Haiti, Jamaica, Montserrat, St.
Kitts and Nevis, St. Lucia, St. Vincent and the Grenadines, Suriname and Trinidad and Tobago). The Bahamas
is not a member State of the Common Market. CARICOM has five associate members (Anguilla, Bermuda,
British Virgin Islands, Cayman Islands, and Turks and Caicos Islands). Aruba, Mexico, Venezuela, Colombia,
the Netherlands Antilles, the Dominican Republic, and Puerto Rico are observers. Six member States are
considered more developed countries (MDCs) (Bahamas, Barbados, Guyana, Jamaica, Suriname and Trinidad
and Tobago) and eight countries are considered less developed countries (LDCs) (Antigua and Barbuda, Belize,
Dominica, Grenada, Haiti, St. Lucia, St. Kitts and Nevis, and St. Vincent and the Grenadines). .
10
Table 8
Market Share of Quota Distribution for Garments and Knitted Shirts among CBI
Beneficiary Countries
Country or regional bloc Market share of 250 million Market share of 4.2 million
knitted garments
square meters of knitted
shirts.
CARICOM (Caribbean
4.9
5
Community)
Costa Rica
7.5
1.5
El Salvador
21.3
20.8
Guatemala
19.4
11.2
Honduras
25.2
42
Nicaragua
2.0
4
Panama
1.5
1
Dominican Republic
18.1
10
Total
100
100
Source: On the basis of official data.
The Law of Commerce and Development extends the categories of garments that have
preferential access to the United States market. The other categories are ‘807 plus’,
guaranteed access level and specific limit. The category ‘807 plus’ includes products made
with United States fabric and strings, which have to pay tariff upon entry in the United States
territory only on the value added and with no quota restrictions. The guaranteed access level
category includes textile products manufactured with fabric made and cut in the United
States. Exports that fall under the category of guaranteed access levels are subject to quota
restrictions and tariffs on their value added. Finally, specific limit export products are those
textile products produced with fabric from any country. This category also includes products
that are imported by the United States from a third country and that may be re-exported after
undergoing a transformation process. The precise impact of the extended CBI initiative on
the export and performance of the beneficiary countries remains uncertain and will depend on
the unit price of garments, their export capacity and their potential to fully use the assigned
quotas to enter the United States market.
The efforts of Central American countries to obtain extended CBI preferences reflect
these countries’ dependency on their textile exports. The free trade zone regime grants
income tax exemption (see table 10). At the Doha Ministerial Meeting (November 2001),
member countries agreed to extend the right of countries to maintain the free trade zone
regime until the year 2007. Free trade zone activities are a major foreign currency earner,
represent on average for Central America more than 65 per cent of total exports but generate
little value added. Estimations for Central America undertaken by the Economic Commission
for Latin America and the Caribbean (ECLAC) show that free trade zones contribute at most
2 per cent to total value added. Costa Rica is one of the least competitive exporters in the free
trade zones.
In the case of Central America, apparel and textile became the main export product
during the 1990s. At the country level, it represented, in 1999, 21 per cent, 55 per cent, 81 per
cent and 83 per cent of the total exports to the United States for Costa Rica, Guatemala,
Honduras and El Salvador, respectively (see table 9). The composition of commerce has not
changed substantially since. In other words, Central American countries have become highly
specialized in exporting apparel and textiles. Central American countries as well as the
11
Dominican Republic and some other CARICOM economies have granted export subsidies in
the form of tax holidays to further promote the development of free trade zone exports to the
United States. The exemptions include the exoneration from the obligation to pay income
taxes which, depending on the case, may be granted for a specific or an indefinite period of
time (see table 10 below).14
Table 9
Central America: Main Export Products as a Percentage of the Total, 1990 – 2005
Countries
Costa Rica
El Salvador
Guatemala
Honduras
Average
Products
Machinery
Fruits and nuts
Textiles and apparel
Subtotal
Textiles and apparel
Coffee and tea
Electrical machinery
Fish and mollusks
Subtotal
Textiles and apparel
Coffee
Fruits and nuts
Fossil fuels
Subtotal
Textiles and apparel
Fish and mollusks
Fruits and nuts
Coffee and tea
Subtotal
Textiles and apparel
Fish and mollusks
Fruits and nuts
Coffee and tea
Years
1990
4.6
22.8
37.4
64.8
22.8
36.1
10.3
5.2
74.4
24
23.7
15.3
2.9
65.9
22.9
12.6
12
9.5
57
26.8
8.9
12.7
23.1
1993
5.7
22.4
41.2
69.3
51.5
20.2
6.5
4.3
82.5
45.8
12.9
11.6
2
72.3
55.6
9.9
14.6
3.2
83.3
48.5
7.1
11.3
12.1
1996
8.1
20
35.5
63.6
67.2
4.9
3.1
3.7
78.9
47.7
15.6
10.8
3.6
77.7
69
5.7
10.9
2.2
87.8
54.9
4.7
10.3
7.6
1999
43.9
13
20.8
77.7
82.8
4.2
1.9
1.7
90.6
54.9
13.4
8.6
4.2
81.1
80.9
4
1.9
1.9
88.7
59.9
2.9
7.2
6.5
2005
38
15
8
61
81
2
1
0.5
84.5
84.5
9.2
12.2
4.5
84
71.2
4.1
4.3
1.7
81.3
54.0
7.0
10.2
5.7
Source: Module to Analyse the Growth of International Commerce (MAGIC, 2001); Markus Rodlauer and Alfred
Schipke, eds. Central America: Global Integration and Regional Cooperation. IMF Occasional Paper 243. July
2005.
14
The World Trade Organization considers this preferential fiscal treatment an export subsidy. The WTOGATT texts forbid it under Articles I and III of the Agreement on Subsidies and Countervailing Measures
(WTO, 1999c, pp.231-233 and pp.265-267). However, due to the granting of longer periods to developing
countries for implementing obligations, these countries had until the year 2003 to dismantle these subsidies. The
exception was the group of countries whose GNP was below US$1000 per capita (see the Agreement on
Subsidies and Countervailing Measures, Annex VII, WTO, 1999c, p. 274). The Doha Ministerial Conference
(November, 2001) extended the time and the per capita threshold. These developments indicate the degree to
which developing countries have become dependent on this foreign exchange earning activity.
12
Table 10
Latin America and the Caribbean: Income Tax Exemption
for Firms Operating in Free Trade Zones
(2000)
Country
Costa Rica
El Salvador
Guatemala
Honduras
Nicaragua
Dominican Republic
Brazil
Chile
Mexico
Percentage of income tax
exoneration
100/50
100
100
100
100/60
100
100
0
0
Years of exemption
8-12/4-6
Indefinite
5-15
Indefinite
10/11
15-20
3-10
0
0
Source: ECLAC on the basis of official data.
Besides these general preferential agreements, Central American countries have
signed or are in the process of negotiating trade agreements with several countries including
Chile, Mexico, Panama, the Dominican Republic, Canada, Trinidad and Tobago, and more
recently negotiated a free trade agreement with the United States and are in the process of
negotiating another trade agreement with the European Union (see table 11 below).
Table 11
Central American Trade Agreements
Central American country (ies)
Trade partner
Costa Rica
Mexico
All Central American Countries
Dominican Republic
All Central American Countries
Chile
Costa Rica
Trinidad and Tobago
Costa Rica
CARICOM
Nicaragua
Mexico
El Salvador, Guatemala and Mexico
Honduras
Guatemala, El Salvador and Comunidad Andina de Naciones
Honduras
Costa-Rica
Canada
Central American Countries
United States
Central American Countries
European Union
Year
1994
1998
1999
2002
2003
1998
2000
Ongoing negotiations
2001
2005
Ongoing
negotiations
A key feature of some of these trade agreements is the incorporation of asymmetric
clauses (i.e., special and differential treatment). The specification of these asymmetric clauses
follows WTO principles and includes:
•
•
•
A differential tariff rate base as the starting point of the tariff phase-out.
Longer periods for the implementation of tariff phase-out
Special treatment provided to key sectors (agriculture, textiles and
pharmaceutical products).
13
•
Wider application of the zero-tariff rate in the case of the more developed
country.
The economic rationale underlying these free trade agreements and negotiations, with
the exception of the negotiations with the United States, is unclear. Most of these countries
account for a small share of Central America’s imports and exports and are not thus a
priority. Also these are not countries that provide crucial or fundamental inputs or products
for the economy of Central American countries. At most it can be speculated that Central
American countries have entered into these trade negotiations in the belief that a policy of
free trade enhances welfare and is conducive to growth or have political reasons for
undertaking these agreements.
IV. Main features of the CAFTA-Dominican Republic-United States free trade
agreement
The free trade agreement between Central America and the Dominican Republic and
the United States (CAFTA) has been ratified by all Central American countries (with the
exception of Costa Rica) and the Dominican Republic The agreement has for all purposes the
same structure and content as the Chile-United States free trade agreement (2004). The
agreement is labeled WTO plus. That is, its provisions are more outward and free market
oriented than the ones currently in force at the WTO.
CAFTA comprises 22 chapters dealing with trade in goods (in particular, agricultural
commodities, textiles and apparel) services, investment, labor and environment.
Trade in goods (chapter 3 of the agreement) is governed by the principle of nondiscrimination and provides for the phasing out and elimination of tariffs among the signatory
countries. While most of the tariffs were programmed to be eliminated when the agreement
entered into force, the text also contemplates the tariff phasing out for some products over a
period of 10 or more years.
Table 12
Tariff phase out contemplated by CAFTA (as % of imports corresponding to 2002)
Tariff
Costa Dominican El
Guatemala Honduras Nicaragua United
phase out Rica Republic
Salvador
States
Immediate 40.4
58.3
20.9
16.3
11.9
10.4
76.3
Five years 2.3
3.7
4.6
1.5
3.3
3.6
0.0
Ten years 6.8
7.6
6.7
5.4
9.2
8.1
0.0
Fifteen
0.6
0.8
0.4
0.4
1.4
1.2
0.0
years
Duty free 39.7
15.5
55.0
61.9
50.0
57.0
22.2
exports a/
2.6
0.7
7.4
7.3
2.5
0.0
Exceptions 3.6
to
the
tariff
phase out
Note: a/ refers to the percentage of exports that enters the United States duty free for Central America. In the case
of the United States, it refers to the exports of the United States that enter Central America duty free.
Source: Organisation of American States (OAS) (2005) Examination of Asymmetrical Treatment Provided to
Smaller Economies under the WTO Agreements and the DR-CAFTA.
14
In the case of agriculture, the text allows tariff phase-out periods according to
different products and countries and ranging from immediate to 20 years’ time. In some cases
the phase-out period will be provided through the implementation and expansion of existing
tariff-rate quotas. According to the text of the agreement, tariff rate-quotas will be
administered ‘in a manner that is transparent, non-discriminatory, responsive to market
conditions and minimally burdensome on trade and allows importers to fully utilize import
quotas.’ Some of the United States agricultural products such as beef, cotton, wheat,
soybeans, fruits and vegetables will gain duty free access with the entry of force of the
agreement. Others will face a tariff phase-out of 15 years.
The agreement does not allow signatory member countries to apply export subsidies,
but it permits the imposition of safeguards. In fact, chapter 3 of the agreement allows the
imposition of a ‘transitional agricultural safeguard mechanism’ allowing a country to impose
a temporary additional duty on specified agricultural products if imports exceed an
established volume ‘trigger.’ That is, safeguards are applied when the imports of given
products experience import surges. The safeguard cannot be applied for a period exceeding
four years and can be used once during the transition period.
In the particular case of sugar, the text of the agreement provides greater market
access for Central American countries and the Dominican Republic. Indeed the agreement
contemplates an increase in the zero-tariff import quotas of sugar from Central American
countries from 99,000 to 140,000 metric tons in the first 15 years of the agreement.
In the manufacturing sector, the agreement contemplates the elimination of most tariff
lines upon the entry into force of the agreement. Still, the agreement allows for asymmetrical
treatment as the United States liberalizes close to 100 per cent of its manufacturing products
while Central America liberalizes close to 80 per cent of its manufacturing products. As in
the agricultural section, a safeguard clause is introduced to protect Central America and the
Dominican Republic from import surges.
For textiles and manufacturing, the text provisions grant duty free treatment to apparel
using yarn and fabric from the United States, Central America and the Dominican Republic.
In this regard, the Dominican Republic-CAFTA agreement expands the CBI legislation
which, in its most recent form, allowed duty and quota free treatment for apparel and textile
products assembled in Central America from United States inputs.
The treaty also contemplates that the provision of reciprocal duty free access for all
goods should be retroactive to 1January 2004. This retroactive provision will benefit every
company doing business in Central America and the Dominican Republic. It also includes a
cumulation rule whereby a limited amount of inputs from Mexico and Canada will qualify for
duty free treatment. The cumulation rule is subject to a $100 million annual cap, which can
expand to $200 million.
As a result of the agreement some of the major exports of the United States such as
yarns, fabrics, communications and information technology will gain immediate access to
Central America and the Dominican Republic. Central America and the Dominican Republic
will benefit from immediate duty free access to most non-agricultural exports.
The CAFTA text contains provisions on services derived from the WTO General
Agreement on Trade in Services (GATS) and NAFTA. The provisions include a chapter on
15
general measures pertaining to cross-border trade in services and specific chapters on
financial services, telecommunications and electronic commerce. However, contrarily to
WTO rules, the services provisions require the granting of national and most-favored-nation
treatment (i.e. non-discriminatory treatment) to service suppliers of contracting parties. It also
‘prohibits the parties from requiring firms to establish a local presence as a condition for
supplying a service on a cross-border basis’. Finally, it bars specific types of market access
restrictions upon the supply of services.
V. The investment chapter
The investment chapter is one of the most relevant of the agreement. Free trade
agreements are envisaged to improve trade flows and most importantly to generate a greater
and more stable volume of investment flows. The chapter is also to some extent controversial
for several reasons. Its main objective, besides increasing the flow of investment, is to
provide protection for foreign investors or more to the point, ‘a secure, predictable, legal
framework for foreign investors’.
To this end, the chapter accords foreign investors national treatment and mostfavored-nation treatment. Both national and most-favored nation provisions refer to the
equality of treatment accorded to national and foreign investors in ‘like circumstances’.15 It
also allows free mobility of capital, significantly expands the capacity of the definition of
investment to include tangible and intangible assets. Moreover, investment flows are not tied
to performance requirements such as local content, increased foreign exchange flows or the
transfer of technology.
The most controversial provisions of the investment chapter are those related to the
issues of expropriation and compensation. The free trade agreements prohibit the direct or
indirect expropriation (or nationalization). Direct expropriation is a well-defined term which
refers to the nationalization, transfer of title or seizure of private property by the host
government. 16
However, the term indirect expropriation (or nationalization) is not clearly defined as
a result can lead to different interpretations.17 The legal texts mention the phrase ‘indirect
expropriation by measures equivalent (or tantamount) to expropriation or nationalization’.18
In order to determine whether an action constitutes ‘indirect expropriation’ it needs to be
assessed on a case-by-case basis. The evidence includes, among others, the economic impact
of government action, the degree of interference of government action with investmentbacked expectations.19 A current concern regarding the investment chapter provisions is that
15
See also, U.S.-Chile Free Trade Agreement. The American Journal of International Law, Vol.97, No3., (July,
2003), pp. 696-699.
16
See, Expropriation in International Law by Professor B.A. Wortley. Mimeo. July 1947.
17
In some court cases the term ‘creeping expropriation’ which is a form of indirect expropriation is also utilized.
18
The issue of indirect expropriation was amply debated in the case of Metalcad Corporation vs. Mexico and
Mexico vs. Metalcad Corporation in 2001 within the NAFTA framework. The tribunal that analysed the case
decided that the term expropriation meant “not only open, deliberate, and acknowledged takings of
property…but also covert or incidental interference with the use of property which has the effect of depriving
the owner of the actual or expected benefits of property…”See, Dodge, W.S. (2001) Metalcad Corporation v.
Mexico. ICSID Case No ARB (AF)/97/1.40 ILM 36 (2001), and Mexico v. Metalcad Corporation, 2001
B.C.S.C. 664. The American Journal of International Law, Vol. 95, No.4. (Oct., 2001), pp. 910-919.
19
The exceptions include the case where expropriation or nationalization are carried out, among other reasons,
for a public purpose, in a non-discriminatory manner, or in accordance with due process of law.
16
these can be used in lieu of insurance against risk that firms normally assume when setting up
their operations in a foreign country.
VI. Labor and environment
As with other recent trade agreements negotiated by the United States, the CAFTA
text contains chapters on labour and the environment (chapters 16 and 17).
According to the general principles of the labour chapter, the signatory parties agree
to recognize and protect the labor principles contained in the International Labour
Organisation (ILO) declaration. The parties recognize and accept each other’s right to
establish their own laws and to implement fair, equitable and transparent procedures in the
enforcement of their own laws.
The labour provisions establish a mechanism for dispute settlement and a Labour
Affairs Council to oversee the chapter’s implementation and to provide a forum for
consultations and cooperation on labour matters. Cooperation priorities and financing are
discussed in a separate annex to the chapter.
The environmental chapter is based on the North American Agreement on
Environmental Cooperation as well as the environmental provisions of other free trade
agreements signed by the United States, including those signed with Jordan, Chile,
Singapore, Australia and Morocco. However, the CAFTA text provides in addition a ‘process
for public submissions on environmental enforcement matters’.
According to the general principles of the chapter on environment, the parties must
ensure that their laws provide adequate environmental protection. Environmental protection
can also be guaranteed through voluntary and market-based mechanisms.
Each party has the right to establish its own environmental laws, exercise discretion in
regulatory, prosecutorial and compliance matters; and allocate enforcement resources. In
terms of procedural matters, the text establishes that judicial administrative proceedings
should be available to sanction or remedy the violations of its environmental laws and that
such proceedings are to be fair, equitable, transparent and open to the public.
As in the case of labour, the CAFTA text establishes an Environmental Affairs
Council to oversee the implementation and operation of the environmental provisions. The
text contemplates a public submissions process, which is a way to guarantee the inclusion of
the points of view of civil society, on matters related to environment.
Finally, the chapter ‘envisions the benchmarking of environmental cooperation
activities and inputs from international organizations in evaluating progress and makes
explicit reference to the right of member countries to protect and conserve genetic resources’.
17
VII. The major stylized facts of regional trade agreements
There are currently seven stylized facts that capture the current state of our knowledge
of regional trade agreements in Latin America and the Caribbean. These will provide the
basis on which to assess the potential effects of CAFTA on Central American countries and
the Dominican Republic.
First, there is a coexistence of different regional trading arrangements corresponding
to two demarcated orientations in regionalism: the first and second regionalisms. The former
includes groupings such as the Latin American Free Trade Association (LAFTA) later to be
renamed Latin American Integration Association (LAIA) (1980), the Caribbean Free Trade
Association (CARIFTA) later to be known as CARICOM (1973) and the CACM(1960). The
‘first regionalism’ flourished in the 1960s and 1970s and its objective was the creation of a
regional market large enough to overcome the constraints imposed by the small size of its
individual members. The first regionalism is associated in some instances with protectionism
and import substitution. The ‘second regionalism’ was propelled by the adhesion of the
United States to the General Agreement on Tariffs and Trade (GATT) article XXIV, focused
initially on developed economies, and is associated with outward orientation and with the
process of using regional agreements as building blocs to make effective multilateral
agreements such as the WTO. Trade agreements corresponding to the ‘second regionalism’
include NAFTA (1992), the G-3 (Colombia, Mexico and Venezuela, 1993), and, to a lesser
extent, the Southern Cone Common Market (Mercosur) (1991) and the Andean Community
(1996).
Second, independently of the type of orientation followed, regional schemes have
achieved at most a level of integration corresponding to an imperfect customs union and a
less than full-fledged free trade area. Deeper integration efforts, including the intentions of
forming an economic and political union, which in some cases have been voiced for decades,
have not fructified. The two examples, those of the CACM and CARICOM illustrate this
point. Both the CACM and CARICOM were formed with the ultimate intention of arriving at
an economic union. In the former case, the Central American countries agreed on the
implementation of a common external tariff only 40 years after the Central American Treaty
of Integration was signed and even now more than 30 per cent of all tariff lines are not yet
harmonized. In the case of CARICOM, two members have not yet implemented the fourth
phase of the Common External Tariff. In both schemes there are exceptions to the application
of the Common External Tariff that are not clearly specified. In addition, tariff and non-tariff
trade barriers continue.
Third, independently of the data set used, in the majority of regional integration
agreements, there has been an increase in intraregional trade. In the case of CARICOM, the
CARICOM Secretariat (2003) reported an increase in intraregional exports from 10 per cent
to 20 per cent between 1980 and 2001.20 Intraregional imports have also risen during the
same period, accounting for 7 per cent and 11 per cent of the total between 1985 and 2000.
Finally, according to the United Nations Conference on Trade and Development (UNCTAD)
(2002), intraregional exports have increased from 5 per cent to 13 per cent of the total
between 1980 and 2001 (see table 13 below).
20
Most of this increase is accounted for by Trinidad and Tobago. The country accounts for 50% of
CARICOM’s intraregional trade.
18
Fourth, the increase in intraregional trade responds to conditions that are specific to
each regional agreement. In the case of CARICOM, the economic development of Trinidad
and Tobago, the provision of ineligibility for duty exemptions, and the structure of the
common external tariff have played an important part in the expansion of intraregional trade.
In the case of Mercosur, the intraregional protection afforded to selected goods has acted as a
stimulant to intraregional trade. In the case of NAFTA, the processes of privatization in
Mexico and the importance of Mexican assembly plants have played a similar role.
Table 13
Intraregional Trade by Trade Bloc: Intraregional exports as percentage of the total
1990 – 2001
1980
1990
1995
2000
2001
NAFTA
33.6
41.4
46.2
55.7
54.8
CACM
24.4
15.4
21.7
13.7
15.0
CARICOM
5.3
8.1
12.1
14.6
13.4
FTAA
43.4
46.6
52.5
60.8
60.1
MERCOSUR
11.6
8.9
20.6
20.7
20.8
LAIA
13.9
11.6
17.3
12.9
14.5
OECS
9.0
8.1
12.6
10.0
5.6
Source: UNCTAD, Trade and Development Reports (various issues).
Fifth, the increase in intraregional trade has been accompanied in some cases by a loss
in extraregional competitiveness. The case of CARICOM is the most clear. CARICOM has
lost market share in two of its major export markets, NAFTA and the European Union. In this
particular case, it can be said that intraregional trade has acted as a buffer against
extraregional market share loss.
Sixth, the increase in intraregional trade does not imply that there has been trade
creation or trade diversion. In general, the increase in intraregional trade has been
accompanied by an increasing process of specialization and in some cases of concentration.
Again CARICOM provides a clear illustration of this trend. In terms of specialization, in the
case of CARICOM, intraregional trade is still dominated by agricultural products. Using an
UNCTAD classification, intraregional imports were classified into five categories: primary
commodities; labor-intensive and resource-based manufactures; manufactures with low skill
and technology intensity; manufactures with medium skill and technology intensity; and
manufactures with high skill and technology intensity. Primary commodities represented 47
per cent of the total. Labor-intensive and resource-based manufactures accounted for 22 per
cent of the total. For their part, manufactures with low, medium and high skill and
technology intensity signified 5 per cent, 7 per cent and 17 per cent of total intraregional
imports.21
For CARICOM, intraregional trade is not only concentrated at the country level but
also at the product level. At the country level, Trinidad and Tobago accounts for more than
half of all intraregional imports, while other countries contribute a minimal amount to trade
flows. At the product level, the provision of ineligibility for duty exemptions protects the
most important products and producers as well as the major traded commodities in
CARICOM. The items falling under that provision comprise those traded goods for which
regional output can supply a minimum of 75 per cent of regional demand. In addition, these
21
The UNCTAD classification excludes a few imports.
19
main export products have, with a few exceptions, a market structure that is non-competitive.
This has partly led to the formation of national and regional monopolies with concomitant
associated costs. Examples of monopolies include flat-coated zinc, paints (Antigua and
Barbuda); soaps and toothpaste (Dominica); concentrated orange, orange juice, sugar cane
(Belize); cement and cigarettes (Trinidad and Tobago); rice (Guyana); carton box
(Organisation of Eastern Caribbean States (OECS)); and wheat and flour (St. Vincent and the
Grenadines). There are thus empirical grounds for maintaining that the lack of competition
has underpinned the export dynamics for these products.
Seventh, regional agreements have not led to a process of convergence. In at least two
cases, that of CARICOM and that of Central American economies, there is evidence of
divergence in terms of GDP per capita.22
VIII. The effects and implications of CAFTA for Central American countries and the
Dominican Republic
CAFTA will have two main effects on Central American countries and the Dominican
Republic.
On the one hand, it will solidify the preferences that they currently receive from the
United States on a more permanent basis. That is, the free trade agreement will guarantee on
a more permanent basis their current market access conditions. These provisions have shaped
and solidified a static export specialization pattern that is, with a few exceptions, highly
concentrated in its direction and its composition, and based on a comparative advantage
depending on natural resources and low labor costs. 23
This export specialization pattern does not necessarily correspond with the evolution
and direction in the composition of external demand. In both the United States and European
markets, natural resources have lost market share and manufacturing products not based on
natural resources and are of medium technology intensity represent the most important
component of their import market and have steadily increased in share.
In the case of Central American countries and taking into account two time periods
1990-1994 and 1994-1999, a brief survey of more than 3000 products at the 10-digit level
exported by Central American countries to the United States shows that: (a) 30 per cent of the
total corresponded to products showing a declining Central American regional share in
dynamic products (i.e., products increasing their United States import market share); (b)
between both periods of time, Central America has maintained the percentage of products
whose relative importance in the United States import market and in which the region’s
22
See, Esteban Perez Caldentey, Special and Differential Treatment in CARICOM. ECLAC. LC/CAR/R.89. 4
December 2006 for the CARICOM case. For the Central American case see, Antonio Romero, Trato Especial y
Diferenciado en el Mercado Comun Centroamericano, Mimeo, 2006,
23
In the 1990s Trinidad and Tobago represents the exception for the Caribbean region. An oil-producing
country, it switched its productive structure from oil to natural gas and other manufacturing products. This
change in its production structure was accompanied by a change in its export pattern. Between 1985 and 1999,
petroleum and fuel oils lost substantial market share in the European market decreasing from 21% of total
CARICOM exports to 4%. At the same time, methanol exports, a recent successful Trinidadian product,
increased by 100% in volume terms between 1995 and 1999. Trinidad and Tobago was the only country in the
CARICOM region (besides Guyana) that registered higher rates of GDP growth with lower GDP growth
volatility in the 1990s relative to that of the 1980s. See IMF (2000).
20
market share have increased; (c) the percentage of products whose relative importance in the
United States import market and in which the region’s share have decreased remained
constant representing one third of the total.
In addition to divorcing the export pattern from the orientation in external demand,
the current market access provisions, which will become permanent under CAFTA, have
contributed to weakening the link between exports and domestic production.
In the specific case of manufacturing, the export specialization pattern is simply not
tied to the production structure of the economies. Manufacturing free trade zones are export
enclaves contributing little to output or growth. The value-added contribution to output
comes from wages without exhibiting strong linkages or clustering to the rest of economic
sectors.24 Production activities are labor-intensive requiring low-skilled labor. Inputs are for
the most part imported and transactions are carried out in foreign currency.
More importantly, in the cases of both agriculture and manufacturing, the export
specialization pattern has not necessarily corresponded to the changes in the composition of
production, which has shifted in favor of tertiary-sector activities.
The change in the composition of production is a direct result of the application of
stabilization policies following the ‘lost decade’ based on the Monetary Approach to the
Balance of Payments (MABP).25 This approach combined demand restraint with free market
policies that were implemented in the different spheres of economic activity (trade, financial
and capital market and, eventually in some cases, the labor market).26
The available evidence indicates that the removal of trade barriers accompanying
stabilization policies stimulated import growth. This is mainly due to the high incomeelasticity of imports, which tends to be especially high for small, open, developing
economies. Exports responded to trade liberalization albeit at a much slower pace and export
growth was overpowered by the expansion of imports. The rate of growth of imports
increased from 0.2 per cent to 7.7 per cent between 1980 and 2000 for the smaller economies
of Latin America.
Thus in practice, the implementation of the MABP tightened the external constraint,
forcing countries to adopt restrictive measures.27 These translated into a higher plateau of
interest rates and lower wages, which in turn led to a process of substitution between foreign
and domestic investment. Financial liberalization accentuated the increase in interest rates
24
Initially, free trade zone legislation defined a specific geographic area for activity. However, there has been a
recent tendency to increase the degree of flexibility in operations. The notion of industrial park has tended to
disappear, allowing free trade zone operations in any geographical location of a national territory. Honduras and
Nicaragua are cases in point.
25
More specifically, the explosion of the international debt crisis in 1982, which dried up the supply of external
funds, forced debtor developing countries to stabilize in order to avoid unsustainable external positions. The
analysis of trade policy here presented postulates that the trade policy of a region or country cannot be analyzed
independently of its general economic policy orientation (Deraniyagala and Fine, 2001).
26
The MABP is the child of an empirical fact and an economic tradition. The empirical fact is the 1967
devaluation of the pound by British authorities leading to wage inflation and deflationary measures to improve
the position of the balance of payments. Intellectually, the MABP owes its development to the Chicago School
of Economics (Mundell, Johnson) and to Dutch economists (Koopmans and Polak). (Johnson, 1972, 1980b).
27
As stated by Johnson (1980b, p.92), “A continuing balance-of-payments surplus requires either repeated
devaluation or continuing restraint on the rate of growth of domestic credit”.
21
while at the same time had a positive effect on tertiary sector activities (banking and financial
sectors).
Higher interest rates discourage domestic investment at the private level and the
public level. 28 Higher interest rates mean a higher cost of borrowing; but it can also weaken
the fiscal position of a country. Due to the fact that current expenditures are rigid downwards,
fiscal adjustment is generally accomplished by contracting capital expenditures. This policy
stance reinforces the negative effect of interest rates on domestic investment.29
At the same time, high interest rates constitute a profitable outlet for foreign capital.
Short-run capital inflows respond immediately to variations in interest rates but long-term
capital inflows also respond to the resulting higher margins of profitability.30
As a result, for Central American countries, while foreign direct investment inflows
increased, gross domestic investment as a percentage of GDP remained constant at the
regional level and in many specific countries it decreased. This provides an indication that
contrary to common belief, foreign direct investment may not have acted as a catalyst for
growth. In fact, it may simply act as a substitute for domestic investment. In other words,
foreign investment may have crowded-out domestic investment.31
This revealed preference for foreign over domestic investment, encouraged by
national economic policy, underpinned a pattern of productive specialization that in some
cases is reflected in change in the composition of GDP in favor of those activities intensive in
foreign direct investment and to the detriment of traditional economic sectors. This change is
often viewed, perhaps erroneously, as a process of ‘structural change’ brought about by
globalization when in fact it is a result of the policy options implemented.32
The lack of correspondence between the export specialization pattern and the
composition of external demand and between the export specialization pattern and the
28
When, as for some Caribbean countries, domestic consumption constitutes more than 40% of imports, MABP
policies, in effect, stimulate private consumption at the expense of investment.
29
The government budget constraint states that its operational deficit (the primary deficit (Gs -Gr) and the
interest payments on its debt (rB)) is financed with an increase in its bond issues (gb) and commercial bank
credit (gd). It can be expressed as follows:
(1) (Gr/Y – Gs/Y) + gb = (r – gy) B/Y + gd
where,
B = stock of government debt.
Gs = government expenditure.
Gr = government revenue.
r = rate of interest.
An increase in r has to be met by lower expenditures or higher taxes. Decreases in expenditures are the preferred
tool since tax increases can negatively affect growth. Thus the logic of the MABP requires fiscal policy to
respond to monetary policy in the same direction. It must, to avoid an unsustainable situation, behave procyclically. Fiscal policy is subsumed and subjugated to the needs of monetary policy. Obviously, fiscal subsidies
imply lost revenues and can also tighten the budget constraint.
30
In addition, the interest rate differential tends to more than compensate exchange rate risk.
31
In the standard literature foreign investment is presented as a key component of a long-run growth strategy. It
can be hypothesized that foreign investment when accompanied by a decline in real wages can act as a motor for
growth. Preliminary evidence in this direction is available in the case of Mexico.
32
Obviously the internal terms of trade have also moved in favor of service-based activities. Preliminary
evidence for the Member countries of the OECS shows that the terms of trade between tourism and agriculture
moved from 1 to 1.05 between 1992 and 2000.
22
domestic structure of production has hampered export performance and weakened the export
base.
In the case of agricultural products, the specialization pattern shaped by special and
differential treatment provisions locks economies into producing goods responding to Engel’s
Law, and thus conducive to relative impoverishment over time. In the case of manufacturing
goods, as pointed earlier, export industries are at the low end of the value chain, exhibit weak
linkages with the rest of the economy and thus cannot act as a source of stimulus to export
growth and diversification.
The underperformance of exports is visible in the difficulty countries face in meeting
export commitments or undertaking restructuring processes to enhance their competitiveness.
A reflection of this underperformance is the incapacity of countries to meet existing quota
levels assigned in preferential trade arrangements, which is most common in the case of the
agricultural sector.
As table 14 shows, the utilization ratio of the quotas granted by the United States to
these countries for their main textile export products was on average estimated at 67 per cent
in 2000.33
Table 14
Utilization Ratio for Guaranteed Access Level Textile Exports
Cotton and
Undershirts of Cotton suits for
Cotton trousers
men
synthetic shirts synthetic and
for men and
cotton fabric
women
Costa Rica
36
97
100
83
Guatemala
13
64
9
100
El Salvador
------77
93
------Average
25
79
67
92
Source: ECLAC on the basis of official data.
An additional indication of poor export performance is the stagnant market share as
shown by the fact that Central America gained market share in its major export market, the
United States, by less than half a percentage point in 15 years (see table 15 below).
33
Fukasaku (2000: p.13) provides similar evidence for the export quotas granted by Canada, the European
Union, Japan and the United States to GSP beneficiary countries during 1976-1996. In 1976, the utilization ratio
(the ratio between the GSP imports received to GSP imports covered) was 43% and increased to 56% in 1996.
Ironically, this is a main argument to question the usefulness and efficiency of special and differential treatment.
In the Caribbean, the inability to fulfil existing quotas may be due to a series of factors including the lack of
managerial capacity, poor organization, weak institutions, a slow response to a changing environment, and the
lack of technological capacity.
23
Table 15
Central American Market Share in Regional Trading Blocs, 1985-2002
(in percentages)
Regional bloc
1985
1990
1995
2000
Central America
0.52
0.49
0.71
0.88
NAFTA
0.15
0.10
0.13
0.13
Western Europe
0.33
0.27
0.38
0.27
Andean
0.05
0.06
0.06
0.04
Mercosur
1.16
0.67
0.83
1.19
CACM
Source: Competitive Analysis of Nations (2002).
These trends may become a permanent feature of the export patterns of Central
American countries and may be aggravated by a second key feature of the agreement, which
is that their imports will increase as a result of lower trade barriers.
Thus, ultimately, export competitiveness will not improve and imports will increase.
To the extent that the rate of growth is driven by the external sectors, CAFTA will not be
favorable to the improvement of economic growth or welfare.
IX. The effects of CAFTA on the environment
A key question regarding the potential effects of CAFTA is its effects on two of the
issues that affect the involvement of civil society - labor and the environment. In the case of
the environment, the potential effects should be analysed at the legal-provision level, the
institutional level and the economic level.
At the provision level, the measures enumerated in the text include the general
principles, effective enforcement, procedural matters, public submissions, dispute settlement,
and the institutional arrangements and cooperation. Among these the most important are
effective enforcement and dispute settlement. Effective enforcement is characterized by a
conflict between the objective ‘enforcement of environmental laws’ and the discretion
afforded to countries in the establishment of its own laws, their implementation and the
allocation of enforcement resources. The difference in environmental standards between the
United States and the rest of the countries is also an issue that needs to be addressed.
At the institutional level, the treaty contemplates the creation of an Environmental
Affairs Council that oversees the implementation and operation of the chapter. However, the
treaty does not specify the working mechanism of the Council and how it will deal with the
discretion afforded to the signatory countries. While dispute settlement is explicit, it carries a
cost with it, which in the case of less developed economies can be a significant financial
burden.
The incorporation of public submissions and the creation of an environmental
cooperation commission in case of a failure to enforce environmental laws are certainly
important. The question remains as to the degree to which it can be an effective instrument.
In the case of the North American Agreement on Environmental Cooperation, the
enforcement of rules has clashed with the discretionary power that countries generally have
under such agreements.
24
Finally, as pointed out above, the environmental effects should be understood as
deriving from the general effects of the agreement. To the extent that CAFTA does not
translate into greater levels of growth and welfare and helps to create fiscal imbalances, the
environmental issues may take on a less important role and countries may dispose of fewer
resources to confront environmental problems and mitigate environmental risk.
25
Selected references
Arndt, H.W. (1987) Economic Development. The History of an Idea, University of Chicago
Press, Chicago.
CAN (2002) “Competitive Analysis of Nations”,. ECLAC, Santiago, Chile.
Deraniyagala S. and Fine B. (2001) “New Trade Theory Versus Old Trade Policy: A
continuing enigma”, Cambridge Journal of Economics, Vol. 25, No.6, pp.809-825.
Dodge, W.S. (2001) Metalcad Corporation v. Mexico. ICSID Case No ARB (AF)/97/1.40
ILM 36 (2001), and Mexico v. Metalcad Corporation, 2001 B.C.S.C. 664. The American
Journal of International Law, Vol. 95, No.4
European Commission (1996) “Green Paper on Relations between the European Union and
the ACP countries on the Eve of the 21st century”, Brussels, Belgium.
European Union (2001) Bilateral Trade Relations: ACP countries (77), July, 2001, Europa.
Evans, D. (1989) Comparative Advantage and Growth, St. Martin’s Press, New York.
Findlay, R. (1995) Factor Proportions, Trade, and Growth, MIT Press, Cambridge.
Fukasaku, K. (2000) “Special and Differential Treatment for Developing Countries. Does it
Help Those who Help Themselves?” Working paper No. 197, UNU/WIDER
Grimwade, N. (1996) International Trade Policy, Routledge, New York.
Grossman, B. (1994) “British Aid and Windwards Bananas: The Case of St. Vincent and the
Grenadines ”, Social and Economic Studies, Vol 43, No.1., March 1994, pp. 151-179.
Helpman L. The Miracle of Economic Growth. Cambridge: MIT Press.
Itam S. et al. (2000) « Development and Challenges in the Caribbean Region”, International
Monetary Fund, Washington D.C. Table 2, p. 7.
Johnson H.G. (1980a) “Towards a General Theory of the Balance of Payments”, in Frenkel
and Johnson eds. The Monetary Approach of the Balance of Payments. (University of
Toronto Press, Toronto).
Johnson H.G. (1980b) “The Monetary Approach to Balance-of-Payments Theory” in Frenkel
and Johnson eds. The Monetary Approach of the Balance of Payments. (University of
Toronto Press, Toronto).
Johnson, H.G. (1972) Inflation and the Monetarits Controversy, American Elsevier, New
York.
IMF Financial Statistics, Several issues, International Monetary Fund, Washington D.C.
26
Lipsey, R and K. Lancaster (1957) “The General Theory of Second Best”, The Review of
Economic Studies, Vol. 24, No. 1.
MAGIC (2006). “Module to Analyze the Growth of International Commerce”, Mexico,
Mexico City.
Michlopoulos, C. (2001) “The Role of Special and Differential Treatment for Developing
Countries in GATT and the World Trade Organization”, Mimeo.
Ministerio de Comercio de Costa Rica (2006). www.comex.go.cr
Moreno-Brid, J.C. (2002) “Porqué fue tan bajo el crecimiento económico de América Latina
en los noventa? (una interpretación estructuralista)”, Mimeo.
Moreno-Brid, J.C & Pérez E. (2000) “Latin America’s Long-term Economic Growth and
Foreign Trade Performance”, Paper presented at the XXII Latin American Studies
Association Congress, Miami, 16-18 March, 2000.
Perez Caldentey E., Special and Differential Treatment in CARICOM. ECLAC.
LC/CAR/R.89. 4th December 2006.
Organisation of American States (2005) Examination of Asymmetrical Treatment Provided to
Smaller Economies under the WTO Agreements and the DR-CAFTA.
Peterson Luke-Eric. Bilateral Investment Treaties and Development Policy-Making.
International Institute for Sustainable Development. November 2004.
Rodlauer Mark and Schipke Alfred, eds. Central America: Global Integration and Regional
Cooperation. IMF Occasional Paper 243. July 2005.
Romero, A. Trato Especial y Diferenciado en el Mercado Comun Centroamericano, Mimeo,
2006,
Ros. J (2001) Development Theory and the Economics of Growth, The University of
Michigan Press, Ann Arbor.
Secretaria Ejecutiva del Consejo Monetario Centroamericano. Informe Economico Regional
2005. San Jose. Costa Rica.
UNCTAD (1948) Final Act of the United Nations Conference of Trade and Employment,
Havana Charter for an International Trade Organization.
Viner J. (1950) The Customs Union Issues, Carnegie Endowment for International Peace.
World Bank CGCED (2002) “Development Assistance and Economic Development in the
Caribbean Region: Is there a correlation?” Discussion Draft.
UNCTAD, Trade and Development Reports (various issues).
27
United States Trade Representative (2001) “Fourth Report to Congress on the Operation of
the Caribbean Basin Recovery Act”, December 31, 2001.
The American Journal of International Law, U.S. Interpretation of Core NAFTA Investment
Standards. Vol. 95, No.4, (October 2001) and Vol.97, No3., (July, 2003).
Wortley B.A. Expropriation in International Law. Mimeo. July 1947
WTO (1999a) Special and Differential Treatment. Sypnosis of WTO Agreements and Related
Topics, MM/LIB/SYN4, 23 October 2000.
WTO (1999b) Guide to the Uruguay Round Agreements, Kluwer Law International, The
Hague.
WTO (1999c) The Legal Texts, Cambridge University Press, New York.


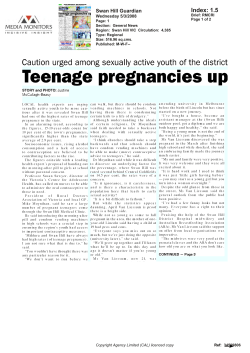
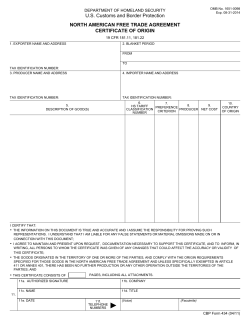
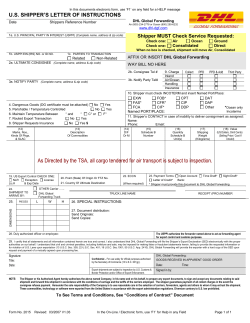
© Copyright 2026