
Mechanical Ventilation Workbook
Certificate in Advanced Mechanical Ventilation & Respiratory Support.
CERTIFICATE IN ADVANCED
MECHANICAL VENTILATION
& RESPIRATORY SUPPORT
THE TWEED BYRON
NETWORK
WORK BOOK1
©R. Butcher & M. Boyle, Revised 2009.
Page - 1
Certificate in Advanced Mechanical Ventilation & Respiratory Support.
SECTION A:........................................................................................................................................... 5
“REVIEW OF RESPIRATORY ANATOMY AND PHYSIOLOGY” ............................................. 5
ANATOMY OF THE RESPIRATORY SYSTEM.............................................................................. 6
1.
PRINCIPLES OF RESPIRATORY PHYSIOLOGY................................................................ 9
FUNCTIONS OF THE RESPIRATORY SYSTEM .......................................................................................... 9
THE CONTROL OF VENTILATION.............................................................................................. 10
PULMONARY VENTILATION: PLEURAL PRESSURES ........................................................... 12
DISTRIBUTION OF VENTILATION AND PERFUSION ............................................................. 13
DEADSPACE (VD) .......................................................................................................................... 18
RESISTANCE................................................................................................................................ 24
2.
OXYGEN AND CARBON DIOXIDE TRANSPORT............................................................. 25
CARBON DIOXIDE TRANSPORT ........................................................................................................... 30
MONITORING AND SUPPORT OF OXYGENATION AND VENTILATION .......................... 32
PULSE OXIMETRY ............................................................................................................................... 36
CAPNOGRAPHY ................................................................................................................................... 36
2.1
SUPPORT OF OXYGENATION ................................................................................................. 40
OXYGEN ADMINISTRATION. ............................................................................................................... 40
CONTINUOUS POSITIVE AIRWAY PRESSURE (CPAP) .......................................................................... 42
ENDOTRACHEAL AND TRACHEOSTOMY TUBES................................................................................... 47
Oral vs Nasal ET tubes ................................................................................................................. 48
Types of Tracheostomy Tubes....................................................................................................... 49
Securing the Tube ......................................................................................................................... 49
Cuff Management.......................................................................................................................... 49
2.1.1
Tube Suctioning .............................................................................................................. 50
HUMIDIFICATION - AN INTRODUCTION ............................................................................................... 51
The Need for Humidification ........................................................................................................ 52
Heat and moisture exchangers...................................................................................................... 53
ACID BASE INTERPRETATION ..................................................................................................... 57
ACID BASE INTERPRETATION – A DETAILED LOOK ........................................................... 58
THE STEWART APPROACH - ACID/BASE PHYSIOLOGY........................................................................ 60
The pH of water ............................................................................................................................ 60
The Effect of Strong Ions on the pH of Water - The Strong Ion Difference (SID) ........................ 60
The pH of Blood Plasma explained by Stewart............................................................................. 61
A Closer Look at SID .................................................................................................................... 61
Effect of pCO2 on [H+] and pH..................................................................................................... 62
The Effect of [ATOT] on [H+] ......................................................................................................... 62
Regulation of pH using the Stewart Approach ............................................................................. 63
Respiratory Regulation ................................................................................................................. 63
Renal Regulation........................................................................................................................... 63
GI Regulation................................................................................................................................ 64
Acid- Base Disorders .................................................................................................................... 64
Respiratory Acidosis and Alkalosis .............................................................................................. 64
Metabolic Acidosis and Alkalosis ................................................................................................. 64
ANALYSIS OF ACID/BASE STATUS USING THE STRONG ION APPROACH ............................................. 65
Calculation of BE Effects.............................................................................................................. 66
THE POW WAY (ESTIMATION OF BE EFFECTS) ................................................................................ 67
How to determine if a metabolic acidosis or alkalosis is present................................................. 67
The meaning of Base Excess ......................................................................................................... 67
Analysing the metabolic component – estimating BE effects........................................................ 68
©R. Butcher & M. Boyle, Revised 2009.
Page - 2
Certificate in Advanced Mechanical Ventilation & Respiratory Support.
RESPIRATORY ASSESSMENT....................................................................................................... 73
SECTION B: ......................................................................................................................................... 77
“CLASSIFICATION OF MECHANICAL VENTILATION”......................................................... 77
INTRODUCTION TO MECHANICAL VENTILATION:.............................................................. 78
AIRWAY PRESSURES (PAW)................................................................................................................ 79
Definitions..................................................................................................................................... 80
Pressure Measurement.................................................................................................................. 80
Peak Inspiratory and Plateau Pressures ...................................................................................... 83
PEEP and CPAP........................................................................................................................... 85
AutoPEEP ..................................................................................................................................... 87
How does the presence of AutoPEEP increase work of breathing? ............................................. 87
The Measurement of AutoPEEP ................................................................................................... 89
VOLUME (VT) .................................................................................................................................... 92
FLOW (V) ........................................................................................................................................... 93
TIME (TI) ............................................................................................................................................ 94
SUMMARY PAGE - GUIDELINES FOR SETTING AND MONITORING VENTILATION SETTINGS - PRESSURE,
FLOW, VOLUME AND TIME. ................................................................................................................ 95
TRIGGERING...................................................................................................................................... 97
PRESSURE TRIGGERING ...................................................................................................................... 97
FLOW TRIGGERING ............................................................................................................................. 98
VOLUME CYCLED VENTILATION............................................................................................... 99
INSPIRATORY PRESSURES ................................................................................................................... 99
FLOW WAVEFORMS .......................................................................................................................... 100
INSPIRATORY TIME ........................................................................................................................... 102
SUMMARY PAGE - ADVANTAGES AND DISADVANTAGES OF VOLUME CYCLED VENTILATION.......... 103
PRESSURE SUPPORT VENTILATION ........................................................................................ 104
APPLICATION OF PRESSURE SUPPORT ............................................................................................... 106
PRESSURISATION - RISE TIME ........................................................................................................... 108
PRESSURE CONTROLLED VENTILATION .............................................................................. 110
MODES OF VENTILATION ........................................................................................................... 114
CONTROLLED MANDATORY VENTILATION (CMV) .......................................................................... 114
INTERMITTENT MANDATORY VENTILATION (IMV)/ SYNCHRONISED INTERMITTENT MANDATORY
VENTILATION (SIMV)...................................................................................................................... 114
ASSIST / CONTROL VENTILATION ..................................................................................................... 116
SECTION C:....................................................................................................................................... 118
“INDICATIONS AND COMPLICATIONS OF MECHANICAL VENTILATION”................. 118
INDICATIONS FOR NON INVASIVE VENTILATION ................................................................................ 119
CPAP AND BIPAP............................................................................................................................ 119
CONTINUOUS POSITIVE AIRWAY PRESSURE (CPAP)......................................................... 120
PHYSIOLOGICAL RESPONSES TO CPAP / PEEP .................................................................... 121
NON INVASIVE VENTILATION (NIV) OR BIPAP............................................................................... 121
CPAP AND BIPAP IN THE MANAGEMENT OF ACUTE SEVERE PULMONARY OEDEMA122
VENTILATOR INDUCED LUNG INJURY (VILI)....................................................................... 123
HUMIDIFICATION .......................................................................................................................... 126
©R. Butcher & M. Boyle, Revised 2009.
Page - 3
Certificate in Advanced Mechanical Ventilation & Respiratory Support.
INTRODUCTION - PRINCIPLES OF HUMIDITY AND HUMIDIFICATION .................................................. 127
What Is Humidity? ...................................................................................................................... 127
Heat and Moisture Pathways...................................................................................................... 127
Airway Clearance and Inspired Gas Conditioning..................................................................... 128
INSPIRED GAS CONDITIONING AND TRACHEAL INTUBATION ........................................................... 130
Aims of Humidification ............................................................................................................... 130
Basic Requirements Of A Humidifier (11) .................................................................................. 130
METHODS OF HUMIDIFICATION ........................................................................................................ 130
Hot Water Humidifiers................................................................................................................ 131
Heat and Moisture Exchange Devices ........................................................................................ 133
2.2
STUDIES EVALUATING PERFORMANCE OF HUMIDIFIERS .................................................... 136
REFERENCES AND FURTHER READING - HUMIDIFICATION .......................................... 139
VENTILATOR ACQUIRED PNEUMONIA (VAP)....................................................................... 140
PATIENT VENTILATOR DISYNCHONY .................................................................................... 141
IMPOSED WORK OF BREATHING. ............................................................................................ 142
3.
WEANING FROM MECHANICAL VENTILATORY SUPPORT .................................... 144
3.1
RESPIRATORY DRIVE (P100 OR P0.1)................................................................................. 144
3.2
MAXIMUM INSPIRATORY PRESSURE ( MIP) &................................................................... 145
NEGATIVE INSPIRATORY PRESSURE (NIP) ..................................................................................... 145
3.3
DELTA OESOPHAGEAL PRESSURE....................................................................................... 145
PATIENT VENTILATOR SYNCHRONY...................................................................................... 147
4.
REFERENCES AND RESOURCES - MECHANICAL VENTILATION.......................... 150
©R. Butcher & M. Boyle, Revised 2009.
Page - 4
Certificate in Advanced Mechanical Ventilation & Respiratory Support.
SECTION A:
“REVIEW OF
RESPIRATORY
ANATOMY AND
PHYSIOLOGY”
©R. Butcher & M. Boyle, Revised 2009.
Page - 5
Certificate in Advanced Mechanical Ventilation & Respiratory Support.
ANATOMY OF THE RESPIRATORY SYSTEM
(Lisa Whelan & Lee Trenning)
The thoracic cavity is made up of 12 pairs of ribs that connect in the posterior thorax to
the vertebral bodies of the spinal column. In the anterior thorax, the first 7 pairs of ribs are
attached to the sternum or breastbone by cartilage. The lower 5 ribs do not attach to the
sternum. The 8th, 9th, and 10th ribs are attached to each other by costal cartilage. The 11th
and 12th ribs, known as “floating ribs,” are not attached in any way to the sternum; they
move up and down in the anterior chest, allowing for full chest expansion.
Note the following
structures on this diagram of
the bony thoracic cage.
• clavicle
• sternal notch
• manubrium of
sternum
• body of sternum
• xiphoid process
• costal angle
• costal margin
• 12 pairs of ribs,
including:
• 2nd costal
cartilage
• 2nd interspace
• 7th interspace
Upper airway
Includes the nasal cavity and the pharynx
Conducts air, filters particles, warms and
humidifies air
Lungs:
•
•
•
Left 2 lobes
Right 3 lobes
Lungs covered by a thin membrane
called the pleura. Visceral – inner
layer, Parietal – outer layer and
Pleural space in between the two.
©R. Butcher & M. Boyle, Revised 2009.
Page - 6
Certificate in Advanced Mechanical Ventilation & Respiratory Support.
Lower airway:
Includes the larynx, trachea, carina, L & R bronchi, bronchioles, alveoli
Trachea - warms, humidifies, and filters air. Consists of “C” shaped cartilage.
The right and left main bronchi represent the first of over 20 divisions of airways to come
in the lower airway system. With each division the air passages become narrower, with
the number of airways increasing geometrically. By the 20th division there are a huge
number of individual, tiny airways and air has been distributed to each of them. Also at
the 20th division, where the diameter of each airway is less than 1 mm, the alveoli begin
to appear - this is where gas exchange takes place.
Terrminal bronchiole - each bronchiole
descends from a lobule and contains
terminal bronchioles, alveolar ducts and
alveoli. Terminal bronchioles are anatomic
‘dead spaces’ because they don’t
participate in gas exchange. The alveoli are
the chief units of gas exchange.
Alveoli:
Type 1 epithelial cells, gas
exchange occurs
Type 2 epithelial cells – produce surfactant,
Coats alveoli, prevents collapse.
©R. Butcher & M. Boyle, Revised 2009.
Page - 7
Certificate in Advanced Mechanical Ventilation & Respiratory Support.
The walls of alveoli are coated with a thin film of water & this creates
a potential problem. Water molecules, including those on the alveolar
walls, are more attracted to each other than to air, and this attraction
creates a force called surface tension. This surface tension increases
as water molecules come closer together, which is what happens
when we exhale & our alveoli become smaller (like air leaving a
balloon). Potentially, surface tension could cause alveoli to collapse
and, in addition, would make it more difficult to 're-expand' the alveoli.
Fortunately, our alveoli do not collapse & inhalation is relatively easy
because the lungs produce a substance called surfactant that
reduces surface tension
Further info !
Various reference lines and angles are commonly used to identify respiratory findings.
For example:
•
•
The angle of Louis (also called the sternal angle) is a useful place to start counting
ribs, which helps localise
a respiratory finding
horizontally. If you find
the sternal notch, walk
your fingers down the
manubrium a few
centimetres until you feel
a distinct bony ridge. This
is the sternal angle. The
2nd rib is continuous with
the sternal angle; slide
your finger down to
localise the 2nd intercostal
space. The angle of Louis
also marks the site of
bifurcation of the trachea
into the right and left main
bronchi and corresponds
with the upper border of
the atria of the heart.
Reference lines help pinpoint findings vertically. For example, the major division
("fissure") between lobes in the anterior chest crosses the 5th rib in midaxillary
line and terminates at the 6th rib in the midclavicular line.
©R. Butcher & M. Boyle, Revised 2009.
Page - 8
Certificate in Advanced Mechanical Ventilation & Respiratory Support.
Other terms used to document locations for chest physical assessment include:
•
•
•
•
•
•
Supraclavicular - above the clavicles
Infraclavicular - below the clavicles
Interscapular - between the scapulae
Infrascapular - below the scapulae
Bases of the lungs - the lowermost portions
Upper, middle, and lower lung fields
1. PRINCIPLES OF RESPIRATORY PHYSIOLOGY.
(Rand Butcher)
Functions of the Respiratory System
The major function of the respiratory system is supply oxygen and eliminate carbon
dioxide from the body. In addition to the vital function of gas exchange the respiratory
system fulfils the following functions:
• Acid Base Regulation: Through the process of ventilation, the lung removes CO2 and
regulates the pH of the body, Regulation of pH is accomplished by removing volatile
acid (acid converted into the gaseous state; in this case carbonic acid converted to
CO2).
• Blood Reservoir: The lung receives the venous blood from the right ventricle. Due to
the capacity of the pulmonary circulation to receive blood, the lung acts as a reservoir
from which the left side of the heart draws blood.
• Filtering mechanism: The lung also constantly filters the air we breathe and removes
trapped particles through the mucocillary clearance mechanism and the lymphatic
system. The lung also acts as a filtering mechanism for blood by removing particles
such gas bubbles, small fibrin or blood clots, fat cells, aggregates of platelets or WBC,
and other pieces of cellular debris.
• Metabolism: the lung produces some very important chemicals that serve physiologic
regulatory functions such as: vascular dilatation, blood clotting, lung structural
stability and neurotransmitters. Some chemicals passing through the lungs are
converted into their more active form; such as angiotensin I, produced by the kidneys,
which is converted to angiotensin II, a potent vasoconstrictor.
(Berghuis, et al, 1992, Spacelabs Biophysical Measurement Series; Respiration p 3 )
©R. Butcher & M. Boyle, Revised 2009.
Page - 9
Certificate in Advanced Mechanical Ventilation & Respiratory Support.
THE CONTROL OF VENTILATION
The volume and frequency of ventilation is regulated by impulses originating from the
respiratory bodies in the medulla oblongata and pons. These impulses are conveyed to
respiratory muscles via the phrenic and intercostal nerves. These impulses are governed
by information obtained from various receptors located in the body. There are two types
of receptors namely central receptors and peripheral receptors. The central receptors are
located within close proximity to the respiratory centre and are mainly dependent on
carbon dioxide levels. Carbon dioxide effects the pH value in the cerebrospinal fluid. This
has a direct effect on the respiratory centre in that a low pH (high CO2) stimulates
breathing and a high pH (low CO2) diminishes breathing. The peripheral receptors in the
carotid arteries are also affected by the level of CO2, as a low pH (high CO2) stimulates
breathing. These receptors are also stimulated by a state of metabolic acidosis and
hypoxia.
In patients with chronic lung disease the sensitivity of the respiratory centre to an elevated
PaCO2 may become diminished over a period of time due to renal compensation causing
an elevated plasma HCO3- and the CSF being excreted with an elevated HCO3-. This
causes the CSF pH to be close to normal despite an elevated PCO2. The impulses to
stimulate breathing are governed by oxygen levels. As the PaO2 decreases the rate and
depth of respiration is increased.
Question 1) What factors might contribute to a decreased
respiratory drive in a postoperative patient?
Question 2) Why is it considered desirable to avoid the use of
narcotics or sedatives in the care of patients with chronic respiratory failure?
©R. Butcher & M. Boyle, Revised 2009.
Page - 10
Certificate in Advanced Mechanical Ventilation & Respiratory Support.
Additional Reading:
Feller-Kopman, D & Schwartzstein, R,
2008 “Use of oxygen in patients with
hypercapnia, UpToDate, edited by
Burton D. Rose, published by UpToDate
in Waltham, MA.
©R. Butcher & M. Boyle, Revised 2009.
Page - 11
Certificate in Advanced Mechanical Ventilation & Respiratory Support.
PULMONARY VENTILATION: PLEURAL PRESSURES
The lungs and chest wall are separated by the parietal and visceral pleura. Between the
parietal and visceral pleura is the interpleural space. The pressure within the interpleural
space is usually negative due to the natural tendency of the lungs to collapse and the chest
wall to expand. It is this negative interpleural pressure that keeps the alveoli open and
through the interaction of the lungs and chest wall interpleural pressure is altered,
enabling the movement of gas into and out of the lungs (ventilation).
In the intact chest the lungs move as the chest wall moves because of the maintenance of a
pressure in the interpleural space that is negative with respect to the alveolar pressure. As
the thoracic dimensions increase pleural pressure is reduced which causes the lungs to
increase in volume (inspiration) - as the thoracic dimensions decrease pleural pressure and
alveolar pressure is increased causing gas flow out of the lungs (expiration).
Interpleural Pressure (quiet breathing with normal lungs)
At Rest
At the end of inspiration
- 10
cms
- 5 cms
- 2 cms
- 15 cms
- 10 cms
- 5 cms
Question3) Intercostal catheters are often inserted to maintain
interpleural pressures.. What are the functions of a chest drain? In your answer
consider:
a) when it is and is not appropriate to clamp,
b) the purpose of the underwater seal,
c) the purpose of low suction, and
d) the relevance of oscillation and bubbling.
©R. Butcher & M. Boyle, Revised 2009.
Page - 12
Certificate in Advanced Mechanical Ventilation & Respiratory Support.
DISTRIBUTION OF VENTILATION AND PERFUSION
Distribution of Ventilation in the
normal Upright Subject
Distribution of Perfusion in the Normal
Upright Person
- 10cms
H2O
- 5cms
H2O
- 2 cms
H2O
Intrapleural
Pressure
Perfusion: Perfusion to the pulmonary circulation, like ventilation, is not evenly
distributed and is dependent on hydrostatic pressures. In the upright person blood flow
will favour the bases of the lungs and conversely, if the patient is placed in an upside
down position blood flow will improve in the apices of the lung (As illustrated in the
previous figure)
From this it can be seen that both ventilation and perfusion are not uniform
throughout the lung. Perfusion is greatest at the dependent zones of the lung.
Ventilation also is greatest in the lower lung zones, in the upright person. However
ventilation is in excess of perfusion in the lower lung zones - the best match of
ventilation to perfusion occurs in the middle lung zones in the upright person. The
goal of many respiratory therapies is to optimise both ventilation and perfusion to the
alveoli. The relationship between ventilation and perfusion is optimal when there is a
match between ventilation and perfusion, ie. the alveoli are receiving normal ventilation
and perfusion. Disease states can alter this relationship, as depicted in the following
diagram. (Berghuis, et al, 1992, Spacelabs Biophysical Measurement Series; Respiration
p 8)
©R. Butcher & M. Boyle, Revised 2009.
Page - 13
Certificate in Advanced Mechanical Ventilation & Respiratory Support.
Ventilation / Perfusion Relationships
1.
2.
3.
4.
5.
1. Normal lung unit, receiving normal ventilation and perfusion
2. Shunt unit, not ventilated but receiving normal perfusion
3. Silent unit, neither ventilated or perfused
4. Deadspace unit, ventilated but not perfused
5. Example of an alveoli that is under ventilated and under perfused
Question 4) Patients with unilateral lung disease (eg. Left lung
consolidation)
who are hypoxaemic are nursed with the "good lung" down.
Question 5) Review the ventilation perfusion relationships in the
previous diagram.
Provide some examples of clinical conditions that cause an
increase in;
©R. Butcher & M. Boyle, Revised 2009.
Page - 14
Certificate in Advanced Mechanical Ventilation & Respiratory Support.
RESPIRATORY VOLUMES AND CAPACITIES
Question6) Refer to the following diagram to fill in the blanks and
provide normal values(following page) where indicated.
IRV
300
IC
3500
TV
500
Airway Closure
TLC
5800
ERV
1100
Closing Volume
Closing Capacity
RV
1200
FRC
2300
(Marieb 1992, pp. 742-743)
The amount of air that moves into the lungs with each inspiration is called the
(I)__________ ___________. The air inspired with a maximal inspiratory effort in excess
of the normal inspiratory volume is the (II)___________ _____________ ____________.
The volume expelled during expiration in excess of the normal expiratory volume is the
(III)______________ _______________ ______________, and the air left in the lungs
after a maximal expiratory effort is the (IV)______________ _______________ . The
combination of these two volumes (i.e III & IV) is referred to as the (V) ______________
______________ ______________. The sum of all lung volumes is the (VI)
___________ _______________ ______________.
©R. Butcher & M. Boyle, Revised 2009.
Page - 15
Certificate in Advanced Mechanical Ventilation & Respiratory Support.
Normal Values:
Using the information on the previous page provide normal values for each of the
corresponding numbered values.
I
II
III
IV
V
VI
Remembering the discussion of interpleural pressures and how this resulted from the
relationship between forces generated by the chest wall and lung. This relationship also
determines the resting volume of the lungs (at end of normal expiration). This volume is
called the Functional Residual Capacity (FRC). This is the point where chest wall forces
and lung forces are in balance.
The following concepts are very important to appreciate:
1. Inspiration and expiration refer to changes in lung volume. Change in lung volume
requires the generation of a pressure difference - the pressure difference (for
spontaneous breathing) is generated by the respiratory muscles.
The pressure change required to produce a given change in lung volume (compliance)
varies depending upon how full the lungs are. Recording the volume change for particular
pressure change produces what is called the lungs pressure/volume curve. (or The Static
Pressure - Volume Relationship). This relation is sigmoidal - the pressure required to
produce volume change at low and high lung volumes is much greater than that needed to
produce volume change in the middle section. This middle section corresponds to normal
tidal breathing in the healthy lung.
V
O
L
U
M
E
PRESSURE
Where tidal breathing occurs in a lung already approaching Total Lung Capacity (eg very
small vital capacity, or as a result of hyperinflation) the pressure (negative pressure) that
the respiratory muscles must generate will be much higher than that required for normal
tidal breathing at normal FRC. Where tidal breathing occurs in a lung with reduced FRC
(near Residual Volume) the same consideration applies. (eg obesity/abdominal distension,
atelectasis)
©R. Butcher & M. Boyle, Revised 2009.
Page - 16
Certificate in Advanced Mechanical Ventilation & Respiratory Support.
This means that at these two extremes (TLC/FRC) the WORK of BREATHING will
be increased.
2.Reduction in lung volume below a certain level results in airway closure (small airways
such as respiratory bronchioles) The lung volume at which this occurs is known as the
closing capacity (CC). In older people and those with chronic lung disease, some of the
lungs elastic recoil is lost, with a resulting decrease in intrapleural pressure. Thus the
volume at which airway closure occurs is higher (closer to FRC).
©R. Butcher & M. Boyle, Revised 2009.
Page - 17
Certificate in Advanced Mechanical Ventilation & Respiratory Support.
DEADSPACE (VD)
Deadspace is the amount of gas that is involved in ventilation but does not take part in
gas exchange. There are four types of deadspace: anatomical, alveolar, mechanical and
physiologic.
Anatomic deadspace - refers to the amount of gas that fills the conducting passages of
the airway and is not involved in gas exchange. In most adults this value is estimated at
2ml/kg of body weight. For the normal sized adult this value is expressed as 150mls.
Therefore if the normal tidal volume is 500 mls, only 350 mls of tidal volume is actually
involved in gas exchange as illustrated below.
The Relevance of Anatomical Deadspace
Tidal Volume =
500mls
Air in conducting
Airways (anatomical
deadspace) = 150 mls
Air participating in gas
exchange = 350 mls
Alveolar deadspace - is the amount of gas filling the alveoli, that does not contribute to
gas exchange.
Mechanical Deadspace - is the contribution to the patient's deadspace through the
addition of respiratory circuit attachments etc.
Physiologic / Total Deadspace - This value is the sum of anatomic and alveolar dead
space. It represents the total volume in the airways and alveoli not participating in gas
exchange.
As the deadspace increases the amount of gas that actually contributes to gas exchange
reduces.
The volume of gas that takes part in gas exchange is alveolar ventilation.
©R. Butcher & M. Boyle, Revised 2009.
Page - 18
Certificate in Advanced Mechanical Ventilation & Respiratory Support.
Question 7) Tracheostomy tubes are inserted to reduce the amount of
anatomic dead space and to reduce the resistance to gas flow. What will be the
effect of this in terms of the patient's work of breathing, respiratory rate and minute
il i ?
Question 8) Indicate on the following diagram, which part of the
circuit contributes to mechanical / apparatus dead space.
Ventilator
©R. Butcher & M. Boyle, Revised 2009.
Page - 19
Certificate in Advanced Mechanical Ventilation & Respiratory Support.
LUNG MECHANICS: RESISTANCE & COMPLIANCE:
The mechanical characteristics of the lung greatly influence both normal lung function
and pulmonary disability. The two major factors involved in mechanics are lung
compliance and resistance.
Compliance
In health inspiration is an active process, accomplished through the expansion of the lungs
and the thorax. The ease with which the lungs and thorax can be expanded, or distended,
is referred to as compliance. Total compliance therefore depends not only on the elasticity
of the lung tissue, but also on that of the thoracic cage.
Compliance determines the change in volume for a given change in pressure. For
example, if a patient is able to sustain a large increase in tidal volume with a small fall in
pleural pressure then their lungs are compliant. If a patient requires a large fall in pleural
pressure for a relatively small increase in tidal volume then their lung tissue is noncompliant.
Compliance is reduced by any factor that:
• reduces the natural elasticity of the lungs, such as fibrosis, or interstitial
oedema.
• Reduces the total number of functional alveoli such as atelectasis or
airway obstruction.
• increases the stiffness of the chest wall eg splinting because of pain
• decreases the stiffness of the chest wall eg post sternotomy - resulting in
decreased FRC
• checks the ability of the thorax to increase in volume eg abdominal
distension.
Compliance is therefore a relationship between volume and pressure and can be estimated
by dividing the change in volume by the change in pressure, i.e:
Compliance =
Change in Volume (∆V)
Change in Pressure (∆P)
For example:
Your patient is receiving the following ventilator parameters:
PEEP - 10cmsH2O
Tidal Volume - 1000mls
End inspiratory hold or plateau pressure - 35cmsH2O
In this case the change in volume is 1000 mls and the change in pressure is 25cmsH2O.
The change in pressure is determined by subtracting the level of PEEP (10cms) from the
end inspiratory hold pressure (35cms). Remember we are interested in the change in
pressure and in this case the pressure is rising from a baseline of 10cms to a total pressure
©R. Butcher & M. Boyle, Revised 2009.
Page - 20
Certificate in Advanced Mechanical Ventilation & Respiratory Support.
of 35 cms of water, the resultant change in pressure is therefore 25cms.
The total lung compliance (lung and chest wall) for this patient is:
1000
35-10
= 1000
25
= 40mls/cmsH2O
You will note that the estimated value for compliance is stated in mls/cmsH2O. In the
above example this means that for a 1cm increase in pressure the patient would
experience a 40 ml rise in volume. The normal value for adult compliance is a
combination of lung and thoracic wall compliance and is 70-100mls/cms H2O.
Clinically, there are two types of compliance measurements that can be determined:
1. Dynamic compliance
2. Static compliance
Dynamic compliance is calculated by the following formula:
Dynamic Compliance =
Tidal Volume
Peak Inspiratory Pressure - PEEP
Static Compliance =
Tidal Volume
Plateau Pressure - PEEP
To obtain the static compliance an inspiratory pause must be initiated. This pause will
result in a period of no gas flow and allow the pressure in the alveoli to equilibrate with
the ventilator circuit pressure. The measurement of static compliance may be useful in
eliminating the following variables that may influence compliance readings: resistance to
flow, distribution of gases and recruitment time of closed lung units.
Question 9) Your patient has atelectasis and is receiving the
following ventilation:
• PEEP - 10 cms
• Peak Pressure - 50 cms
• Plateau Pressure - 35cms
• Tidal Volume - 500mls
Calculate the static compliance and describe how atelectasis alters compliance.
©R. Butcher & M. Boyle, Revised 2009.
Page - 21
Certificate in Advanced Mechanical Ventilation & Respiratory Support.
Compliance alters during phases of a maximal inspiration .At lung volumes near RV and
TLC, the lung tissue is less compliant (i.e. not as distensible). This results in an "S"
shaped curve (see following figure). Conceptually, this is similar to blowing up a balloon.
It is more difficult to inflate a balloon at the beginning of inflation. Once the balloon
starts to inflate less pressure, or work, is required to inflate the balloon. As the balloon
reaches its total capacity, and draws near to bursting, a greater pressure is required to
achieve a unit volume increase. Thus the lung, like a balloon, requires greater pressures at
the beginning (near functional residual capacity) and end of inspiration (near total lung
capacity) for relatively small increments in tidal volume - this is a state of decreased lung
compliance. In the middle of inspiration little pressure is required for increases in volume
- i.e. the lungs are more compliant
V
O
L
U
M
Pressure
©R. Butcher & M. Boyle, Revised 2009.
Page - 22
Certificate in Advanced Mechanical Ventilation & Respiratory Support.
COMPLIANCE - SUMMARY
Compliance refers to the distensibility of the lung tissue
A patient with a low compliance or non-compliant lungs is said to have "stiff"
lungs.
Signs of non-compliant lungs may include high airway pressures for a given tidal
volume. Lungs that have decreased in compliance will require higher airway
pressures to deliver a given tidal volume.
Potential complications of increased airway pressures include: barotrauma,
mediastinal emphysema, pneumothorax, tension pneumothorax
Compliance is calculated by dividing the change in volume by the change in
pressure.
The normal value (full size adult) for compliance (total lung) is approximately 70
- 100 mls/cmH2O. NB compliance for a patient who is intubated and ventilated is
approximately 40-60 mls/cmH2O - this will vary depending on whether you are
measuring static or dynamic compliance.
Compliance is related to lung size - larger lungs have higher compliance.
Elasticity is often mistaken to mean compliance. Elastance is the reciprocal of
compliance and is defined as the force with which the lung fibres try to recoil
©R. Butcher & M. Boyle, Revised 2009.
Page - 23
Certificate in Advanced Mechanical Ventilation & Respiratory Support.
RESISTANCE
Resistance refers to impedance to flow. For gas to flow a pressure difference must exist
between two the ends of a tube. The relationship between the driving pressure and the
resultant flow is termed the resistance. Airway resistance is the pressure difference
between the alveoli and mouth divided by flow rate.
Resistance to flow may be inspiratory or expiratory. Factors that may increase both
inspiratory/expiratory resistance include:
•
•
•
•
bronchial tone
sputum
oedema
external breathing circuits (e.g. ET/tracheostomy tube and other circuits
components).
Airflow obstruction can lead to gas trapping - resulting in dynamic hyperinflation (auto
PEEP, intrinsic PEEP, inadvertent PEEP). Possible effects of Auto-PEEP are listed
below.
1. Tidal Volume may cycle close to total lung capacity (TLC), i.e. reduced lung
compliance (increased risk of barotrauma)
2. Increases effort required for ventilator triggering or intiation of gas flow.
3. Increased work of breathing
4. Decreased preload and cardiac output
©R. Butcher & M. Boyle, Revised 2009.
Page - 24
Certificate in Advanced Mechanical Ventilation & Respiratory Support.
2. OXYGEN AND CARBON DIOXIDE TRANSPORT
Partial Pressure
The gases that are contained within ambient air are listed in table I. At sea level these
gases will exert a pressure of 760 mmHg. The pressure that each gas independently exerts
is known as partial pressure and is proportional to the percentage of the gas in the total
gas mixture. The percentage of oxygen, for example, in ambient or room air is 21%. The
partial pressure of oxygen at sea level is therefore 21% of 760 mmHg i.e. ~ 160 mmHg
(.21 x 760). If we ascended to a height where atmospheric pressure equalled 380 mmHg
the partial pressure of oxygen would then equal ~ 80 mmHg. Hence the percentage of
gases remain the same irrespective of changes in altitude, whereas the partial pressures
alter.
Table I - Gases contained in dry air
• Nitrogen
78%
• Oxygen
21%
• Carbon dioxide 0.03%
• Inert gases
< 1%
Water vapour content will vary with humidity.
As the dry gas is inhaled and moves through the airways water vapour is added. Water
vapour pressure at 37 degrees is 47 mmHg. Therefore the partial pressures of the gases
reaching the lungs are:
•
•
•
Nitrogen
Oxygen
Carbon dioxide
-
569 mmHg (including the other inert gases)
159 mmHg
0.3 mmHg
Inspired gas mixes with gas that has diffused from the pulmonary capillary. This results in
alveolar gas with approximately the following partial pressures:
•
•
•
•
Nitrogen
Oxygen
Water vapour
Carbon dioxide
-
569 mmHg
105 mmHg
47 mmHg
40 mmHg
Of the gases listed in table I nitrogen (N2), oxygen (O2), water (H2O) and carbon dioxide
(CO2) are of relevance to the following discussion. The change in oxygen tension from
inspired gas to cell is called the oxygen cascade.
Alveolar Gas
As oxygen enters the alveoli the partial pressure of oxygen decreases from 160 mmHg to
approximately 105 mmHg. This decrease is due to the presence of water vapour and
©R. Butcher & M. Boyle, Revised 2009.
Page - 25
Certificate in Advanced Mechanical Ventilation & Respiratory Support.
carbon dioxide, both of which exert pressure. The content of water vapour increases
through humidification whereas carbon dioxide increases through the transfer of CO2
from mixed venous blood in the pulmonary capillary to the alveolar gas. Calculation of
the partial pressure of oxygen (PAO2) in the alveoli can be illustrated using the following
simplified equation:
FiO2 (atmospheric pressure - partial pressure of alveolar water) - alveolar carbon
dioxide.
For example: If a patient were receiving an FiO2 of .21 at sea level with an estimated
alveolar carbon dioxide of 45 mmHg, the PAO2 could be estimated through the following
equation:
PO2
=.21 (760-47) - 45
= .21 (713) - 45
= 150 - 45
= 105
The difference between the partial pressure of oxygen in the alveoli (PAO2) and the
partial pressure of oxygen in the arterial circulation (PaO2) is referred to as the A-a
gradient. Calculation of the A-a gradient can be useful in providing information in the
effectiveness of oxygen in crossing the alveolar capillary membrane. In clinical practice
estimation of the A-a gradient is often one when we compare the fraction of inspired
oxygen (FiO2) with the PaO2. If a patient is receiving an FiO2 of 1 and their PaO2 is
below normally accepted limits, then there is a problem with oxygen transferring across
the respiratory membrane.
Question 10) What would be the inspired partial pressure of oxygen
for a patient breathing 50% oxygen at a) sea level and at
b) 2 atmospheres absolute?
External Respiration refers to the gas exchange between the alveoli and the blood. As
venous blood passes through the pulmonary circulation it is oxygenated and carbon
dioxide is removed. Factors influencing the movement of these two gases across the
respiratory membrane are the:
•
•
•
partial pressure gradient and gas solubilities
anatomical characteristics of the respiratory membrane
match between ventilation and perfusion.
As you will recall from table II the partial pressure of oxygen in the alveoli is 105 mmHg
and the partial pressure of oxygen in the blood returning to the lungs is 40mmHg. In this
instance oxygen will diffuse rapidly from an area of high concentration (the alveoli) to
©R. Butcher & M. Boyle, Revised 2009.
Page - 26
Certificate in Advanced Mechanical Ventilation & Respiratory Support.
one of low concentration (the pulmonary circulation). This process will continue until the
blood has passed through the pulmonary
circulation or when equilibrium has occurred. Equilibrium refers to the attainment of
a balance of gases on both sides of the membrane. In health equilibrium occurs in
approximately 1/3 the time that a red blood cell is in the pulmonary capillary. This means
that the time of pulmonary blood flow may decrease by two thirds and still provide
adequate oxygenation.
Diffusion of carbon dioxide occurs independently of oxygen. As carbon dioxide is
generated from cellular metabolism it enters the capillary network and is transported by
the blood to the lungs. As carbon dioxide enters the pulmonary circulation it diffuses from
an area of high concentration to an area of low concentration, the alveoli, and is then
excreted from the lungs.
The Respiratory Membrane.
There are two factors that affect the effectiveness of the respiratory membrane, thickness
and surface area. In health the respiratory membrane is extremely thin and efficient. In
disease states where the lungs become oedematous, as in pulmonary oedema, congestion
and pneumonia the thickness of the membrane may increase inhibiting gas exchange. The
normal surface area of the respiratory membrane is extremely large. The greater this
surface are the greater the amount of gas that can diffuse across the membrane
Oxygen Transport
Oxygen is transported in the blood in two ways. The majority of the blood (97%) is bound
to haemoglobin, whereas the other 3% is dissolved in the plasma. Each haemoglobin
molecule can combine with four oxygen molecules. When four oxygen molecules are
bound to a haemoglobin it is said to be fully saturated. The extent to which haemoglobin
is bound to haemoglobin depends largely on the PO2 of blood, the relationship is not
however linear. When oxygen saturation is plotted against the partial pressure of oxygen
an S shaped oxygen haemoglobin curve results (as depicted in the figure XIV, assumes
Hb of 15 g/dl ). At the upper horizontal part of the curve, large increases in PaO2 alter the
SaO2 very little. At the more vertical part of the curve, small changes in PaO2 will greatly
affect the SaO2 allowing greater oxygen exchange.
©R. Butcher & M. Boyle, Revised 2009.
Page - 27
Certificate in Advanced Mechanical Ventilation & Respiratory Support.
The Oxygen - Haemoglobin Saturation Curve
100%
50%
SaO2
0
50mmHg
PaO2
100
The oxyhaemoglobin dissociation curve shifts when CO2, hydrogen ion concentration,
levels of 23DPG and body temperature are altered (see following diagram). An increase
in these variables will shift the curve to the right, causing a decrease in the affinity of
haemoglobin for oxygen. This will result in more oxygen being released from the blood to
the tissues. A decrease in these variables will shift the curve to the left causing an
increased affinity of haemoglobin for oxygen. In this situation, the blood oxygen content
at any given PaO2 is higher, but less oxygen is actually available for the tissues. An easy
way to conceptualise haemoglobins affinity for oxygen is to think of the body's response
to exercise and extreme cold.
During exercise the body's energy requirements, oxygen consumption and demand
increases. Lactic acid, carbon dioxide and heat are produced. These factors are a decrease
in pH, increase in CO2 and heat, shift the curve to the right, and lowering the affinity of
haemoglobin for oxygen. Hence the weak bind of oxygen for haemoglobin allows oxygen
to be released from the blood cell, satisfying the bodies need for oxygen.
In these situations the change in the affinity of haemoglobin for oxygen is appropriate
responding the bodies oxygen requirements. In the lungs the PCO2 of blood falls with a
rise in pH which shifts the curve to the left. This shift is associated with an increasing Hb
affinity for oxygen thereby increasing the uptake of oxygen by blood. In the peripheral
tissues pCO2 is higher, which causes a fall in blood pH as CO2 is added to tissue capillary
blood. This change shifts the curve to the right, which decreases Hb affinity for oxygen
thereby increasing the amount of oxygen available to the tissues. This effect is called the
Haldane Effect.
©R. Butcher & M. Boyle, Revised 2009.
Page - 28
Certificate in Advanced Mechanical Ventilation & Respiratory Support.
Shifts in the Oxygen - Haemoglobin Dissociation Curve
100%
Shift to left caused by
decreased CO2,
increased pH,
decreased temperature
and 23 DPG
50%
Shift to right caused by
increased CO2,
decreased pH,
increased temperature
and 23 DPG
SaO2
0
50mmHg
100
PaO2
For effective oxygen delivery to occur, there must be an adequate number of haemoglobin
molecules circulating in the blood, an acceptable percentage of this haemoglobin must be
saturated with oxygen and cardiac output must be sufficient enough to transport the
oxygen to the tissues. The factors, therefore, that will determine oxygen delivery include
haemoglobin, oxygen saturation and cardiac output. The formula used to estimate
oxygen delivery (DO2) in millilitres is:
DO2 = SaO2 x CO x Hb x 1.34 + Dissolved oxygen
DO2 = oxygen delivery
SaO2 = Haemoglobin saturation (can use SpO2 - obtained by pulse oximeter)
CO = cardiac output
Hb = haemoglobin
1.34 = mL of oxygen carried by one gram of saturated haemoglobin.
The concept of oxygen delivery is extremely important when caring for the critically ill
patient. A great deal of the invasive and non-invasive monitoring is instigated in order to
provide information and guide treatment to optimise oxygen delivery to the tissues. This
is covered in greater depth in the haemodynamic learning package.
The effectiveness of oxygen delivery is however dependent on the amount of oxygen that
is consumed by the patient. In health substantial amounts of oxygen are still available in
venous blood, before it is oxygenated by the lungs. This amount of oxygen that is left in
the venous system is referred to as venous reserve. The importance of venous reserve
©R. Butcher & M. Boyle, Revised 2009.
Page - 29
Certificate in Advanced Mechanical Ventilation & Respiratory Support.
becomes apparent during periods of increased oxygen consumption, as there is a store of
oxygen that is readily available to meet the increased demand.
In the normal state an increase in O2 delivery causes no increase in O2 consumption. In
sepsis there may be a state of delivery dependent O2 consumption when an increase in O2
delivery is accompanied by an increase in O2 consumption. It has been suggested that this
situation therapy that increases O2 delivery until O2 consumption stops rising might be
beneficial in ensuring tissue oxygenation.
Carbon Dioxide Transport
At rest our body cells utilise 250 mls of oxygen and produce 200 mls of carbon dioxide
per minute. CO2 is the end product of cellular metabolism. Carbon dioxide is transported
in three forms 1) dissolved in plasma, 2) as bicarbonate and 3) bound to proteins.
Dissolved in Plasma
CO2 is 20 times more soluble than oxygen. This means that a larger concentration of
carbon dioxide may be dissolved in plasma. The actual amount of CO2 that is dissolved in
plasma is however relatively small, accounting for 10% of carbon dioxide transport.
Bicarbonate
The majority of CO2 is transported by the bicarbonate buffer system. The Henderson Hasselbalch equation describes the reversible relationship between CO2 and bicarbonate.
CO2 + H2O
Where: CO2
H2CO3
H+ + HCO3-
= carbon dioxide
H2O
= water
H2CO3
= carbonic acid
HCO-3 = bicarbonate
H+
= hydrogen
In plasma the concentration of CO2 and water to form carbonic acid is relatively slow and
consequently only forms a small amount of bicarbonate. In red blood cells however the
reaction is very quick as the enzyme carbonic anhydrase acts as a catalyst. The
bicarbonate produced in red blood cells accounts 60% of total carbon dioxide transport.
Once the total level of bicarbonate produced in red blood cells exceeds the amount of
bicarbonate in plasma, bicarbonate moves out of the cell into the plasma to maintain
equilibrium. Chloride also moves out of the cell in order to maintain ionic balance.
Carbamino Compounds
©R. Butcher & M. Boyle, Revised 2009.
Page - 30
Certificate in Advanced Mechanical Ventilation & Respiratory Support.
So far we have looked at how 10% of CO2 is transported dissolved in plasma and 60% as
bicarbonate. The remaining 30% is transported attached to blood proteins.
Question 11) Permissive hypercapnia may be instituted to prevent
acute lung injury. Define permissive hypercapnia. What are the
potential complications of an elevated CO2?
When would permissive hypercapnia be contraindicated?
Further Reading
• Slutsky, A. (1993), “Mechanical Ventilation”, Chest, Vol 104, no 6, pp 1833 1859.
• Tuxen, D. 1994, “Permissive Hypercapnia”, in Principles and Practice of
Mechanical Ventilation, M. Tobin, ed, McGraw Hill, New Work.
• Hickling, K.1992, “Low volume ventilation with permissive hypercapnia in the
adult respiratory distress syndrome” Clinical Intensive Care, vol. 17. Pp. 908911.
©R. Butcher & M. Boyle, Revised 2009.
Page - 31
Certificate in Advanced Mechanical Ventilation & Respiratory Support.
MONITORING AND SUPPORT OF OXYGENATION AND VENTILATION
Arterial blood gas interpretation (For a more detailed review of acid/base balance refer to
the Acid/Base ABG Learning Package)
Question12) Complete the following sentences by filling in the
blanks or circling the correct answer from the alternatives provided in brackets..
The normal range for the pH of arterial blood is between...................... and ......................
The two systems responsible for the regulation and compensation of acid base balance in
the body are, the (cardiovascular, respiratory, limbic, skeletal,) system and the
(lymphatic, renal, neurological, gastrointestinal) system.
The amount of carbon dioxide retained or excreted from the body has a direct effect on
the arterial (pH, O2, ). For example, hypoventilation will tend to (reduce, increase,)
carbon dioxide levels in the blood. This will, in turn, (reduce, increase,) arterial pH. As a
result of this an acid base disturbance known as, (alkalosis, acidosis, hypoxia) occurs.
Conversely hyperventilation will tend to (reduce, increase,) carbon dioxide levels in
arterial blood. This will in turn (reduce, increase,) arterial pH. As a result of this an acid
base disturbance known as, (alkalosis, acidosis, hypoxia) occurs.
Look at this equation: CO2 + H2O
H2CO3
H+ + HCO3-
An increase in HCO3- will result in a(n) (reduction, increase,) in blood pH outside
normal limits. Should this irregularity persist for an extended period of time the renal
system will adjust the levels of (magnesium, bicarbonate, calcium) which is the body's
principle alkaline buffer.
In the above instance a(n) (increased, decreased) HCO3- together with a(n) (increased,
decreased) pH, leads to the (reabsorption, excretion) of (magnesium, bicarbonate,
calcium) and the (reabsorption, excretion) of H+ by the renal system. The net effect is a
(rise, fall) in the blood pH.
An important thing to recall is that the (respiratory, renal) response to a pH imbalance is
rapid but is unable to compensate fully, whilst the (respiratory, renal) response is slower
but is able to correct fully.
In other words, an arterial blood gas result that indicates the (respiratory, renal) system
has acted to retain or excrete CO2 in response to an altered pH in most cases is an
example of an acute acid base disturbance.
©R. Butcher & M. Boyle, Revised 2009.
Page - 32
Certificate in Advanced Mechanical Ventilation & Respiratory Support.
On the other hand an arterial blood gas result that indicates the (respiratory, renal)
system has acted to retain or excrete HCO3- in response to a unsuccessful attempt by the
(respiratory, renal) system to correct an altered pH in most cases is an example of a
chronic acid base disturbance.
How to determine if a metabolic acidosis or alkalosis is present
Arterial Blood
pH
[H+]
PCO2
Base excess
From Reference 13.
Mean
Range
7.4
40nM
40 mmHg
0 mM
7.36-7.44
36-44 nmol/L
36-44 mmHg
-2 to +2 mmol/L
The pH is looked at first to determine if there a acidaemia or alkalaemia .
As seen from the previous sections the body has buffering and compensation mechanisms
to maintain a normal pH. If the pH is within the normal range a respiratory or metabolic
acidosis or alkalosis can still be present.
The respiratory and metabolic components must be looked at to determine if there is a
resp acidosis/alkalosis, metabolic acidosis/alkalosis.
The respiratory component of course is the PCO2. As seen in the section 1.8 Respiratory
Regulation the pCO2 indicates whether a respiratory acidosis or alkalosis is present.
If the pCO2 is < 35mmHg a respiratory alkalosis is present
If the pCO2 is > 45mmHg a respiratory acidosis is present
Next it needs to be determined if the change in pCO2 explains the pH. The Base Excess is
used to determine if more than a alteration in pCO2 is present.
The Base Excess
A measure of the metabolic disturbance is the Base Excess (BXS) as this component takes
into account all the buffer systems and is independent of the PCO2.
"The BXS represents the amount of acid or base that must be added to a liter of fully
oxygenated blood exposed in vitro to PCO2 of 40 mmHg at 380C to achieve a normal pH
(7.40)."
If after equilibration with a PCO2 of 40 the blood sample is acidic, alkali must be
added to titrate the blood. ie it has a negative base excess or a base deficit.
If after equilibration with a PCO2 of 40 the initial blood sample has a high pH
(alkalotic), acid must be added to titrate the blood. Ie it has a positive base excess or
just base excess.
©R. Butcher & M. Boyle, Revised 2009.
Page - 33
Certificate in Advanced Mechanical Ventilation & Respiratory Support.
Note
This definition of Base Excess is blood (or invitro or actual) BXS. In practice the pH
change for a certain PCO2 change is greater invivo than in blood invitro because
haemoglobin is the major buffer for CO2 and haemoglobin concentration is higher in
blood than the effective haemoglobin concentration diluted in the total ECF volume. So a
new definition of invivo or standard BXS was made up and uses blood with a Hb of about
4 gm/100mL (ie. What the Hb would be if spread through the total ECF.
The BXS asks the question – is the cause of any acid/base change the result of a change in
pCO2. The change in pH as a result of a change in pCO2 is “removed” by adjusting the
pCO2 to 40 mmHg. The question then becomes is there is remaining acid/base change (ie
a metabolic acidosis/alkalosis).
Clinical Examples
1. pH 7.22, pCO2 54, pO2 56, BXS -6, Calc. Bic 21, O2sat 86%, Na+ 150,
122, lactate 2.6
K+ 5.6, Cl-
Clinical notes – post ingestion of corrosive, massive haemorrhage, inotropes,
intubated & ventilated
Analysis:
pH 7.22 - normal range 7.35 - 7.45 - therefore the patient is acidaemic
PCO2 54 - normal range 35 - 45 - pCO2 is raised therefore there is a
respiratory acidosis
BXS -6 - normal range -3 to +3 - the BXS is below normal therefore there
is a base deficit ie. a metabolic acidosis. (The BSX indicates that after
correcting for pCO2 there is still an acid base derangement)
The question now is what is the cause of the metabolic disturbance?
©R. Butcher & M. Boyle, Revised 2009.
Page - 34
Certificate in Advanced Mechanical Ventilation & Respiratory Support.
Question 13) Analyse the following blood gases
2. pH 7.21, pCO2 41, pO2 168, BXS -11, Calc. Bic 16, Na+ 136, K+ 5.8, Cl- 112, lactate
0.8, Urea 39.7, Cr 0.29
Clinical notes – Quadraplegia 20 to abscess, acute renal failure, background of
ischaemic heart disease, hypertension, alcohol abuse, intubated & pressure support
ventilation
Analysis:
pH 7.21 - pH is low therefore [H+] is raised - the patient is acidaemic
PCO2 41 - within normal range
BXS -11 - BXS is below normal therefore there is a metabolic acidosis
1. pH
pCO2
pO2
BXS
Calc. Bic
O2sat
Na+
K+
Cllactate
7.30
86
68
11
41
93
139
3.9
93
0.7
Clinical notes; Background - Morbid obesity, CAL, Obstructive sleep apnoea. Present
problems - exacerbation CAL, bivent. Failure. NPPV BiPAP 17/7, FiO2 .26, RR 18,
Lasix infusion
2. pH
pCO2
pO2
BXS
Calc. Bic
O2sat
Na+
K+
Cllactate
7.12
40
111
-15
12.5
97%
139
3.6
109
6.1
Clinical notes, dissecting thoracic aneurysm, cardiac tamponade, adrenaline,
ventilated.
©R. Butcher & M. Boyle, Revised 2009.
Page - 35
Certificate in Advanced Mechanical Ventilation & Respiratory Support.
3. pH
pCO2
pO2
BXS
Calc. Bic
O2sat
Na+
K+
Cllactate
urea
cr
7.18
23.7
104
-18.6
8.6
126
6.4
111
0.5
20.9
0.17
Clinical notes: NIDDM, nausea vomiting, diarrhoea, ileal conduit, urinary tract
infection.
Pulse Oximetry
Oximetry, a form of spectrophotometry, makes use of the fact that different haemoglobin
species (oxyhaemoglobin, reduced haemoglobin, carboxyhaemoglobin, methaemoglobin)
absorb differing amounts of light at various wavelengths.
Pulse Oximeters determine the oxyhaemoglobin concentration (SpO2) by measuring the
absorption of two wavelengths of light, red and infrared. The pulse oximeter measures the
absorption of these two different light wavelengths and calculates the ratio of these
absorbances. This ratio is related to the haemoglobin saturation which is then displayed.
The technique used by Pulse Oximeters is called pulse oximetry because it determines the
"pulse added" absorption by removing from its calculation the contribution to light
absorption of the tissue bed (venous blood, capillary blood, solid tissues) (Berghuis, et al,
1992, Spacelabs Biophysical Measurement Series; Respiration)
Question14) Outline the clinical application of Pulse Oximetry. What
are the limitations?
Capnography
Concentrations of carbon dioxide are depicted graphically as a capnogram, recorded by a
capnograph and measured by a capnometer. Capnographs incorporate both the
measurement and display of expired concentrations of CO2. The two dominant methods
of determining concentrations of carbon dioxide are mass spectrometry and infrared
©R. Butcher & M. Boyle, Revised 2009.
Page - 36
Certificate in Advanced Mechanical Ventilation & Respiratory Support.
absorption. Capnographs using the mass spectrometer are useful for interpreting the
concentration of a wider variety of gases. This technique may be useful in the operating
theatre, but in the acute care environment the infrared method of determining the
concentration of CO2 is usually sufficient.
The infrared technique relies on the fact that different gases absorb infrared light at
different wavelengths. CO2 absorbs light at a known wavelength, allowing the
concentration of this gas to be determined. A heated wire with optical filters is employed
to generate an infrared light at an appropriate wavelength. When CO2
passes between the focused beam of light and a photodetector an electrical signal is
generated, reflecting the PCO2 of the gas.
Infrared capnometers analyse the concentrations of CO2 either directly at the site of
measurement (mainstream sampling) or by diverting the gas to the capnometer
(sidestream sampling). Main stream analyser's use a transducer located on an airway
connector that is placed in the ventilator circuit. The transducer contains both an infrared
light source and photodetector.
The sidestream capnometer (Refer to the following diagram) withdraws gas from the
patient's airway through a narrow bore tubing to the capnometer, where gas analysis
occurs. Functional consideration when using the sidestream sampling technique include
choosing a narrow, CO2 impermeable tube with a water trap to prevent the accumulation
of water and respiratory secretions in the capnometer. Sidestream analysis may also be
employed in the non-intubated patient through specially designed nasal cannula.
Sidestream Capnography (Adapted from Berghuis 1992, p. 128)
Water Trap
The CO2 in exhaled gases changes in a characteristic pattern in normal individuals. The
concentration of CO2 of expired gas is negligible initially as dead space gas is expelled
and then rises rapidly as alveolar gas is expelled. A plateau is reached after deadspace gas
has been exhaled. The plateau level reflects mean alveolar CO2. The end of the alveolar
plateau level of CO2 measured during the last 20% of exhalation is the end-tidal CO2. As
©R. Butcher & M. Boyle, Revised 2009.
Page - 37
Certificate in Advanced Mechanical Ventilation & Respiratory Support.
alveolar CO2 has equilibrated with the CO2 of pulmonary capillary blood the end tidal
CO2 measurement provides an approximation of PaCO2. (this assumes that there is not
much dead space ventilation or shunt) The changes in end tidal CO2 are reflected on the
graphical waveform (see following diagram).
Capnography trace (Adapted from Berghuis 1992, p. 128)
In normal individuals at rest the difference between end-tidal CO2 and PaCO2 is -/+ 1.5
mmHg. A difference exists due to the presence of deadspace ventilation and physiologic
shunt. Any change in anatomic deadspace or pulmonary perfusion alters ventilation
perfusion mismatch so as to increase the difference between end-tidal and PaCO2 values.
Clinical Applications for Capnography
Changes in dead space and perfusion in the critically ill patient make end tidal CO2 an
unreliable indicator of arterial CO2. Hence the most useful application for the capnograph
in the acute care setting is in situations where an accurate estimate of arterial PCO2 is not
needed. End tidal CO2 may be useful to detect:
• correct placement of ET tube in trachea during emergency intubations.
• the presence or absence of respirations.
• accidental extubation or tube malposition
• ventilation perfusion mismatching, in conjunction with arterial CO2
measurements
• observation in the setting of controlled CO2 regulation (eg head injury)
Question15) You are caring for a patient with severe asthma.
Their arterial CO2 is 90 mmHg and their ETCO2 is 25 mmHg. Provide a
rationale for the large difference between the arterial and end tidal CO2.
©R. Butcher & M. Boyle, Revised 2009.
Page - 38
Certificate in Advanced Mechanical Ventilation & Respiratory Support.
Additional Reading:
• Kraus, B, Salvatore, S, & Falk J, 2008 “Carbon
Dioxide Monitoring (Capnograph)y” 2008,
UpToDate, edited by Burton D. Rose, published by
UpToDate in Waltham, MA.
• Ahrens, T, Sona,C, 2003, “Capnography Application
in Acute and Critical Care” AACN Clinical Issues,
Volume 14, Number 2, pp. 123-132
• Mecham, C. 2008 “Pulse Oximetry”2008, UpToDate,
edited by Burton D. Rose, published by UpToDate in
Waltham, MA.
• McMorrowa, R & Mythen, M, 2006, “Pulse Oximetry”
Current Opinion in Critical Care, 12:269–271.
©R. Butcher & M. Boyle, Revised 2009.
Page - 39
Certificate in Advanced Mechanical Ventilation & Respiratory Support.
2.1 Support of Oxygenation
Generally speaking oxygen and positive pressure (CPAP/PEEP) are utilised to treat
problems of oxygenation whilst mechanical ventilatory support is used to treat ventilatory
failure.
Hypoxaemia caused by the following is responsive to oxygen therapy:
Hypoventilation
Diffusion impairment
Ventilation-Perfusion Inequality
Hypoxaemia that result from shunt is not as responsive to oxygen therapy.
Oxygen therapy also involves a consideration of the other factors that determine oxygen
delivery and utilisation eg. Cardiac Output, Haemoglobin, Blood Distribution.
Oxygen Administration.
Method
Approx. O2
Concentration
Non Rebreather
50-90%
Venturi Mask
24-50%
Nasal Cannula
23-36%
Simple Mask
(e.g. Hudson, CIG)
©R. Butcher & M. Boyle, Revised 2009.
Comments
Contains a one way valve /
diaphragm that expels expired gases
and prevents rebreathing.
Reservoir must remain adequately
inflated.
Allows specific concentrations of
oxygen to be delivered to the patient
when a tight seal exists. Relies on
entraining ambient air, therefore
should not require humidification.
Flow rates of greater than 4 litres
per minute can cause the nasal
mucosa to dry.
Works with mouth breathing
patients, due to the creation of a
reservoir in the oropharynx.
Allows patient to eat, etc., while
receiving O2
Cheap.
Low flows of oxygen may not be
able to flush out CO2.
Page - 40
Certificate in Advanced Mechanical Ventilation & Respiratory Support.
Question 16) What are the potential complications of administering
high concentrations of oxygen for an extended period?
©R. Butcher & M. Boyle, Revised 2009.
Page - 41
Certificate in Advanced Mechanical Ventilation & Respiratory Support.
Continuous Positive Airway Pressure (CPAP)
CPAP and PEEP are not separate modes of ventilation as they do not provide ventilation.
Rather they are used together with other modes of ventilation or during spontaneous
breathing to improve oxygenation (CPAP may also decrease the work of breathing by
increasing FRC). PEEP specifically refers to the application of a fixed amount of positive
pressure to a mechanical ventilation cycle, during which spontaneous breathing is not
present. CPAP refers to the addition of a fixed amount of positive airway pressure to
spontaneous respirations.
The major benefit of PEEP and CPAP is achieved through their ability to increase
functional residual capacity (FRC) and keep FRC above Closing Capacity. The increase
in FRC is accomplished by increasing alveolar volume and through the recruitment of
alveoli that would not otherwise contribute to gas exchange. Thus increasing oxygenation
and lung compliance.
The potential ability of PEEP and CPAP to open closed lung units increases lung
compliance and tends to make regional impedances to ventilation more homogenous.
Therefore, when used correctly, peak airway pressures may be significantly less than
predicted.
CPAP may be delivered through a ventilator or through a separate respiratory circuit
specifically designed for the spontaneously breathing patient. Generally there are two
broad categories used to describe the CPAP circuits, namely non-reservoir and reservoir
CPAP.
Nonreservoir CPAP can be provided with a high flow system. The gas flow required is
very high (up to 120 l/min). The gas flow source may be either a high flow meter or a
flow generator (venturi). The system is generally noisy and is difficult to effectively
humidify gas because the high flows exceed the humidifier capabilities. Due to these
limitations reservoir CPAP is often more desirable for prolonged or continuous use in the
care of the critically ill patient.
©R. Butcher & M. Boyle, Revised 2009.
Page - 42
Certificate in Advanced Mechanical Ventilation & Respiratory Support.
O2 Blender &
High Flow Meter
Pressure Gauge
Bacterial
Filter
Mask
Humidifier
Reservoir Bags
PEEP Valve
The previous diagram depicts a typical reservoir CPAP circuit. You will note that this
circuit contains an oxygen blender and a flow meter allowing for high concentrations of
oxygen and high flow rates. Additionally there is a PEEP valve and a humidifier may be
added when required. With reservoir CPAP there is also, of course, a reservoir bag. The
purpose of the reservoir bag is to provide an additional source of gas to supplement flow
during inspiration. If the flow of gas available from the respiratory circuit is less than the
patient's inspiratory flow rate, even transiently, airway pressure will decrease and work of
breathing will increase. Ideally, the size and elastic properties of the reservoir bag should
be such that a constant pressure is exerted, despite alteration in volume. The continuous
gas flow rate should be adjusted to sustain reservoir bag inflation during the inspiratory
phase of the respiratory cycle. When the reservoir bag is large relative to the patient's tidal
volume and is constructed of thin, highly compliant rubber, gas flow rate need only be
slightly greater than the patient's minute volume. Thus, decreasing the variation in flow
across the PEEP valve and minimising airway pressure fluctuation during breathing.
©R. Butcher & M. Boyle, Revised 2009.
Page - 43
Certificate in Advanced Mechanical Ventilation & Respiratory Support.
Physiological Responses to CPAP / PEEP
Fluid retention and diminished urinary output are commonly observed in patients
receiving PEEP, particularly in conjunction with mechanical ventilation. Mechanical
ventilation and PEEP increase the production of antidiuretic hormone, decrease mean
renal artery perfusion pressure, redistribute perfusion from the cortex, reduce urine flow,
reduce creatinine clearance and diminish fractional excretion of sodium.
PEEP and CPAP may decrease cardiac output and mean arterial blood pressure through a
decrease in venous return and hence ventricular filling, as illustrated in the following
diagram. In patients with poor left ventricular function and pulmonary oedema the
addition of CPAP or PEEP may improve cardiac output through an improvement of stroke
volume.
Effects of CPAP
CPAP results in
-
increased CVP
decreased RVEDV (preload)
increased PVR (RV afterload)
increased PAWP (wedge pressure)
decreased LVEDV (preload)
decreased LV afterload
©R. Butcher & M. Boyle, Revised 2009.
Page - 44
Certificate in Advanced Mechanical Ventilation & Respiratory Support.
Schematic Representation Of The Multiple Effects Of Positive Pressure Ventilation On
Renal Function (adapted from Perel & Stock 1992 P 69)
Positive Pressure Ventilation
Increased Intrathoracic Pressure
Decreased Cardiac Filling
Decreased Left Ventricular
Size
Decreased Atrial
Natriuretic Factor
Pressure, Inferior Vena
Cava
Decreased Cardiac Output
Decreased Mean Arterial
Pressure
Increased Baroreceptors
Increased Antidiurectic
Hormone
Increased Renal Nerve
Stimulation
Increased Renin - angiotensin - aldosterone.
Decreased Urine Volume
Decreased Urine Sodium Excretion
©R. Butcher & M. Boyle, Revised 2009.
Page - 45
Certificate in Advanced Mechanical Ventilation & Respiratory Support.
CPAP - may be administered through demand valve that will generate flow in response
to the patient effort or a continuous flow of gas or with a demand valve that will
generate flow in response to patient effort. In other systems the potential gas flow must
exceed the patients peak inspiratory flow. Therefore a continuous gas flow system often
must include a reservoir.
CPAP - may be delivered through a ventilator. In this case the ventilators demand
valve will control the flow of gas to match the patients inspiratory effort. In other
systems flow must exceed the patients demands.
INADEQUATE FLOW - will increase the patients inspiratory effort and work of
breathing
SIGNS OF INEFFECTIVE CPAP DELIVERY:
- Deflating reservoir bags
- Decrease in airway pressure during inspiration
- Increase in airway pressure during expiration.
©R. Butcher & M. Boyle, Revised 2009.
Page - 46
Certificate in Advanced Mechanical Ventilation & Respiratory Support.
Endotracheal and Tracheostomy Tubes.
In the past the Drinker Tank (iron lung) ventilator was employed for patients with
respiratory failure. This type of ventilator was useful for patients suffering from polio, but
would be inadequate for many of the patients encountered in intensive care units today, as
there was no airway protection or a means through which oxygen enriched gas could be
delivered to the patient. This type of ventilation is known as negative pressure
ventilation. Today, positive ventilation pressure is the mode of choice. To initiate
positive pressure ventilation, an endotracheal or tracheostomy tube is usually used to
secure the airway.
Other indications for endotracheal intubation are:
airway maintenance/protection
access to airway for sputum removal
Positive pressure ventilatory support may also be given via facemask in some
circumstances.
©R. Butcher & M. Boyle, Revised 2009.
Page - 47
Certificate in Advanced Mechanical Ventilation & Respiratory Support.
Oral vs Nasal ET tubes
Endotracheal tubes may be inserted nasally or orally. The advantages, disadvantages and
contraindications are listed below
Nasal Tubes
Advantages
•
•
•
•
Oral Tubes
Advantages
Allows access to the mouth for •
hygiene and communication i.e. lip •
reading
•
Easier to secure
Greater stability
More comfortable for the majority of
patients
Disadvantages
Disadvantages
•
•
•
•
•
•
•
Higher Incidence of purulent and
serous otitis and sinusitis than oral
tubes
Risk of damage to the turbinates and
nares
More difficult to perform
Requires a smaller ET tube
Contraindications
Easier to perform
Requires less equipment
Allows a larger tube to be used
•
•
•
•
Less secure
Less comfortable for patients
Necessity for suitable pharyngeal
anatomy
Risk of cervical spine motion
Acute facial or cerebral trauma
where the integrity of the cribiform
plate is unknown.
Immunocompromise
Significant coagulopathies /
heparanised patients
©R. Butcher & M. Boyle, Revised 2009.
Page - 48
Certificate in Advanced Mechanical Ventilation & Respiratory Support.
Types of Tracheostomy Tubes.
• Standard high volume low pressure cuff tubes - a disposable inner cannula is
available for some of these tubes (refer unit practice)
• High volume low pressure cuffed tube with additional lumen to allow the
patient to speak (eg PITT speaking tube) or to allow suctioning above the cuff
(eg EVAC tracheostomy tube)
• Standard uncuffed tube
• Fenestrated Tube with inner cannula
• Silicone tube with foam cuff
Refer to unit product information/resources for use and relative merits of these different
tubes.
The major elements necessary to provide a safe level of care for the patient with an
endotracheal/trachy tube may be categorised under the following headings:
1) Securing the tube
2) Cuff management
3) Tube suctioning
4) Humidification
Securing the Tube
Properly securing the tube in the intubated patient is important for the following reasons:
1. To prevent accidental extubation
2. To prevent advancement into one of the main bronchi
3. To minimise the frictional damage to the upper airway, larynx and trachea.
4. To prevent ulceration at the sight of endotracheal insertion. Oral tubes may be
moved from side to prevent the development of pressure sores.
The depth of the tube should be marked or noted to ensure that the tube has not been
advanced or withdrawn.
Cuff Management
Tracheal ischaemia can occur any time that the cuff pressure exceeds or approaches
capillary pressure (approximately 32 mmHg), causing inflammation, ulceration, infection,
and dissolution of cartilage rings. Failure to recognise this progressive degeneration
sometimes resulted in erosion of through the tracheal wall (into the Innominate Artery if
the erosion was anterior, or the oesophagus if the erosion was posterior) or long term
sequelae of tracheomalacia or tracheal stenosis.
Although the use of low-pressure cuffs has reduced the incidence of tracheal ischaemia, it
is still important to measure cuff pressure. The intra cuff pressure should be measured
periodically. The cuff should be inflated just beyond the point where an audible air leak
occurs, but should not exceed a pressure of 25 cms/H20 on expiration. Maintaining the
cuff pressure at approximately 25-29 cms of H2O will generally allow an adequate seal to
©R. Butcher & M. Boyle, Revised 2009.
Page - 49
Certificate in Advanced Mechanical Ventilation & Respiratory Support.
permit mechanical ventilation, while not compromising blood flow to the tracheal
mucosa.
The need to continually add air to a cuff in order to maintain an acceptable cuff pressure
may indicate that:1) the cuff or pilot tube has a hole in it
2) the pilot tube valve is broken or cracked
A continual leak of air escaping past the vocal cords could be caused by:
1. A high airway pressure
2. A tube that is positioned incorrectly and the cuff is lying between the vocal cords.
3. An inadequately inflated cuff.
The tube position should ideally be at ~4cms above the carina but inferior to the vocal
cords. Head position alters tube depth. Flexion advances tube depth 1-3cms toward the
carina whereas extension or lateral rotation will retract the tube up 2cms towards the
pharynx.
If the patient's lung compliance is low increased airway pressures may splint the airway
open causing a gas leak around the cuff. To maintain an adequate seal in patients with low
compliance the cuff may need to be inflated higher than 25 cms/H2O during inspiration.
In this instance devices such as the "Pressure Easy" cuff pressure controller or similar
mechanical devices may be useful. (A Foam Cuff tube can also be used) These devices
draw gas from the ventilator / ventilator circuit and inflate the cuff during inspiration,
therefore providing an adequate seal during ventilator inspiration and maintaining an
acceptable pressure during expiration.
2.1.1 Tube Suctioning
Tube suctioning should be employed in order to prevent tube blockage and facilitate the
removal of secretions from the patient's airway.
©R. Butcher & M. Boyle, Revised 2009.
Page - 50
Certificate in Advanced Mechanical Ventilation & Respiratory Support.
Considerations When Suctioning
• Disconnection from the ventilator may result in the loss of PEEP and entrainment of
air into the lungs during suctioning with subsequent desaturation
• Suctioning is an aseptic technique, requiring, hand washing, gloves and a sterile
catheter.
• Complications associated with suctioning
⇒ mucosal damage
⇒ hypoxaemia
⇒ atelectasis
⇒ bronchoconstriction
⇒ arrhythmia’s
⇒ increased ICP
• Pre-oxygenation, the use of suction bullets or closed suction units may decrease the
incidence of desaturation.
• Suctioning time should be restricted to ~10 seconds.
• Suction should not be a routine ie. every two hours, but should be attended to as the
patients condition warrants.
Question 17) Describe the process you would implement
to distinguish between a leaking cuff to one that is not providing
an adequate seal - through high airway pressures or malpositioning.
In your answer suggest how the problem may be rectified.
Humidification - An Introduction
The following section is meant as an introduction to the basic principles and concepts of
humidification. A more detailed discussion is available in the mechanical ventilation
package.
Humidity is the amount of vaporised water contained within a gas. There are two
measures of humidity, namely absolute and relative humidity.
• Absolute humidity refers to the total mass of water contained in a given volume of
gas at a given temperature. Stated another way absolute humidity refers to the actual
amount of moisture present in a volume of gas, at a given temperature.
•
Relative humidity is a ratio of actual (absolute) humidity to the amount of water
vapour that gas could potentially contain at a given temperature. This means that
although the actual amount of moisture in a volume of gas, at 37oc, may be 30 g/L
(absolute humidity), the gas could potentially hold 43.4 g/L of water vapour. The
relative humidity of the gas, in this instance, would be approximately 69% (30/43.4 x
100). If the actual or absolute humidity equals the potential humidity that a volume of
gas can hold at a given temperature then the relative humidity equals 100%. From the
©R. Butcher & M. Boyle, Revised 2009.
Page - 51
Certificate in Advanced Mechanical Ventilation & Respiratory Support.
previous example, 100% relative humidity at 37oC would be achieved if the absolute
humidity was 43.4 g/L.
Relative humidity may be calculated using the following formulae:
RH = Actual Vapour Density
water capacity
x 100
or
RH =
water content
Absolute
water capacity x 100 or
potential
x 100%
When absolute and relative humidity are equal, ie relative humidity equals 100%, no
further moisture may be added to the gas unless the temperature is increased. A rise in
temperature will therefore increase the potential amount of water content that could be
contained in a gas. As the temperature increases absolute humidity will remain constant,
whereas the relative humidity will be diminished. This is because the actual amount of
moisture that is contained within the gas is unchanged but the potential amount of water
that could be contained within the gas is increased, as illustrated below.
Temperature
Absolute Humidity
Relative Humidity
100%
30oC
30.4 g/m3
70%
37oC
30.4 g/m3
Dew point
The temperature at which saturation and condensation will occur with a given level of
humidity. If the relative humidity is close to 100% then a relatively small temperature
drop causes water vapour condensation (dew) on adjacent objects.
The Need for Humidification
In health inspired gases entering the upper trachea are warmed and humidified, by the
naso-oropharynx, to a temperature of 32 - 36oC with a relative humidity of ~ 90%. As the
gas travels through the respiratory tract humidification and warming continues through to
the alveoli until the gas is fully saturated (i.e. absolute humidity 43.4 g/m3) at 37oC.
Inspired gases delivered to the patient via an endotracheal / tracheostomy tube completely
bypass these normal mechanisms of humidification and warming supplied by the nasooropharynx. To compound this problem the supplies of medical air and oxygen delivered
to the patient via the endotracheal / tracheostomy are cool and dry, with an absolute
humidity of 0.00. Cold and dry gases presented to lower respiratory tract can cause the
following complications:
I) Mucosal ulceration, inflammation and increased mucus viscosity
II) Depressed ciliary function
III) Microatelectasis
IV) Airway obstruction caused by tenacious sputum.
To overcome this problem inspired gases delivered through the endotracheal tube should
be heated to body temperature (i.e. 37oC) with a minimum relative humidity of 75%.
©R. Butcher & M. Boyle, Revised 2009.
Page - 52
Certificate in Advanced Mechanical Ventilation & Respiratory Support.
Heat and moisture exchangers
The heat and moisture exchanger retains condensed exhaled water which vaporises on the
next inspiration, providing the patient with humidification and heat conservation. This
hydro-fobic filter reaches peak efficiency in 3-4 breaths.
With this device as the gas is exhaled it cools and the moisture condenses on the filter
providing a moist surface are for the following inspiratory flow. However these only
provide 30 mg H2O/ litre of gas (68% humidity) which is inadequate and tube blockage
may occur. (They are generally only used on a short-term basis, < 24 hours - eg. short
term post op. ventilation). (Oh 1986)
Question18) The hot water bath humidifiers used for intubated
patients in this hospital have controls that regulate
both the bath temperature and the deliver tubing temperature. If the hot water bath
is heated to 37 degrees C and the delivery tube is heated to 38 degrees C what effect
does this have on the relative humidity of the gas as it enters the inspiratory limb?
Further Reading:
• Bersten AD, Oh TE. “Humidification and inhalation therapy”. In; Oh TE, ed.
Intensive Care Manual, 4th ed 1997, Butterworth-Heinemann, Oxford
• Oh T.E (ed) (1990) Intensive Care Manual. J.B. Lippincott Co. Philadelphia.
©R. Butcher & M. Boyle, Revised 2009.
Page - 53
Certificate in Advanced Mechanical Ventilation & Respiratory Support.
References and Useful Resources
1. “Routine monitoring for the critically ill” 1991 in Intensive Care Medicine, 2nd ed., J, Rippe,
R, Irwin, J, Alpert, M, Fink, M, Little, Brown and Company, Boston.
2. Ackerman MH, Ecklund MM, Abu-Jumah M. “A review of normal saline instillation:
implications for practice”. Dimensions of Critical Care Nursing, 1996;15(1):31-38
3. Berghuis, et al, 1992, Spacelabs Biophysical Measurement Series; Respiration
4. Bersten AD, Oh TE. “Humidification and inhalation therapy”. In; Oh TE, ed. Intensive Care
Manual, 4th ed 1997, Butterworth-Heinemann, Oxford
5. Blotch, H. (1987) Phenomena of Respiration: Historical Overview to the 20th Century, Heart
and Lung, Vol 16,( ).
6. Branson RD, Chatburn RL. “Humidification of inspired gases during mechanical ventilation”.
Respiratory Care, 1993;38(5):461-468
7. Carpenter KD. Oxygen transport in the blood. Crit Care Nurse, 1991; 11(9):20-31
.
8. Chamney AR. “Humidification requirements and techniques”. Anaesthesia, 1969; 24(4):602613
9. Chatburn RL, Primiano FP. “A rational basis for humidity therapy”. Respiratory Care, 1987.
32(4):249-254
10.Cohen IL, Weinberg PF, Fein A, Rowinski S. “Endotracheal tube occlusion associated with the
use of heat and moisture exchangers in the intensive care unit”. Crit Care Med, 1988;16(3):277279
11.Ellstrom, K. (1990) Respiratory Distress, Nursing 90, Vol 20,(11).
12.Epstein CD., Henning RJ. Oxygen transport variables in the identification of tissue hypoxia.
Heart & Lung, 1993; 22(4):328-345.
13.Fisher & Paykel Healthcare Publication. Why Fisher & Paykel humidification is vital. 1993
14.Guyton, A.C. (1986) Textbook of Medical Physiology, (7th Ed) W.B. Saunders, Philadelphia.
15.Hall, J. Schmidt, G. & Wood, L. 1992, Principles of Critical Care, ed, McGraw Hill Inc, New
York
16.Hedley RM, Allt-Graham J. “Heat and moisture exchangers and breathing filters”. Br. J.
Anaesthesia, 1994:73:227-236
17.Hicking, K., Henderson, S., & Jackson, R. 1990, “Low mortality associated with low volume
©R. Butcher & M. Boyle, Revised 2009.
Page - 54
Certificate in Advanced Mechanical Ventilation & Respiratory Support.
pressure limited ventilation with permissive hypercapnia in severe adult distress syndrome”,
Intensive Care Medicine, vol. 16 pp. 372-377.
18.Hickling, K.1992, “Low volume ventilation with permissive hypercapnia in the adult
respiratory distress syndrome” Clinical Intensive Care, vol. 17. Pp. 908-911.
19. Holzapfel, L, Chevert, S. Madiner, G, Ohen, Demingeon, G, Coupry, A. & Chaudet, M.
“Influence of long-term oro- or nasotracheal intubation on nosocomial maxillary sinusitis and
pneumonia: results of a prospective, randomised clinical trial”, Critical Care Medicine, vol. 21,
no. 8, pp. 1132-1138.
20.Hudak C.M.; Gallo B.M.; Benz J.J. (1990) Critical Care Nursing.
Philadelphia.
J.B. Lippincott Co.
Jackson C. “Hunidification in the upper respiratory tract: a physiological overview”. Intensive and
Critical Care Nursing, 1996;12:27-32
21.Janusek, L. (1990) Metabolic Acidosis Nursing 90, Vol 20,(7).
22.Janusek, L. (1990) Metabolic Alkalosis, Nursing 90, Vol 20,(6).
23.Kacmarek, R. & Hess, D. 1994, “Basic Principles of Ventilator Machinery”, in Principles and
Practice of Mechanical Ventilation, M. Tobin, ed, McGraw Hill, New Work.
24.Kersten, L.D. (1989) Comprehensive Respiratory Nursing. W.B. Saunders and Co.
Philadelphia.
25.Kinney MR., Packa DR., Dunbar SB. AACN'S Clinical Reference For Critical Care Nursing.
26.Montianari, J. (1986) The fine art of measuring Tracheal cuff pressure, Nursing 86, Vol 16,(7).
27.Oh T.E (ed) (1990) Intensive Care Manual. J.B. Lippincott Co. Philadelphia.
28.Perel A., Stock MC. Handbook of Mechanical Ventilatory Support. 1992. Williams & Wilkins.
29.Portex Company Publication. Why a low pressure Cuff?
30.Reischman RR. Impaired gas exchange related to intrapulmonary shunting. Crit Care Nurse,
1988; 8(8):35-39.
31.Reischman, R. (1988) Review of Ventilation Perfusion Pathology, Critical Care Nurse, Vol
8,(7).
32.Rossi, A. Ranieri, 1994, “Positive end-expiratory pressure” in Principles and Practice of
Mechanical Ventilation, M. Tobin, ed, McGraw Hill, New Work.
33.Schroeder, C. (1988) Pulse Oximetry: a Nursing Care Plan, Critical Care Nurse,
©R. Butcher & M. Boyle, Revised 2009.
Page - 55
Certificate in Advanced Mechanical Ventilation & Respiratory Support.
34.Shelly MP, Lloyd GM, Park GR. “A review of the mechanisms and methods of humidification
of inspired gases”. Intensive Care Med, 1988;14:1-9
35.Shelly MP. “Inspired gas conditioning”. Respiratory Care, 1992:37(9):1070-1080
36.Slutsky, A. (1993), “Mechanical Ventilation”, Chest, Vol 104, no 6, pp 1833 - 1859.
37.Smith, R. 1992, “Positive end-expiratory pressure (PEEP) and continuous positive airway
pressure (CPAP)” in Handbook of Mechanical Ventilatory Support, A. Perel and Stock, M. eds,
Williams & Williams, Baltimore.
38.Szaflarski, N. and Cohen, N. (1991) Use of Capnography in critically ill adults, Heart and
Lung, Vol 20,(4).
39.Taylor, D. (1990) Respiratory Acidosis, Nursing 90, Vol 20,(9).
40.Tsuda T, Noguchi H, Takumi Y, Aochi O. “Optimum humidification of air administered to a
tracheostomy in dogs”. Br. J. Anaesth., 1977;49:965-974
41.Tuxen, D. 1994, “Permissive Hypercapnia”, in Principles and Practice of Mechanical
Ventilation, M. Tobin, ed, McGraw Hill, New Work
42.Villafane MC, Cinnella G, Lofaso F, Isabey D, Hart A, Lemaire F, Brochard L. “Gradual
reduction of endotracheal tube diameter during mechanical ventilation via different
humidification devices”. Anesthesiology, 1996;85(6):1341-1349
43.Williams R, Rankin N, Smith T, Galler D, Seakins P. “Relationship between the humidity and
temperature of inspired gas and the function of the airway mucosa”. Crit Care Med,
1996;24(11):1920-1929
©R. Butcher & M. Boyle, Revised 2009.
Page - 56
Certificate in Advanced Mechanical Ventilation & Respiratory Support.
Acid Base Interpretation
The following section provides a more detailed look into acid base interpretation as
additional reading for those interested in this topic.
©R. Butcher & M. Boyle, Revised 2009.
Page - 57
Certificate in Advanced Mechanical Ventilation & Respiratory Support.
Acid Base Interpretation – a detailed look
(Martin Boyle)
Introduction
Metabolic processes in the body result in the production of relatively large amounts of
carbonic, sulfuric, phosphoric, and other acids. A person weighing 70 kg disposes daily of
about 13 moles of carbon dioxide through the lungs and about 70 to 100 mmol of
titratable, nonvolatile acids, mainly sulfuric and phosphoric acids, through the kidneys.
Acid/base balance is generally explained in terms of the carbonic acid-bicarbonate
system. This is the most important buffer system and describes the relationship between
the respiratory and metabolic components of acid/base balance, the partial pressure of
carbon dioxide (pCO2) and bicarbonate (HCO3-), respectively. This relationship is defined
by the Henderson and Henderson-Hasselbach equations.
The relationship between bicarbonate (HCO3-), CO2, and pH is described by the
Henderson-Hasselbalch Equation
Like all acids Carbonic acid (H2CO3) dissociates to some degree when in
solution. The degree of dissociation refers to the relative concentrations of
carbonic acid and the three ions that make it up (H+, HCO3- and CO32-). The
degree of dissociation is described by a dissociation constant (K') such that;
K' = [H+]X [HCO3-]
[H2CO3]
The concentration of carbonic acid is not able to measured. Carbonic acid also
dissociates to CO2 and H2O.
H+ + HCO3anhydrase)
H2CO3
CO2 + H2O
(in the presence of carbonic
The CO2 can be measured. Allowances for the difference in concentration of
H2CO3 and CO2 give rise to a new dissociation constant K such that
K = [H+] X [HCO3-]
[CO2]
When this is expressed as logarithms(10),and rearranged, it becomes the
Henderson-Hasselbalch Equation
pH = 6.1 + log [HCO3-]
[CO2]
(6.1 is the pK )
From this equation it can be seen that;
an increase in HCO3- is associated with a rise in pH
a decrease in HCO3- is associated with a fall in pH
Butcher
an increase
in dissolved
CO2 is associated with a fall in pH
©R.
& M. Boyle,
Revised 2009.
a decrease in dissolved CO2 is associated with a rise in pH
Page - 58
Certificate in Advanced Mechanical Ventilation & Respiratory Support.
The fact that HCO3- is not an independent variable and varies with changing pCO2 has
meant that empirically derived correction formulas need to be used to adjust the HCO3for both acute and chronic changes in pCO2. A parameter termed "standard bicarbonate of
blood" was defined as the plasma HCO3- in blood that has been equilibrated with a pCO2
of 40 mmHg at 37oC, and used as a reference value to assess the change of HCO3- .
The base excess (BE) was introduced in the late 1950's as a more pure measure of
metabolic disturbance. The BE is calculated as the amount of acid or base that must be
added to a litre of blood to achieve a normal pH (the hydrogen ion concentration
expressed as it's negative log) after correcting the pCO2 to 40 mmHg at normal body
temperature. This was called actual BE (ABE) by Radiometer or invitro BE by Corning.
This definition caused problems in practice, as the pH fall with increasing pCO2 was
greater in the intact individual than for blood invitro due to haemoglobin's buffering of
CO2. This led to a fall in BE (a metabolic acidosis) being apparently caused by an acute
increase in an individual's pCO2, which was not the intent of the original definition.
This led to the concept of the “extracellular base excess” or “invivo base excess”
(Corning) or “standard base excess” (SBE, Radiometer). The model of extracellular fluid
was defined as the blood diluted three-fold with its own plasma giving an effective
haemoglobin concentration of about 5 g/dL. The SBE does not change with acute changes
in pCO2. If, after theoretical equilibration with a pCO2 of 40 mmHg, the pH is lower than
normal, then alkali must be added to titrate pH back to normal, i.e. it has a negative SBE
or a base deficit (BD). On the other hand, if after theoretical equilibration with a pCO2 of
40 mmHg, the pH is alkaline compared to normal, acid must be added to titrate the pH
back to normal i.e. it has a positive SBE.
Although these measures may be used to establish if a metabolic abnormality is present or
not they do not give insight into the cause or mechanism underlying the abnormality. The
anion gap (AG) has been used to establish, in the case of a metabolic acidosis, whether
the acidosis is associated with an increase in unmeasured anion (eg. lactate) if the AG is
raised or, if normal, a hyperchloraemic acidosis. However, AG in critically ill patients has
been shown to be unreliable, probably because of the generally low albumin levels seen in
this patient group.
The identification of metabolic acid/base abnormalities is an important aspect of critical
care management. Although the SBE may be used to establish if a metabolic abnormality
is present or not, it does not give insight into the cause or mechanism underlying the
abnormality. The anion gap (AG) has been used to establish, in the case of a metabolic
acidosis, whether the acidosis is associated with an increase in unmeasured anions (eg.
lactate) if the AG is raised or, if normal, a hyperchloraemic acidosis. However, AG in
critically ill patients has been shown to be unreliable, probably because of the generally
low albumin levels seen in this patient group.
Stewart (1986) proposed an alternative approach to acid/base physiology using
quantitative physical chemical analysis. He analysed the reactions of the components of
plasma with respect to dissociation equilibria, electroneutrality and conservation of mass.
Stewart developed equations based upon the dissociation equilibrium reactions of the
strong ions, weak ions, CO2 and the requirement for electroneutrality. Strong ions
dissociate (ionise) completely when in solution and can be considered spectator ions
because their unionised fractions remain negligible across the physiological pH range.
©R. Butcher & M. Boyle, Revised 2009.
Page - 59
Certificate in Advanced Mechanical Ventilation & Respiratory Support.
The dissociation of weak acids on the other hand varies depending upon factors such as
changes in pH and temperature within the normal physiological range.
The Stewart approach established hydrogen ion concentration ([H+]) and HCO3concentration [HCO3-] as dependent on the difference between the concentration of strong
cations and strong anions (the strong ion difference or SID), the pCO2, and the total
concentration ([ATOT]) of ionised ([A-]) and non ionised ([HA]) weak acids where [ATOT]
= [HA] + [A-]. With the aid of a computer program Stewart solved the resulting
polynomial equation for the dependent variable, [H+], for differing values of the
independent variables SID, ATOT, and pCO2. A change in pH therefore, indicates that
there must be a change in one or more of these independent variables. This is very
different from the relationship of pH to pCO2 and [HCO3-] in the Henderson-Hasselbach
equation, which is one of association, not cause.
The Stewart Approach - Acid/Base Physiology
The pH of water
The starting point for Stewart's analysis was the ionic nature of water. Pure water (H2O)
ionises slightly at body temperature to form minute quantities of hydrogen ion (H+) and
hydroxyl ions (OH-). This dissociation occurs so that at equilibrium the compound (i.e.
H2O) and the dissociation products occur in concentrations such that;
[H+] X [OH- ] = dissociation constant (KH20)
[H2O]
As a result of the requirement of electroneutrality the [H+] is the same as the [OH-]. The
pH of neutrality is 7.0 at room temperature and 6.8 at 370C. The important point here is
that pure water contains hydrogen ions, albeit in very small quantities, as a result of
dissociation and there is a very large potential pool of hydrogen ions in water if
conditions result in a change in dissociation. A solution does not become acidic until there
are more H+ than OH-.
The Effect of Strong Ions on the pH of Water - The Strong Ion Difference (SID)
Compounds that ionise (dissociate) strongly when in solution are called strong ions.
Conversely compounds that ionise (dissociate) weakly when in solution are called weak
ions.
The addition of strong ions to water changes the pH of the resulting solution. That is, the
strong ions change the rate of dissociation of water molecules. Stewart determined that
the pH of the resulting solution is dependent on the difference in concentration of strong
cations relative to strong anions. Ions such as sodium (Na+), potassium (K+), magnesium
(Mg+), and calcium (Ca+) are strong cations whilst chloride (Cl-) and sulphate (SO42-) are
strong anions. The difference between the concentrations of strong cations and strong
anions in a solution is termed the strong ion difference or SID. It follows that in solutions
of strong ions a change of pH indicates that there has been a change of the relative
concentration of strong cations and strong anions i.e. the SID has changed.
©R. Butcher & M. Boyle, Revised 2009.
Page - 60
Certificate in Advanced Mechanical Ventilation & Respiratory Support.
Stewart made the point that it was incorrect to maintain that [H+] of a solution could be
changed by moving H+ into or out of a solution. This is not possible simply because pH is
the result of the reactions caused by the SID.
The pH of Blood Plasma explained by Stewart
Blood plasma is a complex solution containing not only strong ions such as the cations
Na+, K+, Mg+, Ca+, and the anions Cl-, SO42-, but also weak ions such as inorganic
phosphate (HPO43-, H2PO4- etc) and proteins, and is made up with a great deal of water.
Blood plasma also contains CO2 as a result of cellular respiration. The dissolution of CO2
results in the formation of dissolved CO2, bicarbonate ion (HCO3-), carbonic acid
(H2CO3), and carbonate ion (CO32-).The Stewart approach established hydrogen ion
concentration ([H+]) and HCO3- concentration [HCO3-] as dependent on the difference
between the concentration of strong cations and strong anions (the strong ion difference
or SID), the pCO2, and the total concentration of ionised and non ionised weak acids
([ATOT]) where [ATOT] = [HA] + [A-]. With the aid of a computer program Stewart was
able to solve the resulting polynomial equation for the dependent variables, [H+] and
[HCO3-] for differing values of the independent variables, SID, ATOT, and pCO2.
In summary Stewart determined that hydrogen ion concentration was dependent upon the
SID, ATOT, and pCO2. A change in pH and [HCO3-] therefore indicates that there must be
a change in one of these independent variables. Or conversely, the change in the
independent variables has caused a change in the pH and [HCO3-].
This is very different from the relationship of pH to pCO2 and [HCO3-] in the HensersonHasselbach equation, which is one of association, not cause.
A Closer Look at SID
Figure 1 displays the relative value of anions and cations in plasma. The area marked
"anion gap" represents the anions that are not usually measured.
mEq/L
Figure 1. Balance of Cations and Anions in Plasma
160
140
120
100
80
60
40
20
0
Other cations
Ca++, Mg++
Other
strong
anions
Anion gap
SID
K+
Na+
Cations
Protein &
Phosphate
-
HCO3
-
Cl
Anions
The requirement for electroneutrality means that the sum of positive charges equals the
sum of the negative charges i.e. plasma cation charges = plasma anion charges. This can
be approximated for the plasma by;
©R. Butcher & M. Boyle, Revised 2009.
Page - 61
Certificate in Advanced Mechanical Ventilation & Respiratory Support.
[Na+] = [HCO3-] + [Cl-] + [unmeasured anions]
The unmeasured anions represent the AG. The unmeasured anions are normally made up
of phosphates, sulphates, creatinates, and proteins. The Stewart approach defines another
gap that has been termed the strong ion gap. The strong ion gap is made up of strong ions
not normally present or not present in large amounts such as lactate, keto-acids, or
ureamic acids. Unmeasured strong ions can be produced endogenously as in the
production of lactate in anaerobic glycolysis, keto-acids as in diabetic ketoacidosis, or
uraemic acids in renal failure, or they can be from an exogenous source as in the infusion
of lactate containing fluids or as a result of ingesting poisons such as ethylene glycol and
methanol, which are metabolised to oxalic and formic acids.
As described earlier the relative balance of strong ions is termed the strong ion difference
or SID.
The SID is the difference between the concentration of the strong cations, sodium (Na+),
potassium (K+), calcium (Ca2+), and magnesium (Mg2+), and the strong anions, chloride
(Cl-), lactate, and unmeasured anions. The contribution of Ca2+ and Mg2+ are usually
ignored, as the respective values are small and don’t vary much. SID is then calculated as;
SID = [Na+] + [K+] - ([Cl-] + [lactate] + [unmeasured strong anions]).
Stewart determined that for plasma "the SID is nearly always positive, and typically has a
value of about 40 meq/L. As the SID increases, [H+] falls (i.e. pH rises). Conversely, as
SID decreases, [H+] rises." (ie. pH falls).
This fact can be used to determine if unmeasured strong anions are contributing to the
acid/base state if the use of [Na+], [K+], [Cl-] and lactate in the calculation of SID does not
explain the pH of a blood sample. Therefore other strong ions (a strong ion gap) must be
present. This is expanded upon in a later section Analysis of acid/base status using the
Stewart approach.
Effect of pCO2 on [H+] and pH
If the SID were held constant an increase in pCO2 results in an increase in [H+] and thus a
decrease in pH. Conversely a decrease in pCO2 results in a decrease in [H+] and an
increase in pH.
The Effect of [ATOT] on [H+]
As discussed earlier [ATOT] represents the total concentration of non-volatile weak acids
(protein and phosphate). The contribution of ATOT to acid/base balance has been described
in a number of laboratory as well as clinical studies. Plasma proteins are the major
contributors of weak acid anions and albumin has been found to be the major component
of the protein contribution. Hypoalbuminaemia has been shown to be a common cause of
metabolic alkalosis in the critically ill. The other contributor to ATOT is the concentration
of inorganic phosphate (Pi). The blood levels of Pi are generally low so it only effects
acid/base balance when Pi levels are raised, as in renal failure.
©R. Butcher & M. Boyle, Revised 2009.
Page - 62
Certificate in Advanced Mechanical Ventilation & Respiratory Support.
[ATOT] along with SID and pCO2 is an independent determinant of [H+] or pH such that an
increase in [ATOT], as a result of raised plasma albumin results, in a fall in plasma pH
whilst a decrease in [ATOT], as a result of lowered plasma albumin, results in a rise in
plasma pH. For instance chronic hypoproteinaemia (and thus low albumin) as a result of
liver cirrhosis, nephrotic syndrome, and malnutrition can be associated with a metabolic
alkalosis.
Regulation of pH using the Stewart Approach
In addition to the respiratory system and renal system Stewart included the
gastrointestinal tract as key elements in the regulation of acid-base balance. The following
is a summary of how Stewart explains pH regulation in respect of the respiratory, renal,
and gastrointestinal systems.
Respiratory Regulation
If there is a change in [H+] the respiratory centre is stimulated to alter alveolar ventilation.
Acidosis results in an increase in ventilation whilst alkalosis results in a decrease in
ventilation. Blood levels of carbon dioxide are thus decreased or increased which results
in a decrease and increase in [H+] respectively. This respiratory compensation occurs
rapidly but is unable to compensate completely because as the pH approaches normal the
drive from the respiratory centre also diminishes.
The respiratory centre responds to changes in pH and PaCO2 to alter the minute
ventilation. An increased minute ventilation lowers PaCO2 and thus results in an increase
in pH whilst decreased minute ventilation results in increased PaCO2 and thus a decrease
in pH.
Renal Regulation
Stewart suggests the kidneys contribute to the regulation of acid/base balance by
controlling the SID by Na+, K+, and Cl- excretion / reabsorption. The kidneys also act to
adjust SID by the relative reabsorption of Na+ and Cl- in order to restore the SID. Every
Cl- filtered but not reabsorbed results in an increase in plasma SID, whilst every Na+ and
K+ not reabsorbed results in a decrease in plasma SID. NH4+ production from NH3+ split
from glutamine and glutamic acid allows the kidneys to increase the Cl- loss in urine
relative to Na+ and K+ and still maintain electroneutrality in urine.
“If the circulating plasma arriving at the kidneys has an above normal [H+] (low pH),
the kidneys will react by reabsorbing less Cl-, thereby slowly raising plasma [SID],
increasing Cl- excretion, and lowering urine [SID]. Conversely, if plasma [H+] is
below normal (raised pH), Cl- reabsorption will be increased, plasma [SID]
decreased, and urine [SID] increased. Because of the primary role of plasma [Na+] in
ECF volume regulation, manipulation of Cl- reabsorption is the only mechanism the
kidney has for affecting plasma [SID] and thereby plasma [SID]”
The relatively small urine volume per hour compared to the plasma flow through the
kidneys means that changes in strong ion excretion can only change plasma levels of
©R. Butcher & M. Boyle, Revised 2009.
Page - 63
Certificate in Advanced Mechanical Ventilation & Respiratory Support.
strong ions by a small amount per unit time. Therefore renal compensation is slower than
the respiratory compensation but has the ability to produce a complete correction.
GI Regulation
The GI tract deals directly with strong ions and therefore has a strong bearing on
acid/base balance. Chloride is secreted into the gastric lumen as gastric acid. This results
in a slight increase in plasma SID and thus an increase in pH. Under normal
circumstances the Cl- is returned to plasma by reabsorption in the duodenum and the
normal plasma SID is maintained. If there is loss of gastric contents from vomiting or
nasogastric drainage this reabsorption does not take place and Cl- is lost i.e. this results in
an increase in the SID and thus a metabolic alkalosis.
The alkaline pancreatic juices excreted into the duodenum contain large amounts of Na+
to achieve an increased SID. The Na+ is reabsorbed in the small intestine. In the large
intestine water absorption takes place along with Na+ and K+ exchanges. In diarrhoea
water, Na+, and K+ are unable to be reabsorbed resulting in a loss of strong cation, a
decrease in SID, and metabolic acidosis.
Acid- Base Disorders
In this discussion acidaemia and alkalaemia refer to a deviation in the pH of blood from
normal whilst acidosis and alkalosis refer to the underlying metabolic or respiratory
disturbance.
Acid/base disorders are usually classified as, respiratory acidosis, respiratory alkalosis,
metabolic acidosis, metabolic alkalosis or a combination of these. It is important to
recognise that a normal pH does not mean that a patient has no acid-base disturbance.
Using this approach acid/base disturbances can result from changes to the SID, pCO2, or
ATOT. The SID can change as a result of excess or deficit of plasma water as seen by
abnormal [Na+], an increase or decrease in [Cl-] relative to [Na+], or the addition of
unidentified strong anions such as occurs in lactic acidosis, keto acidosis, renal failure,
and some poisoning.
Respiratory Acidosis and Alkalosis
Respiratory acidosis results from inadequate ventilation and the retention of CO2 whilst
respiratory alkalosis results from hyperventilation or excessive ventilation and a reduction
in pCO2. (see section 6 for a discussion of compensatory changes)
Metabolic Acidosis and Alkalosis
©R. Butcher & M. Boyle, Revised 2009.
Page - 64
Certificate in Advanced Mechanical Ventilation & Respiratory Support.
Metabolic acidosis can result from a reduction in the SID or from an increase in ATOT as
in hyperphosphataemia resulting from renal failure.
A reduction in SID can result from an increase in strong anion concentration relative to
strong cation concentration for instance;
• Loss of Na+ relative to Cl- associated with diarrhoea.
• Administration of a solution with zero SID or low SID as with the administration of
large quantities of normal saline (SID = 0). This results in an increase in Cl- relative
to Na+, a reduction in plasma SID and metabolic acidosis.
• Production of excess amounts of "other strong anions" as in lactic acidosis where the
raised plasma lactate level causes a reduction in SID i.e. SID = [Na+] + [K+] - [Cl-] +
lactate.
• Administration of haemofiltration fluid containing lactate in the setting of reduced
ability to metabolise lactate, for example in liver failure, or when the administration of
lactate exceeds the ability to metabolise lactate, as in high volume haemofiltration. In
the circumstance where lactate metabolism is adequate, the exogenous lactate is
metabolised with no net change to plasma SID. However, if the exogenous lactate is
unable to be metabolised the plasma lactate level rises resulting in a reduced SID and
metabolic acidosis.
• Renal failure and the accumulation of ureamic products.
• Ingestion of poisons that result in an increase in "unmeasured strong anions" such as
methanol poisoning and ethylene glycol poisoning
Metabolic Alkalosis can result from;
• An increase in the SID as a result of decreases in strong anions relative to strong
cations, for example, as a result of Cl- loss from vomiting or nasogastric aspiration, or
the loss of Cl- in the urine as a result of diuretic therapy.
• An increase in strong cation relative to strong anion, for example, as a result of
sodium bicarbonate administration. In the case of the administration of sodium
bicarbonate for the correction of a metabolic acidosis the administration of the strong
cation Na+ and the increase in plasma SID is the mechanism underlying it's effect. The
bicarbonate is an accompanying weak anion that is quickly metabolised and thus does
not effect SID. A similar effect results from the administration of sodium acetate and
sodium citrate.
• A decrease in [ATOT] as a result of a lowered plasma albumin level as a result of liver
cirrhosis, nephrotic syndrome, malnutrition, critical illness and haemodilution.
Analysis of Acid/Base Status Using the Strong Ion Approach
Although the Stewart approach provides a comprehensive quantitative analysis of
acid/base balance its utility at the bedside is limited by the need to solve complicated
equations. Also, Stewart assumed a single dissociation constant to describe ATOT, a term
which represents all non-volatile weak acids. The model was therefore not able to
describe the effects of changes of non-volatile weak acids such as inorganic phosphate
(Pi) and plasma proteins, on [H+].
Figge et al. defined the relationship between Pi and plasma protein and [H+]. They
determined that albumin was the major contributor of weak acid anions and were thus
able to quantify the alkalinising effect of hypoalbuminaemia and the acidifying effect of
©R. Butcher & M. Boyle, Revised 2009.
Page - 65
Certificate in Advanced Mechanical Ventilation & Respiratory Support.
hyperalbuminaemia. It was therefore possible to quantify all the independent variables
that determine acid/base balance i.e. SID, pCO2, and ATOT (the ionisation of albumin and
Pi). The presence of “unidentified anions” was estimated by the calculation of a strong
ion gap (SIG). The SIG was defined as the difference between the activity of all the
usually measured cations, termed the apparent SID (SIDa) (Na+, K+, Mg2+, Ca2+) and
anions (Cl-, “unidentified anions”), and the effective SID (SIDe). SIDe was calculated
from the relationships between pH, CO2, phosphate and protein developed by Stewart and
modified by Figge et al.
A variation on the method described by Figge et al. has been presented by Gilfix et al.
They developed the idea, initially put forward by Fencl, that the BE is the net result of
changes to SID and ATOT and thus changes in SID resulting from deviations in Na+
(change in free water) or Cl-, and changes in ATOT, resulting from deviations in the
ionisation of albumin from reference values, could be quantified as BE effects. Any
difference between the sum of the three BE effects and the actual or reported BE was
termed the BE-gap and indicated the presence of “other species” or unmeasured anions or
cations. The BE-gap correlated well with both SIG and AG.
Kellum and colleagues, extending the work of Stewart and Figge by including all
abundant anions (Na+, K+, Mg2+, Ca2+) and cations (Cl-, lactate, urate) in the calculation
of SIG showed it to be sensitive and specific in the detection of unknown anions. The BEgap has been reported by Balasubramanyan et al. to identify unmeasured anions in
critically ill children despite normal BE and AG and that BE-gap was more strongly
associated with mortality than BE, AG, or lactate.
The methods described by Figge et al. and Gilfix et al. still require the calculation of
equations that entail the assistance of a programmable calculator or computer. To enable
the easy bedside assessment of the causes of metabolic acid/base disturbances, we
developed a simplified method using equations able to be calculated as mental arithmetic.
The equations we developed estimate BE effects of changes in SID and ATOT and the
contribution of unmeasured ions (BE-gap).
Calculation of BE Effects
The BE effects can be calculated as described by Gilfix et al. The equations are presented
in Table 1.
The effect of the change of [Na+] from normal is calculated to determine the free water
effect. The measured [Cl-] was corrected ([Cl-]corrected) for the change in measured [Na+]
from normal [Na+] and the Cl-corrected effect calculated. Gilfix et. al. used an equation for
the ionisation of albumin derived by Figge et.al. This equation was later revised by these
investigators to incorporate information on the contribution of histidine residues on the
surface of albumin. The revised equation is used.
Gilfix et al. treated lactate as an unmeasured anion. We include it in our calculation of
SID and BE effects because it is a SI at physiological pH and is now commonly a
measured anion. Unmeasured anions or cations are termed BE-gap and calculated as the
difference between the reported SBE and the sum of the free water, Cl-, and Alb- effects.
©R. Butcher & M. Boyle, Revised 2009.
Page - 66
Certificate in Advanced Mechanical Ventilation & Respiratory Support.
The effects of the changes in SIs is termed the “delta SI effect” and calculated as the sum
of the free water, Cl-, and lactate effects.
Although Gilfix et al. did not include Pi in their calculations of BE effects the effect of Pi
can also be calculated as the difference between the concentration of Pi and the normal
concentration of Pi ions at pH 7.4. The hospital's laboratory normal value for Pi is 1.15
mmol/L which, using the equation in Table 2 for the ionisation of Pi, equals a
concentration of 2.09 mEq/L.
Table 1. Calculations of BE Effects
Parameter (mEq/L)
Calculation
Alb
Albumin (g/L) X (0.123 X pH - 0.631) (12)
PiPi (mmol/L) X (0.309 X pH - 0.469) (15)
Pi effect
2.09 - PiFree water effect
0.3(measured Na+ -141) (16)
Cl- corrected
Cl- measured X (141 /Na+ measured) (16)
Cl- effect
102 - Cl- corrected (16)
Alb effect
(0.123 * pH - 0.631) X (41 - Albumin (g/L)
Lactate effect
-1 X lactate
Delta SI effect
Free water effect + Cl- effect + lactate effect
BE-gap
(Delta SI effect + albumin effect) – reported SBE
The POW Way (Estimation of BE Effects)
How to determine if a metabolic acidosis or alkalosis is present
The pH is looked at first to determine if there is an acidaemia or alkalaemia. If the pH is
within the normal range a respiratory or metabolic acidosis or alkalosis can still be
present. The respiratory and metabolic components must be looked at to determine if
there is a corresponding acidosis or alkalosis.
The respiratory component of course is the pCO2. The pCO2 indicates whether a
respiratory acidosis or alkalosis is present. If the pCO2 is < 35mmHg a respiratory
alkalosis is present and if the pCO2 is > 45mmHg a respiratory acidosis is present.
Next, it needs to be determined if the change in pCO2 explains the pH. The SBE is used to
determine if more than an alteration in pCO2 is present.
The meaning of Base Excess
The BE asks the question – is the cause of any acid/base change the result of a change in
pCO2? The change in pH as a result of a change in pCO2 is “removed” by adjusting the
pCO2 to 40 mmHg. The question then becomes; “is there a remaining acid/base
change?” (i.e. a metabolic acidosis/alkalosis).
©R. Butcher & M. Boyle, Revised 2009.
Page - 67
Certificate in Advanced Mechanical Ventilation & Respiratory Support.
The SBE is actually a measure of the net strong ion (and/or [ATOT]) effect or the strong
ion (and/or [ATOT]) excess or deficit as the case may be. A base deficit (or negative SBE)
corresponds to a positive difference between normal SID and the actual SID whilst a SBE
corresponds to negative difference between normal SID and actual SID.
If there is a metabolic component the next question is "is it explained by alterations in the
strong ions that have been used in the calculation of [SID]?" Or is it explained by the
addition of “unmeasured” strong anions i.e. is there a strong ion gap? Also the effects of
changes in albumin and phosphate must be considered.
Analysing the metabolic component – estimating BE effects
An estimate of the SID is made using [Na+]+ [K+] - [Cl-] - Lactate. Using our laboratory’s
normal values the normal SID is 42.2 mEq/L. In order to simplify calculations a reference
value for SID of 42 mEq/L is used to estimate any change from normal. This is termed the
estimated delta SID and is equal to estimated SID minus normal SID (42 mEq/L). This is
arranged in this way so that a negative estimated delta SID corresponded to a negative
BE.
An estimate of the Alb- effect (estimated Alb- effect) is made by calculating 0.25 of the
difference between an approximation for the normal value for Albumin (41 g/L) of 40 g/L
and the measured value, 0.25 being used to allow mental calculation. The use of 0.25 of
the difference in measured albumin and normal albumin to estimate Alb- is considered
reasonable as the ionisation is 0.26 at a pH of 7.2, 0.28 at a pH of 7.4 and 0.29 at pH of
7.5. The use of 0.25, assuming a change of albumin from normal of 20g/L, would result in
an error of less than 1 mEq/L for this pH range.
The expected BE based upon the estimated delta SID effect and the estimated Alb- effect
is termed the predicted BE. The estimated BE-gap (BE-gapest) is then calculated as the
difference between actual SBE and the predicted BE. The equations used to calculate the
estimated BE effects are presented in Table 2.
Table 2. Estimation of BE Effects
Parameter (mEq/L)
SID
estimated SID
estimated Delta SI effect
©R. Butcher & M. Boyle, Revised 2009.
Calculation
[Na+] + [K+] - [Cl-] - Lactate - unmeasured anions
[Na+]+ [K+] - [Cl-] - Lactate
estimated SID - 42
Page - 68
Certificate in Advanced Mechanical Ventilation & Respiratory Support.
estimated Alb- effect
predicted SBE
BE-gapest
0.25 X (40 - measured Albumin (g/L))
estimated SID - 42 + estimated Alb- effect
SBE - predicted SBE
The use of negative and positive numbers for SBE where a negative SBE is really a SBD
has the potential to lead to some confusion when discussing SBE of SI effects. However,
the SBE is a measure of the net result of the various acidifying and alkalising effects of
changes in the determinants of [H+]. This fact is illustrated in Figure 2. It is obvious from
this analysis that two equal and opposite effects could coexist, producing a normal SBE.
Or alternatively, metabolic acid/base abnormalities can exist when SBE is normal. For
example, a hyperchloraemia may develop, by renal resorption of Cl-, to produce a change
in SID to compensate for the alkalising effect of low albumin that often develops in the
critically ill. This of course would not be considered a clinically treatable acid/base
abnormality. However, it is interesting to note that if a patient in this situation were given
albumin to correct the hypoalbuminaemia this would "unmask " the SI effect resulting
from the hyperchloraemia, and this acidifying effect would be seen by a change in the
SBE.
An Example
The technique of estimating SI effects using SBE as a reference lends itself to a
comprehensive and simple bedside analysis of acid/base balance.
The results for a patient suffering from rhabdomyolysis and renal failure:
pH
SBE (mEq/L)
pCO2 (mmHg)
Na+ (mEq/L)
K+
(mEq/L)
(mEq/L)
Cllactate (mEq/L)
Albumin (g/L)
Phosphate (Pi) mmol/L
ionised phosphate (Pi-) mEq/L
7.07
-19.3
31.4
147
3.9
120
1.8
31
1.5
2.7
The estimate of the SID, taking into account [Na+ ], [K+], [Cl-] and lactate, is 28.8 mEq/L.
The difference between this and the reference value of 42 is -13.2. That is, if there were
no other acid/base abnormality other than a change in SID, resulting from changes in the
concentrations of the strong ions used in the calculation, the SBE would be -13.2. The
change of albumin from normal must also be taken into account. The albumin is 18g/L,
which is a change from the normal value of 40g/L of 22g/L. We can estimate the charge
contribution of the ionisation of albumin as 0.25 of the difference in measured albumin
and normal albumin i.e Alb- (mEq/L) = 0.25 x 22 (g/L) = 5.5. Therefore the low albumin
will have an SBE effect or alkalising effect of 5.5 and the delta SID an SBE effect or
acidifying effect of -13.2. The predicted SBE is then -7.7 (-13.2 + 5.5). However the
reported SBE is -19.3. The slightly raised phosphate does not explain this difference.
There then must be "Other Species" or unmeasured strong ions contributing to the
©R. Butcher & M. Boyle, Revised 2009.
Page - 69
Certificate in Advanced Mechanical Ventilation & Respiratory Support.
metabolic acidosis. The BE-gapest is equal to the reported SBE minus the predicted SBE (19.3 + 7.7) ie. -11.6 mEq/L. The patient was suffering from acute renal failure as a result
of rhabdomyolysis and shock, and, had a diabetic keto acidosis indicated by
hyperglycaemia and the presence of ketones in the urine. Renal failure and diabetic keto
acidosis both result in the accumulation of strong ions, acetoacetate and βhydroxybutyrate in the case of DKA, and sulphate, phosphate and other ureamic acids in
renal failure. Whereas, if this patient had been unconscious in the emergency department,
and was not diabetic, it would indicate that a check for other strong anions such as
formate, oxalate, and salicylate would be indicated. The strong ion effects for this patient
are displayed graphically in Figure 2.
Figure 2. Estimated Strong Ion Effects.
20
10
mEq/L
0
-10
estimated Other Species
predicted SBE
estimated Alb- effect
estimated Change in SID
-30
SBE
-20
Where it is established that a change in the strong ions are contributing to the acid/base
disturbance it may be useful to calculate the free water effect and [Cl-]corrected effect,
although an examination of the blood results together with the clinical history, in our
experience, is generally sufficient to establish if [Cl-] is high or low with respect to [Na+].
Unmeasured anions other than lactate have been shown to be increased in patients with
sepsis and liver disease and the presence of unmeasured cations have been suggested
To establish the presence of small concentrations of unmeasured ions the determination of
the strong ion gap or SIG can be used. The SIG is the difference between the apparent
SID and the effective SID. The apparent SID is calculated as the difference between the
strong cations (Na, K, Mg, Ca) and the strong anions (Cl-, lactate). The effective SID is
the sum of the charge contribution of CO2, albumin and phosphate.
The SIG was calculated according to the following formula:
SIG = [SID]e – [SID]a
In order to be consistent with the other calculations the order of the variables was
reversed so that a negative and positive SIG indicates a preponderance of unmeasured
anions and cations respectively.
©R. Butcher & M. Boyle, Revised 2009.
Page - 70
Certificate in Advanced Mechanical Ventilation & Respiratory Support.
[SID]a was calculated according to the following formula:
[SID]a = Na+ + K+ + Mg2+ + Ca2+ - (Cl- + lactate) (ionised concentrations were expressed
in mEq/L)
[SID]e was calculated according to the following formula:
[SID]e = 2.46E-8 X pCO2 (mmHg)/(10-pH) + [albumin (g/L)] x (0.123 X pH – 0.631) +
[Pi (mmol/L)] X (0.309 X pH – 0.469)
Compensatory changes to pCO2 and SBE for acute and chronic conditions.
The following extract is from an article;
Schlichtig R, Grogono AW, Severinghaus JW. Human PaCO2 and the standard base
excess compensation for acid-base imbalance. Crit care Med 1998;26(7):1173-1179
OBJECTIVES: Renal and respiratory acid-base regulation systems interact with each
other, one compensating (partially) for a primary defect of the other. Most investigators
striving to typify compensations for abnormal acid-base balance have reported their
findings in terms of arterial pH, PaCO2, and/or HCO3-. However, pH and HCO3- are
both altered by both respiratory and metabolic changes. We sought to simplify these
relations by expressing them in terms of standard base excess (SBE in mM), which
quantifies the metabolic balance and is independent of PaCO2.
DESIGN: Meta-analysis.
SETTING: Historical synthesis developed via the Internet.
PATIENTS: Arterial pH, PaCO2, and/or HCO3- data sets were obtained from 21
published reports of patients considered to have purely acute or chronic metabolic or
respiratory acid-base problems.
INTERVENTIONS: We used the same data to compute the typical compensatory
responses to imbalances of SBE and PaCO2. Relations were expressed as difference
(delta) from normal values for PaCO2 (40 torr [5.3 kPa]) and SBE (0 mM).
MEASUREMENTS AND MAIN RESULTS: The data of patient compensatory
changes conformed to the following equations, as well as to the traditional PaCO2 vs.
HCO3- or H+ vs. PaCO2 equations:
Acute
Metabolic change responding
to change in PaCO2
∆SBE = 0 x ∆PaCO2, hence:
SBE = 0
©R. Butcher & M. Boyle, Revised 2009.
Chronic
∆SBE = 0.4 x ∆PaCO2
Page - 71
Certificate in Advanced Mechanical Ventilation & Respiratory Support.
Acidosis
Respiratory change responding
∆PaCO2 = 1.0 x ∆SBE
Alkalosis
∆PaCO2 = 0.6 x ∆SBE
to change in SBE
CONCLUSION: Data reported by many investigators over the past 35 yrs on typical,
expected, or "normal" human compensation for acid-base imbalance may be expressed in
terms of the independent variables: PaCO2 (respiratory) and SBE (metabolic).
Note.
The Siggaard-Anderson Acid-Base Chart can also be used to determine the expected
change in SBE and pCO2 to acid-base abnormalities
References & Further Reading
1. Androgue HJ, Madias NE. Arterial Blood-Gas Monitoring: Acid-Base Assessment.
In: Tobin MJ. Principles and Practice of Intensive Care Monitoring, New York:
McGraw-Hill Inc., 1998:217-241.
2. Schlichtig R, Grogono AW, Severinghaus JW. Human PaCO2 and standard base
excess compensation for acid-base imbalance. Crit Care Med 1998;26(7):1173-1179.
3. Siggaard-Andersen O. Fogh-Andersen N. Base excess or buffer base (strong ion
difference) as measure of a non-respiratory acid-base disturbance. Acta Anaesthesiol
Scand 1995;39:Supplementum 107, 123-128.
4. Kellum JA, Kramer DJ, Pinsky MR. Strong ion gap: A methodology for exploring
unexplained anions. J Crit Care 1995;10(2):51-55.
5. Stewart PA. How to Understand Acid-Base. A Qualitative Acid-Base Primer For
Biology and Medicine. New York: Elsevier North Holland Inc., 1981.
6. Stewart PA. Modern quantitative acid - base chemistry. Can J Physiol Pharmacol
1983;61:1444-1461.
7. Leblanc M and Kellum J A. Biochemical and biophysical principles of hydrogen ion
regulation. In: Ronco C, Bellomo R, editors. Critical Care Nephrology. Dordrecht:
Kluwer Academic Publishers, 1998:261-277.
8. Fencl V, Leith DE. Stewart's quantitative acid-base chemistry: applications in biology
and medicine. Respir Physiol 1993;91:1-16.
9. Kellum JA. Metabolic acidosis in the critically ill: Lessons from physical chemistry.
Kidney Int Suppl 1998;53(66):S81-S86.
10. Wilkes P. Hypoproteinemia, strong-ion difference, and acid-base status in critically ill
patients. J Appl Physiol 1998;1740-1748.
©R. Butcher & M. Boyle, Revised 2009.
Page - 72
Certificate in Advanced Mechanical Ventilation & Respiratory Support.
11. Figge J, Rossing TH, Fencl V. The role of serum proteins in acid-base equilibria. J
Lab Clin Med 1991;117(6):453-467.
12. Figge J, Mydosh T, Fencl V. Serum proteins and acid-base equilibria: a follow-up. J
Lab Clin Med 1992;120(5):713-719.
13. Rossing TH, Maffeo N, Fencl V. Acid-base effects of altering plasma protein
concentration in human blood in vitro. J Appl Physiol 1986;61(6):2260-2265.
14. McAuliffe JL, Leonard JL, Leith DE, Fencl V. Hypoproteinemic alkalosis. Am J Med
1986;81:86-89.
15. Fencl V, Jabor A, Kazda A, Figge J. Diagnosis of metabolic acid-base disturbances in
critically ill patients. Am J Respir Crit Care Med 2000;162:2246-2251.
16. Gilfix BM, Bique M, Magder S. A physical chemical approach to the analysis of acidbase balance in the clinical setting. J Crit Care 1993;8(4):187-197.
17. Magder S. Pathophysiology of metabolic acid-base disturbances in patients with
critical illness. In: Ronco C, Bellomo R, editors. Critical Care Nephrology. Dordrecht:
Kluwer Academic Publishers, 1998:279-296.
18. Fencl V, Rossing TH. Acid-base disorders in critical care medicine. Annu Rev Med
1989;40:17-29.
19. Balasubramanyan N, havens PL, Hoffman GM. Unmeasured anions identified by the
Fencyl-Stewart method predict mortality better than base excess, anion gap, and
lactate in patients in the pediatric intensive care unit. Crit Care Med,
1999;27(8):1577-1581.
20. Story DA, Morimatsu H, Bellomo R. Strong ions, weak acids and base excess: a
simplified Fencl-Stewart approach to clinical acid-base disorders. BJA 2004;92(1):5460
21. Corey HE. Stewart and beyond: New models of acid-base balance. Kidney Int
2003;64:777-787
22. Boyle M, Lawrence J. An easy method of mentally estimating the metabolic
component of acid/base balance using the Fencl-Stewart approach. Anaesth Intensive
Care 2003;31:538-547
Respiratory Assessment
(Lisa Whelan)
LUNG SOUNDS
Instruments of Auscultation
Principles of modern day stethoscopes:
• Amplify body sounds
©R. Butcher & M. Boyle, Revised 2009.
Page - 73
Certificate in Advanced Mechanical Ventilation & Respiratory Support.
•
•
•
•
Are flexible to assess a variety of body surfaces, along with flexible
transmission tubing
The Diaphragm is for flat surfaces
The Bell is for uneven surfaces.
Useful for auscultation of low and high pitched sounds.
(i) Diaphragm is for low pitched sounds
(ii) Bell is for high pitched sounds
The stethoscope should be well maintained with adequate ear pieces to ensure
that there is no sound distortion.
•
•
•
Ear pieces should fit your ears
Position stethoscope ear pieces to point forward into ear canal, remember
your ear canal run forward.
The stethoscope tubing should be no more than 30cm long to reduce sound
distortion
AUSCULTATION AND PERCUSSION OF THE RESPIRATORY SYSTEM
To examine the respiratory system, you must have an understanding of the
anatomy of the thorax. In understanding the structures, it is important to
remember that some structures will hamper our examination.
•
•
4
4
4
4
4
4
Anteriorly, the heart obscures the middle lung lobes, the liver obscures the
right lower lobe and the spleen obscures the left lower lobe
Similarly, the scapulae obscure the upper and middle lobes posteriorly.
• The best access to the middle lobes is via the auxilla.
INSPECTION OF CHEST
Inspect the thorax for bruising or deformity, which would indicate thorax
trauma or injury to the underlying respiratory structures.
Look at the patients posture, are they lurching forward gasping for breath,
are they comfortable.
Look at the respiratory rate, is the patient apneoic, tachypneoic,
bradyhypneoic, or within normal limits. Combining these observations with
other vital signs such as O2 sats, GCS, heart rate, peripheral perfusion,
and blood sugar level can provide clues indicating hypoxia, hypercarbia
and acid base balance.
Look at the respiratory effort and symmetry/ shape of the thorax.
Inspect the peripheries-look for skin colour, is their signs of cynosis?, is
there evidence of clubbing of the fingers?
Inspect the position of the trachea. The trachea is placed centrally in the
suprasternal notch and lateral borders of the trachea can be felt between
the two heads of the sternomastoid muscles. Diseases of the mediastinum
can shift the mediastinum and pull or push the trachea to one side.
Conditions that push the mediastinum are pleural effusion and
pneumothorax, the ones that pull the mediastinum are fibrosis and lung
collapse.
©R. Butcher & M. Boyle, Revised 2009.
Page - 74
Certificate in Advanced Mechanical Ventilation & Respiratory Support.
Normal findings:
•
•
•
•
side to side symmetrical chest configuration
normal chest shape, with no deformities : barrel chest,kyphosis,
sternal
retraction, sternal protrusion or depressed sternum.
quiet, unlaboured respirations with no use of accessory neck, shoulder or
abdominal muscles.
symmetrically expanding chest wall during respirations.
Palpation of the Chest
4
4
4
3
4
4
4
Palpate chest wall for abnormalities such as fractured ribs, flail segment,
surgical emphysemia.
To measure chest movement-place your hands on the patients back at
the level of the 10th rib, extend your thumbs towards the vertebral column.
Ask the patient to take normal breaths. Differences in chest shape are
significant to note as they are indicators of either chronic disease or factors
that may alter mechanics of breathing, eg, Barrel chest-may indicate
chronic lung disease. Diseases of the vertebral column can lead to
kyphosis or scoliosis of the chest .
Use your hands to feel for vocal fremitis-Ask the patient to repeat the
words “99” and repeat the process in the middle and lower access areas.
The vibrations on both sides should be equal. Increased vocal fremitis will
be seen in areas of pneumonia. Decreased vocal fremitis is seen when
transmission of sound through the lung is diminished due to sound
travelling worse through liquid and this is seen in obstructed bronchi or a
pleural effusion.
Percussion of the Chest
This is a useful technique in examining the unconscious patient as there is
no need for co-operation.
Ö
Use the index finger of your dominant hand which acts as the
‘drumstick’ and
percusses out a note over the third finger of the other
hand.
Ö
Make sure your whole hand is placed firmly on the chest to prevent
air pockets forming under the hand and distorting the sound.
Ö
Do not percuss over bony prominence.
Percuss the apical lobes anteriorly, follow the same process with the
middle and lower lobes (see diagram II for sequence).
There will be an increased percussed sound over air fill cavities such as a
pneumothorax
There will be decreased percussion sound if there is
a)
some chest wall obstruction such as pleural thickeningb)
there is fluid in the pleural cavity as seen with pleural effusions
c)
when the lung is rendered less aerated, as in fibrosis and collapse
Auscultation of the Chest
©R. Butcher & M. Boyle, Revised 2009.
Page - 75
Certificate in Advanced Mechanical Ventilation & Respiratory Support.
4
4
4
Auscultation is useful in determining the presence and quality of air flow
through the tracheobronchial tree and adventitious sounds. There are two
types of breaths sounds- Bronchial and vesicular.
Bronchial breaths sounds are normally heard over large airways. To hear
this sound ask a friend to slowly inhale and exhale through an open mouth,
listen over the trachea with the bell of the stethoscope. The harsh sounds
of breathing you hear are bronchial breaths sounds. These sounds can be
heard when a whole lobe of lung is consolidated as in pneumonia and the
bronchial breath sounds are transmitted to the chest wall
The soft sounds heard over the upper, middle and lower lobes are call
vesicular breath sounds. Listen to breath sounds in the same
sequence as for percussion of the chest.
Vesicular breath sounds will be reduced when
a)
pleural thickening and the chest wall is obstructed.
b)
pleural effusion
c)
the lung is less aerated
d)
pneumothorax
Added/ Adventitious breath sounds
Added breath sounds that arise in the bronchi are called rhonchi4
Rhonchi are continuos noises which are caused by partially obstructed
bronchi lumen. Rhonchi are heard in bronchitis and asthma. In asthma
they are usually expiratory and are called wheezes.
Added breath sounds that arise in the alveoli are called crepitations4
Crepitations are discontinuous or crackling sounds and indicate the
presence of fluid. Fine crepitations are heard in early pneumonia, heart
failure. Coarse crepitations are bubbling sounds heard throughout the
whole of respiration. These sounds are heard in bronchitis and interstitial
fibrosis.
Added breath sounds that arise in inspiration and expiration from the pleura are
called friction or pleural rub.
4
Pleural rub results from the roughened surfaces of the pleura rubbing
against each other. They are unchanged with coughing and are usually
localised and can be increased in intensity with firm pressure on the
stethoscope.
©R. Butcher & M. Boyle, Revised 2009.
Page - 76
Certificate in Advanced Mechanical Ventilation & Respiratory Support.
SECTION B:
“CLASSIFICATION
OF MECHANICAL
VENTILATION”
©R. Butcher & M. Boyle, Revised 2009.
Page - 77
Certificate in Advanced Mechanical Ventilation & Respiratory Support.
INTRODUCTION TO MECHANICAL VENTILATION:
In the past few years there has been an increase in the number of methods by which
positive pressure ventilation can be delivered. The increasing number of methods
available to deliver mechanical ventilation has made it difficult for clinicians to learn all
that is necessary in order to provide a safe and effective level of care for patients
receiving mechanical ventilation. Despite the method by which mechanical ventilation is
applied the primary factors to consider when applying mechanical ventilation are:
• the components of each individual breath, specifically whether pressure, flow,
volume and time are set by the operator, variable or dependent on other
parameters
• the method of triggering the mechanical ventilator breath/gas flow,
• how the ventilator breath is terminated:
• potential complications of mechanical ventilation and methods to reduce
ventilator induced lung injury
• methods to improve patient ventilator synchrony; and
• the nursing observations required to provide a safe and effective level of care
for the patient receiving mechanical ventilation
The following sections will provide an overview of each of the above considerations. This
section - an introduction to mechanical ventilation will provide a rather detailed overview
of four key parameters that are necessary to consider when evaluating and classifying
ventilator delivered breaths. These parameters are
• pressure,
• volume,
• flow and
• time.
If you are relatively inexperienced in the application of mechanical ventilators you may
find this and later sections challenging. Keep in mind as you work through this package
that that the intended aims of this package are to provide you with resource material and
introduce you to topic areas that will form the basis for your future professional
development. Questions throughout the package, and summary pages at the end of
relevant sections, will direct you to the key concepts that are necessary to provide a safe
and effective level of care, for the patient receiving mechanical ventilatory support. If you
are interested in a specific topic area readings are highlighted in the package and a full
reference list is provided. There is purposely no space provided within the package to
answer questions. This, it is hoped, will enable you to develop notes and explore areas of
interest. While attempts have been made to provide you with several answers to the
questions within the text of this document, you may find it useful to discuss answers /
queries with your colleagues. Answers relating to causes of alarm violations, for example,
may be difficult to find in journals or text books. Many of the answers are developed
through experience and it would be useful to utilise some of your colleagues knowledge
in these areas.
©R. Butcher & M. Boyle, Revised 2009.
Page - 78
Certificate in Advanced Mechanical Ventilation & Respiratory Support.
Airway Pressures (Paw)
For gas to flow to occur there must be a positive pressure gradient. In spontaneous
respiration gas flow occurs due to the generation of a negative pressure in the alveoli
relative to atmospheric or circuit pressure (as in CPAP) (refer to following diagram).
.
Inspiratory and Expiratory
Alveolar pressure
Unassisted Breathing
Inspiration
Inspiratory and Expiratory
Alveolar pressure
Ventilated Breath
Inspiration
Expiration
0 cms H2O
Expiration
0 cms H2O
Gas flow
out of
alveoli
Gas flow
into to
alveoli
Gas flow
out of
alveoli
Gas flow
into to
alveoli
Mechanical ventilation delivers flow and volume to the patient’s as a result of the
development of a positive pressure gradient between the ventilator circuit and the
patient’s gas exchange units as illustrated in the diagram above. There are four
pressures to be aware of in regards to mechanical ventilation. These are the:
1. Peak
2. Plateau
3. Mean; and
4. End expiratory pressures.
P
r
e
s
s
u
r
e
Peak
Plateau
End
Expiratory
Time
©R. Butcher & M. Boyle, Revised 2009.
Page - 79
Certificate in Advanced Mechanical Ventilation & Respiratory Support.
Definitions
• Peak Inspiratory Pressure (PIP). The peak pressure is the maximum pressure
obtainable during active gas delivery.
• Plateau Pressure. The plateau pressure is defined as the end inspiratory pressure
during a period of no gas flow.
• Mean Airway Pressure. The mean airway pressure is an average of the system
pressure over the entire ventilatory period.
• End Expiratory Pressure. End expiratory pressure is the airway pressure at the
termination of the expiratory phase and is normally equal to atmospheric or the applied
PEEP level. 1,2,3
Pressure Measurement
During the delivery of a positive pressure breath, system pressure can be measured in a
variety of locations, these include:
•
•
•
•
internal to the ventilator - inspiratory / expiratory;
at the Y piece of the ventilator circuit;
at the airway opening; and
at the carina - by applying the pressure monitoring line to a tracheal tube with
an extra lumen.2
Ventilator
Possible sites for
airway pressure
measurement
The farther away the site of measurement is from the alveoli the greater the potential for
difference between the pressure reading on the ventilator and the pressure in the alveoli2.
Increased resistance to airflow in the ventilator circuit, the endotracheal tube, or the
patients conducting airway will be reflected in an increased difference between peak
inspiratory and alveolar pressure.4
©R. Butcher & M. Boyle, Revised 2009.
Page - 80
Certificate in Advanced Mechanical Ventilation & Respiratory Support.
This means that the pressures measured by the mechanical ventilator will not always be
indicative of alveolar pressure. During inspiration, for example, gas is moving from the
circuit into the alveoli and the pressure in the circuit will be greater than alveolar
pressure. Conversely during expiration, gas is moving from the alveoli into the circuit and
the pressure in the alveoli will be greater than the pressure in the circuit. The only time in
which alveolar pressure equals circuit pressure is during a period of no flow. Periods of
no gas flow occur during an inspiratory hold (pause) or at the end of exhalation after
which time expiratory gas flow has ceased. (Refer to the following diagram).
Because of these considerations the observation of airways pressure during periods of no
flow and when there is no flow can provide useful information.
©R. Butcher & M. Boyle, Revised 2009.
Page - 81
Certificate in Advanced Mechanical Ventilation & Respiratory Support.
Alveolar vs Circuit Pressure
The following diagram depicts how circuit pressure and alveolar pressure differ during
mechanical ventilation. You will note in the pressure trace there are two pressure
recordings. The darkened line (
) represents circuit pressure whereas the
broken line (
) represents alveolar pressure. During inspiration circuit pressure is
greater than alveolar pressure. Conversely during expiration alveolar pressure exceeds
circuit pressure. You will note that the only time when these pressures are equal when
there is a period of no flow ie during an inspiratory pause or after expiration has ceased.
P
r
e
s
s
u
r
e
F
l
o
w
Inspiration
Circuit Pressure >
Alveolar Pressure
Inspiratory Pause
Circuit Pressure =
Alveolar Pressure
Expiration
Circuit Pressure <
Alveolar Pressure
Inspiratory
Flow
Zero Flow
Inspiratory
Pause
Expiratory
Flow
0 lpm
V
o
l
u
m
e
Inspired
Volume
Inspiratory
Pause
Expired
Volume
Time
Alveolar Pressure
Circuit Pressure
©R. Butcher & M. Boyle, Revised 2009.
Page - 82
Certificate in Advanced Mechanical Ventilation & Respiratory Support.
Peak Inspiratory and Plateau Pressures
When pressure is plotted against time for a ventilator machine breath a waveform is
results that is illustrated in the figure on page 5. Two points of significance have been
identified on this graph;
1. Peak Inspiratory Pressure (PIP)
This pressure a function of the compliance of the lung and thorax and the airway
resistance including the contribution made by the tracheal tube and the ventilator
circuit (if the pressure is measured from a site in the circuit that is close to the
ventilator).
2. Plateau Pressure
If volume is kept constant at the end of inspiratory flow the peak inspiratory pressure
will fall to a pressure level called the plateau pressure. The plateau pressure reflects
lung and chest wall compliance.
The drop in pressure from PIP to Plateau results from the fact that inspiratory flow has
ceased therefore pressure is not required to overcome resistance to flow. The pressure also
falls as a result of redistribution of gas within the lungs, “elastic give” (this is a property
of elastic materials which results in a drop in pressure after a period of time at the same
volume) recruitment of alveoli and the effect of surfactant.
As the plateau pressure is the pressure when there is no flow within the circuit and patient
airways it most closely represents the alveolar pressure and thus is of considerable
significance as it desirable to limit the pressure that the alveoli are subjected to. Excessive
pressure may result in extrapulmonary air (eg pneumothorax) and acute lung injury.
An increase in airways resistance (including ETT resistance) will result in an increase in
PIP. An increase in resistance will result in a widening of the difference between PIP and
plateau pressure. A fall in compliance will elevate both PIP and plateau pressure.
While recognising that the causes of ventilator-induced lung injury are multi-factorial, it
is generally believed that end inspiratory occlusion pressure (ie plateau pressure) is the
best clinically applicable estimate of average peak alveolar pressure1. Although
controversial it has been generally recommended that the plateau pressure should be
limited to 35 cms H2O. 2.
©R. Butcher & M. Boyle, Revised 2009.
Page - 83
Certificate in Advanced Mechanical Ventilation & Respiratory Support.
Question 1) Which of the following waveforms indicate
1. an increased resistance
2. a decreased compliance
3. and increased resistance and a decreased compliance
Which type of patient might experience both a decreased
compliance and an increased resistance?
P
r
e
s
s
u
r
e
F
l
o
w
V
o
l
u
m
e
Time
©R. Butcher & M. Boyle, Revised 2009.
Page - 84
Certificate in Advanced Mechanical Ventilation & Respiratory Support.
PEEP and CPAP
Positive end expiratory pressure (PEEP) refers to the application of a fixed amount of
positive pressure applied during mechanical ventilation cycle. Continuous positive airway
pressure (CPAP) refers to the addition of a fixed amount of positive airway pressure to
spontaneous respirations, in the presence or absence of an endotracheal tube. PEEP and
CPAP are not separate modes of ventilation as they do not provide ventilation. Rather
they are used together with other modes of ventilation or during spontaneous breathing to
improve oxygenation, recruit alveoli, and / or decrease the work of breathing.6, 7, 8
The major benefit of PEEP and CPAP is achieved through their ability to increase
functional residual capacity (FRC) and keep FRC above Closing Capacity. The increase
in FRC is accomplished by increasing alveolar volume and through the recruitment of
alveoli that would not otherwise contribute to gas exchange. Thus increasing oxygenation
and lung compliance. 6,7,8.
The potential ability of PEEP and CPAP to open closed lung units increases lung
compliance and tends to make regional impedances to ventilation more homogenous.
Physiological Responses to CPAP / PEEP
PEEP and CPAP may decrease cardiac output and mean arterial blood pressure through a
decrease in venous return and hence ventricular filling, as illustrated in the following
diagram. In patients with poor left ventricular function and pulmonary oedema the
addition of CPAP or PEEP may improve cardiac output through an improvement of stroke
volume. 6,7., 8
Fluid retention and diminished urinary output are commonly observed in patients
receiving PEEP, particularly in conjunction with mechanical ventilation. Mechanical
ventilation and PEEP increase the production of antidiuretic hormone, decrease mean
renal artery perfusion pressure, redistribute perfusion from the cortex, reduce urine flow,
reduce creatinine clearance and diminish fractional excretion of sodium.
©R. Butcher & M. Boyle, Revised 2009.
Page - 85
Certificate in Advanced Mechanical Ventilation & Respiratory Support.
Effects of CPAP
CPAP results in
-
increased CVP
decreased RVEDV (preload)
increased PVR (RV afterload)
increased PAWP (wedge pressure)
decreased LVEDV (preload)
decreased LV afterload
Schematic Representation Of The Multiple Effects Of Positive Pressure
Ventilation On Renal Function (adapted from Perel & Stock 1992 P 69)
Positive Pressure Ventilation
Increased Intrathoracic Pressure
Decreased Cardiac Filling
Pressure, Inferior Vena Cava
Decreased Left Ventricular Size
Decreased Atrial Natriuretic
Factor
Decreased Cardiac Output
Decreased Mean Arterial
Pressure
Increased Baroreceptors
Increased Antidiuretic Hormone
Increased Renal Nerve Stimulation
Increased Renin - angiotensin - aldosterone.
Decreased Urine Volume
Decreased Urine Sodium Excretion
©R. Butcher & M. Boyle, Revised 2009.
Page - 86
Certificate in Advanced Mechanical Ventilation & Respiratory Support.
Question 2) Your patient is on the following ventilator settings
• Tidal Volume: 700 mls
• Plateau pressure: 45
• PEEP 5 cmsH2O
The PEEP is increased to 15 cmH2O and the plateau pressure decreases to 35 cmsH2O.
Provide a rationale for the change in inspiratory pressure.
AutoPEEP
You will recall from the previous section on pressure measurement that circuit pressure is
not always indicative of alveolar pressure. During expiration alveolar pressure is greater
than circuit pressure until expiratory flow ceases. If expiratory flow does not cease prior
to the initiation of the next breath gas trapping may occur. Gas trapping increases the
pressure in the alveoli at the end of expiration and has been termed:
• dynamic hyperinflation;
• autoPEEP;
• inadvertent PEEP;
• intrinsic PEEP; and
• occult PEEP
Although we quite commonly aim for patients to have increased pressure in their alveoli
at the end of expiration (PEEP), autoPEEP is potentially harmful as we may not be aware
of its presence. The effects of autoPEEP are the same as PEEP/CPAP and can predispose
the patient to:
•
an increased risk of barotrauma;
•
fall in cardiac output;
•
hypotension;
•
fluid retention; and
•
an increased work of breathing.
How does the presence of AutoPEEP increase work of breathing?
In health the pressure in the alveoli at the end of expiration is the equivalent to
atmospheric pressure. The pressure between the parietal and visceral pleura at this time is
negative. To achieve gas flow into the alveoli the diaphragm and external intercostal
muscles contract creating a more negative intrapleural pressure. This causes the alveoli to
expand and results in a sub atmospheric alveolar pressure that produces gas flow. When
autoPEEP is present the pressure in the alveoli at end expiration is greater than
atmospheric, the size of the thorax is expanded and the respiratory muscles have returned
to their lengthened resting state. To generate gas flow the respiratory muscles must
shorten enough to expand the thorax beyond its increased dimensions and create a sub
atmospheric alveolar pressure. If this pressure is not generated no gas flow will occur.
When a patient is intubated and on a ventilator the demand response time of the ventilator
may further exacerbate this problem.
©R. Butcher & M. Boyle, Revised 2009.
Page - 87
Certificate in Advanced Mechanical Ventilation & Respiratory Support.
Alveolar Pressure during Normal
Inspiration
Alveolar Pressure during Inspiration
with 20 cms AutoPEEP
20 cms
H2O
0 cms
H2O
0 cms
H 2O
Through the addition of CPAP / PEEP the pressure gradient between the alveoli and the
circuit is reduced, thereby decreasing the inspiratory work of breathing.
Alveolar Pressure during Inspiration with 20
cms AutoPEEP & 15 cms CPAP
20 cms
H 2O
15 cms
H2O
©R. Butcher & M. Boyle, Revised 2009.
Page - 88
Certificate in Advanced Mechanical Ventilation & Respiratory Support.
The Measurement of AutoPEEP
AutoPEEP, unlike externally applied PEEP, is not registered on the ventilator’s pressure
monometer. This is because the ventilator registers circuit pressure and not alveolar
pressure. If however the exhalation valve on the ventilator is occluded immediately before
the onset of the next breath, the pressure in the alveoli and the ventilator circuit will
equilibrate. By performing this manoeuvre the level of auto-PEEP will be displayed on
the ventilator (see following diagram).
Inadvertent PEEP
Airway Pressure
Auto-PEEP
Applied PEEP
Time
Exhalation valve closure
It is important to note that this method of measuring autoPEEP can only be used when the
patient is receiving controlled breaths. When the patient is taking spontaneous or assisted
breaths the pressure in the circuit will obviously drop, to initiate gas flow, and a
measurement of autoPEEP will be unattainable. To ascertain if a patient has autoPEEP
during spontaneous or assisted breaths it is necessary to view the flow waveforms on the
ventilator or insert an oesophageal balloon. An analysis of flow waveforms on the
graphics menu will allow you to detect if autoPEEP is present. If the expiratory flow does
not return to baseline before the next breath autoPEEP is present (see following diagram).
P
R
E
S
S
U
R
E
F
L
O
W
Flow not Returning to Baseline
©R. Butcher & M. Boyle, Revised 2009.
Page - 89
Certificate in Advanced Mechanical Ventilation & Respiratory Support.
By inserting an oesophageal balloon in a patient the presence of autoPEEP can be
ascertained and measured. The basis for using an oesophageal balloon is that oesophageal
pressure has been shown to closely reflect intrapleural pressure. Thus the amount of
oesophageal pressure required to initiate gas flow is reflective of the level of autoPEEP.
Monitors, such as the Bicore Pulmonary Monitor, utilise an oesophageal balloon with a
flow transducer and pressure sensor that can be added to the Y-piece of the ventilator
circuit or connected to a T-piece on a CPAP circuit. The Bicore Pulmonary Monitor
defines auto-PEEP as the difference in end expiratory oesophageal pressure and
oesophageal pressure at the start of inspiratory flow minus sensitivity (see following
diagram). The Bicore defines sensitivity as the measurement of ventilator demand valve
sensitivity. It is calculated as the airway pressure before the onset of inspiratory flow.
Flow
Start of
Inspiratory
Flow
AutoPEEP
Oesophageal
Pressure
•
•
•
•
Question3) Complete the following summary of AutoPEEP:
AutoPEEP is:_________________________________________________________
AutoPEEP can occur in patients who aren’t ventilated
True / False
AutoPEEP can be measured in spontaneously breathing patients by occluding the
exhalation valve
True / False
Which of the following diagrams demonstrates autoPEEP 1, 2, or 3
1
2
3
Pressure
Flow
Volume
©R. Butcher & M. Boyle, Revised 2009.
Page - 90
Certificate in Advanced Mechanical Ventilation & Respiratory Support.
Further Reading - AutoPEEP
10.Kastens, V. 1991, “Nursing management of auto-PEEP” Focus on Critical Care, vol.
18, no. 5, pp 419-421.
11.Tobin, M. & Lodato, R. 1989, “PEEP, auto-PEEP and waterfalls” Chest 1989; 96, pp.
449-451
12.Marini, J. 1989, “Should PEEP be used in airflow obstruction?” American Review of
Respiratory Disease, 140, pp. 1-3.
13.Fernandez, R,. Benito. S. Blanch, L. & Net, A. 1988, “Intrinsic PEEP: a cause of
inspiratory muscle ineffectivity” Intensive Care Medicine, 15, pp. 51-52.
14.Georgopouloulos, D. Giannouli, E. & Patakas, D. 1993, “Effects of extrinsic positive
end expiratory pressure on mechanically ventilated patients with chronic obstructive
pulmonary disease and dynamic hyperventilation” Intensive Care Medicine, 15, pp.
51-52.
©R. Butcher & M. Boyle, Revised 2009.
Page - 91
Certificate in Advanced Mechanical Ventilation & Respiratory Support.
Volume (VT)
Tidal volume refers to the size of the breath that is delivered to the patient. Normal
physiologic tidal volumes are approximately 5-7 mls / kg whereas the traditional aim for
tidal volumes has been approximately 10 - 15 mls / kg. The rationale for increasing the
size of the tidal volume in ventilated patients has been to prevent atelectasis and
overcome the deadspace of the ventilator circuitry and endotracheal tube. Inspired and
expired tidal volumes are plotted on the y axis against time as depicted in the following
diagram.
V
o
l
u
m
e
Expired
Volume
Inspired
Volume
Time
The inspired and expired tidal volumes should generally correlate although certain
circumstances may cause a difference between inspired and expired tidal volumes.
Expired tidal volumes may be less than inspired tidal volumes if:
• there is a leak in the ventilator circuit - causing some of the gas delivered to the patient
to leak into the atmosphere
• there is a leak around the endotracheal / tracheostomy tube - due to tube position,
inadequate seal or cuff leak - causing some of the gas delivered to the patient to leak
into the atmosphere
• there is a leak from the patient, such as a bronchopleural fistula - causing some of the
gas delivered to the patient to leak into the atmosphere
Expired tidal volumes may be larger than inspired tidal volumes due to:
• the addition of water vapour in the ventilator circuitry from a hot water bath
humidifier.
The following diagrams depict examples where inspired and
expired tidal volumes do not correlate.
Inspired TV < Expired TV
Inspired TV > Expired TV
V
o
l
u
m
e
Inspired
Volume
Expired
Volume
Time
©R. Butcher & M. Boyle, Revised 2009.
V
o
l
u
m
e
Inspired
Volume
Expired
Volume
Time
Page - 92
Certificate in Advanced Mechanical Ventilation & Respiratory Support.
Question4): What factors might contribute to the development of atelectasis
in the intubated and ventilated patient?
Flow (V)
Flow rate refers to the speed at which a volume of gas is delivered, or exhaled, per unit of
time. Flow is described in litres per minute (lpm). (Banner and Lampotang) The peak
(inspiratory) flow rate is therefore the maximum flow delivered to a patient per ventilator
breath. Flow is plotted on the y axis of the ventilator graphics against time on the x axis
(refer to following diagram). You will note on the following diagram that inspiratory flow
is plotted above the zero flow line, whereas expiratory flow is plotted as a negative
deflection. When the graph depicting flow is at zero there is no gas flow going into or out
of the patient.
Peak Flow
60 lpm
40 lpm
Inspiratory
Flow
30 lpm
Zero Flow
20 lpm
60 lpm
Expiratory
Flow
80 lpm
©R. Butcher & M. Boyle, Revised 2009.
Page - 93
Certificate in Advanced Mechanical Ventilation & Respiratory Support.
Time (Ti)
Time in mechanical ventilation is divided between inspiratory and expiratory time.
Inspiratory time is a combination of the inspiratory flow period and time taken for
inspiratory pause. The following diagram depicts how the addition of an inspiratory pause
extends total inspiratory time.
Pressure
Pressure
Flow
Flow
Volume
Volume
Insp
Exp.
Ti = 1 second
no inspiratory pause
Insp
Exp.
Ti = 1.5 seconds
with 0.5 second inspiratory pause
Normal inspiratory time on the spontaneously breathing healthy adult is approximately
0.8 - 1.2 seconds, with an inspiratory expiratory (I: E) ratio of 1:1.5 to 1:2 2. At times it
may be advantageous to extend the inspiratory time in order to:
• improve oxygenation - through the addition of an inspiratory pause; or to
• increase tidal volume - in pressure controlled ventilation
Adverse effects of excessively long inspiratory times are haemodynamic compromise,
patient ventilator dysynchrony, and the development of autoPEEP.
Question 5). What are the factors to consider when prolonging inspiratory
time beyond normal parameters?
©R. Butcher & M. Boyle, Revised 2009.
Page - 94
Certificate in Advanced Mechanical Ventilation & Respiratory Support.
Summary Page - Guidelines for Setting and Monitoring Ventilation Settings
- Pressure, Flow, Volume and Time.
The previous sections have provided an overview of pressure, flow, volume and time.
While there are many methods by which mechanical ventilation could be applied the
following guidelines should assist you in providing a safe and effective level of care for
your assigned patients, regardless of what type of ventilation is implemented.
Pressure:
Peak and Plateau Pressure. While recognising that the causes of ventilator induced lung
injury are multifactorial increased intrathoracic pressures have been identified as a
potential mechanism of inducing lung injury. It is generally accepted that the plateau
pressure should not exceed 35 cms H2O.2 An elevated peak pressure above this level may
still be a cause for concern as some alveoli may be receiving this pressure.
End Expiratory Pressure. PEEP and CPAP improve oxygenation through their ability to
increase functional residual capacity. PEEP and CPAP may not only be of benefit in
increasing the level of oxygenation but may also be useful in the recruitment of alveoli,
reduction of work of breathing and the prevention of acute lung injury. Both PEEP and
CPAP however may cause a decrease in cardiac output, fluid retention, and increase the
risk of the development of extra pulmonary air (eg pneumothorax).
Where there is inadequate time for expiration gas trapping may occur and autoPEEP may
be present. AutoPEEP is not registered on the ventilators pressure monitor but may be
identified by:
• observing the flow - time waveform on the graphic waveforms;
• performing and expiratory hold manoeuvre - machine initiated breaths only; or
• by inserting an oesophageal balloon and observing the appropriate pressures.
AutoPEEP is potentially harmful as it represents an additional amount of PEEP that has
not been set by the operator.
Volume. The size of the tidal volume to be delivered is generally dictated by unit practice
(eg 10 mls / kg) but is usually set to ensure adequate elimination of carbon dioxide
without producing excessive inspiratory pressure.
Flow. The peak inspiratory flow rate should be set to match the patient’s inspiratory flow
requirements. Where flow does not meet this requirement the patients work of breathing
may be unnecessarily increased. A type of ventilation with a variable flow delivery
system eg pressure support and pressure controlled ventilation may be more effective in
matching the patient’s inspiratory flow requirements than a ventilation mode with a set
flow, eg volume cycled ventilation.
Where available, a decelerating flow waveform may be preferable as it will result in less
high peak inspiratory pressure than the other flow waveforms.
©R. Butcher & M. Boyle, Revised 2009.
Page - 95
Certificate in Advanced Mechanical Ventilation & Respiratory Support.
Time. Normal inspiratory time is 0.8 - 1.2 seconds with an inspiratory: expiratory of 1:2
or 1:1.5. Prolonging inspiratory time through the addition of an inspiratory pause may be
beneficial in improving oxygenation and recruiting alveoli. In pressure controlled
ventilation increased inspiratory time may also be beneficial in increasing tidal volume
(see section on Pressure Controlled Ventilation). Extending inspiratory time however,
may increase the potential for the development of autoPEEP, cause haemodynamic
compromise and be a source of discomfort to the patient - causing them to “fight” the
ventilation (refer to section on patient ventilator synchrony).
©R. Butcher & M. Boyle, Revised 2009.
Page - 96
Certificate in Advanced Mechanical Ventilation & Respiratory Support.
TRIGGERING
Triggering refers to the mechanism through which the ventilator senses inspiratory effort
and delivers gas flow or a machine breath in concert with the patient’s inspiratory effort.
In modern ventilators the demand valve is triggered by either a fall in pressure (pressure
triggered) or a change in flow (flow triggered). With pressure triggered a preset pressure
sensitivity has to be achieved before the ventilator delivers fresh gas into the inspiratory
circuit. With flow triggered a preset flow sensitivity is employed as the trigger
mechanism.5.
Pressure Triggering
In pressure triggering the sensitivity refers to the amount of negative pressure the patient
must generate to receive a breath/gas flow. If the sensitivity is set at 1 cm then the patient
must generate 1 cm H2O of negative pressure, at the site of pressure measurement, for the
machine to sense the patient's effort and deliver a breath / gas flow. The sensitivity should
be set as close to zero as possible, without allowing the machine to cycle spontaneously.
If the sensitivity is too high the patient's work of breathing will be unnecessarily
increased. It is not a reasonable course of action to increase the sensitivity to reduce
the patient's respiratory rate as you will only increase their work of breathing.
Through observation of the pressure-time trace on the graphics or the ventilators pressure
manometer you will note that quite frequently the pressure drops well below the set
sensitivity. The reason for this drop in pressure is due to the time lag between when the
patient drops the pressure in the circuit and when the ventilator actually delivers flow.
This is known as the demand responsiveness of the ventilator. In some ventilators the
airway pressure drop from end expiratory pressure level is as large as 6-8 cmsH2O with a
0.3-0.7 second time delay. The above mentioned factors are partly determined by the
characteristics of the demand valve and the added resistance of the inspiratory and
expiratory circuits. This leads to an increased inspiratory muscle work and oxygen
consumption.5.
Note the greater negative inflection in the second pressure time trace indicative of a poorer demand response time than the first example.
©R. Butcher & M. Boyle, Revised 2009.
Page - 97
Certificate in Advanced Mechanical Ventilation & Respiratory Support.
Flow Triggering
The flow triggered system has two preset variables for triggering, the base flow and flow
sensitivity. The base flow consists of fresh gas that flows continuously through the circuit
and out the exhalation port, where flow is measured. The patient’s earliest demand for
flow is satisfied by the base flow. The flow sensitivity is computed as the difference
between the base flow and the exhaled flow. Hence the flow sensitivity is the magnitude
of the flow diverted from the exhalation circuit into the patient’s lungs. As the subject
inhales and the set flow sensitivity is reached the flow pressure control algorithm is
activated, the proportional valve opens, and fresh gas is delivered.5.
The time taken for the onset of inspiratory effort to the onset of inspiratory flow is
considerably less with flow triggering when compared to pressure triggering. At a flow
triggering sensitivity of 2 litres per minute, for example, the time delay is 75 milliseconds,
whereas the time delay for a pressure sensitivity of 1 cm H2O is 115 milliseconds depending on the type of ventilator used. The use of flow triggering decreases the work
involved in initiating a breath.15
©R. Butcher & M. Boyle, Revised 2009.
Page - 98
Certificate in Advanced Mechanical Ventilation & Respiratory Support.
VOLUME CYCLED VENTILATION
Volume cycled ventilation delivers a:
• set volume;
• with a variable Pressure - determined by resistance, compliance, inspiratory effort;
• set flow; and an
• inspiratory time that is determined by the inspiratory pause (if activated), flow rate,
and tidal volume.
Inspiratory Pressures
Because pressure is the variable parameter in volume cycled ventilation it is critical to
observe the patient's inspiratory pressures and act appropriately in response to increased
inspiratory pressures.
In volume cycled ventilation the inspiratory pressures vary in response
• to the size of the breath delivered to the patient;
• the resistance of the endotracheal / tracheostomy tube;
• the resistance of the upper airways;
• the patients compliance; and
• inspiratory effort.
By monitoring the peak and plateau pressures in volume cycled ventilation it is possible
to get an estimate of the patient's resistance and compliance.
A large difference between the peak and plateau pressures indicates an increased
resistance. An elevated plateau pressure indicates a decreased compliance. Note it is
possible to have both an increased resistance and decreased compliance, in which case
there may be a large difference between the peak and the plateau pressures as well as
elevated plateau pressures.
©R. Butcher & M. Boyle, Revised 2009.
Page - 99
Certificate in Advanced Mechanical Ventilation & Respiratory Support.
Flow Waveforms
In volume cycled ventilation inspiratory flow is controlled by setting the peak flow and
flow waveform. The peak flow rate is the maximum amount of flow delivered to the
patient during inspiration, whereas the flow waveform determines the how quickly gas
will be delivered to the patient throughout various stages of the inspiratory cycle. There
are four different types of flow waveforms available. These include the square,
decelerating (ramp), accelerating and sine/sinusoidal waveform, as illustrated below.
Peak Flow
Inspiratory
Flow
Zero Flow
Expiratory
Flow
Peak
expiratory
flow flow
It is important to note that these flow waveforms only effect inspiration. Expiratory
flow is determined by the patient.
Square waveform. The square flow waveform delivers a set flow rate throughout
ventilator inspiration. If for example the peak flow rate is set at 60 lpm then the patient
will receive 60 lpm throughout ventilator inspiration.
Decelerating waveform. The decelerating flow waveform delivers the peak flow at the
start of ventilator inspiration and slowly decreases until a percentage of the peak
inspiratory flow rate is attained.
Accelerating waveform. The accelerating flow waveform initially delivers a fraction of
the peak inspiratory flow and steadily increasing the rate of flow until the peak flow has
been reached.
Sine / sinusoidal waveform. The sine waveform was designed to match the normal flow
waveform of a spontaneously breathing patient.
Setting the Peak Flow and Flow Waveform
The flow rate should be set to match the patient’s inspiratory demand. Where the patient’s
inspiratory flow requirements exceed the preset flow rate there will be an imposed
work of breathing which may cause the patient to fight the ventilator and become
fatigued. Where flow rate is unable to match the patient’s inspiratory flow
requirements the pressure waveform on the ventilator graphics screen may show a
depressed or “scooped out” pressure waveform, refer to the following diagram. This
is often referred to as flow starvation. 25
©R. Butcher & M. Boyle, Revised 2009.
Page - 100
Certificate in Advanced Mechanical Ventilation & Respiratory Support.
The decelerating flow waveform is the most frequently selected flow waveform as it
produces the lowest peak inspiratory pressures of all the flow waveforms. This is because
of the characteristics of alveolar expansion. Initially a high flow rate is required to open
the alveoli. Once alveolar opening has occurred a lower flow rate is sufficient to procure
alveolar expansion. Flow waveforms which produce a high flow rate at the end of
inspiration (ie. square and accelerating flow waveforms) exceed the flow requirements for
alveolar expansion, resulting in elevated peak inspiratory pressures.2
P
r
e
s
s
u
r
e
F
l
o
w
Inspiratory
Flow
Zero Flow
Inspiratory
Pause
Expiratory
Flow
0 lpm
V
o
l
u
m
e
Inspired
Volume
Inspiratory
Pause
Expired
Volume
Time
©R. Butcher & M. Boyle, Revised 2009.
Page - 101
Certificate in Advanced Mechanical Ventilation & Respiratory Support.
Inspiratory Time
In most volume cycled ventilators used in the intensive care environment it is not possible
to set the inspiratory time. The inspiratory time is determined by the peak inspiratory flow
rate, flow waveform and inspiratory pause. Where inspiratory time is able to be set, flow
becomes dependent on inspiratory time and tidal volume. The following examples
illustrate how these parameters effect inspiratory time.
Ventilator settings
•
•
•
•
Tidal volume
Peak Flow
Flow Waveform
Insp. Pause
1000mls
60 lpm
square / constant
0 secs
The inspiratory time for this patient would be 1 second because gas is constantly being
delivered at a flow rate of 60 lpm, which equals 1 litre per second. If an inspiratory pause
of 0.5 seconds were applied then the inspiratory time would be increased to 1.5 seconds.
Changing the patients flow waveform from a square to a decelerating flow waveform,
without changing the flow rate, will result in an increase in inspiratory time, because the
flow of gas is only initially set at 60 lpm and decreases throughout inspiration (refer to
following diagrams).
Peak Flow
60 lpm
40 lpm
30 lpm
Inspiratory
Flow
Zero Flow
Expiratory
Flow
Peak Flow
Inspiratory
Flow
Zero Flow
Expiratory
Flow
©R. Butcher & M. Boyle, Revised 2009.
Page - 102
Certificate in Advanced Mechanical Ventilation & Respiratory Support.
Summary Page - Advantages and Disadvantages of Volume Cycled
Ventilation
Advantages
Ease of Use: Due to the widespread implementation of volume cycled ventilation it is a
type of ventilation that is familiar to many clinicians.
Set Volumes: One of the major advantages of volume cycled ventilation is the ability to
set a tidal volume. This is of critical importance to patient’s requiring tight regulation of
carbon dioxide elimination. Neurosurgical patients - post surgery / head injury and
patients suffering a neurological insult (eg post cardiac arrest) often require CO2
regulation. This is because carbon dioxide is a potent vasodilator. Increased levels of
carbon dioxide, in these groups of patients, may therefore increase cerebral blood volume
with a concomitant elevation of intracranial pressure. A raised intracranial pressure may
decrease the delivery of oxygenated blood to the brain - resulting in cerebral ischaemia.
Conversely a low CO2 may cause constriction of the cerebral vasculature also resulting in
decreased oxygen delivery and cerebral ischaemia. For these reasons volume cycled
ventilation is often the mode of choice for patients requiring CO2 regulation.
Disadvantages
The major disadvantages of volume cycled ventilation are the variable pressure and set
flow rate. It is therefore a necessary part of nursing practice to closely monitor the
patient's inspiratory pressure and observe the patient for signs of “flow starvation”.
Due to the limitations of volume cycled ventilation methods of ventilating patients with a
set pressure and variable flow rate (eg pressure support and pressure controlled
ventilation) are now widely available. Newer types of ventilation are now available which
combine the ability to set a target tidal volume, maximum pressure and variable flow rate.
Question6). What are the factors could cause the:
• high inspiratory pressure alarm;
• low inspiratory pressure alarm;
• low tidal volume alarm; and
• low minute volume alarm
to be activated in volume cycled ventilation?
Describe appropriate action to be taken in order to rectify the problem.
©R. Butcher & M. Boyle, Revised 2009.
Page - 103
Certificate in Advanced Mechanical Ventilation & Respiratory Support.
PRESSURE SUPPORT VENTILATION
The main goal of pressure support ventilation is to adequately assist respiratory muscle
activity in a way that will improve the efficacy of a patient’s effort and allow a reduction
in workload.
Pressure support only applies to spontaneous breaths. Pressure support has a:
• set pressure (pressure support added to the CPAP/PEEP);
• variable volume - determined by the resistance, compliance, inspiratory effort and
level of pressure support;
• variable flow rate determined by the resistance, compliance, inspiratory effort and
level of pressure support;
• variable inspiratory time; and
• is cycled off when the patient's inspiratory flow declines to a value determined by the
manufacturer of the ventilator.
Peak Insp. Pressure
Pressure
Pressure Support
Patient Initiated
CPAP
Inspiration Terminated /
cycles off by flow
Flow
Variable Tidal Volume
Volume
Inspiratory Time
Determined by the
patient
©R. Butcher & M. Boyle, Revised 2009.
Page - 104
Certificate in Advanced Mechanical Ventilation & Respiratory Support.
Pressure support ventilation is a pressure preset mode in which each breath is patient
triggered and supported. It provides a means of a positive pressure that is synchronised
with the inspiratory effort of the patient. Pressure support breaths are both patient initiated
and patient terminated. During inspiration the airway pressure is raised to the preset level
of pressure support level. The speed of pressurisation may be fixed by the ventilator or
adjustable by setting the rise time (refer to the section on rise time / pressurisation).5,16,17.
The inspiratory pressures in pressure supported breath are set by the operator. The peak
pressure is determined by the addition of the level of pressure support to the level of
CPAP/PEEP, ie peak pressure = pressure support + CPAP/PEEP. There is no plateau
pressures in pressure supported breaths as it is impossible to achieve an inspiratory pause.
Question7): Why is it impossible to have an inspiratory pause in pressure
support ventilation?
Because the ventilator’s algorithm is set to attain a preset pressure, the flow rate on the
ventilator must respond to the:
• resistance of the endotracheal / tracheostomy tube
• resistance of the patient’s airway
• patient’s compliance; and
• inspiratory effort
The flow in pressure support must vary so that the preset level of pressure support is
achieved and maintained throughout the breath. Flow cannot, therefore, be set by the
operator. Likewise the flow waveform cannot be set but tends to be decelerating in nature.
Initially a high flow rate is delivered to the patient in order distend the alveoli and
overcome the resistance of the endotracheal tube. Once the alveoli opening occurs and the
preset pressure has been obtained the rate of flow decreases - producing a decelerating
flow waveform.
The termination of the pressure support breath is based on the decline of inspiratory
flow. Inspiration cycles off when inspiratory flow falls to a preset value. This value may
be a percentage of peak inspiratory flow (eg 25%) or a fixed amount of flow (eg 4 litres /
min). The decline of inspiratory flow suggests that the patient’s inspiratory muscles are
relaxing and that the patient is approaching the end of inspiration. At this point the
inspiratory phase is cycled off. The ventilator terminates the pressure support and opens
its exhalation valve. The expiratory phase is free of assistance, and returns to baseline
pressure which may be level of CPAP/PEEP that is applied. 5,16,17
Pressure support ventilation is thus defined as a mode of ventilation:
• that is patient initiated,
• with a preset pressure,
• variable flow, volume and inspiratory time
• and is flow cycled
©R. Butcher & M. Boyle, Revised 2009.
Page - 105
Certificate in Advanced Mechanical Ventilation & Respiratory Support.
Application of Pressure Support
Pressure support ventilation may help to compensate for the increased respiratory muscle
work required for breathing through an endotracheal tube and a demand valve. The level
of pressure support ventilation required to compensate for the added inspiratory work
caused by endotracheal tube resistance and a ventilator demand system is dependent on
the resistance of the endotracheal tube and the underlying lung disease. 5,16,17
At high levels of Pressure Support Ventilation may used as a ventilation mode in it’s own
right. 5,16,17
Question8) You are caring for a 24 year old, 70 kg male post head injury
with a size 8 tracheostomy tube. He is being ventilated with 6 cms of pressure support
and 10 cms H2O of CPAP. You are trying to wean the ventilation - intracranial
pressure / cerebral perfusion are no longer a problem. The ventilator is continually
activating its apnoea mode (set at 20 seconds) because the patient periodically stops
breathing. The tidal volumes are approximately 1,100mls and the respiratory rate is 6.
What would be an appropriate action at this point in time? The graphic waveforms,
for a 30 second time period, are supplied below.
Pressure
Flow
1,100 mls
Volume
©R. Butcher & M. Boyle, Revised 2009.
Page - 106
Certificate in Advanced Mechanical Ventilation & Respiratory Support.
Further Reading - Pressure Support
16.Brochard, L, 1994, “Pressure support ventilation”, in Principles and Practice of
Mechanical Ventilation, M. Tobin, ed, McGraw Hill, New Work.
17.MacIntyre, N, 1992, “Pressure Support Ventilation” in Handbook of Mechanical
Ventilatory Support, A. Perel & Stock, M. Ed, Williams and Williams, Baltimore.
• Kacmarek, R. & Hess, D. 1994, “Basic Principles of Ventilator Machinery”, in
Principles and Practice of Mechanical Ventilation, M. Tobin, ed, McGraw Hill, New
Work.
©R. Butcher & M. Boyle, Revised 2009.
Page - 107
Certificate in Advanced Mechanical Ventilation & Respiratory Support.
Pressurisation - Rise Time
Once inspiration has been initiated the ventilator delivers a high inspiratory flow that
decreases, in response to the patient’s efforts, throughout the cycle of inspiration. The
servo regulatory mechanism of the ventilator adjusts the required flow necessary to reach
and maintain the appropriate pressure until expiration occurs. The flow regulation varies
amongst ventilators. Pressure increases according to a time interval that is system specific
or adjustable by the operator. A high speed of pressurisation results in a quicker
achievement of the preset pressure support level.
• A low speed of pressurisation can cause the patient to breathe with excessive effort,
especially when respiratory drive is high and respiratory mechanics are poor.
• A high speed of pressurisation may make it difficult for the ventilator to properly
maintain the pressure throughout inspiration according to the servo control mechanism,
especially in patients with low compliance or high resistance. For instance a very
sudden rise in pressure under the action of a high flow rate and a high resistance may
interfere with the pressure mechanism that cycles from inspiration to expiration. 6,17
The following diagram illustrates the how too quick a rise time may result in premature
breath termination and a resulting ineffectual tidal volume. The first breath represents a
normal pressure support breath. The second breath illustrates an initial rapid flow (due
to a short rise time) that has caused the inspiratory pressure to rise higher than the set
level of pressure support. The ventilator has compensated by rapidly decreasing the
flow - which in turn has caused the ventilator to cycle the pressure support breath off.
A prolonged rise time may be beneficial in this instance.
Pressure
Flow
Volume
©R. Butcher & M. Boyle, Revised 2009.
Page - 108
Certificate in Advanced Mechanical Ventilation & Respiratory Support.
Question9). What are the factors could cause the:
• high inspiratory pressure alarm;
• low inspiratory pressure alarm;
• low tidal volume alarm; and
• low minute volume alarm
to be activated in pressure support ventilation?
Describe appropriate action to be taken in order to rectify the problem.
©R. Butcher & M. Boyle, Revised 2009.
Page - 109
Certificate in Advanced Mechanical Ventilation & Respiratory Support.
PRESSURE CONTROLLED VENTILATION
Pressure controlled ventilation has a:
• set pressure (pressure controlled ventilation pressure added to the CPAP/PEEP);
• variable volume - determined by the resistance, compliance, inspiratory effort and
level of pressure control ventilation pressure;
• variable flow rate determined by the resistance, compliance, inspiratory effort and
level of pressure controlled ventilation pressure;
• set inspiratory time; and
• is cycled off by the inspiratory time (pressure controlled time cycled ventilation) or I:E
ratio (pressure controlled ventilation I;E ratio cycled)
Pressure controlled: time cycled ventilation differs from pressure cycled ventilation as the
rate of flow is variable, while the inspiratory time is set. The inspiratory time governs
how long the pressure limit, known as pressure controlled ventilation pressure (PCVP),
will be maintained. After the inspiratory time has been reached inspiration phase stops
and the expiration phase begins. Hence it is pressure controlled as the pressure is
"controlled" at a level for a set time and it is time cycled because "time" is what
determines the duration of inspiration.
Pressure rises rapidly to
achieve the pressure control
ventilation pressure. Once
this pressure has been
attained the pressure is
maintained until the breath
is cycled off by time.
PEAK
25 cms
PCVP
20 cms
PEEP
5cms
Inspiratory
Time (Ti)
The time taken for the PCVP to be reached is able to be adjusted on some machines by
manipulating the initial flow rate or rise time. On other ventilators it is possible to
manipulate the maximum flow rate. This will allow the patient to generate greater flow
rates, if required, during periods of potential flow starvation eg, during suctioning.
Tidal volume is not set in pressure controlled: time cycled ventilation and will be
influenced by inspiratory effort, inspiratory time, resistance to flow, and lung/thorax
compliance. By having a set inspiratory time the tidal volume is going to be less variable
©R. Butcher & M. Boyle, Revised 2009.
Page - 110
Certificate in Advanced Mechanical Ventilation & Respiratory Support.
than that delivered by a simple pressure cycled ventilator. The advantage of PCV over
volume cycled ventilation is that similar tidal volumes may be delivered with limited
airway pressures. Furthermore there is probably less "flow starvation" experienced by the
patient on assisted breaths. 18,19
Pressure
Flow
Volume
Diagram 1
Diagram 2
Diagram 3
It is sometimes possible to increase a patients tidal volume by increasing the inspiratory
time. Diagram 1 shows a representation of how extending the patient's inspiratory time may
increase their tidal volume. Note that as a result of increasing the inspiratory time (as
indicated by the dotted line) flow continues to be delivered to the patient and the tidal
volume is increased. In diagram 2 however, the flow has already returned to zero before the
end of the inspiratory time. By increasing the inspiratory time in this patient (as indicated by
the dotted line) there is no improvement in the patients tidal volume. All that is achieved by
increasing the inspiratory time in the second patient is an inspiratory pause/hold. This may
be useful for improving distribution of gases and perhaps open more alveoli but there is no
increase in tidal volume.
The last diagram shows one of the benefits of pressure controlled ventilation over that of
volume cycled ventilation. Notice that on the pressure tracing there is a negative pressure
that indicates that this is an assisted breath, ie patient initiated machine breath. In this breath
the patient is making a large inspiratory effort and because the flow rate in pressure
controlled ventilation is variable the ventilator is able to give the patient the flow they
demand. In this breath the tidal volume is greater than the previous breath due to the patients
inspiratory effort.
©R. Butcher & M. Boyle, Revised 2009.
Page - 111
Certificate in Advanced Mechanical Ventilation & Respiratory Support.
Question10). What are the factors could cause the:
• high inspiratory pressure alarm
• low inspiratory pressure alarm
• low tidal volume alarm
• low minute volume alarm
to be activated in pressure controlled ventilation?
Describe appropriate action to be taken in order to rectify the problem.
References and Further Reading - Pressure Controlled Ventilation
18.“Pressure Control Ventilation Review”, Puritan Bennet.
19.MacIntyre, N. 1994, “Pressure-limited versus volume-cycled breath delivery strategies”,
Critical Care Medicine, vol. 22, no. 1, pp 4-5.
20.Rappaport, S. Shpiner, R. Yoshihara, G. Wright, J. Chang, P. & Abraham, E. 1994,
“Randomized, prospective trial of pressure-limited versus volume-controlled ventilation in
severe respiratory failure”, Critical Care Medicine, vol. 22, no. 1, pp. 22-32.
21.Munoz, J, Guerrero, J, Escalante, J, Palomino, R. & De La Calle, B. 1993, “Pressure
controlled ventilation versus controlled mechanical ventilation with decelerating
inspiratory flow”, Critical Care Medicine, vol. 21, no. 8, pp. 1143-1148.
22.Gurevitch. M, 1992, “Inverse ratio ventilation and the inspiratory/expiratory ratio” in
Handbook of Mechanical Ventilatory Support, A. Perel & Stock, M. Ed, Williams and
Williams, Baltimore.
23.Stewart, T. & Slutsky, A. 1995, “Mechanical ventilation: a shifting philosophy”, Current
Opinion in Critical Care, vol 1, pp 49-56.
24.Gowski, D & Miro, A, 1996, “New ventilatory strategies in acute respiratory failure”
Critical Care Nurse Quarterly, vol. 19, no. 3, pp1-22.
25.Nilsestuen, J & Hargett, K. 1996, “Managing the patient-ventilator system using graphic
analysis; an overview and introduction to graphics corner” Respiratory Care, vol. 41, no.
12, pp 1105
©R. Butcher & M. Boyle, Revised 2009.
Page - 112
Certificate in Advanced Mechanical Ventilation & Respiratory Support.
Place a tick (√ ) next to the set parameters and a cross (x) next to the variable
parameters for each of the following modes of ventilation:Ventilator
Setting
Pressure
Controlled: Time
Cycled Ventilation
Volume Cycled
Ventilation
Pressure Support /
CPAP
FiO2
PEEP/CPAP
IMV Rate
Tidal Volume
Pressure
Support
Peak
Flow Waveform
Sensitivity
Inspiratory
Hold
Inspiratory
Time
PCV Pressure
Place a tick (√) next to the observations that are required for each of the
following modes of ventilation: Ventilator
Observation
Pressure
Controlled: Time
Cycled Ventilation
Volume Cycled
Ventilation
Pressure Support /
CPAP
Spontaneous
Exhaled Tidal
Volume
Machine
Exhaled Tidal
Volume
Expired Minute
Volume
Rate
I:E ratio
Peak / Plateau
Pressures
©R. Butcher & M. Boyle, Revised 2009.
Page - 113
Certificate in Advanced Mechanical Ventilation & Respiratory Support.
MODES OF VENTILATION
In both volume cycled and pressure controlled: time cycled ventilation the following
modes of ventilation may be available:
Controlled Mandatory Ventilation
Synchronised Intermittent Mandatory Ventilation
Assist / Control Ventilation
Controlled Mandatory Ventilation (CMV)
In this mode of ventilation the operator sets a rate to a predetermined pressure, volume or
time limit and the patient receives this breath in a in a set time interval. For example if the
patient is on a rate of 10, then they will receive a breath every 6 seconds, regardless of
their inspiratory effort (see following diagram). In this mode there are no spontaneous or
assisted breaths.
Inspiration
PEEP
6 seconds
6 seconds
Note, patient
effort and lack of
response from the
ventilator.
Intermittent Mandatory Ventilation (IMV)/ Synchronised Intermittent
Mandatory Ventilation (SIMV).
Intermittent mandatory ventilation (IMV) was an earlier version of the more advanced
SIMV. In this mode of ventilation a preset respiratory rate is delivered at a specified time
interval. For a patient receiving 10 breaths per minute, a breath is delivered every six
seconds regardless of the patient's efforts. The theoretical disadvantage of this form of
ventilation is that the patient may take a spontaneous breath and could receive a machine
delivered breath at the same time or during expiration, causing hyperinflation and high
peak airway pressures. SIMV is said to avoid this problem by monitoring the patient's
respiratory efforts and delivering breaths in response to the patient's inspiratory efforts.
©R. Butcher & M. Boyle, Revised 2009.
Page - 114
Certificate in Advanced Mechanical Ventilation & Respiratory Support.
IMV
Peak
Inspiration
Peak
Notice on the
last breath the
patient has
inspired and
commenced
expiration and,
as a result, the
peak airway
pressure has
increased.
6 seconds
Spontaneous
Breath.
SIMV is similar to IMV and CMV in that it will still deliver a minimum number of
breaths, despite the potential lack of inspiratory effort from the patient If the ventilator is
set to deliver 10 bpm the patient will receive these breaths if they are breathing or not.
SIMV utilises a window of time in which a breath is due and will look to deliver this
breath within a specified time frame. If the patient makes a sufficient inspiratory effort
(governed by sensitivity) the machine will sense this effort and give the patient the breath
during this time, synchronised to their own effort.
SIMV
Assisted breath
Sensitivity triggered
Inspiration
Peak
Peak
Ventilator looking for patient effort
“window of time”
Spontaneous
Breath., with no
pressure support
Notice on the
last breath the
patient has
commenced
inspiration and,
as a result, the
peak airway
pressure has
decreased
(volume cycled
ventilation)
Controlled
Breath
NB SIMV is available in both volume cycled and pressure controlled time cycled
ventilation. In the above example the theoretical decrease in peak inspiratory pressures
that may occur during assisted breaths does not apply to pressure controlled time cycled
ventilation, as the pressure is constant in this type of ventilation. In pressure controlled:
time cycled ventilation the tidal volume may be increased during assisted breaths.
©R. Butcher & M. Boyle, Revised 2009.
Page - 115
Certificate in Advanced Mechanical Ventilation & Respiratory Support.
It is also important to note that during assisted breaths the patient continues to inspire
even after the machine detects the patient's effort. Thus the work of breathing during
assisted breaths is comparable to that of spontaneous breaths. For this reason pressure
control time cycled ventilation may have greater synchrony with patients demands during
assisted breaths as the patient can have as big a tidal volume or flow rate as they require.
Assist / Control Ventilation
Assist Control ventilation is available in both pressure control and volume cycled
ventilation. In this form of ventilation a fixed number of breaths, with a set tidal volume
or time limit, will be delivered to the patient if they are breathing spontaneously or not. If
the patient makes any inspiratory effort above this number of breaths, they will receive
extra breaths with that same fixed pressure or volume. ie all breaths will either be
controlled (ventilator initiated) or assisted (patient initiated) with the same tidal volume
(eg 500mls in volume cycled) or pressure limit and inspiratory time (eg. 30 cmsH2O, 1.2
seconds in pressure controlled ventilation).
Controlled Breaths
Inspiration
Assisted Breath.
For Further Reading on Mechanical Ventilation refer to the following texts and articles;
• Perel, A, and Stock, M, 1992, Handbook of Mechanical Ventilation, Williams and Wilkens
• "A Clinical Guide to Cardiopulmonary Therapies" and "Pressure Controlled Ventilation", produced
by Puritan Bennett
• Slutsky, A, ed, 1993, “Mechanical Ventilation”, Chest, Vol 104, No 6, pp 1833 - 1859.
©R. Butcher & M. Boyle, Revised 2009.
Page - 116
Certificate in Advanced Mechanical Ventilation & Respiratory Support.
Question10). Which of the following methods of ventilating patients would
be suitable for a) a spontaneously breathing patient and
b) a patient who is receiving muscle relaxants?
* SIMV
* CMV
* Assist control
* Pressure Support
Provide a rationale for your answer.
©R. Butcher & M. Boyle, Revised 2009.
Page - 117
Certificate in Advanced Mechanical Ventilation & Respiratory Support.
SECTION C:
“INDICATIONS
AND
COMPLICATIONS
OF MECHANICAL
VENTILATION”
©R. Butcher & M. Boyle, Revised 2009.
Page - 118
Certificate in Advanced Mechanical Ventilation & Respiratory Support.
Indications for non invasive ventilation
CPAP and BiPAP.
Positive end expiratory pressure (PEEP) refers to the application of a fixed pressure at the
end of a ventilatory cycle during which spontaneous breathing is not present. PEEP has
been used as a method to improve oxygenation as an adjunct to mechanical ventilatory
support for several years. The major benefit PEEP is achieved by its ability to raise
functional residual capacity (FRC) above the level at which alveolar closure occurs
(closing capacity). The increase FRC achieved by PEEP is accomplished by raising
alveolar volume and through the recruitment of alveoli that do not normally contribute to
gas exchange. The major effect of increasing FRC is an increase in oxygenation and lung
compliance. In recent years there has been a great deal of interest in also applying PEEP
as mechanism to prevent ventilator induced lung injury (VILI).
Continuous positive airway pressure (CPAP) is very similar to PEEP. CPAP refers to the
addition of a fixed amount of positive airway pressure to spontaneous respirations. CPAP
does not require the use of a mechanical ventilator as it can also be applied to a nonintubated patient via a face / nasal mask and appropriate respiratory circuit. This means
that an increase in FRC and associated improvement in oxygenation and lung compliance
can be achieved in non-intubated patients.
While both PEEP and CPAP may improve oxygenation and lung compliance they do not
provide or actively assist in ventilation. Ventilation refers to the movement of gas into a
person’s lung. In the past, the most common method of providing or augmenting
ventilation has been through the use of a mechanical ventilator via an endotracheal or
tracheostomy tube. More recently non-invasive ventilation (NIV) has been provided with
a BiPAP machine or mechanical ventilator via a face or nasal mask.
While once the domain of intensive care units, both CPAP and NIV are currently being
applied within many areas of the hospital and even in the patient’s home or community
setting. For example, CPAP may be used in the patient’s home to prevent sleep apnoea,
whereas NIV might also be used in the community setting to reduce the work of breathing
for patients with chronic airways limitation. Given the current interest in applying the
optimal level of PEEP to prevent lung injury, as well as the increased applications of
CPAP and NIV across the health care setting it seems timely to review each of these
strategies.
©R. Butcher & M. Boyle, Revised 2009.
Page - 119
Certificate in Advanced Mechanical Ventilation & Respiratory Support.
CONTINUOUS POSITIVE AIRWAY PRESSURE (CPAP)
CPAP may be delivered through a ventilator or a dedicated respiratory circuit specifically
designed for the spontaneously breathing patient. Generally there are two broad categories
used to describe the CPAP circuits, namely non-reservoir and reservoir CPAP.
Non-reservoir CPAP can be provided with a high flow system. The gas flow required is
very high (up to 120 l/min). The gas flow source may be either a high flow meter or a
flow generator (venturi). The system is generally noisy and is difficult to effectively
humidify gas because the high flows exceed the humidifier capabilities. Due to the
limitations of non-reservoir CPAP, reservoir CPAP is often more desirable for prolonged
or continuous use in the care of the critically ill patient.
The previous diagram depicts a typical reservoir CPAP circuit. You will note that this
circuit contains an oxygen blender and a flow meter allowing for high concentrations of
oxygen and high flow rates. Additionally there is a PEEP valve and a humidifier may be
added when required. With reservoir CPAP there is also, of course, a reservoir bag. The
purpose of the reservoir bag is to provide an additional source of gas to supplement flow
during inspiration. If the flow of gas available from the respiratory circuit is less than the
patient's inspiratory flow rate, even transiently, airway pressure will decrease and work of
breathing will increase. Ideally, the size and elastic properties of the reservoir bag should
be such that a constant pressure is exerted, despite alteration in volume. The continuous
gas flow rate should be adjusted to sustain reservoir bag inflation during the inspiratory
phase of the respiratory cycle. When the reservoir bag is large relative to the patient's tidal
volume and is constructed of thin, highly compliant rubber, gas flow rate need only be
slightly greater than the patient's minute volume. Thus, decreasing the variation in flow
across the PEEP valve and minimising airway pressure fluctuation during breathing.
©R. Butcher & M. Boyle, Revised 2009.
Page - 120
Certificate in Advanced Mechanical Ventilation & Respiratory Support.
Physiological Responses to CPAP / PEEP
Fluid retention and diminished urinary output are commonly observed in patients
receiving CPAP/PEEP, particularly in conjunction with mechanical ventilation.
Mechanical ventilation and PEEP increase the production of antidiuretic hormone,
decrease mean renal artery perfusion pressure, redistribute perfusion from the cortex,
reduce urine flow, reduce creatinine clearance and diminish fractional excretion of
sodium.
PEEP and CPAP may decrease cardiac output and mean arterial blood pressure through a
decrease in venous return and hence ventricular filling, as illustrated in the following
diagram. In patients with poor left ventricular function and pulmonary oedema the
addition of CPAP or PEEP may improve cardiac output through an improvement of stroke
volume.
Considerations when applying CPAP
• Consider contraindications to applying CPAP ie suspected base of skull fracture
• Observe for signs of haemodynamic compromise
• Observe for signs of ineffective CPAP delivery:
o Deflating reservoir bag(s)
o excessive decrease / rise in airway pressure during inspiration/expiration
• Consider the need for humidification when delivering high concentrations of medical
air / oxygen
Non Invasive Ventilation (NIV) or BiPAP
Bi Level Positive Airway Pressure (BiPAP) is a form of non-invasive ventilation designed
to augment the patient’s tidal volume while reducing the patient’s inspiratory effort,
allowing a reduction in workload.
BiPAP is the almost always-applied in conjunction with CPAP. In BiPAP the operator
sets an inspiratory and expiratory positive airway pressure. The difference between the
inspiratory and expiratory pressure determines the amount of inspiratory assistance that
the patient is receiving. The expiratory pressure determines if and how much CPAP the
patient is receiving. The main difference between CPAP and Bi-PAP is that Bi-PAP
©R. Butcher & M. Boyle, Revised 2009.
Page - 121
Certificate in Advanced Mechanical Ventilation & Respiratory Support.
augments the patient’s tidal volume through the application of an elevated inspiratory
pressure. One of the advantages of Bi-PAP is that it can assist the patient’s inspiratory
effort and reduce the work of breathing and muscle fatigue.
CPAP AND BIPAP IN THE MANAGEMENT OF ACUTE SEVERE PULMONARY OEDEMA
Cardiogenic pulmonary oedema results in an elevation of extravascular lung water, a
reduction in lung compliance and an increase in airway resistance. These three factors
can cause impairment in gas exchange and increased work of breathing. To maintain an
adequate gas exchange the patient experiencing cardiogenic pulmonary oedema must
increase inspiratory effort. Large negative pleural pressures during the inspiratory phase
of respiration are required to overcome the increased airway resistance and reduced lung
compliance. The negative pleural pressures may cause further deterioration in the patient
as they increase left ventricular transmural pressure and afterload, which may reduce
cardiac output and oxygen delivery.
The patient presenting with severe respiratory distress due to cardiogenic pulmonary
oedema cannot be adequately treated with oxygen and may require CPAP or BiPAP.
The application of CPAP in patients with severe cardiogenic pulmonary oedema is often
associated with a rapid improvement in haemodynamics and respiratory mechanics. The
application of CPAP decreases mean pleural pressure during inspiration, decreases net
filling pressure to the right ventricle and prevents of improves pulmonary congestion and
oedema. Application of 5 cms of CPAP has been associated with significant
improvement in cardiac index and stroke volume. Additional improvements have been
observed by increasing CPAP from 5 to 10 cms. In acute respiratory failure related to
CPE, CPAP also causes a significant decrease in the heart rate, most likely resulting from
increased parasympathetic tone in response to CPAP-induced lung inflation.
The respiratory effects of CPAP are to open flooded alveoli, primarily be increasing the
functional residual capacity of the lung and by counterbalancing any intrinsic peep. As a
result oxygenation is improved and the airway resistances and the work of breathing are
significantly reduced.
The inspiratory assistance provided by Bi-PAP and the associated reduction in work of
breathing and muscle fatigue makes it an attractive option in the management of severe
acute pulmonary oedema. There is however, only one prospective, randomised, controlled
study that has compared the efficacy of CPAP versus BiPAP in patients presenting to the
emergency department for acute respiratory failure related to cardiogenic pulmonary
oedema. In this study a significant improvement in arterial carbon dioxide tension, pH,
heart rate, breathing frequency and dyspnoea was noted in the BiPAP group. The CPAP
group only demonstrated an improvement in breathing frequency. It is important to note
that this study was terminated prematurely as there was a high proportion of acute
myocardial infarction in the BiPAP group. It is not clear whether the infarcts preceded or
were a consequence of the patient receiving BiPAP. A consensus statement from the
British Thoracic Society on the use of noninvasive ventilation in acute respiratory failure
considered CPAP considered to be effective in patients with cardiogenic pulmonary
oedema, who remain hypoxemic despite maximal medical treatment. The consensus
©R. Butcher & M. Boyle, Revised 2009.
Page - 122
Certificate in Advanced Mechanical Ventilation & Respiratory Support.
committee considered that BPAP should be reserved for patients who fail to improve after
a CPAP trial.
VENTILATOR INDUCED LUNG INJURY (VILI)
For many years it had been suspected that mechanical ventilation might cause lung injury.
This form of injury has been referred to as ventilator induced lung injury (VILI). It has
been demonstrated, in animal studies, that the repeated opening and closure of alveoli
results in the increased production the cytokines similar to those found in acute sepsis
(refer to following diagram). The presence of these cytokines adds weight to the theory
that inappropriate ventilation strategies may lead to VILI.
More recently a randomised, controlled trial clearly demonstrated that the mortality of
patients suffering from acute lung injury can be effected by ventilator settings. As a result
it is now widely accepted that limiting tidal volumes and plateau pressures is an important
element in the application of mechanical ventilation. The reduction of tidal volumes,
particularly in conjunction with a high fraction of inspired oxygen, may prevent
recruitment of alveoli that would normally contribute to gas exchange. CT scans of
patient’s with prolonged acute lung injury (ALI) show the development of cysts or bullae
in dependant lung regions. The proposed mechanism for the development of this lung
injury is the shear forces, which are applied to the alveoli during repeated airway opening
and collapse. One mechanism through which this form of lung injury may be prevented is
by applying sufficient PEEP to prevent this cyclic inflation and deflation of dependant
lung units.
In the 1990s Amato demonstrated a statistically significant improvement in outcome in
patients who had their PEEP titrated to prevent inflation deflation lung injury. In this
©R. Butcher & M. Boyle, Revised 2009.
Page - 123
Certificate in Advanced Mechanical Ventilation & Respiratory Support.
study Amato measured airway pressure while injecting oxygen into the patient’s lungs
with a “super syringe”. By measuring the pressure and injecting a fixed volume Amato
was able to plot a volume pressure curve. An example of an inspiratory volume pressure
curve is illustrated below.
V
O
L
U
M
E
Pressure
You will note through observation of this diagram that on the lower part of the curve there
is a large rise in pressure with little increase in volume. This rise in pressure represents
airway opening. Along the vertical section of the curve, enclosed by the dotted lines, there
is a large rise in volume for a small increment in pressure. It has been proposed that this
part of the curve represents the optimal area for ventilation to occur. At the top of the
curve there is a large rise in pressure for a small increase in volume. This horizontal part
of the curve is indicating that the lung is over distended and has approached its total lung
capacity.
More recently the use of the lower inflection point to determine the optimal amount of
PEEP has been questioned. Some clinicians have noted that it may be more useful to look
at the expiratory volume pressure curve. Through an analysis of the expiratory volume
pressure curve it may be possible to estimate the point at which alveolar closure occurs
(see following diagram). It has been proposed through this method that the goal when
adding PEEP is to detect the pressure at which alveolar closure occurs and apply
sufficient PEEP to prevent airway closure.
Assessing the volume pressure curve is not ideally assessed from the mechanical
ventilator. Ideally the lower and upper inflection point or deflation point should be
determined through the use of a low flow technique such as a super syringe (see below).
©R. Butcher & M. Boyle, Revised 2009.
Page - 124
Certificate in Advanced Mechanical Ventilation & Respiratory Support.
An alternate method of recruiting alveoli is transiently applying an increased pressure to
increase lung volume. The application of this increased pressure is called a lung
recruitment manoeuvre. Lung recruitment manoeuvres may involve the use of the “sigh”
feature on the mechanical ventilator or the application of high levels of PEEP for a short
period. The following CT scans demonstrate the effects of applying a recruitment
manoeuvre on an intubated patient suffering from severe acute lung injury.
CT Scan A: 35 cms of PEEP
CT Scan B: 45 cms of PEEP
©R. Butcher & M. Boyle, Revised 2009.
Page - 125
Certificate in Advanced Mechanical Ventilation & Respiratory Support.
Regardless of the means through which the optimal level of PEEP is ascertained or
applied there are several nursing implications to ensure that an adequate level of PEEP or
CPAP is maintained.
Considerations;
1. Consider the beneficial effects of PEEP/CPAP in maintaining alveolar recruitment
when weaning patients from mechanical ventilation.
2. Prevent the loss of PEEP/CPAP through disconnection from the ventilator circuit: e.g.
avoid disconnecting the patient from the ventilator circuit for “bagging” patients
3. A recruitment manoeuvre may be appropriate after inadvertent disconnection from the
ventilator. This procedure should only be applied by clinicians trained in this
procedure.
4. Avoid the routine use of high-inspired concentrations of oxygen.
5. Use PEEP valves if “bagging” is required
HUMIDIFICATION
(Martin Boyle)
©R. Butcher & M. Boyle, Revised 2009.
Page - 126
Certificate in Advanced Mechanical Ventilation & Respiratory Support.
Introduction - Principles of Humidity and Humidification
What Is Humidity?
Humidity is water as vapour in a gas mixture. The amount of water present as vapour is
dependent upon the gas temperature. Increasing gas temperature increases the ability of
the gas to hold water. A gas has a certain capacity for holding water at a given
temperature. When a gas mixture is unable to hold any more water vapour it is said to be
saturated. The temperature of the gas at this state is called the dew point.
Humidity is described in terms of absolute humidity and relative humidity.
• Absolute Humidity (AH) is the actual mass of water in a volume of gas. AH is
expressed as grams/cubic meter (g/m3) or milligrams/Litre (mg/L)
• Relative Humidity (RH) is the actual amount of water present in a gas divided by the
capacity of the gas at a given temperature ie.
% RH = (content/capacity) X 100
Water Vapour Content Of Saturated Air (ie 100% RH)
Temp 0C
15
20
25
30
32
35
37
40
AH at Saturation (mg/L)
12.1
17.3
23.1
30.4
33.8
39.6
44.0
51.2
Another important concept is that of the energy content of a gas mixture. The total
energy content of air is made up of sensible heat and latent heat. Sensible heat is reflected
by the gas temperature whilst latent heat is reflected by the water mass. Latent heat refers
to the heat associated with a change of state ie. from liquid to vapour and from vapour to
liquid. The change of state involves taking up of energy in the case of vaporisation or a
release of energy in the case of condensation. It follows from this that humid air has
more energy to give up than dry air.
Heat and Moisture Pathways
Normally the nose and upper respiratory tract are responsible for heating, humidifying,
and filtering inspired air. This is done so effectively that by and large the heat and
©R. Butcher & M. Boyle, Revised 2009.
Page - 127
Certificate in Advanced Mechanical Ventilation & Respiratory Support.
humidity of the gas within the lungs is in equilibrium. This occurs when the gas is at body
temperature and fully saturated with water vapour at this temperature. There is thus no
nett movement of heat or water between the gas and tissues. The conditions in the lung
remain constant despite changes in the temperature and humidity of inspired gas as well
as changes in minute ventilation and inspiratory flow rate.
Water and heat are transferred to the inspired gas as the gas passes through the upper
airway. Heating and humidification of gas is complete at a point just below the carina.
This point is called the isothermic saturation boundary (ISB). The exact point where
equilibrium occurs varies under normal conditions. For instance the boundary would
move more distal if large tidal volumes of dry cold air were inhaled.
Nose breathing is more effective in warming and humidifying the inspired gas than mouth
breathing. In either case equilibrium will still be reached at the ISB.
On exhalation heat and moisture is returned progressively to the mucosa. This process
results in some heat and water loss from the mucosa as the exhaled gas is generally
warmer and has a greater water content than the inspired gas. The heat and moisture that
is lost is replenished from systemic reserves to enable conditioning of the next breath.
Refer to Figure 1
temp 34
RH 75%
AH 28.2 mg/L
temp 20
RH 50%
AH 8.7 mg/L
temp 32
RH 100%
AH 33.8 mg/L
temp 37
RH 100%
44 mg/L
temp 37
RH 100%
AH 44 mg/L
Expiration (non intubated)
Inspiration (non intubated)
temp 31
RH 30%
AH 9.6 mg/L
temp 20
RH 5%
AH 1 mg/L
temp 34
RH 50%
AH 18.8 mg/L
Inspiration (intubated)
temp 37
RH 100%
AH 44 mg/L
Figure 1. Adapted from Jackson C. Humidification in the upper respiratory tract: a
physiological overview. Intensive and Critical Care Nursing, 1996;12:27032
Airway Clearance and Inspired Gas Conditioning.
The airway mucosa consists of cellular, aqueous, and viscoelastic gel layers. Together
these layers make up the mucociliary transport system. This system functions to remove
©R. Butcher & M. Boyle, Revised 2009.
Page - 128
Certificate in Advanced Mechanical Ventilation & Respiratory Support.
surface liquids and particles from the lung. The cellular layer consists of cells that secrete
mucous gel, secrete aqueous fluid, absorb aqueous fluid, and cells that are ciliated. The
ciliated cells have cilia on their surface that beat in synchrony with the cilia of
neighbouring cells. The cilia propel the gel layer forward. The gel layer floats on an
aqueous layer.
The effectiveness of the mucociliary transport system depends upon maintaining an
effective mucociliary transport velocity. The velocity of transport is effected by changes
to the aqueous and gel layers as well as the beat frequency of the cilia. If the gel layer
“dries out” then transport deteriorates. Also extremes of inspired gas temperature can
reduce cilia beat frequency and thus mucociliary clearance.
“Changes in the properties of any layer have a direct effect on mucociliary function.
Consequently, mucociliary transport dysfunction reflects one of the earliest changes that
would occur if there were inadequate heat or moisture”(1)
Lung Mechanics and Inspired Gas Conditioning
“Inspired humidity can alter lung mechanics by directly affecting airway patency and lung
compliance. Extremes of humidity can compromise airway patency by either altering the
viscosity of tracheobronchial secretions, delivering excess water, slowing mucociliary
clearance, or causing oedema or bronchoconstriction in asthmatic patients. Lung
compliance is compromised by decreased patency, dilution of surfactant by excess water,
high/low humidity causing airway oedema or bronchoconstriction, or altered airway
tissue characteristics through thermal injury”(1)”
Pulmonary Lesions Associated With Inadequate Humidification (6)
•
•
•
•
•
•
•
•
Loss of ciliary action
Damage to mucous glands
Disorganisation of airway epithelium
Disorganisation of basement membranes
Cytoplasmic and nuclear degeneration
Cellular desquamation
Ulceration of mucosa
Reactive hyperaemia
Consequences of Over-Humidification (1)
Heat gain - burning
Water gain
-
water overload
©R. Butcher & M. Boyle, Revised 2009.
Page - 129
Certificate in Advanced Mechanical Ventilation & Respiratory Support.
-
reduced effectiveness of mucociliary escalator
Inspired Gas Conditioning And Tracheal Intubation
The functions of inspired gas conditioning and filtration that occur in the upper airway are
bypassed as a consequence of tracheal intubation.
Appropriate humidification of inspired gases must be undertaken to avoid the
consequences of under or over humidification. An additional concern in the intubated
patient is the need to avoid airway obstruction resulting from tenacious or inspissated
secretions.
Aims of Humidification
• Maintain mucociliary function
• Prevent heat gain of loss
• Prevent airway obstruction
“to supply sufficient heat and moisture in the inspired gas to keep secretions mobile for
clearance by suctioning” (1)
Basic Requirements Of A Humidifier (11)
• The inspired gas is delivered into the trachea at 32-360C with a water content of 3043g/m3.
• The set temperature remains constant and does not fluctuate.
• Humidification and temperature remain unaffected by a large range of fresh gas flows,
especially high flows.
• The device is simple to use and to service.
• Humidification can be provided for air, oxygen, or any mixture of inspired gas,
including anaesthetic agents.
• The humidifier can be used with spontaneous or controlled ventilation.
• There are safety mechanisms, with alarms, against overheating, overhydration and
electrocution.
• The resistance, compliance and dead-space characteristics do not adversely affect
spontaneous breathing modes.
• The sterility of the inspired gas is not compromised.
Methods Of Humidification
Two methods of humidification are used in conjunction with ventilation / artificial airway
management in the intensive care unit;
©R. Butcher & M. Boyle, Revised 2009.
Page - 130
Certificate in Advanced Mechanical Ventilation & Respiratory Support.
• Hot water humidifiers
• Heat and moisture exchangers
Hot Water Humidifiers
Hot water bath humidifiers such as the Fisher & Paykel humidification systems utilise a
heated passover system.
“The humidifier consists of a microprocessor control unit, a water-filled humidification
chamber and a delivery circuit that may be heated.
The water in the humification chamber is heated to produce a molecular vapour. Thus as
the gas is passed through the chamber it is heated to the required temperature and at the
same time collects the water vapour............
The warmed, humidified gas passes to the patient along a tube which can be heated. This
has the advantage of maintaining the correct gas temperature along the length of the
breathing circuit, minimising condensation or “rainout”, in which bacteria can survive
..........
Temperature sensors located at both the humidification chamber outlet and the patient end
of the delivery circuit accurately monitor the temperature of the gas. This information is
fed back to the microprocessor which automatically regulates both the heater plate and the
heater wire to ensure the temperature of the gas remains at the set level” (14)
Clinical Practice Considerations
• Maintain chamber temperature at “body temperature” ie. 370C (Ideally should be set at
“core temperature)
• Set “delivered temperature” at 39 - 400C
The aim of these settings is to provide gas that is saturated at core temperature. As the
tubing is maintained at a temperature greater than chamber temperature the RH of the
inspired gas will be reduced thus avoiding “rainout” and a “wet circuit”. “Wet circuits”
are associated with a higher incidence of bacterial contamination. Although the inspired
gas is heated to 400C heating ceases prior to the patient Y and the gas cools down
between the patient Y and the endotracheal tube. The result is that the isothermic
saturation boundary is maintained at the level of the endotracheal tube ensuring that the
whole of the airway distal to the ET tube is an environment in which there is no net flux
of water or heat. The mucociliary transport system is maintained at an optimal level and
the risk of tube occlusion due to “dry” secretions is minimised.
Movement of fluid retrogradely in the circuit should be avoided - although
• Humidifier chambers have been shown not to support the growth of bacteria as they
are maintained at a high temperature and retrograde contamination has been shown to
be unlikely
©R. Butcher & M. Boyle, Revised 2009.
Page - 131
Certificate in Advanced Mechanical Ventilation & Respiratory Support.
• The greatest concentration of bacteria occurs closer to the ET tube and “flex”
connector. Bacterial contamination of the environment (and attendant carers) can occur
a result of the “spray” that is produced when ventilator tubing is disconnected.
• The use of closed suction systems and closed and/or continuous humidifier chamber
water feed sets may be helpful infection control measures.
• Continuous feed humidifier chamber water feed sets reduce nursing time required for
the care of the system.
• If there is excessive rainout check temperature settings has the tube heater wire been
switched off ?
• Relative humidity is an important consideration - for instance if the delivered
temperature is set at 370C and the chamber temperature set well below this (say -50C)
to prevent rainout the delivered gas will have a RH of 75%. The gas will take water
from the trachea and more proximal sections of the bronchi to saturate the inspired gas
at body temperature. This results in greater likelihood of thick secretions and tube
occlusion.
©R. Butcher & M. Boyle, Revised 2009.
Page - 132
Certificate in Advanced Mechanical Ventilation & Respiratory Support.
Heat and Moisture Exchange Devices
These types of humidifiers contain a material from which heat and water is exchanged
with the inspired and expired gas.
They are of three basic types;
• Heat and Moisture Exchanger (HME)
• Hygroscopic HME
• Hydrophobic HME
Heat Moisture Exchangers
These devices utilise an element that has high thermal conductivity. The element is colder
than exhaled gas thus water condenses on the element and the element is warmed as a
result of heat transfer from the exhaled gas to the element. The element is now warmer
than the inspired gas. The gas on inspiration is warmed by heat transfer from the element
and as the gas is warmed it takes up water.
These devices are generally inefficient and result in poor humidification, water and heat
loss.
Hygroscopic and hydrophobic devices have been developed in order to increase the
humidifying and warming capacity
©R. Butcher & M. Boyle, Revised 2009.
Page - 133
Certificate in Advanced Mechanical Ventilation & Respiratory Support.
Hygroscopic HME
These devices utilise an element of low thermal conductivity that has been impregnated
with a water retaining (hygroscopic) compound (usually calcium chloride or lithium
chloride). The element acts as a condenser humidifier but the efficiency is increased by
the hygroscopic material that is able to absorb water which is then taken up by the
inspired gas. (see Figure 2)
Devices of this sort are the most effective of the HMEs
Hydrophobic HME
These devices contain a material that is impervious to water. Water is retained on the
element and a thermal gradient established that results in water and heat exchange.
Hydrophobic humidifiers are also effective microbiologic filters.
Hybrid devices are available that combine a hygroscopic membrane and a hydrophobic
membrane. These are called Heat Moisture Exchange Filters.
(see Figure 2)
Overall the moisture output of these devices in variable. The composite devices (HMEF)
are able to produce a water output in the range recommended for effective humidification.
However the output of these devices declines with increasing tidal and minute ventilation.
(see Table 1 for comparisons)
The use of Hydrophobic HME has been associated with increased incidence of tube
occlusion.
hygroscopic
medium
T 22
Expiration
T 10
RH 100
RH 100%
T 22
RH 50%
T 33
RH 100%
T 28
RH 100%
T 20
RH 0%
T 20
RH 50%
condenser
element
T 22
RH 50%
T 33
RH 100%
T 20
RH 0%
T 28
RH 100%
Inspiration
T 10
RH 100
condenser element
Hygrscopic HME
Figure 2. adapted from Shelly MP. Inspired gas conditioning. Respiratory Care,
1992;37(9):1070-1080
©R. Butcher & M. Boyle, Revised 2009.
Page - 134
Certificate in Advanced Mechanical Ventilation & Respiratory Support.
Clinical Considerations When Using HMEs
There is an increased risk of tube occlusion when using HMEs in the setting of high tidal
volumes and minute ventilation (> 10L/min)
The safety and effectiveness of HMEs has not been established for long term ventilation
in ICUs
HMEs should not be used as the sole source of humidification when secretions are
copious, thick, and or bloody
Where secretions are bloody there is an increased risk of tube occlusion regardless of the
method of humidification
HMEs can increase the flow resistance and thus increase work of breathing
HMEs are cheaper and less labour intensive than hot water humidifiers
HMEs can be used as microbiological filters
HMEs increase mechanical dead space
Use of Nebulisers and Saline Instillation as Humidification Adjuncts
Nebulisers increase the risk of bacterial contamination and have the potential to
“overhumidify”
Normal saline instillation has no place in the management of intubated patients. It does
not loosen or moisten secretions nor increase sputum removal
©R. Butcher & M. Boyle, Revised 2009.
Page - 135
Certificate in Advanced Mechanical Ventilation & Respiratory Support.
2.2 Studies Evaluating Performance of Humidifiers
Study
Description
Result
Martin (1)
Clinical
study,
prospective
randomised, controlled. Compared Pall
Ultipor HME with hot water
humidifier. Long term ventilation.
6 tube occlusions in HME group (31
patients in group) with one death as a
result of tube occlusion.
No tube occlusions in Hot water
humidfier group.
Greater incidence of hypothermia on
HME group.
Increased number of days with thick
secretions in HME group.
NB. Hot water humidifier set to deliver
at only 310C
Branson (2)
Lung model - test bench evaluation.
Tested 7 devices;
Airlife Humid air (hygro)
Engstrom Edith (hygro-hydro)
Mallinckrodt Inline Foam Nose
(hygro)
Pall conserve (hydro)
Portex Humid-Vent 1 (HME)
Siemens Servo Humid 150 (hygro)
Terumo Breathaid (hygro)
All humidifiers delivered greater than
21mgH2O/L. Moisture output fell as
TV increased.
Hydrophobic unit (Pall) did not meet
minimum standard.
Recommended that use of HMEs
limited to only short term duration in
well hydrated, normothermic patients.
Eckerbom (3)
Test bench according
International Standard.
Tested 6 devices;
Pall Ultipor Filter
Mallinckrodt Inline
Siemens Servo 152
Engstrom Edith
Triplus Icor
Portex Humid Vent 1
to
Draft Icor, Servo, Inline, Edith - very good
performance.
Pall - good performance for TV up to
approx. 700mL
Humid
Vent
1
acceptable
performance for TV up to 500mL
Stoutenbeck (4)
Test bench - lung model plus clinical NB. Clinical trial only short term
test
ventilation
Compared Siemens Servo 150 (Hygro) Hygro unit superior to non hygro unit
with Portex Humid Vent (HME)
Hygro = hygroscopic
Hydro = hydrophobic
Hygro - hydro = hygroscopic + hydrophobic
HME = standard filter
©R. Butcher & M. Boyle, Revised 2009.
Page - 136
Certificate in Advanced Mechanical Ventilation & Respiratory Support.
1. Martin C, Perrin G, Gevaudan M, Saux P, Gouin F. Heat and moisture exchangers and
vaporising humidifiers in the intensive care unit. Chest, 1990;97(1):144-49
2. Branson RD, Hurst JM. Laboratory evaluation of moisture output of seven airway heat and
moisture exchangers. Respiratory Care, 1987;32(9):741-747
3. Eckerbom B, Lindholm CE. Performance evaluation of six heat and moisture exchangers
according to the draft international standard (ISO/DIS 9360). Acta Anaesthesiol Scand,
1990;34:404-409
4. Stoutenbeck Ch, Miranda D, Zandstra D. A new hygroscopic condenser humidifier. Intensive
Care Med, 1982;8:231-234
©R. Butcher & M. Boyle, Revised 2009.
Page - 137
Certificate in Advanced Mechanical Ventilation & Respiratory Support.
Question14) Why might heat and moisture exchangers be an acceptable
means of humidification for a patient post cardiac surgery?
Question15) Why is it generally unnecessary to humidify gas for
receiving 50% oxygen via a venturi mask?
Question16) When is it necessary to provide artificial humidification?
©R. Butcher & M. Boyle, Revised 2009.
Page - 138
Certificate in Advanced Mechanical Ventilation & Respiratory Support.
REFERENCES AND FURTHER READING - HUMIDIFICATION
1. Williams R, Rankin N, Smith T, Galler D, Seakins P. “Relationship between the
humidity and temperature of inspired gas and the function of the airway mucosa”. Crit
Care Med, 1996;24(11):1920-1929
2. Hedley RM, Allt-Graham J. “Heat and moisture exchangers and breathing filters”. Br.
J. Anaesthesia, 1994:73:227-236
3. Villafane MC, Cinnella G, Lofaso F, Isabey D, Hart A, Lemaire F, Brochard L.
“Gradual reduction of endotracheal tube diameter during mechanical ventilation via
different humidification devices”. Anesthesiology, 1996;85(6):1341-1349
4. Branson RD, Chatburn RL. “Humidification of inspired gases during mechanical
ventilation”. Respiratory Care, 1993;38(5):461-468
5. Jackson C. “Hunidification in the upper respiratory tract: a physiological overview”.
Intensive and Critical Care Nursing, 1996;12:27-32
6. Shelly MP. “Inspired gas conditioning”. Respiratory Care, 1992:37(9):1070-1080
7. Shelly MP, Lloyd GM, Park GR. “A review of the mechanisms and methods of
humidification of inspired gases”. Intensive Care Med, 1988;14:1-9
8. Cohen IL, Weinberg PF, Fein A, Rowinski S. “Endotracheal tube occlusion associated
with the use of heat and moisture exchangers in the intensive care unit”. Crit Care
Med, 1988;16(3):277-279
9. Chatburn RL, Primiano FP. “A rational basis for humidity therapy”. Respiratory Care,
1987. 32(4):249-254
10.Chamney AR. “Humidification requirements and techniques”. Anaesthesia, 1969;
24(4):602-613
11.Bersten AD, Oh TE. “Humidification and inhalation therapy”. In; Oh TE, ed. Intensive
Care Manual, 4th ed 1997, Butterworth-Heinemann, Oxford
12.Ackerman MH, Ecklund MM, Abu-Jumah M. “A review of normal saline instillation:
implications for practice”. Dimensions of Critical Care Nursing, 1996;15(1):31-38
13.Tsuda T, Noguchi H, Takumi Y, Aochi O. “Optimum humidification of air
administered to a tracheostomy in dogs”. Br. J. Anaesth., 1977;49:965-974
14.Fisher & Paykel Healthcare Publication. Why Fisher & Paykel humidification is vital.
1993
©R. Butcher & M. Boyle, Revised 2009.
Page - 139
Certificate in Advanced Mechanical Ventilation & Respiratory Support.
VENTILATOR ACQUIRED PNEUMONIA (VAP)
Infection is a major problem in the critically ill1 mainly because it is common,
frequently hospital acquired and directly contributes towards mortality. In the mid
1990’s a large, Europe-wide study2 demonstrated that almost half (44.8%) of the
patients in an intensive care unit (ICU) had an infection. Just under a third of these
(30.6%) infections were acquired in the hospital or in the ICU. In the same study it
was noted that there was a substantial variability in the infection rates between
countries (refer to the following table2). Not surprisingly countries with a higher
infection rate had a higher mortality rate.
The critically ill are prone to infection because they are frequently immunocompromised, require invasive lines and procedures and come into frequent contact
with health care workers. The site of infection is most frequently the respiratory tract ,
although infections in the urinary tract and bloodstream are also common (refer to the
following table). 2 Due to the frequency of respiratory infections in the critically ill
and the preventative nature of these conditions there has been a great deal of attention
to the prevention of ventilator acquired pneumonia’s (VAP) in the critically ill in
recent years.
©R. Butcher & M. Boyle, Revised 2009.
Page - 140
Certificate in Advanced Mechanical Ventilation & Respiratory Support.
Describe strategies that should be used to prevent VAP.
Readings:
•
•
•
•
•
•
•
Munro CL, Grap MJ. 2004 “Oral health and care in the intensive care unit: state of
the science”. American Journal of Critical Care;13(1):25-33.
Centers for Disease Control and Prevention. 2003 “Guidelines for preventing
health-care–associated pneumonia: recommendations of CDC and the Healthcare
Infection Control Practices Advisory Committee”. MMWR 2004;53 (No. RR3):pp. 1-36
Chlebicki, M.P, Safdar, N, 2007, “Topical chlorhexidine for prevention of
ventilator-associated pneumonia: A meta-analysis” Critical Care Medicine Vol.
35, No. 2, pp. 595-602.
Nieuwenhoven, C.A, Vandenbroucke-Grauls, C, Tiel, F. A. Joore, H, C. A.,
Strack van Schijndel, R,. J. M, Tweel, I, Ramsay, G. & Bonten, M 2006
“Feasibility and effects of the semirecumbent position to prevent ventilatorassociated pneumonia: A randomized study” Critical Care Medicine Vol. 34, No.
2, pp. 396-402.
Jean-Louis Vincent, 2005, “Give your patient a fast hug (at least) once a day”,
Critical Care Medicine Vol. 33, No. 6, pp.
Ricart M, Loriete C, Diaz E, Kollef MH, Rello. 2003 “Nursing adherence with
evidence-based guidelines for preventing ventilator-associated pneumonia”.
Critical Care Medicine;31(11):2693-2696.
Collard HR, Saint S, Matthay MA. 2003, “Prevention of ventilator-associated
pneumonia: An evidenced-based systematic review”. Annals of Internal
Medicine;138:494-501
Patient Ventilator Disynchony
©R. Butcher & M. Boyle, Revised 2009.
Page - 141
Certificate in Advanced Mechanical Ventilation & Respiratory Support.
IMPOSED WORK OF BREATHING.
Work of Breathing
This is the work done to overcome the resistance to gas flow and to overcome the elastic
work properties of the lungs and chest wall. It is a function of;
•
•
•
airflow resistance
pulmonary and chest wall compliance
minute ventilation
The work of breathing is reflected by the oxygen cost of breathing. This is usually
approximately 3% of total oxygen delivery under normal conditions but is very much
greater in extreme conditions.
Factors affecting work of breathing for intubated ventilated patients
A) Imposed work of breathing
B) Physiological work imposed by disease increases physiological work of breathing
This component of work is reduced by the appropriate application of PEEP or CPAP
C) Normal physiological workload.
Factor
Initiation of gas flow
Circuit resistance (including ETT)
Poor patient - ventilator synchrony
©R. Butcher & M. Boyle, Revised 2009.
Response
• Trigger sensitivity and responsiveness
• Continuous flow circuit
• flow triggering
• proximal pressure measurement
• titration of pressure support
• use of appropriate size of ETT
• Titration of flow
• Pressure support ventilation
• pressure controlled ventilation
Page - 142
Certificate in Advanced Mechanical Ventilation & Respiratory Support.
Attaching a patient to a breathing circuit (Ventilator, CPAP circuit, ETT,
T-piece) imposes a workload on the muscles of ventilation over and above
the workload required to breathe normally.
Sources Of Work Load;
•
Ventilator with demand valve spontaneous breathing
1. Demand valve - an initial pressure or flow must be
generated, as a result of the work of the respiratory muscles,
to trigger the machine. Triggering the machine results in gas
flow.
2. Time delay - a time delay between the opening of the
demand valve and fresh gas flow will result in a period of
respiratory muscle tension without flow - therefore increased
work.
•
Ventilator and Continuous Flow CPAP Circuit.
1. Fresh gas flow rate - once flow is triggered if it does not
meet patient demand this will be the same as the patient
"sucking" on the circuit ie doing work on the circuit to obtain
gas to meet demand. Patient discomfort (fighting the
ventilator) results from the degree to which these problems
exist in a ventilator setup
2. Resistance and Inertia of Circuit Components
• narrow tubing ETT/TT
• humidifier
• one way valves
• filters (especially if wet)
• exhale valves
Further reading;
1. Ten Eyck LG, & MacIntyre NR. “Imposed work of breathing during mechanical
ventilation.” Arkos, 1989: 10-14.
2. Perel A., Stock CM. Handbook of Mechanical Ventilatory Support. Williams and
Wilkins.
©R. Butcher & M. Boyle, Revised 2009.
Page - 143
Certificate in Advanced Mechanical Ventilation & Respiratory Support.
3. WEANING FROM MECHANICAL VENTILATORY SUPPORT
Weaning involves the transfer of the work of breathing from the ventilator to the patient.
Weaning can be seen as a continuation of the process of minimising the work imposed by
the breathing circuit and the work imposed by the lung pathology
Weaning considerations
•
•
•
•
Limiting the imposed work of breathing
Assessing the function of respiratory centre - respiratory drive
Assessing function of the nerves and the neuromuscular junction
Assessing loads imposed by the chest wall and abdomen (eg fail segment, sternotomy,
abdominal distension)
• Assessing respiratory muscle strength and stamina
Weaning Assessment
Consideration
Ventilatory Drive
Method of Assessment
P 100 (P.1)
Muscle Strength
Negative Inspiratory Pressure
Maximum Inspiratory Pressure
Endurance
Respiratory Rate
Fatigue
Assessment of Breathing Pattern
• asynchronous
• paradox
3.1 Respiratory Drive (P100 or P0.1)
The P 0.1 is the most negative pressure that a patient can generate against a closed system
during the first one hundred milliseconds of a spontaneous effort. The P 100 can be
measured via the ventilator circuit or by an oesophageal balloon. ). Airway occlusion
pressure has been shown to correlate with phrenic nerve activity and is this considered to
a measure of central respiratory drive. The P 100 value is thus indicative of the amount of
neural activity that is driving diaphragmatic movement (respiratory center drive). The
normal range is 2-4 cms H2O and a P 100 <6 cms H2O is an indicator of readiness for
weaning. It is important to realise that the P 100 will be affected by the level of
ventilatory assistance that the patient is receiving. A patient may have an adequate
respiratory drive but a low P 100 due to high levels of assistance from the ventilator eg
too much pressure support. Conversely the P 100 could also be high due to an inadequate
amount of support from the ventilator or a high resistive component, such as tube
occlusion.25, 27,28
©R. Butcher & M. Boyle, Revised 2009.
Page - 144
Certificate in Advanced Mechanical Ventilation & Respiratory Support.
3.2 Maximum Inspiratory Pressure ( MIP) &
Negative Inspiratory Pressure (NIP)
MIP is the pressure change measured by an oesophageal balloon, that the patient can
when the airway is occluded for several breaths. Cooperative patients can perform this
manoeuvre in a short period of time; however many patients require longer occlusion
periods in order for the neural drive to increase and produce a maximum effort. MIP is a
reflection of diaphragmatic strength and may also be used to monitor respiratory muscle
endurance when serial measurements are made. MIP differs slightly from negative
inspiratory force, which is measured at the mouth but also reflects or measures
diaphragmatic strength. The normal range for MIP is from -30cm H2O (low effort) to -140
cmsH20 (high effort). 25,27,28
3.3 Delta Oesophageal Pressure.
This value is measured as the total downward or negative deflection in the oesophageal
pressure trace during a patient generated breath beginning from the end resting
oesophageal pressure. It is an indication of the pressure generated by the patient in
stretching the lung and drawing gas into the lung. Although it has been described in the
literature as a strength parameter, it also has endurance implications because of the work
that must be performed with each patient breath. Normal range is 5-10cms H20 and delta
pressure <15 cms H20 is an indication of readiness for weaning. This measurement, like
the P 100 should also be assessed in conjunction with the level of assistance that the
patient is receiving from the ventilator. 25,27,28
Question11). You are trying to wean your patient from the ventilator, on the
following settings, when the patient becomes distressed and desatrates to 75%. The
ventilator is alarming high inspiratory pressure and low tidal volume on the
following settings. Describe the immediate action you would take and provide
a rationale for the patient’s condition.
• Volume Cycled SIMV
• Rate 8
• TV 700mls
• Pressure support 20 cms H2O
• PEEP 10 cms H2O
• PIP 35
• Plateau pressure 30
• High inspiratory pressure alarm set at 20 cms H2O
©R. Butcher & M. Boyle, Revised 2009.
Page - 145
Certificate in Advanced Mechanical Ventilation & Respiratory Support.
References and Further Reading -Weaning from Mechanical Ventilation
26.Ten Eyck LG, & MacIntyre NR. “Imposed work of breathing during mechanical
ventilation.” Arkos, 1989: 10-14.
27.Gursahaney, A. & Gottfried, S. 1995, “Monitoring respiratory mechanics in the
intensive care unit”, Current Opinion in Critical Care, vol 1, pp 32-42.
28.Johnson, T. & Stothert, J. 1995, “Respiratory evaluation and support in the ICU”,
Current Opinion in Critical Care, vol 1, pp 306-314.
29.Kirton, O. Dehaven, B, Morgan, J. Windsor, & Civetta, M. 1995, “Elevated imposed
work of breathing masquerading as ventilator weaning intolerance”, Chest, vol. 108,
no. 4, pp. 1021-1025.
30.Laghi, F. & Tobin, J. 1995, “Weaning from mechanical ventilation”, Current Opinion
in Critical Care, vol 1, pp 71-76.
31.Levy, M. Miyasaki, A. & Langston, D. 1995, “Work of breathing as a weaning
parameter in mechanically ventilated patients”, Chest, vol. 108, no. 4, pp. 1018-1020.
©R. Butcher & M. Boyle, Revised 2009.
Page - 146
Certificate in Advanced Mechanical Ventilation & Respiratory Support.
PATIENT VENTILATOR SYNCHRONY
Dysynchrony between vigorous spontaneous efforts and machine delivered breaths is
often referred to as fighting the ventilator. Because increased inspiratory efforts are often
followed by active expiration, discrepancies between machine and patient inspiratory time
can cause peak airway pressure to increase and violate the high pressure alarm, which
inturn terminates the breath. Inappropriate ventilator mode or improper selection of
ventilator settings can contribute to the development of dysynchrony between the patient
and mechanical ventilator. Dysynchrony may result in:
• respiratory and metabolic acidosis - due to unnecessary motor activity;
• a deterioration in gas exchange
• a compromised cardiac output - due to excessive intrathoracic pressures; and
• a prolonged weaning phase - due to the need for sedation. 15
As mentioned previously (see section 2 - Triggering) excessive time delays between the
patient’s initial efforts to initiate a breath and the delivery of gas flow can impose a
significant work of breathing. While this may be decreased with the use of flow
triggering, the potential for patient ventilator dysynchrony can still occur due to improper
selection of flow, volume and timing settings on the mechanical ventilator.15
Question12) Describe how the improper selection of flow, volume and
timing settings might contribute to patient ventilator dysynchrony? Discuss the
strategies or settings that maybe implemented to decrease the risk of patient ventilator
dysynchrony.
©R. Butcher & M. Boyle, Revised 2009.
Page - 147
Certificate in Advanced Mechanical Ventilation & Respiratory Support.
P
Question 13): Observe the following waveforms
and comment where indicated.
P
r
e
s
s
u
r
e
F
l
o
w
V
o
l
u
m
e
Time
Mode
Problem
Solution
©R. Butcher & M. Boyle, Revised 2009.
Page - 148
Certificate in Advanced Mechanical Ventilation & Respiratory Support.
P
r
e
s
s
u
r
e
F
l
o
w
V
o
l
u
m
e
Time
Mode
Problem
Solution
©R. Butcher & M. Boyle, Revised 2009.
Page - 149
Certificate in Advanced Mechanical Ventilation & Respiratory Support.
4. REFERENCES AND RESOURCES - MECHANICAL VENTILATION
1. Banner, M. & Lampotang, S, 1992, “Mechanical ventilation - fundamentals” in
Handbook of Mechanical Ventilatory Support, A. Perel and Stock, M. eds,
Williams & Williams, Baltimore.
2. Slutsky, A. 1993, “Mechanical ventilation”, Chest, Vol 104, no 6, pp 1833 - 1859
.
3. Cress, M. & Cronover, S. “A clinical guide to cardiopulmonary medicine”, Puritan
Bennett.
4. Pierson, D. 1994, “Barotrauma and bronchopleura fistula” in Principles and
Practice of Mechanical Ventilation, M. Tobin, ed, McGraw Hill, New Work.
5. Kacmarek, R. & Hess, D. 1994, “Basic Principles of Ventilator Machinery”, in
Principles and Practice of Mechanical Ventilation, M. Tobin, ed, McGraw Hill,
New Work.
6. Rossi, A. Ranieri, 1994, “Positive end-expiratory pressure” in Principles and
Practice of Mechanical Ventilation, M. Tobin, ed, McGraw Hill, New Work.
7. Hall, J. Schmidt, G. & Wood, L. 1992, Principles of Critical Care, ed, McGraw
Hill Inc, New York
8. Smith, R. 1992, “Positive end-expiratory pressure (PEEP) and continuous positive
airway pressure (CPAP)” in Handbook of Mechanical Ventilatory Support, A.
Perel and Stock, M. eds, Williams & Williams, Baltimore.
9. Perel A., & Stock MC. 1992, Handbook of Mechanical Ventilatory Support.
Williams & Williams, Baltimore.
10.Kastens, V. 1991, “Nursing management of auto-PEEP” Focus on Critical Care,
vol. 18, no. 5, pp 419-421.
11.Tobin, M. & Lodato, R. 1989, “PEEP, auto-PEEP and waterfalls” Chest 1989; 96,
pp. 449-451
12.Marini, J. 1989, “Should PEEP be used in airflow obstruction?” American Review
of Respiratory Disease, 140, pp. 1-3.
13.Fernandez, R,. Benito. S. Blanch, L. & Net, A. 1988, “Intrinsic PEEP: a cause of
inspiratory muscle ineffectivity” Intensive Care Medicine, 15, pp. 51-52.
14.Georgopouloulos, D. Giannouli, E. & Patakas, D. 1993, “Effects of extrinsic
positive end expiratory pressure on mechanically ventilated patients with chronic
obstructive pulmonary disease and dynamic hyperventilation” Intensive Care
Medicine, 15, pp. 51-52.
©R. Butcher & M. Boyle, Revised 2009.
Page - 150
Certificate in Advanced Mechanical Ventilation & Respiratory Support.
15.Tobin, M. 1994, Principles and Practice of Mechanical Ventilation, McGraw Hill,
New Work.
16.Brochard, L, 1994, “Pressure support ventilation”, in Principles and Practice of
Mechanical Ventilation, M. Tobin, ed, McGraw Hill, New Work.
17.MacIntyre, N, 1992, “Pressure Support Ventilation” in Handbook of Mechanical
Ventilatory Support, A. Perel & Stock, M. Ed, Williams and Williams, Baltimore.
18.“Pressure Control Ventilation Review”, Puritan Bennet.
19.MacIntyre, N. 1994, “Pressure-limited versus volume-cycled breath delivery
strategies”, Critical Care Medicine, vol. 22, no. 1, pp 4-5.
20.Rappaport, S. Shpiner, R. Yoshihara, G. Wright, J. Chang, P. & Abraham, E. 1994,
“Randomized, prospective trial of pressure-limited versus volume-controlled
ventilation in severe respiratory failure”, Critical Care Medicine, vol. 22, no. 1, pp.
22-32.
21.Munoz, J, Guerrero, J, Escalante, J, Palomino, R. & De La Calle, B. 1993,
“Pressure controlled ventilation versus controlled mechanical ventilation with
decelerating inspiratory flow”, Critical Care Medicine, vol. 21, no. 8, pp. 11431148.
22.Gurevitch. M, 1992, “Inverse ratio ventilation and the inspiratory/expiratory ratio”
in Handbook of Mechanical Ventilatory Support, A. Perel & Stock, M. Ed,
Williams and Williams, Baltimore.
23.Stewart, T. & Slutsky, A. 1995, “Mechanical ventilation: a shifting philosophy”,
Current Opinion in Critical Care, vol 1, pp 49-56.
24.Gowski, D & Miro, A, 1996, “New ventilatory strategies in acute respiratory
failure” Critical Care Nurse Quarterly, vol. 19, no. 3, pp1-22.
25.Nilsestuen, J & Hargett, K. 1996, “Managing the patient-ventilator system using
graphic analysis; an overview and introduction to graphics corner” Respiratory
Care, vol. 41, no. 12, pp 110526.Ten Eyck LG, & MacIntyre NR. “Imposed work of breathing during mechanical
ventilation.” Arkos, 1989: 10-14.
27.Gursahaney, A. & Gottfried, S. 1995, “Monitoring respiratory mechanics in the
intensive care unit”, Current Opinion in Critical Care, vol 1, pp 32-42.
28.Johnson, T. & Stothert, J. 1995, “Respiratory evaluation and support in the ICU”,
Current Opinion in Critical Care, vol 1, pp 306-314.
©R. Butcher & M. Boyle, Revised 2009.
Page - 151
Certificate in Advanced Mechanical Ventilation & Respiratory Support.
29.Kirton, O. Dehaven, B, Morgan, J. Windsor, & Civetta, M. 1995, “Elevated
imposed work of breathing masquerading as ventilator weaning intolerance”,
Chest, vol. 108, no. 4, pp. 1021-1025.
30.Laghi, F. & Tobin, J. 1995, “Weaning from mechanical ventilation”, Current
Opinion in Critical Care, vol 1, pp 71-76.
31.Levy, M. Miyasaki, A. & Langston, D. 1995, “Work of breathing as a weaning
parameter in mechanically ventilated patients”, Chest, vol. 108, no. 4, pp. 10181020.
32.Gattinoni, L. 1996, “Pathophysiological insights into acute respiratory failure”
Current Opinion in Critical Care, no.2, 8-12.
33.MacIntyre, N, 1996, “”Minimising alveolar stretch injury during mechanical
ventilation”, Respiratory Care, vol. 41, no. 4, 318-323.
34.Albert, J. 1997, “For every thing (turn…turn…turn) editorial, American
Respiratory Critical Care Medicine, vol. 155, pp 393-394
35.Albert, R. 1996, “Positioning and the patient with acute respiratory distress
syndrome”, Current Opinion in Critical Care, no.2, 67-72
36.Aubier, M. 1995, “Pathophysiologic and therapy of chronic obstructive pulmonary
disease”, Current Opinion in Critical Care, vol 1, pp 11-15.
37.Chatee et al, 1997, “Prone position in mechanically ventilated patients with severe
acute respiratory failure” American Respiratory Critical Care Medicine, vol. 155,
pp 473-478.
• Cioffi, W. & Oguram, H. 1995, “Inhaled nitric oxide in acute lung disease”, New
Horizons, vol. 3, no. 1, pp. 73-84.
• Gommers, D, & Lachmann, B, 1995, “Surfactant therapy in the adult patient”,
Current Opinion in Critical Care, vol 1, pp 57-61.
• Marcy, T. & Marini, J, 1992, “Controlled mechanical ventilation and assist control
ventilation” in Handbook of Mechanical Ventilatory Support, A. Perel & Stock, M.
Ed, Williams and Williams, Baltimore.
• Smith, R. 1992, “Positive end-expiratory pressure (PEEP) and continuous positive
airway pressure” in Handbook of Mechanical Ventilatory Support, A. Perel &
Stock, M. Ed, Williams and Williams, Baltimore.
©R. Butcher & M. Boyle, Revised 2009.
Page - 152
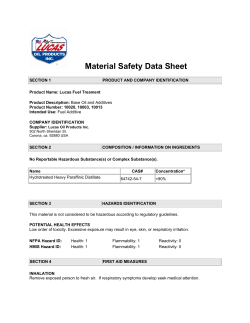


© Copyright 2026