
Rice Stocks
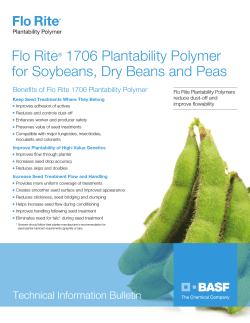
Rice Stocks ISSN: 1949-1603 Released October 29, 2014, by the National Agricultural Statistics Service (NASS), Agricultural Statistics Board, United States Department of Agriculture (USDA). California Rough Rice Stocks Up 158 Percent from October 2013 California rough rice stocks in all positions on October 1, 2014 totaled 7.54 million hundredweight (cwt), up 158 percent from the total on October 1, 2013 of 2.93 million cwt. California rough rice stocks were down 31 percent from the August 1, 2014 level. Medium grain varities accounted for 89 percent of the total rough rice, while long and short varieties combined account for 11 percent of the total rough rice stocks. California milled rice stocks in all positions totaled 1.11 million cwt, down 22 percent from the August 1, 2014 level and 8 percent below a year ago. Rough Rice Stocks in All Positions – California October 1, 2005 - 2014 Million cwt 8 7 6 5 4 3 2 1 0 2005 2006 2007 2008 2009 2010 2011 2012 2013 2014 Rice Stocks by Position and Month in Domestic Units – United States: 2013 and 2014 [Blank data cells indicate estimation period has not yet begun] 2013 Date 2014 On farms Off farms 1 Total all positions On farms Off farms 1 Total all positions (1,000 cwt) (1,000 cwt) (1,000 cwt) (1,000 cwt) (1,000 cwt) (1,000 cwt) Rough rice March 1 .......................... June 1 ............................ August 1 ........................ October 1 2 ..................... December 1 ................... 18,430 (NA) 640 20 36,935 85,839 (NA) 29,880 2,906 96,636 104,269 (NA) 30,520 2,926 133,571 14,995 4,830 305 15 73,959 45,521 26,299 7,523 88,954 50,351 26,604 7,538 Milled rice March 1 .......................... June 1 ............................ August 1 ........................ October 1 2 ..................... December 1 ................... (X) (X) (X) (X) (X) 6,665 (NA) 4,132 1,210 6,605 6,665 (NA) 4,132 1,210 6,605 (X) (X) (X) (X) (X) 5,844 5,870 3,711 1,113 5,844 5,870 3,711 1,113 (NA) Not available. (X) Not applicable. 1 Includes stocks at mills, elevators, warehouses, ports, and in transit. 2 California only. Rice Stocks by Position and Month in Metric Units – United States: 2013 and 2014 [Data may not add to totals due to rounding. Blank data cells indicate estimation period has not yet begun] 2013 Date 2014 On farms Off farms 1 Total all positions On farms Off farms 1 Total all positions (metric tons) (metric tons) (metric tons) (metric tons) (metric tons) (metric tons) Rough rice March 1 .......................... June 1 ............................ August 1 ........................ October 1 2 ..................... December 1 ................... 835,970 (NA) 29,030 910 1,675,340 3,893,590 (NA) 1,355,330 131,810 4,383,340 4,729,560 (NA) 1,384,360 132,720 6,058,680 680,160 219,090 13,830 680 3,354,720 2,064,800 1,192,900 341,240 4,034,890 2,283,880 1,206,740 341,920 Milled rice March 1 .......................... June 1 ............................ August 1 ........................ October 1 2 ..................... December 1 ................... (X) (X) (X) (X) (X) 302,320 (NA) 187,420 54,880 299,600 302,320 (NA) 187,420 54,880 299,600 (X) (X) (X) (X) (X) 265,080 266,260 168,330 50,480 265,080 266,260 168,330 50,480 (NA) Not available. (X) Not applicable. 1 Includes stocks at mills, elevators, warehouses, ports, and in transit. 2 California only. 2 Rice Stocks (October 2014) USDA, National Agricultural Statistics Service Rough Rice Stocks by Length of Grain in All Positions – California: October 1, 2013 and 2014 State Long Medium 2013 2014 (1,000 cwt) California .............. (1,000 cwt) (D) Short 2013 2014 2013 (1,000 cwt) (1,000 cwt) (1,000 cwt) (D) 2,029 6,691 Total 2014 (1,000 cwt) (D) (D) 2013 2014 (1,000 cwt) (1,000 cwt) 2,926 7,538 (D) Withheld to avoid disclosing data for individual operations. Milled Rice Stocks by Length of Grain in All Positions – California: October 1, 2013 and 2014 Whole kernels (head rice) State Long 2013 2014 (1,000 cwt) California .............. Medium 2013 (1,000 cwt) (D) (1,000 cwt) (D) Short 2014 2013 (1,000 cwt) (1,000 cwt) (D) 603 Total 2014 2013 (1,000 cwt) 28 2014 (1,000 cwt) (D) (1,000 cwt) 470 651 Broken kernels State California .............. Screenings 1 Second heads Brewers Total 2013 2014 2013 2014 2013 2014 2013 2014 (1,000 cwt) (1,000 cwt) (1,000 cwt) (1,000 cwt) (1,000 cwt) (1,000 cwt) (1,000 cwt) (1,000 cwt) (D) (D) - - (D) (D) 740 462 - Represents zero. (D) Withheld to avoid disclosing data for individual operations. 1 Screenings included with second heads. Rice Stocks (October 2014) USDA, National Agricultural Statistics Service 3 Rice Stocks by Position – States and United States: August 1, 2013 and 2014 2013 State 2014 On farms Off farms 1 Total all positions On farms Off farms 1 Total all positions (1,000 cwt) (1,000 cwt) (1,000 cwt) (1,000 cwt) (1,000 cwt) (1,000 cwt) Rough rice Arkansas ........................ California ....................... Louisiana ....................... Mississippi ..................... Missouri ......................... Texas ............................. 240 120 (D) (D) (D) (D) 15,639 8,062 (D) (D) (D) (D) 15,879 8,182 2,390 640 1,039 2,390 80 100 60 (D) (D) (D) 10,397 10,897 1,120 (D) (D) (D) 10,477 10,997 1,180 683 806 2,461 Unallocated 2 .................. 280 6,179 - 65 3,885 - United States ................. 640 29,880 30,520 305 26,299 26,604 Milled rice Arkansas ........................ California ....................... Louisiana ....................... Mississippi ..................... Missouri ......................... Texas ............................. (X) (X) (X) (X) (X) (X) (D) 1,328 337 (D) (D) 523 (D) 1,328 337 (D) (D) 523 (X) (X) (X) (X) (X) (X) 1,379 1,420 (D) (D) (D) 505 1,379 1,420 (D) (D) (D) 505 Unallocated 2 .................. (X) 1,944 1,944 (X) 407 407 United States ................. (X) 4,132 4,132 (X) 3,711 3,711 - Represents zero. (D) Withheld to avoid disclosing data for individual operations. (X) Not applicable. 1 Includes stocks at mills, elevators, warehouses, ports, and in transit. 2 Unallocated includes State data withheld to avoid disclosure of individual operations. 4 Rice Stocks (October 2014) USDA, National Agricultural Statistics Service Rough Rice Stocks by Length of Grain in All Positions – States and United States: August 1, 2013 and 2014 State Long Medium 2013 2014 (1,000 cwt) (1,000 cwt) Short Total 2013 2014 2013 2014 (1,000 cwt) (1,000 cwt) (1,000 cwt) (1,000 cwt) 2013 2014 (1,000 cwt) (1,000 cwt) California .......................... 245 (D) 6,915 9,833 1,022 (D) 8,182 10,997 Other States 1 ................... 19,194 (D) 3,142 1,798 2 (D) 22,338 15,607 United States .................... 19,439 14,010 10,057 11,631 1,024 963 30,520 26,604 (D) Withheld to avoid disclosing data for individual operations. 1 Other States include Arkansas, Louisiana, Mississippi, Missouri, and Texas. Milled Rice Stocks by Length of Grain in All Positions – States and United States: August 1, 2013 and 2014 Whole kernels (head rice) State Long 2013 Medium 2014 (1,000 cwt) 2013 (1,000 cwt) Short 2014 (1,000 cwt) 2013 (1,000 cwt) Total 2014 (1,000 cwt) 2013 (1,000 cwt) 2014 (1,000 cwt) (1,000 cwt) California .......................... (D) (D) (D) (D) 61 (D) 597 436 Other States 1 ................... (D) (D) (D) (D) - (D) 1,894 1,639 United States .................... 1,704 1,556 726 472 61 47 2,491 2,075 Broken kernels State Screenings 2 Second heads Brewers Total 2013 2014 2013 2014 2013 2014 2013 2014 (1,000 cwt) (1,000 cwt) (1,000 cwt) (1,000 cwt) (1,000 cwt) (1,000 cwt) (1,000 cwt) (1,000 cwt) California .......................... 566 (D) - (D) 165 (D) 731 984 Other States 1 ................... 538 (D) 153 (D) 219 (D) 910 652 United States .................... 1,104 797 153 92 384 747 1,641 1,636 - Represents zero. (D) Withheld to avoid disclosing data for individual operations. 1 Other States include Arkansas, Louisiana, Mississippi, Missouri, and Texas. 2 Screenings included with second heads in California. Rice Stocks (October 2014) USDA, National Agricultural Statistics Service 5 Statistical Methodology Survey Procedures: The rice stocks estimates in this report are based on a survey conducted during the first two weeks of October. Unlike other rice stocks estimating periods, only an off-farm survey was conducted. Off-farm stocks are a census of all known rice storage facilities. An effort is made to obtain reports from all off-farm facilities. Estimates are made for missing facilities to assure complete coverage. On-farm stocks in October are estimated based on historical changes from the previous estimating period. Estimating Procedures: Survey data are reviewed at the State and National levels for reasonableness, consistency with historical estimates, and current crop size. After estimates are made for on-farm and off-farm rice stocks, the total of these two are combined and evaluated using the balance sheet approach. This method utilizes other sources of data to check the reasonableness of the stocks estimates. Estimates of production, exports, and millings are reviewed to make sure beginning stocks, production, utilization, and ending stocks are within reasonable balance and present the best possible estimate of stocks. Revision Policy: On-farm and off-farm stocks are subject to revision in the period following initial publication and again in the following December 1 Rice Stocks report published in January each year. Revisions can be made when late reports are received, errors are detected in reporting and calculating, and when production estimates are revised. Estimates will also be reviewed after data from the 5-year Census of Agriculture are available. No revisions to these years will be made after that date. Reliability: Survey indications are also subject to non-sampling errors such as omission, duplication, imputation for missing data, and mistakes in reporting, recording, and processing the data. These errors cannot be measured directly, but they are minimized through rigid quality controls in the data collection process and a careful review of all reported data for consistency and reasonableness. Information Contacts Listed below are the commodity statisticians in the Crops Branch of the National Agricultural Statistics Service to contact for additional information. E-mail inquiries may be sent to [email protected] Lance Honig, Chief, Crops Branch ....................................................................................................... (202) 720-2127 Anthony Prillaman, Head, Field Crops Section .................................................................................... (202) 720-2127 Brent Chittenden – Oats, Rye, Wheat .............................................................................................. (202) 720-8068 Angie Considine – Cotton, Cotton Ginnings, Sorghum ................................................................... (202) 720-5944 Tony Dahlman – Crop Weather, Barley ........................................................................................... (202) 720-7621 Chris Hawthorn – Corn, Flaxseed, Proso Millet .............................................................................. (202) 720-9526 James Johanson – County Estimates, Hay ....................................................................................... (202) 690-8533 Anthony Prillaman – Peanuts, Rice.................................................................................................. (202) 720-2127 Travis Thorson – Soybeans, Sunflower, Other Oilseeds .................................................................. (202) 720-7369 6 Rice Stocks (October 2014) USDA, National Agricultural Statistics Service Access to NASS Reports For your convenience, you may access NASS reports and products the following ways: All reports are available electronically, at no cost, on the NASS web site: http://www.nass.usda.gov Both national and state specific reports are available via a free e-mail subscription. To set-up this free subscription, visit http://www.nass.usda.gov and in the “Follow NASS” box under “Receive reports by Email,” click on “National” or “State” to select the reports you would like to receive. For more information on NASS surveys and reports, call the NASS Agricultural Statistics Hotline at (800) 727-9540, 7:30 a.m. to 4:00 p.m. ET, or e-mail: [email protected]. The U.S. Department of Agriculture (USDA) prohibits discrimination against its customers, employees, and applicants for employment on the basis of race, color, national origin, age, disability, sex, gender identity, religion, reprisal, and where applicable, political beliefs, marital status, familial or parental status, sexual orientation, or all or part of an individual's income is derived from any public assistance program, or protected genetic information in employment or in any program or activity conducted or funded by the Department. (Not all prohibited bases will apply to all programs and/or employment activities.) If you wish to file a Civil Rights program complaint of discrimination, complete the USDA Program Discrimination Complaint Form (PDF), found online at http://www.ascr.usda.gov/complaint_filing_cust.html, or at any USDA office, or call (866) 632-9992 to request the form. You may also write a letter containing all of the information requested in the form. Send your completed complaint form or letter to us by mail at U.S. Department of Agriculture, Director, Office of Adjudication, 1400 Independence Avenue, S.W., Washington, D.C. 20250-9410, by fax (202) 690-7442 or email at [email protected].


© Copyright 2026