
2014-2015 Curriculum Blueprint ... Unit 4: Relationships that are not linear Approximate Time:
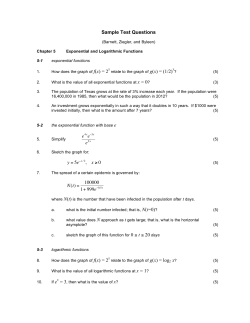
2014-2015 Curriculum Blueprint
Grade: 9-12
Course: Algebra 1B
Approximate Time:
40 days
Unit 4: Relationships that are not linear
Learning Goal
Unit Overview
The student will graph, transform, compose, and identify properties of nonStudents will compare and contrast properties of various non-linear functions using tables, graphs, algebraic
linear functions both by hand and through using graphing technology. They will methods and verbal descriptions. They will analyze non-linear relationships and write functions to describe a nonanalyze non-linear graphs and use non-linear functions to explain real world
linear relationship between two quantities. They will compose functions from real world situations.
situations.
Essential Question(s)
How can non-linear functions be transformed?
How does a non-linear function compare to its parent function?
Focus Standards
Vertical Progression:
Bullets are the deconstructed standards These should be used to develop concise http://www.turnonccmath.net/ K-8 Learning Trajectories (This could be used to determine remediation needs or
learning statements/daily objectives/scales. Standards below are not intended to enrichment opportunities)
be followed in the order they are listed. See unit sequence for intended order.
Algebra I Test Item Specifications
8th Grade – Students worked with linear functions.
MAFS.912.A-APR.2.3 : (DOK 1)
Identify zeroes of polynomials when suitable factorizations are available, and
use the zeroes to construct a rough graph of the function defined by the
polynomial.
• Factor polynomials using any available method.
• Use the x-intercepts of a polynomial function and the x-y table to construct
a rough graph of the function.
Algebra 2 – This course will review the basic introduction of these same functions. Then it will take each of these
functions to a more advanced level. Algebra 2 will go in depth on exponential and logarithmic functions.
Unit Sequence
Be selective in choosing problems aligned to the standards
within each lesson. The unit sequence below is the
recommended order to follow.
MAFS.912.A- REI.4.11 : (DOK 2)
Explain why the x-coordinates of the points where the graphs of the equations y For each function type listed below use Unit Sequence A-D:
1) Absolute value functions (intro to Piecewise= f(x) and y = g(x) intersect are the solutions of the equation f(x) = g(x); find the
defined functions)
solutions approximately, e.g., using technology to graph the functions, make
2) Square root and cube root functions
tables of values, or find successive approximations. Include cases where f(x)
3) Piecewise-defined functions
and/or g(x) are linear, polynomial, rational, absolute value, exponential, and
4) Step functions
logarithmic functions.
5) Polynomial functions
• Recognize that if (x₁, y₁) and (x₂, y₂) share the same location in the
6) Exponential functions
coordinate plane that x₁ = x₂ and y₁ = y₂.
7) Logarithmic functions
• Recognize that f(x) = g(x) means that there may be particular inputs of f
8) Trigonometric functions
and g for which the outputs of f and g are equal.
• Recognize and use function notation to represent linear, polynomial,
A. Graph and transform non-linear functions and
rational, absolute value, exponential, and logarithmic equations.
describe key features of the graph. *Polynomial,
• Explain why the x-coordinates of the points where the graph of the
Exponential, Logarithmic, and Trigonometric functions
equations y = f(x) and y = g(x) intersect are the solutions of the equations
need only be graphed using graphing technology.
f(x) = g(x).
•
High School Flip Book on CCSSM – counter pages
• Approximate/find the solution(s) using an appropriate method. For
117-120
example, using technology to graph the functions, make tables of values or
•
Engage NY – Module 5, Lesson 1
find successive approximations.
B.
Identify the effect on the graph of replacing f(x) by f(x)
Essential Vocabulary
•
•
•
•
•
•
•
•
•
•
•
•
•
Amplitude
Asymptote
Logarithmic function
Midline
Phase shift
Piecewise-defined function
Trigonometric function
Higher Order Questions/Stems
What is the relationship between________ and
________?
How would you represent_______?
What would happen if….
Writing Connections
Write a contextual problem that the equation could
represent.
Write to explain your visual representation
Write to explain the short cut and justify why it
works.
2014-2015 Curriculum Blueprint
Grade: 9-12
Course: Algebra 1B
Approximate Time:
40 days
Unit 4: Relationships that are not linear
MAFS.912.F-BF.2.3 : (DOK 2)
Identify the effect on the graph of replacing f(x) by f(x) + k, k f(x), f(kx), and f(x +
k) for specific values of k (both positive and negative); find the value of k given
the graphs. Experiment with cases and illustrate an explanation of the effects on
the graph using technology. Include recognizing even and odd functions from
their graphs and algebraic expressions for them.
• Given a single transformation on a symbolic or graphic function, identify
the effect on the graph.
C.
• Using technology, identify effects of single transformations on graphs of
functions.
• Graph a given function by replacing f(x) by f(x) + k, k f(x), f(kx), and f(x+ k)
for specific values of k (both positive and negative).
• Describe the differences and similarities between a parent function and the
transformed function.
D.
• Find the value of k, given the graphs of a parent function, f(x), and the
transformed function: f(x) + k, k f(x), f(kx), or f(x + k).
• Recognize even and odd functions from their graphs and equations.
• Experiment with cases and illustrate an explanation of the effects on the
graph, using technology.
MAFS.912.F-IF.2.4: (DOK 2)
For a function that models a relationship between two quantities, interpret key
features of graphs and tables in terms of the quantities, and sketch graphs
showing key features given a verbal description of the relationship. Key features
include: intercepts; intervals where the function is increasing, decreasing,
positive, or negative; relative maximums and minimums; symmetries; end
behavior; and periodicity.
• Define and recognize the key features in tables and graphs of linear and
exponential functions: intercepts; intervals where the function is
increasing, decreasing, positive, or negative, and end behavior.
• Interpret key features of graphs and tables of functions in the terms of the
contextual quantities each function represents.
• Sketch graphs showing the key features of a function, modeling a
relationship between two quantities, given a verbal description of the
relationship.
MAFS.912.F-IF.3.7: a, b, c, e (DOK 2)
Graph functions expressed symbolically and show key features of the graph, by
hand in simple cases and using technology for more complicated cases.
a. Graph linear and quadratic functions and show intercepts, maxima, and
minima.
• Graph linear functions by hand in simple cases or using technology for more
complicated cases and show/label intercepts of the graph.
+ k, k f(x), f(kx), and f(x + k) for specific values of k and
describe the differences and similarities between a
parent function and the transformed function
•
High School Flip Book on CCSSM – counter pages
129-130
•
Edmodo C2 Ready Algebra 1 Group – Day 1
PowerPoint (Transformations)
Recognize even/odd functions and determine the end
behavior;
•
High School Flip Book on CCSSM – counter pages
129
•
Edmodo C2 Ready Algebra 1 Group – Additional
non-linear content
Compare properties of various non-linear functions
each represented in a different way (algebraically,
graphically, numerically in tables, or by verbal
descriptions)
•
High School Flip Book on CCSSM – counter pages
121-122
•
Engage NY – Module 5, Lesson 2
Construct models to represent linear, quadratic, and
exponential data – including cube root, square root,
piecewise defined, step, and absolute value functions
•
Holt Larson – Algebra 1 – Lesson 10.8
Find an approximate solution to a system of equations using
a graphing tool or table of values (equations should include
linear, quadratic, exponential, polynomial, rational, absolute
value, and logarithmic)
Supplemental Resources
Math Formative Assessment System (MFAS)
These formative assessments could be used before
instructing a lesson on similar content to help formulate
small groups or they may be used however PLCs see best
for their students. Each formative assessment comes with a
rubric and instructional implications based on the level of
student understanding.
Writing Template Tasks These template tasks are
designed from the Mathematical Practice Standards.
When filled in, these templates become teaching tasks
that create opportunities for teaching literacy skills in
mathematics.
Link to Problem Solving Rubric
Link to Webb’s DOK Guide
2014-2015 Curriculum Blueprint
Grade: 9-12
Course: Algebra 1B
Approximate Time:
40 days
Unit 4: Relationships that are not linear
• Determine the differences between simple and complicated linear,
exponential and quadratic functions and know when the use of technology Teaching Channel Video Improving Participation with Talk
Moves
is appropriate.
b. Graph square root, cube root, and piecewise-defined functions, including step
functions and absolute value functions.
• Graph square root, cube root, and piecewise-defined functions, including
step functions and absolute value functions, by hand in simple cases or
using technology for more complicated cases, and show/label key features
of the graph.
• Determine the difference between simple and complicated linear,
quadratic, square root, cube root, and piecewise-defined functions
including step functions and absolute value functions and know when the
use of technology is appropriate.
• Compare and contrast absolute value, step- and piecewise-defined
functions with linear, quadratic, and exponential functions.
• Compare and contrast the domain and range of absolute value, step- and
piecewise-defined functions with linear, quadratic, and exponential
function.
• Analyze the difference between simple and complicated linear, quadratic,
square root, cube root, piecewise-defined, exponential, logarithmic, and
trigonometric functions, including step and absolute value functions.
• Select the appropriate type of function, taking into consideration the key
features, domain, and range, to model a real-world situation.
c. Graph polynomial functions, identifying zeroes when suitable factorizations
are available, and showing end behavior.
• Graph polynomial functions, by hand in simple cases or using technology
for more complicated cases, and show/label maxima and minima of the
graph, identify zeroes when suitable factorizations are available, and show
end behavior.
• Determine the difference between simple and complicated polynomial
functions.
• Relate the relationship between zeroes of quadratic functions and their
factored forms to the relationship between polynomial functions of degrees
greater than two.
e. Graph exponential and logarithmic functions, showing intercepts and end
behavior, and trigonometric functions, showing period, midline, and
amplitude,
and using phase shift.
• Graph exponential functions, by hand in simple cases or using technology for
more complicated cases, and show intercepts and end behavior.
• Graph exponential, logarithmic, and trigonometric functions, by hand in
simple cases or using technology for more complicated cases. For
exponential and logarithmic functions, show: intercepts and end behavior;
for trigonometric functions, show: period, midline, and amplitude.
2014-2015 Curriculum Blueprint
Grade: 9-12
Course: Algebra 1B
Approximate Time:
40 days
Unit 4: Relationships that are not linear
• Determine the differences between simple and complicated linear and
exponential functions and know when the use of technology is appropriate.
• Compare and contrast the domain and range of exponential, logarithmic, and
trigonometric functions with linear, quadratic, absolute value, step- and
piecewise-defined functions.
• Analyze the difference between simple and complicated linear, quadratic,
square root, cube root, piecewise-defined, exponential, logarithmic, and
trigonometric functions, including step and absolute value functions.
• Select the appropriate type of function, taking into consideration the key
features, domain, and range, to model a real-world situation.
MAFS.912.F-IF.3.9 : (DOK 2)
Compare properties of two functions each represented in a different way
(algebraically, graphically, numerically in tables, or by verbal descriptions). For
example, given a graph of one quadratic function and an algebraic expression
for another, say which has the larger maximum.
• Identify types of functions based on verbal, numerical, algebraic, and
graphical descriptions and state key properties.
• Differentiate between exponential and linear functions using a variety of
descriptors (graphical, verbal, numerical, and algebraic).
• Differentiate between two types of functions using a variety of descriptors
(graphical, verbal, numerical, algebraic).
• Use a variety of function representations (algebraic, graphical, numerical in
tables, or by verbal descriptions) to compare and contrast properties of
two functions.
MAFS.912.F-LE.1.3 : (DOK 2)
Observe using graphs and tables that a quantity increasing exponentially
eventually exceeds a quantity increasing linearly, quadratically, or (more
generally) as a polynomial function.
• Fluently compute growth rates for linear, exponential, and quadratic
functions.
• Compare tables and graphs of exponential and other polynomial functions
to observe that a quantity, increasing exponentially, exceeds all others to
solve mathematical and real-world problems.
Mathematical Practice Standards
Link to Mathematical Practice Standards Rubric
MAFS.K12.MP.1.1: Reason abstractly and quantitatively.
MAFS.K12.MP.5.1: Use appropriate tools strategically
MAFS.K12.MP.6.1: Attend to precision.
2014-2015 Curriculum Blueprint
Grade: 9-12
Course: Algebra 1B
Approximate Time:
40 days
Unit 4: Relationships that are not linear
.


© Copyright 2026