
11 Egypt, Morocco, and the United States
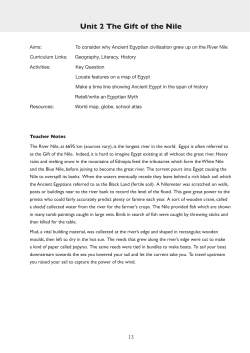
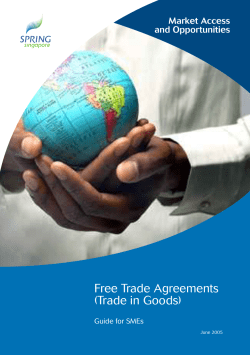
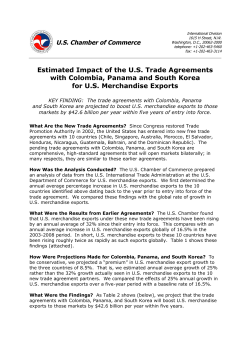
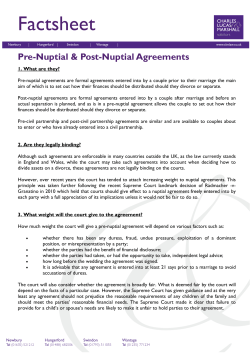
11
Egypt, Morocco, and the United States
AHMED GALAL AND ROBERT Z. LAWRENCE
The political importance of the Middle East to the United States is evident
from the willingness of the United States to wage a war in Iraq, the political capital some US administrations have invested in resolving the Palestinian-Israeli conflict, and the amount of aid extended to such countries as
Egypt and Israel. It is not surprising, therefore, that political rather than
economic considerations have driven US free trade agreements (FTAs) in
the Middle East. This is true of the agreements that the United States has
already implemented (with Israel and Jordan), as well as agreements that
are being contemplated with other countries in the region and with the region as a whole. Indeed, it can be argued that FTAs between the United
States and Middle Eastern countries are fundamentally about potentially
large political (and consequently economic) gains for the United States,
while the potential gains to the countries themselves are mostly economic
in nature (and consequently political).1
Nonetheless, it is risky, even for the United States, to focus on politics
alone. The history of the Middle East, like that of many other regions, is
replete with failed regional economic integration initiatives that were
purely politically motivated and not supported by the necessary economic measures. In the long run, not only did these initiatives fail to proAhmed Galal is executive director and director of research for the Egyptian Center for Economic Studies (ECES) in Cairo and Robert Z. Lawrence is a senior fellow at the Institute for International Economics. They are the authors of Building Bridges: An Egypt-US Free Trade Agreement (Brookings Institution Press, 1998).
1. See Gresser (2003) for the case that freer trade would support the war against terror.
299
Institute for International Economics | www.iie.com
vide economic benefits, but their failures ultimately led to disillusion, disappointment, and a loss of credibility that inflicted political damage as
well. Exacerbating this problem is the tendency over time for people to
take the political gains for granted; to offset these, increasing economic
benefits are required.
Thus, even those interested in the political benefits of FTAs must appraise their economic basis. The key questions relate to the (static) benefits that result from trade creation, the losses from trade diversion, and the
dynamic benefits that result if the agreement stimulates productivity
growth and investment, enhances policy credibility, and reinforces domestic economic reforms and institutional development. The answers to
these questions will depend heavily on the form these agreements take
and on the other policies that accompany them. Of particular importance
is whether the agreements focus simply on border barriers (shallow integration) or include investment, services, and other rules and institutions
(deeper integration); whether the agreements are seen as sufficient in
themselves or are used to leverage domestic economic reforms. Moreover,
even if the net benefits are positive, a crucial issue is whether they detract
from or complement multilateral liberalization that could be even more
beneficial.
An appraisal of FTAs between the United States and Egypt and the
United States and Morocco is also timely. In a commencement address at
the University of South Carolina on May 9, 2003, President George W.
Bush proposed “the establishment of a US–Middle East free trade area
within a decade.” US Trade Representative Robert Zoellick amplified the
point in remarks before the World Economic Forum meeting in Jordan on
June 23, 2003, describing the regional FTA with the United States as representing a goal that will be achieved by a series of cumulative measures
that include (1) actively supporting World Trade Organization (WTO)
membership of “peaceful countries that seek it,” (2) increased use of the
Generalized System of Preferences (GSP), (3) negotiation of trade and investment facilitation agreements (TIFAs) that often precede FTAs, (4) bilateral investment treaties (BITs), (5) bilateral FTAs such as those currently
being negotiated with Morocco and planned with Bahrain, (6) the extension of these agreements to include neighboring countries, and, (7) ultimately, their extension to the whole region.
At the time of this writing, the United States has not announced negotiations for an FTA with Egypt, but Egypt is often mentioned as a potential FTA candidate. Accordingly, the first section of this chapter considers
some key economic and political characteristics of Egypt as a potential
FTA partner. The next section considers the likely impact of an Egypt-US
FTA. The United States and Morocco have already begun negotiations for
a free trade agreement. The final sections of the chapter mirror the Egyptian analysis with a similar discussion of Morocco as a partner and of the
300
FREE TRADE AGREEMENTS
Institute for International Economics | www.iie.com
likely economic impact of a US-Morocco FTA. Some brief conclusions and
comparisons are then provided.
Egypt as a Potential Partner
If the United States were to select its FTA partners based on relative political importance in their regions, Egypt would arguably top the list among
Arab states. If the selection criteria were derived from the potential of
boosting economic reforms in partner countries with ample demonstration effects as a reform model, Egypt would undoubtedly qualify. And if
the choice were based on the potential of the partner country to take full
advantage of an agreement, Egypt seems reasonably well positioned, assuming that the FTA is accompanied by further domestic reforms and additional trade liberalization. Below is a brief discussion of what makes
Egypt a viable political and economic FTA partner to the United States.
Key Political Characteristics
Egypt is the largest Arab country, with 66 million inhabitants, or 23 percent of the regional population. It has played a key role in shaping the politics of the region in recent decades. Most notably, Egypt has hosted the
Arab League since its inception in 1945, led the region’s efforts toward
resolving the Palestinian-Israeli conflict, and began fighting Islamic extremists decades before September 11. Although the process is incomplete, Egypt has been undergoing a democratic transition over the past
couple of decades. Changes have included adopting a multiparty system,
increasing the freedom of the press, and strengthening the role of civil society. Egypt has also been a cultural hub for Arab countries, providing
most of the movies, books, and TV programs produced in Arabic. Furthermore, some 2 million Egyptians are currently working in neighboring
countries in various professions.
For these reasons, Egypt came to be seen by many of its neighbors as a
country to emulate. Over the past half century, Egypt led the liberation
movement from colonial powers, offered the region a vision of Pan-Arabism and Arab socialism, and more recently embraced a model of gradual
political and economic liberalization. That many Arab countries adopted
similar ideas after Egypt did lends credence to the view that Egypt’s influence extends beyond its borders. Accordingly, support given to the
reform movement in Egypt through various measures, including a welldesigned FTA with the United States, could lead to a positive demonstration effect throughout the region.
EGYPT, MOROCCO, AND THE UNITED STATES
Institute for International Economics | www.iie.com
301
Key Economic Characteristics
Although Egypt is a developing country with a per capita income of
about $1,530, its economy is diversified; industry and mining account for
33 percent of GDP, agriculture for 16 percent, and services for 50 percent.
Egypt is also reasonably well endowed with relatively cheap and skilled
labor, abundant historical sites and other tourism attractions, and moderate natural resources (oil and natural gas). Water is available from the
Nile. These characteristics suggest that Egypt could take advantage of
more open markets abroad, provided domestic policies are aligned to promote exports.
As a destination for imports and a potential location for foreign direct
investment (FDI), Egypt offers a relatively large market. The size of that
market depends not only on its large population and a GDP of about $100
billion, but more significantly on the proximity of Egypt to Europe (with
which Egypt has concluded an industrial tariff-free pact) and its central
location in the Arab world (among countries with which Egypt is also an
FTA partner). With an enlarged market, Egypt has the potential to serve
as an export base for FDI in industries with substantial economies of scale.
Current State of Reform
Comparative advantage can be stifled, however, by policy-induced distortions. In this regard, Egypt has made significant progress on policy in
recent years, although the reform process remains incomplete. It partially
departed from its inward-looking and state-led development strategy,
which had lasted for decades, in 1974. However, the real shift to a marketbased and private-sector-led strategy came in 1991, when Egypt initiated
far-reaching reforms in the tradition of the Washington Consensus. One
consequence of these reforms is that the private sector now accounts for
70 percent of total investment and 73 percent of GDP, compared with 41
percent and 62 percent, respectively, in 1990–91.
Several studies have assessed the stabilization program of the 1990s,
concluding that it was one of the most successful in the developing world
(e.g., Subramanian 1997). The program included the unification and devaluation of the Egyptian pound, financial-sector and capital account liberalization, and a drastic reduction in the fiscal deficit (from 20 percent
in 1990–91 to 1 percent in 1997–98).2 Inflation came down to a single digit,
and the economy grew at an average rate of 5 percent for most of the 1990s.
2. For other measures of structural change, see Dasgupta, Keller, and Srinivasan (2002).
302
FREE TRADE AGREEMENTS
Institute for International Economics | www.iie.com
The estimated stabilization reform index3 (given in figure 11.1) shows that
Egypt not only has caught up with several reforming countries in the region but also fares well in comparison to other developing countries.
Structural reforms were also initiated in the early 1990s, but this effort remains work in progress. The reforms included trade liberalization, privatization of state-owned enterprises, and various improvements in the business environment. The trade liberalization effort is elaborated below. The
cumulative proceeds from privatization amounted to 4.7 percent of GDP
in 2001. As for the business environment, investment laws were changed to
allow foreign participation without restrictions, protect ownership rights,
and guarantee repatriation of profits. A stronger intellectual property
rights law has also been passed, along with a money-laundering law. More
recently, the parliament approved a new labor law that accords firms
greater flexibility in return for workers’ right to strike and engage in collective bargaining. In addition, a new income tax law, about to be submitted to parliament, will reduce the corporate tax rate to 30 percent. At the
sectoral level, reforms were carried out in telecommunications and electricity to encourage private-sector participation, to increase competition
where possible, and to regulate the monopolistic segments of the market.4
Notwithstanding these reforms, the estimated structural reform index5
(shown in figure 11.2) indicates that Egypt lags behind a sample of MENA
(Middle East and North Africa) countries as well as other developing
countries. Furthermore, the reform process has slowed down in recent
years. An FTA with the United States could boost economic reform and
3. The index is a composite of current account balance, fiscal balance, inflation rate, and exchange rate premium. The four elements are given equal weights. All data are normalized
using the formula
Xjt = (W – Vjt)
(W – B)
where
Xjt
Vjt
B
W
is the normalization value j for year t.
is the value of variable for country j in year t.
is the best value for all countries and all years.
is the worst value of all countries and years.
4. The private sector was awarded two licenses to provide mobile phone services, and a new
telecommunications law was passed in 2002.
5. This index is a composite of trade policy (measured by unweighted average tariffs), tax
policy (measured by highest marginal corporate and individual tax rates), exchange rate
overvaluation (measured by deviation from purchasing power parity), and privatization
(measured by cumulative privatization proceeds as share of GDP). The four elements are
given equal weight, with the weight for the tax policy equally divided between individual
and corporate tax rates. All data are normalized using the formula in footnote 3.
EGYPT, MOROCCO, AND THE UNITED STATES
Institute for International Economics | www.iie.com
303
Figure 11.1 Economic stabilization in Egypt versus different regions
Egypt vs. MENA: Inflation
Egypt vs. MENA: Current account
percent
1.0
percent
1.000
MENA
0.999
0.8
Egypt
Egypt
0.998
0.6
0.4
0.997
MENA
0.996
0.2
0.995
1990
1992
1994
1996
1998
2000
1994
1996
1998
2000
percent
1.0
MENA
0.9
Egypt
0.8
0.6
MENA
0.7
0.4
Egypt
0.6
0.2
0.5
0.0
1990
1992
1994
1996
1998
2000
0.4
1990 1991 1992 1993 1996 1997 1998 1999
Egypt vs. MENA:
Overall stabilization index
Egypt vs. other regions:
Overall stabilization index
percent
0.9
percent
0.9
Egypt
0.8
0.7
1992
Egypt vs. MENA:
Exchange rate premium
Egypt vs. MENA: Fiscal balance
percent
1.0
0.8
0.0
1990
Egypt
0.8
East Asia
and Pacific
MENA
0.7
Latin America
0.6
0.6
0.5
0.4
1990 1991 1992 1993 1996 1997 1998 1999
South Asia
0.5
1990 1991 1992 1993 1996 1997 1998 1999
Note: MENA includes Egypt, Jordan, Morocco, and Tunisia. Latin America includes Argentina,
Bolivia, Brazil, Chile, Colombia, Mexico, Peru, and Venezuela. South Asia includes India
and Pakistan. East Asia and Pacific includes China, Indonesia, Korea, Malaysia, the
Philippines, and Thailand.
304
FREE TRADE AGREEMENTS
Institute for International Economics | www.iie.com
Figure 11.2 Structural reform in Egypt versus different regions
Egypt vs. MENA: Privatization
percent
0.4
Egypt vs. MENA: Taxation
percent
0.6
0.3
MENA
0.4
Egypt
Egypt
0.2
MENA
0.2
0.1
0.0
0.0
1990 1991 1992 1993 1994 1995 1996 1997 1998 1999
1990 19911992 1993 1994 1995 1996 1997 1998 1999
Egypt vs. MENA: Exchange rate
percent
1.0
Egypt vs. MENA: Trade policy
percent
1.0
Egypt
0.8
0.8
MENA
0.6
MENA
0.6
Egypt
0.4
0.4
0.2
0.2
1990 1991 1992 1993 1994 1995 1996 1997 1998 1999
1990 19911992 1993 1994 1995 1996 1997 1998 1999
Egypt vs. MENA:
Overall structural reform index
percent
0.6
0.5
0.4
Egypt vs. other regions:
Overall stabilization reform index
percent
0.7
0.6
MENA
Egypt
0.5
0.3
Latin America
Egypt
East Asia
and Pacific
0.4
0.2
0.3
0.1
0.0
South Asia
0.2
1990 1991 1992 1993 1994 1995 1996 1997 1998 1999
1990 1991 1992 1993 1994 1995 1996 1997 1998 1999
Note: MENA includes Egypt, Jordan, Morocco, and Tunisia. Latin America includes Argentina,
Bolivia, Brazil, Chile, Colombia, Mexico, Peru, and Venezuela. South Asia includes India
and Pakistan. East Asia and Pacific includes China, Indonesia, Korea, Malaysia, the
Philippines, and Thailand.
EGYPT, MOROCCO, AND THE UNITED STATES
Institute for International Economics | www.iie.com
305
enable the Egyptian economy to attract FDI, improve efficiency, and generate much-needed productive jobs for a growing labor force.
Trade Patterns and Policies
Egypt’s trade deficit averaged 10 percent of GDP over the past three
years. This deficit was financed mainly by revenues from tourism, workers’ remittances, and the Suez Canal. Exports averaged about 6.6 percent
of GDP over the period between 1996–97 and 2001–02. The European
Union and the United States are Egypt’s most important trading partners.
During 1990–91 to 2000–01, the European Union and the United States
averaged 39 and 23 percent of Egypt’s imports, and 33 and 31 percent of
its total exports, respectively. Currently both the European Union and the
United States are subject to the same Egyptian tariff rates. However,
Egypt has signed an association agreement with the European Union that
will eliminate tariffs on EU exports within 12 years. Unless a similar
agreement is reached with the United States, US exports will be seriously
disadvantaged.
The modest export performance in Egypt is due to the prevailing incentive structure, which makes it more profitable for producers to sell at
home rather than abroad. According to a recent study (Galal and Fawzy
2001), the bias stems from lack of competitiveness of the exchange rate,
relatively high tariff rates on imports, high corporate taxation, and low efficiency of trade logistics.
In recent years, there have been significant trade reforms. Most notably:
Nominal and effective protection. Maximum tariff rates were reduced
successively from 70 percent in 1994 to 43 percent in 2002, excluding
alcoholic beverages, cars, whole poultry, textiles, and clothing (Refaat
2003). As a result, both nominal and effective rates of protection came
down (table 11.1). The dispersion rates also fell during the same period, albeit modestly.
Nontariff barriers to trade. The import ban list that covered 210 items in
1990 currently includes only poultry parts and some textile products.
The ban on ready-made garments was replaced in 2002 by specific
tariffs, which translate into an average ad valorem equivalent of 627
percent. Egypt also adopted the World Trade Organization (WTO)
agreement on customs valuation in July 2001. Reforms of customs administration are under way.
Exchange rate. Egypt unified, devalued, and kept fixed the exchange
rate in 1991 to curb inflation and increase the competitiveness of Egyptian exports. The fixed regime was abandoned in favor of an interme-
306
FREE TRADE AGREEMENTS
Institute for International Economics | www.iie.com
Table 11.1
Levels of protection in the Egyptian economy, 1994–2002
Nominal protection
(percent)
Sector
Effective protectiona
(percent)
1994
2002
1994
2002
Economywide protectionb
Average protection
Dispersion
22.0
13.3
18.9
11.1
23.3
16.6
18.5
14.7
Protection by economic sector
Agriculture
Mining and quarrying
Crude oil
Industry
Food industries
Textiles
Clothes and leather footwear
Wood and wood products
Paper and printing
Leather and leather products
Rubber products
Chemical industries
Basic metal industries
Nonmetal industries
Mining and extraction
Transport devices
8.3
9.4
14.3
25.1
8.8
34.5
68.9
12.5
16.7
44.4
35.8
11.4
19.9
25.4
19.9
46.7
7.6
7.2
14.3
21.4
7.9
32.9
516.6
12.7
15.6
37.4
28.3
10.7
15.3
20.2
15.1
39.3
7.9
7.4
13.0
27.1
6.6
40.4
81.1
11.5
15.9
52.3
39.5
9.6
21.0
27.9
19.5
53.4
7.2
5.2
11.0
21.4
1.5
38.4
674.1
12.0
15.0
43.6
31.0
6.9
12.0
19.6
11.1
44.6
a. Using input/output tables, 1998–99.
b. The reported averages exclude garments, beverages, and tobacco because of their exceptionally high tariffs.
Source: Refaat (2003).
diate regime in January 2001, but the new regime was never put to the
test. Policy inconsistency gave way to a floating regime in January 2003
(figure 11.3).
Despite these reforms, the Egyptian economy remains more protected
than its competitors’ economies. If Egypt’s commitments under its trade
pacts with the European Union and Arab countries are supplemented by
further commitments under a US FTA, the Egyptian economy will become much more open than it is today.
Impact of an FTA Between the United States and Egypt
The argument made at the outset of this chapter is that the impact of a
prospective FTA between Egypt and the United States ought to be measured against both economic and political objectives, given the nature of
EGYPT, MOROCCO, AND THE UNITED STATES
Institute for International Economics | www.iie.com
307
Figure 11.3 Nominal and real exchange rate indices in Egypt,
1991–2003
1995 = 100
120
Nominal
80
Real
40
0
1991 1992 1993 1994 1995 1996 1997 1998 1999 2000 2001 Oct. Feb.
2002 2003
Note: Nominal and real exchange rates are expressed in terms of US dollars per Egyptian
pound. Increases in indices reflect appreciation of the pound.
Sources: IMF, International Financial Statistics, different issues; data from EFG-Hermes; and
authors’ calculations.
the Middle East region and US interests. The starting point for subsequent
analysis is that the interest of the United States in the Middle East revolves around an improved relationship with the Arab world, regional
stability, and a reliable supply of oil, besides the usual economic gains
from trade and investment. Egypt’s interest lies presumably in achieving
higher economic growth and greater capacity for job creation through
trade and investment rather than aid, coupled with additional gains that
will result from resolving the region’s conflicts. A discussion of both dimensions follows, starting with the likely economic impact.
Likely Economic Impact
The expected static economic gains from an FTA between the United
States and Egypt were estimated by Bernard Hoekman, Denise Konan,
and Keith Maskus (1998), Robert Lawrence (1998), and more recently
Dean DeRosa (2003). Hoekman, Konan, and Maskus used a general equilibrium model to estimate the impact of both shallow and deep integration agreements (the results are reported in table 11.2). The analysis took
into account Egypt’s trade pacts with the European Union and Arab coun308
FREE TRADE AGREEMENTS
Institute for International Economics | www.iie.com
Table 11.2
Impact of US FTA on welfare in Egypt and on bilateral
trade flows
Impact on welfare
(percent of GDP)
Trade impacts
Trade creation
(millions of dollars)
Trade diversion
(millions of dollars)
Average weighted tariff
Trade flows (percent growth)a
Exports to European Union
Imports from European Union
Exports to United States
Imports from United States
Exports to Arab countries
Imports from Arab countries
EMA, AFTA,
and no US FTA
EMA, AFTA, and
shallow US FTA
EMA, AFTA,
and deep US FTA
0.99
1.26
1.84
252
342
450
233
4.1
197
2.7
170
2.6
3.2
38.2
–7.0
–14.3
44.4
33.3
2.8
29.3
17.5
21.9
45.8
26.7
31.8
47.3
51.3
38.8
41.4
29.4
EMA = Euro-Mediterranean Agreement
AFTA = Arab Free Trade Agreement
a. Relative to 1996 base.
Source: Hoekman, Konan, and Maskus (1998).
tries. Drawing on the results of this study, Lawrence estimated the impact
of an agreement on the United States, using partial equilibrium analysis
and information about traded commodities, the prevailing trade barriers
in 1996, and an import elasticity of 2.0 to 3.0. Finally, DeRosa estimated
the impact of an FTA between the United States and Egypt, using a gravity model that estimates the typical impact of an FTA on bilateral trade.
The main results of these studies are discussed below.
According to Hoekman, Konan, and Maskus (1998), the expected static economic gains to Egypt from an FTA with the United States are
positive but small in absolute terms. A shallow FTA involving the
elimination of barriers to trade on the border would expand net trade
(trade creation minus trade diversion) by $145 million in 1996 prices.
A deep FTA would expand net trade by $280 million in 1996 prices.
Deep integration produces better results because it entails increased
efficiency and better allocation of resources due to increased competition, lower cost of services, and lower transaction costs. DeRosa (2003)
finds larger numbers. His model predicts an increase of Egyptian exports to the United States from $895 million to $1,953 million, an increase of $1 billion or 118 percent.
For the United States, the expected static economic gains are larger in
absolute terms than the expected gains for Egypt, but these gains are
EGYPT, MOROCCO, AND THE UNITED STATES
Institute for International Economics | www.iie.com
309
very modest relative to the US economy. According to Hoekman,
Konan, and Maskus (1998), the increase in US exports to Egypt is expected to be 21.9 percent under a shallow FTA, and 38.8 percent under
a deep FTA (table 11.2). Furthermore, Lawrence (1998) finds that an
FTA with Egypt would cause a modest increase in employment in the
United States because of trade expansion. DeRosa (2003) again finds a
much larger impact. His model predicts an increase in US exports to
Egypt from $3,729 million to $8,135 million.
Without an FTA agreement, both Egypt and the United States are expected to be worse off. According to Hoekman, Konan, and Maskus
(1998), the Egyptian economy would suffer from trade diversion as a
result of the agreements with the European Union and Arab countries.
For the United States, the “opportunity cost” would be in the neighborhood of $1.5 billion. To the extent that current US aid to Egypt
(about $2 billion a year) is tied to imports from the United States, phasing out economic aid will further diminish US exports to Egypt.
DeRosa’s estimates (2003) are probably exaggerated for both Egypt and
the United States. Egyptian exporters currently face relatively low barriers to enter US markets, outside of textiles and apparel (table 11.3). But the
abolition of quotas on imports of textiles and clothing in 2005 mandated
by WTO obligations will increase the competition facing Egyptian products in the United States from low-cost developing countries and countries enjoying preferential US treatment. With respect to the United States,
the removal of trade barriers in Egypt, which currently average 18 percent
(table 11.4), is likely to increase US exports to Egypt. But US exporters will
also face greater competition from the European Union over the next 12
years, as Egyptian tariffs are gradually reduced to conform with the EuroMed Agreement (EMA).
By the same token, the estimates of Hoekman, Konan, and Maskus
(1998) are probably too low. They start from a low level of Egyptian exports for reasons that are at least in part related to the prevailing disincentives for Egyptian producers wishing to export. If Egypt adopts reforms to increase the competitiveness of its producers and to improve
incentives to export, Egyptian exports are expected to increase. Greater
access to the US market through an FTA would offer an outlet for this increase in exports by more than the mere removal of trade barriers in the
United States would suggest.
Moreover, if the Egypt-US FTA is structured along the lines of the North
American Free Trade Agreement (NAFTA), further dynamic gains can accrue to Egypt. Domestic reforms would improve both resource allocation
and productivity. In addition, the agreement could help to mobilize capital inflows from the United States and elsewhere to Egypt. Currently the
level of FDI inflow to Egypt is very modest, amounting to about $277 mil310
FREE TRADE AGREEMENTS
Institute for International Economics | www.iie.com
Table 11.3
HS
code
62
61
27
31
52
57
98
63
72
94
97
29
28
20
12
82
09
25
99
73
84
17
07
33
54
39
95
68
49
60
19
70
Egyptian exports to the US and bound tariff rates
in the US market by 2-digit Harmonized System
classification
Category
Average
Bound
exports
tariff
2000–01
rates
(millions of dollars) (percent)
Articles of apparel and clothing accessories,
not knitted
Articles of apparel and clothing accessories, knitted
Mineral fuels and oils and products of distillation
Fertilizers
Cotton, yarns, and woven fabrics
Carpets and other textile floor coverings
Special-classification provisions
Made-up textile articles
Iron and steel
Furniture; bedding, cushions, etc.
Works of art, collectors’ pieces, and antiques
Organic chemicals
Inorganic chemicals
Preparations of vegetables, fruit, nuts
Oil seeds and oleaginous fruits
Tools, cutlery, spoons of base metal; parts
Coffee, tea, maté, and spices
Salt, sulfur, earths and stone, plastering materials
Special import-reporting provisions
Articles of iron or steel
Nuclear reactors, boilers, and parts
Sugars and sugar confectionery
Edible vegetables and certain roots and tubers
Essential oils, perfumery, cosmetic preparations
Manmade filaments, yarns, and woven fabrics
Plastics and articles
Toys, games, and sports equipment; parts
Articles of stone, plaster, cement, asbestos
Printed books and other printed products
Knitted or crocheted fabrics
Preparations of cereals, flour, starch, or milk
Glass and glassware
Others
249.6
147.0
142.7
36.9
53.0
45.1
65.2
25.3
17.2
24.1
14.9
5.7
3.3
5.5
4.9
4.4
3.1
2.8
2.9
3.0
2.7
3.2
1.9
1.8
1.9
1.5
1.3
1.6
0.8
2.1
0.5
1.1
11.9
10.0
11.5
0.5
0.0
7.9
2.9
Total exports/average tariffs (unweighted/weighted)
888.2
3.5/5.9
6.2
0.3
1.9
0.0
3.3
2.2
7.4
1.3
3.5
0.03
0.2
1.2
1.3
2.3
2.4
1.6
9.7
4.4
1.4
1.3
0.0
9.9
4.3
4.6
Sources: Institute for International Economics FTA Project database; OECD (2000).
lion in 2000–01. The association between FDI and deep FTAs was seen in
Mexico, where NAFTA stimulated a large amount of FDI. To be sure, although Egypt does not enjoy Mexico’s geographic advantages, a similar
increase in FDI could occur in Egypt if it becomes more attractive to foreign investors. With increased FDI, the Egyptian economy could benefit
from the transfer of modern technical and managerial techniques, as well
as market access. For the US investors, Egypt could offer access to cheap
labor and an attractive location.
EGYPT, MOROCCO, AND THE UNITED STATES
Institute for International Economics | www.iie.com
311
Table 11.4
Egyptian imports from the US and applied tariffs in
Egypt by 2-digit Harmonized System classification
HS
code
88
10
84
39
87
85
89
90
23
98
93
12
27
94
55
15
02
29
48
73
47
30
28
38
74
08
32
44
40
83
82
86
Category
Aircraft, spacecraft, and parts
Cereals
Nuclear reactors, boilers and parts
Plastics and articles
Vehicles, other than railway or tramway rolling
stock, and parts
Electrical machinery and equipment and parts
Ships, boats and floating structures
Optical, photographic, cinematographic equipment
and parts
Residues from the food industries; prepared
animal feed
Special-classification provisions
Arms and ammunition and parts
Oil seeds and oleaginous fruits; miscellaneous grains
Mineral fuels, mineral oils and products of their
distillation
Furniture; bedding, cushions, etc.
Manmade staple fibers, including yarns and
woven fabrics
Animal or vegetable fats and oils and their cleavage
products
Meat and edible meat offal
Organic chemicals
Paper and paperboard; articles of paper pulp
Articles of iron or steel
Pulp of wood or other fibrous cellulosic material
Pharmaceutical products
Inorganic chemicals
Miscellaneous chemical products
Copper and articles
Edible fruit and nuts; peel of citrus fruit or melons
Tanning or dyeing extracts; tannins and derivatives
Wood and articles of wood; wood charcoal
Rubber and articles
Miscellaneous articles of base metal
Tools, cutlery, spoons of base metal and parts
Railway or tramway locomotives and parts
Others
Total imports/average tariffs (unweighted/weighted)
Average
imports
2000–01
(millions
of dollars)
Applied
tariff
rates
2002
(percent)
730.9
813.7
425.4
183.9
5.0
1.0
10.9
18.6
222.5
196.5
69.0
40.9
19.0
11.2
92.5
11.9
97.2
80.4
151.5
40.2
8.1
25.9
12.4
47.1
23.8
11.2
35.8
16.4
40.7
25.2
28.0
24.9
23.7
26.4
22.1
18.4
10.2
18.2
6.0
8.1
9.4
9.2
6.1
4.7
5.0
5.3
78.1
14.5
35.1
9.7
24.0
25.0
5.0
8.7
11.8
11.7
17.4
35.2
18.9
21.7
17.2
26.9
16.0
6.7
3,519.3
18.0/11.3
Sources: Institute for International Economics FTA Project database; authors’ calculations
based on Egypt’s applied tariff schedule for 2002.
Political Impact
Unlike the potential economic gains from FTAs, the political ramifications
of an FTA between Egypt and the United States are difficult to identify, let
alone measure accurately. But this difficulty is by no means a convincing
312
FREE TRADE AGREEMENTS
Institute for International Economics | www.iie.com
reason for ignoring such benefits. Below is a brief discussion of the possible political impact of a US-Egypt FTA.
The starting point is the observation that the relationship between the
United States and the Muslim/Arab world has deteriorated in the aftermath of September 11. The perception is widespread in Arab countries—
especially in the wake of the war in Iraq—that the United States is targeting them for the sake of oil. Complicating the picture further is another
widespread perception: that US foreign policy is one-sided in dealing
with the Palestinian-Israeli problem. On the other hand, some in the
United States claim that the discontent does not follow from US policies
toward the region: rather, it grows out of local conditions and the lack of
progress in these countries.
Whatever the roots of the negative perception of the United States in the
region, confidence-building measures are needed on both sides to bring
about better relations and a more peaceful and prosperous Middle East. An
FTA with a country like Egypt could be a step toward achieving this goal.
Clearly, the single act of ratifying an FTA would not by itself change the
image of the United States in the Muslim/Arab world. Nor would it be the
cornerstone on which Egypt’s sustainable growth and prosperity is built.
The most an FTA could do is to demonstrate a US commitment to countries
that are willing to reform their economies. For Egypt, such an agreement
would also help to smooth the transition from aid to trade and bring about
a more sustainable economic relationship between the two countries.
If an FTA with Egypt materializes, along with progress in areas such as
resolving the Palestinian-Israeli conflict and the situation in Iraq, the
gains could be enormous for all parties. One way to judge the size of the
potential gains is to review what actually happened in the past. A more
peaceful and prosperous Middle East might have saved the United States
a war in Iraq. It might have prevented the two oil shocks in the mid-1970s
and early 1980s. Egypt might have avoided several wars since 1948, saving some of the resources allocated to defense and enabling policymakers
to focus their attention on domestic reforms. And if Egypt were doing
even better than it is doing today, other countries in the region would perhaps have followed suit.
Morocco as a Potential Partner
The history of Morocco has been deeply affected by its geographic location at the crossroads between Africa, the Middle East, and Europe.6 The
patterns of Morocco’s international and economic relations today con6. The list of foreigners who have ruled Morocco includes the Phoenicians, Romans, Vandals,
Visigoths, Byzantine Greeks, Arabs, French, and Spanish. This section draws heavily on the
profile of Morocco issued by the US State Department (2002).
EGYPT, MOROCCO, AND THE UNITED STATES
Institute for International Economics | www.iie.com
313
tinue to reflect that physical position. Morocco also has long had a close
relationship with the United States.7 Both countries have, more recently,
shared interests in trying to bring about peace between Israelis and Palestinians, containing Iraqi aggression, and combating terrorism. As befits its
role as a moderate Arab state, Morocco has been active in the search for
peace in the Middle East, encouraging negotiations and urging moderation on both sides.8 Morocco was one of the first Arab states to condemn
Iraq’s invasion of Kuwait, and it sent troops to defend Saudi Arabia and
aid the efforts to repulse Saddam Hussein. Morocco was also vocal in denouncing the attacks of September 11 and it has assisted the United States
in the war against terrorism. However, Morocco has not been supportive
of the recent US war with Iraq.
Several features of Morocco’s international dealings are contentious and
hamper its relations with its neighbors. There are tensions between Morocco and Spain and other EU members over immigration and drug smuggling. Morocco also has a long-standing dispute over jurisdiction of the
western Sahara territory that lies between Morocco and Mauritania.9 This
friction stands in the way of North African regional economic integration.
Key Political Characteristics
Morocco also occupies the crossroads between monarchy and a fullfledged democracy. Morocco is a constitutional monarchy, in which ultimate authority rests with the king, currently Mohammed VI, who assumed the throne in July 1999. The king is also head of the military and
the country’s religious leader. He appoints the prime minister, following
legislative elections. He also directly appoints the five most senior cabinet
positions, and may at his discretion terminate the tenure of any minister,
dissolve the parliament, and call for new elections or rule by decree.
7. According to the US State Department (2002), “Moroccans recognized the Government of
the United States in 1777. Formal U.S. relations with Morocco date from 1787, when the two
nations negotiated a treaty of peace and friendship. Renegotiated in 1836, the treaty is still
in force, constituting the longest unbroken treaty relationship in U.S. history.”
8. In 1986, then-King Hassan II invited then-Israeli Prime Minister Shimon Peres for talks.
Following the Oslo Agreement between Israel and the Palestinians in 1993, Morocco increased its economic and political ties with Israel; in 1994, both parties opened liaison offices.
These offices were closed in 2000, however, in response to renewed violence between the Israelis and Palestinians.
9. In 1991, after a long period of hostilities, the United Nations brokered a cease-fire between
Morocco and the Polisario; it remains in effect. In addition, the UN also proposed that the
area be given autonomy under Moroccan sovereignty—a position agreed to by Morocco, the
United States, France, and the United Kingdom. However, because of opposition from
Spain, Algeria, and the Polisario, a final settlement has not occurred. In addition, Russia and
China continue to seek a UN-organized referendum that would enable the territory’s inhabitants to determine their future.
314
FREE TRADE AGREEMENTS
Institute for International Economics | www.iie.com
Morocco’s system of proportional representation has generated a large
number of parties that span the political spectrum. In 2002, after parliamentary elections, the king named not an elected member of parliament
but Driss Jettou, a technocrat with no political party affiliation, to head the
government. This marked a shift from the previous left-wing coalition
government that had served since 1999, although the coalition assembled
by Jettou is said to be not very different from its predecessor (EIU 2003).
The leading opposition party, with 13 percent of the seats, is the Islamist
PJD (Justice and Development Party).10 Moreover, the low participation
in the election has given rise to speculation that support for radical Islamism is considerably higher. This possibility explains why faster economic
growth and efforts to reduce unemployment deserve a high priority on
Morocco’s economic policy agenda.
Key Economic Characteristics
Morocco is a midsized, middle-income developing country. In 2002, its GDP
was about $40 billion; with a population of 29.6 million, per capita income
was $1,350. Agriculture continues to play an important role—typically accounting for between 14 percent and 20 percent of output (depending
on rainfall) and employing about 40 percent of the workforce. Morocco has
substantial deposits of phosphates and phosphate derivatives, as well as
mines producing lead, silver, and copper. It also has a large fishing industry
and a large public sector. While Morocco has a modern manufacturing sector with significant output of clothing and textiles, a considerable share of
its output is from traditional craft industries. According to a recent study,
almost a fifth of Moroccan GDP originates in traditional craft industries
that produce ceramics, metalware, woodcrafts, traditional clothing, footwear, and textiles including rugs.11 The sector produces almost entirely for
the domestic market and tourism, generating almost no exports.
Morocco has been successful in maintaining monetary stability and low
inflation but less successful in stimulating economic growth. In the 1960s and
1970s, Morocco’s growth performance was strong, but more recently growth
has been insufficient either to significantly improve living standards or to
provide employment opportunities for the expanding labor force. It is estimated that in 2001, for example, the overall unemployment rate stood at almost 13 percent while urban unemployment was over 20 percent (IMF 2003).
10. Morocco’s largest Islamist group, Al-Adl Wal-Ihsane (Justice and Charity), did not have
political party status and took no part in the elections. According to the EIU (2003, 1), “Its
absence from the ballot and the fact that the turnout was a meager 52 percent appear to be
related: a significant proportion of the 48 percent who did not vote probably stayed at home
because of their non-participation.”
11. This figure is based on a Unesco study cited by the EIU (2003).
EGYPT, MOROCCO, AND THE UNITED STATES
Institute for International Economics | www.iie.com
315
Table 11.5
Principal Moroccan trade partners, 2000
Exports
Country
Share
(percent)
Total
(millions
of dollars)
34
13
10
7
5
4
4
3
3
2
1
15
2,491.0
963.5
712.7
529.5
369.2
310.9
283.8
253.9
209.6
124.1
68.9
1,114.7
France
Spain
United Kingdom
Italy
Germany
India
Japan
United States
Belgium
Netherlands
Brazil
All others
Imports
Country
France
Spain
United Kingdom
United States
Saudi Arabia
Germany
Italy
Iraq
Iran
China
Sweden
All others
Share
(percent)
Total
(millions
of dollars)
24
10
6
6
5
5
5
4
3
2
2
28
2,771.3
1,138.4
711.6
643.5
573.1
562.8
546.3
475.2
357.4
268.0
255.9
3,229.7
Source: UNSD (2003).
Morocco has typically run a merchandise trade deficit offset by earnings from tourism and remittances from expatriates abroad. Moroccan
merchandise trade is focused on the European Union. In 2000, for example, the European Union accounted for 58 percent of imports and about 75
percent of exports. France was by far its most important trading partner
(24 percent of imports and 34 percent of exports), followed by Spain (10
percent of imports and 13 percent of exports) (tables 11.5 and 11.6).
The United States is a relatively minor trading partner. In 2000, US exports of $253.9 million and imports of $643.5 million accounted for 3 and
6 percent of Moroccan exports and imports, respectively. The pattern of
trade is quite predictable and reflects resource endowments and levels of
development. US imports are concentrated in phosphates, fish and prepared vegetables, mineral fuels and oils, and textiles and clothing; US exports are concentrated in agricultural products (maize and wheat), aircraft, and machinery (see table 11.7).
Reform and Trade Liberalization
In the 1980s, Morocco was an inward-looking, highly regulated economy
with considerable state participation. Over time, numerous measures
have been taken to enhance the role of the domestic and international
markets. Yet the process has slowed down over the past few years under
the government dominated by the Socialist Union of Popular Forces and
remains incomplete.12 As indicated in figures 11.4 and 11.5, and judged by
12. Morocco currently is 68th out of 156 countries in terms of the Index of Economic Freedom developed by the Heritage Foundation (O’Driscoll, Feulner, and O’Grady 2003); it ties
with Tunisia and Saudi Arabia. Its overall score of 2.95, based on 10 equally weighted criteria, places it just in the “mostly free” category and just out of the “mostly unfree” category.
316
FREE TRADE AGREEMENTS
Institute for International Economics | www.iie.com
Table 11.6
Principal Moroccan trade products, 2000
Exports
Share
(percent)
Total
(millions
of dollars)
Articles of apparel,
accessories,
not knitted or
crocheted
22
1,666.2
Fish, crustaceans,
molluscs, aquatic
invertebrates
10
Electrical,
electronic
equipment
Imports
Share
(percent)
Total
(millions
of dollars)
Mineral fuels,
oils, distillation
products, etc.
18
2,039.2
766.2
Electrical,
electronic
equipment
12
1,412.7
10
760.8
Nuclear reactors,
boilers,
machinery, etc.
9
1,068.4
Articles of apparel,
10
accessories,
knitted or crocheted
710.9
Cereals
6
730.6
Inorganic chemicals,
precious metal
compounds,
isotopes
7
507.7
Vehicles other
than railway,
tramway
4
491.9
41
3,020.0
50
5,790.5
Category
Other commodities
Category
Other commodities
Source: UNSD (2003).
both the stabilization and structural reform measures, Morocco’s performance is fairly typical for a MENA country.
The liberalization of both trade and investment has played an important role in Morocco’s reform efforts. Tariffs have been reduced and the
tariff system has been simplified. Reference prices for textiles, clothing,
and appliances as well as several quantitative restrictions have been eliminated. Nonetheless, Morocco still has high most favored nation (MFN)
tariffs (average 33.9 percent) and a fairly restrictive regime of nontariff
barriers (see table 11.8). In the General Agreement on Trade in Services,
Morocco’s few commitments are typical for a developing country.
Morocco has undertaken additional liberalization commitments regionally. Like Egypt, it has concluded an association agreement that will lead
to free trade in industrial products with the European Union by 2012. The
EU agreement is incomplete, particularly with respect to services, agricultural products, and investment.13 Morocco has a similar agreement
13. For a discussion of the welfare effects of this agreement, see Page and Underwood (1997).
They report that since Moroccan nonagricultural exports were already entering the EU market duty-free, the expected gains from the agreement came primarily from lower prices to
consumers due to Moroccan trade barriers being reduced. A troubling feature of the agreement was related to the phasing in of these tariff reductions. In particular, relatively rapid
increases in tariffs on inputs actually raised effective protection in the short run, thereby generating small welfare losses.
EGYPT, MOROCCO, AND THE UNITED STATES
Institute for International Economics | www.iie.com
317
Table 11.7
Moroccan bilateral trade with the United States,
by product category, 2000
Exports
Category
Share
(percent)
Imports
Total
(millions
of dollars)
Category
Share
(percent)
Total
(millions
of dollars)
Articles of apparel,
accessories,
not knitted or
crocheted
28
69.7
Aircraft, spacecraft, and parts
thereof
22
143.8
Salt, sulphur, earth,
stone, plaster,
lime, and cement
24
60.0
Cereals
21
135.4
Meat, fish, and
seafood food
preparations
9
23.2
Nuclear reactors,
boilers,
machinery, etc.
11
69.3
Mineral fuels,
oils, distillation
products, etc.
9
21.6
Mineral fuels,
oils, distillation
products, etc.
8
48.8
Vegetable, fruit,
nut, etc. food
preparations
8
19.9
Tobacco and
manufactured
tobacco substitutes
7
43.0
23
58.5
Other commodities
32
203.2
Other commodities
Source: UNSD (2003).
with the European Free Trade Association (EFTA). It has also signed preferential arrangements with Algeria, Guinea, Iraq, Libya, and Mauritania.
Egypt, Jordan, Morocco, and Tunisia last year agreed to set up a free trade
zone ahead of the 2010 target for ending trade barriers in the EuroMediterranean area. The zone would also “be open to other Arab countries” such as Algeria, Libya, Mauritania, Syria, Lebanon, and Palestine.
In addition, Morocco belongs to the Community of Sahel-Saharan States
(COMESSA), which seeks to consolidate economic and commercial integration among member states.14 The government has also taken numerous unilateral measures to liberalize and attract foreign investment.15
14. Members of COMESSA include Burkina Faso, Central African Republic, Chad, Djibouti,
Egypt, Eritrea, Gambia, Libya, Mali, Morocco, Niger, Nigeria, Senegal, Somalia, Sudan, and
Tunisia. Algeria is not a member.
15. In November 1989, it abrogated a 1973 law requiring majority Moroccan ownership in a
wide range of industries. In 1993 Mobil Oil was allowed to buy back a 50 percent share of
a major oil-producing subsidiary it had previously owned. The government does not screen
FDI and provides favorable treatment on foreign exchange for foreign investors. Investment
is permitted in all sectors except agricultural land and sectors reserved for the state (e.g.,
phosphate mining). There are no performance requirements. In 1991, Morocco signed a BIT
with the United States that provided for MFN treatment and international arbitration for expropriation; in 1995, Morocco drafted a new foreign investment code that provides some tax
breaks on income for investment in certain regions, in crafts, and in export industries.
318
FREE TRADE AGREEMENTS
Institute for International Economics | www.iie.com
Figure 11.4 Economic stabilization in Morocco versus different
regions
Morocco vs. MENA: Inflation
Morocco vs. MENA: Current account
percent
1.0
percent
1.000
0.8
Morocco
0.999
0.6
Morocco
MENA
0.4
0.998
MENA
0.2
0.997
1990
1992
1994
1996
1998
2000
0.0
1990
1992
1994
1996
1998
2000
Morocco vs. MENA:
Exchange rate premium
Morocco vs. MENA: Fiscal balance
percent
1.0
percent
1.0
0.8
0.9
MENA
Morocco
MENA
0.8
0.6
0.7
0.4
Morocco
0.6
0.2
0.0
1990
0.5
1992
1994
1996
1998
2000
0.4
1990 1991 1992 1993 1996 1997 1998 1999
Morocco vs. MENA:
Overall stabilization index
percent
0.9
percent
0.9
0.8
0.7
Morocco vs. other regions:
Overall stabilization index
Morocco
MENA
0.8
East Asia
and Pacific
Latin America
Morocco
0.6
0.7
0.5
South Asia
0.4
1990 1991 1992 1993 1996 1997 1998 1999
0.6
1990 1991 1992 1993 1996 1997 1998 1999
Note: MENA includes Egypt, Jordan, Morocco, and Tunisia. Latin America includes Argentina,
Bolivia, Brazil, Chile, Colombia, Mexico, Peru, and Venezuela. South Asia includes India
and Pakistan. East Asia and Pacific includes China, Indonesia, Korea, Malaysia, the
Philippines, and Thailand.
EGYPT, MOROCCO, AND THE UNITED STATES
Institute for International Economics | www.iie.com
319
Figure 11.5 Structural reform in Morocco versus different regions
Morocco vs. MENA: Privatization
percent
0.6
Morocco vs. MENA: Taxation
percent
0.6
MENA
0.5
0.4
Morocco
Morocco
0.4
0.3
0.2
0.2
MENA
0.1
0.0
0.0
1990 1991 1992 1993 1994 1995 1996 1997 1998 1999
1990 19911992 1993 1994 1995 1996 1997 1998 1999
Morocco vs. MENA: Exchange rate
percent
0.9
percent
1.0
0.8
0.8
Morocco
0.7
MENA
0.6
0.5
Morocco vs. MENA: Trade policy
Morocco
MENA
0.6
0.4
0.2
1990 1991 1992 1993 1994 1995 1996 1997 1998 1999
1990 19911992 1993 1994 1995 1996 1997 1998 1999
Morocco vs. MENA:
Overall structural reform index
percent
0.8
percent
0.7
Morocco
0.6
Morocco vs. other regions:
Overall stabilization reform index
MENA
0.6
Latin America
0.5
0.4
0.2
0.0
0.4
Morocco
0.3
South Asia
East Asia
and Pacific
0.2
1990 1991 1992 1993 1994 1995 1996 1997 1998 1999
1990 1991 1992 1993 1994 1995 1996 1997 1998 1999
Note: MENA includes Egypt, Jordan, Morocco, and Tunisia. Latin America includes Argentina,
Bolivia, Brazil, Chile, Colombia, Mexico, Peru, and Venezuela. South Asia includes India
and Pakistan. East Asia and Pacific includes China, Indonesia, Korea, Malaysia, the
Philippines, and Thailand.
320
FREE TRADE AGREEMENTS
Institute for International Economics | www.iie.com
Table 11.8
Category
number
0
1
2
3
4
5
6
7
8
9
Moroccan average rates of tariff protection, by major
trade categories, 2000–01
Category
Tariff
(percent)
Food and live animals
Beverages and tobacco
Crude materials, inedible, except fuels
Mineral fuels, lubricants, and related materials
Animal and vegetable oils and fats
Chemicals
Manufactured goods
Machinery and transport equipment
Miscellaneous manufactured articles
Commodities and transactions not classified according to kind
2.5
50.0
25.0
17.5
50.0
32.5
32.5
2.5
50.0
2.5
Note: These tariffs held for the same classifications (Standard International Trade Classification Revision 1) in both years, 2000 and 2001. However, the tariffs varied greatly when
different categories were used. For instance, the average tariff on “food and beverages” is
2.5 percent—the same as “food and live animals,” but much less than “beverages and
tobacco” in the above table.
Source: World Bank, WITS (World Integrated Trade Solution) database, 2003.
In sum, Morocco stands at a crossroads in several respects: it has close
political linkages with the United States, Europe, Africa, and the Middle
East. It is in transition from an autocratic monarchy to a more full-fledged
democracy. It is shifting from an economy that is highly controlled to one
based on free-market principles, and it is in the process of making itself
the hub of a set of preferential trade agreements. These are crucial attributes of Morocco as an FTA partner for the United States.
Impact of an FTA Between the United States and Morocco
The Moroccan Perspective. The analysis of Morocco’s general economic
characteristics and its relationship with the United States does not immediately suggest that the United States is the ideal candidate for a free trade
agreement for Morocco. From a Moroccan perspective the immediate economic benefits are questionable; the case for an agreement rests partly on
its less certain potential dynamic benefits.
After all, Morocco’s primary international economic focus has been Europe. Its widely spoken foreign languages (French and to a lesser degree
Spanish), history, and geographic location all suggest that Europe, to use
the parlance of trade theorists, is Morocco’s “natural” trading partner. By
contrast, Morocco and the United States do not have a particularly close
economic relationship. The United States accounts for only 5 percent of
Moroccan trade, and US foreign investment is small. In addition, most of
the goods Morocco currently exports to the United States are not subject
EGYPT, MOROCCO, AND THE UNITED STATES
Institute for International Economics | www.iie.com
321
to high tariffs—many of these actually enter duty-free, in part because US
tariffs are already low for minerals and some agricultural products.16 The
disparities in tariff rates explain why an FTA has very different implications for tariff revenues in the two countries. John Gilbert’s computable
general equilibrium analysis (2003) reports that by implementing a free
trade area, Morocco would lose a total of $293 million and the United
States just $10.9 million.17
Under such circumstances, it is quite possible that giving US exports
tariff-free access to the Moroccan market could result in substantial trade
diversion. Although Moroccan consumers might enjoy lower prices, these
gains could be more than offset for the economy as a whole because tariff
revenue would be lost and goods would be purchased from the United
States rather than from more efficient sources. In addition, it is possible
that Morocco could experience declines in its terms of trade, since its tariff reductions would be much larger than those of the United States. In
fact, according to simulations undertaken for the conference that occasioned this volume, the trade impact of a US FTA would reduce Moroccan
incomes by about $93 million (in 1997 dollars)—0.26 percent of GDP—of
which $25 million is estimated to result from reduced efficiency and $68
million from reductions in terms of trade (Gilbert 2003).
While this conclusion is a good starting point for thinking about the
agreement’s economic impact, there are economic considerations that
could mitigate these effects and others that could exacerbate them. We
consider each in turn.
First, the conclusions are sensitive to assumptions made about other
Moroccan tariffs, with respect both to the European Union and to other
trading partners. In particular, the simulations take tariffs on the European Union, EFTA, and other regional trading partners as given. In fact,
the tariffs on industrial products with Europe are scheduled to be eliminated by 2012, a change that will surely reduce the trade diversion from
the US-Morocco FTA. Indeed, the FTA with the United States can be seen
as a measure that offsets trade diversion due to Morocco’s FTA with the
European Union. Moreover, if Morocco were to complement its US FTA
with more reductions in its MFN tariffs, the impact of this diversion could
be reduced and even eliminated—though such considerations also point
to the need for policies to deal with the budgetary implications of these
measures.
16. According to Gilbert (2003), US tariffs exceed 4 percent in crops besides grains (13.9 percent), processed food products (11.5 percent), and textiles and apparel (11.8 percent). By contrast, Moroccan tariffs are generally between 15 and 25 percent and are as high as 71 percent
for processed foods.
17. Gilbert (2003) estimates that Morocco would lose $115 million from revenues currently
collected on US products and an additional $177 million as a result of purchasing additional
US products rather than those of other trading partners.
322
FREE TRADE AGREEMENTS
Institute for International Economics | www.iie.com
Second, there could also be gains due to liberalization of services and
investment that have not been modeled.18 These could be significant. In
its goals for the FTA negotiations, the Coalition of US Service Industries
is seeking general disciplines to improve policy transparency and
strengthen intellectual property protection, as well as sectoral provisions
for market access and national treatment for a number of modes of delivery.19 These could provide additional benefits, especially if Morocco extends the measures unilaterally to other trading partners or uses such a
prospect to obtain additional benefits from other trading partners, particularly Europe.20
Third, regional trade agreements can stimulate domestic regulatory
reform, improve administrative procedures, raise domestic standards, remove bureaucratic red tape, and improve the rule of law. If such steps are
taken, they confer benefits not only on international trade and investment
but also on other forms of economic activity. In addition, agreements can
serve to improve investor expectations.
When countries have long histories of intervention in trade and investment, their unilateral action is often greeted with skepticism. Locking
in economic reform could reduce risk premiums and thereby enhance investment and economic growth. There could be additional benefits not
captured in the static framework if trade liberalization reduces the price
of capital goods, stimulates domestic investment, enhances the transfer
of technology through foreign investment, and stimulates productivity
growth through enhanced competition.
Fourth, Morocco is thwarted in some of its efforts in the European market. It faces restrictions on exporting citrus fruits, fresh vegetables, horticultural products, and apparel.21 Striking an agreement with the United
States could give Morocco greater leverage in negotiations currently under way with the European Union to improve its market access in agricultural products. Just as the United States has been motivated by the
Euro-Med agreements to act defensively to match preferences granted to
18. As indicated above, Morocco already has a bilateral investment treaty with the United
States and liberal investment rules. To stimulate additional investment, it would have to take
additional measures to improve its general business environment.
19. These include e-commerce, telecommunications services, banking and financial services,
insurance, audiovisual and computer services, education, energy, environmental services, express delivery, and tourism (see Vastine 2002).
20. In their simulations of an FTA between the European Union and Egypt, for example,
Hoekman, Konan, and Maskus (1998) found very large gains when service liberalization
was included.
21. The French external trade minister, François Loos, is reported to have pointed to an “incompatibility” in Morocco’s conducting free trade negotiations with the United States and
with the European Union at the same time. That the European Union has concluded an FTA
with Mexico has apparently escaped his attention.
EGYPT, MOROCCO, AND THE UNITED STATES
Institute for International Economics | www.iie.com
323
European competitors, so Europe could be similarly motivated to match
preferences granted to the United States in services, investment, and particularly agricultural products.
Finally, Morocco’s strategy in being willing to sign FTAs with a multitude of trading partners resembles the approach used by other prolific
FTA negotiators. While economists are fond of pointing out that preferential trading arrangements are in general second-best to multilateral free
trade, they often fail to notice that for a single country, the best outcome
would be to have no domestic barriers together with preferential access in
all other markets. It appears that countries such as Chile, Mexico, and Singapore are headed in this direction; and while it is far behind these three
countries in eliminating its domestic barriers, Morocco could be trying to
move toward such an outcome.
There are, however, other considerations that suggest the gains could
actually be lower than projected in the model. One is the possibility that
agriculture will not be fully liberalized. NAFTA, for example, contained
some noteworthy exceptions, such as Canadian dairy and poultry products (see Miller 2002). A second potential complication is the impact of
the FTA rules of origin, particularly for textiles.22 The United States has
generally insisted on highly restrictive rules of origin—so-called fiberforward rules—for clothing products to qualify for duty-free access. By
forcing Moroccan clothing manufacturers to use high-cost domestic or US
inputs, these rules could seriously affect Moroccan export competitiveness. A report issued by the American Chamber of Commerce (2002) suggests that this concern is not simply academic. Describing the recent cutbacks in the production of Jordache denim jeans in Morocco, it notes: “The
high price of local fabric is a key issue. J.R.A. [J.R.A. Morocco, the Jordache group] believes that Jordache New York could not justify continued
imports of finished goods from Morocco—even with an FTA—if the high
cost of using local fabric (required to satisfy the rules of origin) negated its
benefits.”23
Major sectors of Moroccan agriculture currently enjoy high rates of tariff protection. A third concern, therefore, relates to the adjustment challenges posed by eliminating these tariffs on US exports. According to
Gilbert’s simulations (2003), the real returns to owners of land, that is,
farmers, could be reduced by as much as 4 percent as a result of such an
arrangement. By contrast, owners of natural resources would see their incomes rise by 4 percent; the incomes of skilled labor and unskilled capital
would each rise by about 1 percent. Morocco faces the challenge of pro-
22. Both these elements have been troubling features of other US preferential arrangements,
in particular NAFTA. For an excellent analysis of NAFTA exceptions, see Miller (2002).
23. Morocco’s role as a regional hub could be improved if the rules of origin allowed for cumulating with other countries in the Middle East.
324
FREE TRADE AGREEMENTS
Institute for International Economics | www.iie.com
viding a rural social safety net program in the short run, and alternative
activities and agricultural income supports in the long run.
A fourth, more general challenge relates to implementation. It takes
considerable administrative capacity to negotiate and implement an agreement of the type envisaged.24 Ensuring compliance with new rules in
areas such as intellectual property, customs, competition, environmental
protection, worker rights, and government procurement will require that
skills and resources be upgraded across the board. Actions by the private
sector to avail itself of new market opportunities could entail additional
costs. Agricultural producers may have to first meet new rules on food
safety and additional sanitary and phytosanitary requirements. Similarly,
potential exporters of manufactured goods will have to meet US safety
and design standards and labeling requirements. Meeting these requirements could lead to additional positive spillovers to the rest of the economy, but in the short run they will entail additional costs not captured by
the economic simulations. Nathan Associates (2003) has estimated that a
reasonable package would require between $39.5 and $48.3 million in additional resources—a considerable increase over the aid given to Morocco
in 2002 (according to the US Agency for International Development data,
Morocco’s repayments actually exceeded its receipts from the United
States).
It is common to hear the slogan “trade, not aid.” However, as trade
agreements become deeper, and as their implementation demands enhanced domestic capacity, this becomes a false choice. Trade and aid are
complements in agreements between developed and developing countries, not substitutes. Without appropriate and adequate aid, the benefits
from trade are unlikely to be realized. US Trade Representative Robert
Zoellick has declared that the Bush administration intends to target ongoing development assistance and trade-related technical assistance to
help Morocco to follow through on the commitments it will make as part
of the FTA.
In sum, for Morocco to benefit from an FTA with the United States, it
needs to accompany the agreement with complementary policies, such as
extending the bilateral tariff reductions to those placed on other trading partners;
using the agreement to accelerate domestic reforms that improve the
overall business environment;
using the agreement as a means of making these reforms more credible;
24. For an extensive appraisal of these requirements, see Nathan Associates (2003).
EGYPT, MOROCCO, AND THE UNITED STATES
Institute for International Economics | www.iie.com
325
using the agreement to increase its bargaining leverage with the European Union, and to improve its market access, particularly in agricultural products; and
improving its capacity to implement and take advantage of the
agreement.
The US Perspective. The simulations undertaken for this conference indicate positive effects from the removal of high tariff barriers. According
to Gilbert (2003), measured in 1997 dollars, the United States benefits to
the tune of $178 million as exports increase by 88 percent. Most of the welfare gain stems from improvements in America’s terms of trade. Moreover, since Europe has already signed an agreement to give it preferential
access, for the United States an FTA with Morocco can be seen as a defensive measure against an important competitor. In addition, the agreement
helps to underscore American willingness to move to free trade with all
partners who are willing to reciprocate.
Nonetheless, the primary US objectives are political, although their realization is subject to considerable uncertainty. An optimist would point
to several potential benefits. First, the agreement could enhance Morocco’s reform process, both improving its institutions and governance
and stimulating its economic growth. Prosperity based on a market system could enhance political stability and make possible the emergence of
a more full-fledged democracy. Second, growth based on trade and foreign investment would cement the friendly relations between Morocco
and the West. Third, prosperity would also help to reduce the conditions
of despair that have created a breeding ground for terrorists; and fourth,
the example of a successful Morocco could serve to catalyze similar
changes in neighboring countries.
However, it should be pointed out that none of these outcomes is assured. First, the economic effects of a US FTA are relatively small, and
there is no guarantee that the required complementary policies will be
adopted. If they are not, the immediate economic impact of the agreement
could actually reduce welfare in Morocco. Second, a movement toward
greater democracy without the necessary preconditions could actually enhance the power of Islamic fundamentalists—Algeria being a telling example of such an outcome. Third, a larger foreign presence could help to
stimulate more xenophobic political responses and be viewed as even
more threatening by such fundamentalists. Fourth, since Morocco remains on the periphery of the Middle East and has fairly distinctive characteristics, its success might have little precedent-setting value for the region. By contrast, as we will argue below, successful reform in a more
pivotal country such as Egypt could prove to be a much more powerful
impetus toward change.
326
FREE TRADE AGREEMENTS
Institute for International Economics | www.iie.com
In agreeing to negotiate with Morocco, the United States is signaling its
willingness to negotiate FTAs with partners in the Middle East besides Israel and its neighbors. But there is a danger that by negotiating these
agreements separately and crafting deals to meet individual cases, it
could be creating a crazy-quilt set of agreements that introduce costly
complexity into its trading relationships. It is important, particularly if the
goal is eventually to produce a single regional FTA, that the component
agreements be designed to allow easy docking.
Conclusions and Final Comments
Under both FTAs considered in this chapter, the United States could enjoy
positive economic benefits, although these are unlikely to be perceptible
in an economy of its size. Egypt would derive positive benefits from a
US-Egypt FTA. By contrast, the (static-efficiency) economic benefits of
a US FTA covering only goods trade could be negative for Morocco. These
conclusions are sensitive to the scope of agreement. Simulations indicate,
for example, that Egypt would benefit more from a deep agreement that
includes services and investment than one confined to merchandise trade.
Since these sectors are to be included in the US-Morocco FTA, the sign of
the economic impacts for Morocco could be reversed.
The magnitudes of the economic benefits for both Egypt and Morocco
will ultimately depend on their agreement’s more dynamic effects. These
will in turn largely reflect the other policy measures they adopt and the
additional aid they receive. Especially important will be their ability to
mitigate trade diversion by lowering other external barriers, their ability
to use an agreement to enhance domestic reform, and their ability to enhance domestic implementation capacity.
By serving as an anchor for reform, a free trade agreement can affect the
probability that complementary measures will be adopted. Negotiators
should be mindful of this potential when deciding on the content of the
agreement. In particular, they should insist on including the relevant institutional changes in its terms. In addition, mechanisms for conditionality and monitoring should be incorporated and the agreements phased in
with suitable time provided to ensure effective implementation.
On the political front, it is no coincidence that countries with which the
United States has had the most conflict—including Cuba, Iraq, Libya,
North Korea, and Iran—have been among the most controlled economies,
the least integrated with the global economy, and the least democratic.
But we cannot say with certainty that political gains will follow free trade
agreements. Their political implications are far more difficult to analyze
than the economic, not simply because we are economists by profession
but also because the causal relationships are tenuous.
EGYPT, MOROCCO, AND THE UNITED STATES
Institute for International Economics | www.iie.com
327
Nevertheless, successful economic reform is likely to enhance prosperity and employment opportunities and thus help to create societies that
are less fertile breeding grounds for terrorism. The demonstration effect of
success could also have positive spillover, pressuring those in the region
more resistant to change to emulate their neighbors. To the extent that the
United States is party to such a process, its image would improve. America’s involvement would help dispel perceptions that its regional interests
are simply strategic rather than tied to promoting the welfare of all who
reside in the region.
It is certainly plausible that free markets, participation in international
economic agreements and institutions, improved governance, and greater
harmony with the United States could go together. Freer markets and the
rule of law are natural complements to good governance. Regimes are far
more able to confer rents and preferences on political allies when the
economy is centrally controlled and regulated than when it is based on
free-market principles. Favoritism and nepotism are less likely when
firms profit from improvements in efficiency and in meeting consumer
needs rather than by obtaining permits and licenses. Similarly, when a
particular government is subject to binding international rules and requirements of transparency, its capacity to provide special favors will be
more constrained.
Moreover, countries that do not allow their own citizens access to the
rule of law and economic freedom will certainly be unwilling to accord
such freedoms to foreigners. Conversely, if foreigners are allowed to compete freely in the domestic market, it becomes difficult to prevent citizens
from doing likewise. That is why international agreements and domestic
reform are complementary activities, particularly when the agreements entail deep economic integration and cover domestic rules and institutions.
Yet this same logic suggests that actually implementing and obtaining
compliance with agreements could be difficult. A formal agreement will
not necessarily be effectively implemented if economic reform threatens
the political control of the government in power. In addition, it is important that the rules themselves be appropriate to the country’s social and
political conditions. There are dangers that such agreements could actually create greater domestic instability and harm external relations if they
are perceived to be unfair and to have been imposed from without.
In short, the choice of Morocco as an FTA partner for the United States
appears to be driven more by the availability of an opportunity than by
compelling economic or strategic considerations. Morocco has long had a
close political relationship with the United States, but its economic ties
with the United States are weak—and its economic future will be driven
far more by its relationships with Europe and its neighbors. From a political standpoint, its influence in the region is likely to be moderate.
Although not yet chosen as a partner, Egypt could offer favorable opportunities. Egypt’s pivotal role in the Middle East, the importance of its
328
FREE TRADE AGREEMENTS
Institute for International Economics | www.iie.com
continuing progress in economic reforms, its relationship with the United
States, and its influential role in the region all suggest that an Egypt-US
FTA should be given priority. Ultimately, however, in the case of both
FTAs, the political gains to be reaped, like the potential economic gains,
will depend on factors beyond the agreements themselves. While the economic gains will require the adoption of complementary policies by Morocco and Egypt, the political gains for the United States will depend on
its success in restoring the prosperity and independence of Iraq and in ensuring an equitable resolution of the Israeli-Palestinian conflict.
References
American Chamber of Commerce in Morocco. 2002. Written Comments to the Office of the
United States Trade Representative on the Proposed U.S.-Morocco Free Trade Agreement. www.amcham-morocco.com/downloads/ustrfta.pdf (November 22).
Dasgupta, Dipak, Jennifer Keller, and T.G. Srinivasan. 2002. Reform and Elusive Growth in the
Middle East—What Has Happened in the 1990s? Photocopy. World Bank, Washington.
DeRosa, Dean. 2003. Gravity Model Calculations of the Trade Impact of US Free Trade
Agreements. Background paper prepared for the conference Free Trade Agreements
and US Trade Policy, sponsored by the Institute for International Economics, Washington (May 7–8).
EIU (Economist Intelligence Unit). 2003. Country Report: Morocco.
Galal, Ahmed, and Samiha Fawzy. 2001. Egypt’s Export Puzzle. Policy Viewpoint 9. Cairo:
Egyptian Center for Economic Studies. www.eces.org.eg.
Gilbert, John. 2003. CGE Simulation of US Bilateral Free Trade Agreements. Background
paper prepared for at the conference Free Trade Agreements and US Trade Policy, sponsored by the Institute for International Economics (May 7–8).
Gresser, Edward. 2003. Blank Spot on the Map: How Trade Policy Is Working Against the War
on Terror. Policy Report. Washington: Progressive Policy Institute. www.ppionline.org/
documents/Muslim_Trade_0203.pdf (February).
Hoekman, Bernard, Denise Konan, and Keith Maskus. 1998. An Egypt-US Free Trade Agreement: Economic Incentives and Effects. In Building Bridges: An Egypt-US Free Trade Agreement, ed. Ahmed Galal and Robert Z. Lawrence. Washington: Brookings Institution.
IMF (International Monetary Fund). 2003. Morocco: Statistical Appendix. IMF Country Report 03/163 (June): 14. Washington: IMF.
Lawrence, Robert Z. 1998. Is It Time for a US–Egypt Free Trade Agreement? A US Perspective. In Building Bridges: An Egypt–US FTA, ed. Ahmed Galal and Robert Z. Lawrence.
Washington: Brookings Institution.
Miller, Eric. 2002. The Outlier Sectors: Areas of Non-Free Trade in the North American Free Trade
Agreement. Washington: Inter-American Development Bank.
Nathan Associates. 2003. Assessment of Morocco’s Technical Assistance Needs in Negotiating and Implementing a Free Trade Agreement with the United States. Arlington, VA.
Photocopy.
O’Driscoll, Gerald P., Edwin J. Feulner, and Mary A. O’Grady, ed. 2003. 2003 Index of Economic Freedom. Washington: Heritage Foundation; New York: Dow Jones. www.heritage.
org/research/features/index.
OECD (Organization for Economic Cooperation and Development). 2000. Tariffs and Trade:
OECD Query and Reporting System. CD-ROM version.
Page, John, and John Underwood. 1997. Growth, the Maghreb, and Free Trade with the European Union. In Regional Partners in Global Markets: Limits and Possibilities of the EuroEGYPT, MOROCCO, AND THE UNITED STATES
Institute for International Economics | www.iie.com
329
Med Agreements, ed. Ahmed Galal and Bernard Hoekman. Egyptian Center for Economic Studies. London: Centre for Economic Policy Research.
Refaat, Amal. 2003. Trade-Induced Protection in Egypt’s Manufacturing Sector. Working
Paper no. 85. Egyptian Center for Economic Studies. www.eces.org.eg.
Subramanian, Arvind. 1997. The Egyptian Stabilization Experience: An Analytical Retrospective.
ECES Working Paper Series 18. Cairo: Egyptian Center for Economic Studies. www.
eces.org.eg.
UNSD (UN Statistics Division). 2003. Comtrade Database. unstats.un.org/unsd/comtrade.
US State Department. 2002. Background Note: Morocco. www.state.gov/r/pa/ei/bgn/
5431.htm (January).
Vastine, Robert (president, Coalition of Service Industries on the US-Morocco Free Trade
Agreement). 2002. Statement before the Trade Policy Staff Committee, Office of the
United States Trade Representative (November 21). www.uscsi.org/publications/
papers/moroccof.pdf.
330
FREE TRADE AGREEMENTS
Institute for International Economics | www.iie.com


© Copyright 2026