
Document 4251
BARC NEWSLETTER
In the Forthcoming issue
1. Recent Developments on Radioprotection by Selenium Compounds
K. Indira Priyadarsini, et al.
2. Modeling of deformation behaviour of hcp metals using
Crystalplasticity Approach
Apu Sarkar and J.K. Chakravartty
3. Multi-Detector Environmental Radiation Monitor with
Multichannel Data Communication for Indian Environmental
Radiation Monitoring Network (IERMON)
M.D. Patel et al.
4. Single Phase Flow Simulation of Industrial Scale Agitated Tanks
K.K. Singh, et al.
5. Hollow Fibre Liquid Membranes: A Novel Approach for Nuclear
Waste Remediation
S.A. Ansari, et al.
6. Experiments on reinforced concrete structures; subassemblages and components for seismic safety–post
installed anchors
Akanshu Sharma et al.
7. A Material Transfer System using Automated Guided Vehicles
R.V. Sakrikar et al.
8. TB-PCR kit for diagnosis of tuberculosis
Savita Kulkarni et al.
BARC NEWSLETTER
Contents
Editorial Note
ii
62nd Republic Day Address by
Dr. Ratan Kumar Sinha, Director, BARC
1
Our Gratitude to Dr. Homi J. Bhabha
Dr. S.V.K. Rao
13
Technology Development Articles
Development of Technologically Important Crystals and Devices
S.G. Singh et al.
16
Heavy Liquid Metal Technology Development
A. Borgohain et al.
28
Indigenous Development of Silicon PIN Photodiodes Using
a 4" Integrated Circuit Processing Facility
Anita Topkar et al.
34
Development of Room Temperature NH3 Gas Sensors based on Ultrathin SnO2 Films
Sipra Choudhury et al.
39
Development of online radon and thoron monitoring systems
for occupational and general environments
J.J.Gaware et al.
45
Feature articles
Formal Model Based Methodology for Developing Software
for Nuclear Applications
A. Wakankar et al.
52
Development of Digital Radiotherapy Simulator:
A Device for Tumour Localization, Radiotherapy Planning and Verification
D.C. Kar et al.
63
News and Events
National Conference on Advances in Nuclear Technology (ADNUTECH 2010): a report
70
DAE-BRNS Workshop on “High Resolution Gamma Ray Spectrometry
72
(HRGS-2010)”: a report
Workshop on Protection against Sabotage and Vital Area Identification: a report
74
Valedictory function of the Health Physics Training course-15th Batch: a report
75
National Science Day Celebrations at BARC
77
BARC Scientists Honoured
ISSUE NO. 318
I JAN - FEB 2011 I
i
BARC NEWSLETTER
62nd Republic Day Address
by
Dr. Ratan Kumar Sinha, Director, BARC
“Dear colleagues,
My greetings to all of you on the occasion of
the 62nd Republic Day of our country. As all of
you know, in the year 1950, the Constitution of
the sovereign democratic republic of India was
adopted and world’s largest democracy was
born.
Every year, as a part of this celebration, we
salute our national flag. We also remember and
salute the members of our armed forces, who
provide security to our country.
This function provides us an opportunity to take
stock of our achievements during the year. The
programmes of our Organisation of more than
15,000 colleagues are extremely diverse and
voluminous. Therefore, on this occasion today,
I intend to cover only a few representative
activities, providing a glimpse of our
achievements during the recent past.
Research Reactors
As all of you are aware, last year, two of the
research reactors Canadian Indian Reactor
(CIRUS) and Dhruva have successfully
completed 50 years and 25 years of very
productive operation. CIRUS continued to
operate at an availability factor of around 87%
until December 31, 2010, when the reactor was
permanently shut down.
As a part of upgrading the core of the Apsara
Dr. Ratan Kumar Sinha, Director, BARC addressing the
BARC freternity
reactor, decommissioning activities of the reactor
and reactor systems have already been
completed. Demolition of the existing reactor
building will commence soon to enable
construction of the new building. Detailed
engineering of various reactor systems of
upgraded Apsara is currently in progress.
Research reactor Dhruva has also been taken
up for refurbishment and replacement of various
equipment and components to ensure its
continued high availability.
ISSUE NO. 318
I JAN - FEB 2011 I
1
BARC NEWSLETTER
The Advanced Heavy Water Reactor
(AHWR) Critical Facility was operated for
various experiments. A mixed pin cluster
carrying thorium oxide as well as natural uranium
pins was loaded in four different locations of
the AHWR Critical Facility. Criticality was
achieved with all these loadings and the observed
critical height was in close agreement with the
estimated critical height. Multiple foils were
irradiated to obtain the reaction rates in various
energy regions and SAND-II code was used
for the spectrum unfolding.
Testing of nuclear detectors in graphite reflector
region continued. Moderator level coefficient
measurements were carried out and observed
values matched with predicted ones. Reactivity
measurement due to loading of a cluster
containing Thoria and Uranium pins was carried
out satisfactorily. Facility was also utilised for
large volume sample irradiations for Neutron
Activation Analysis (NAA).
The conceptual design of a High Flux
Research Reactor (HFRR) to be built at our
new campus at Vizag, has been completed.
HFRR is designed primarily to meet the large
requirements of high specific activity radioisotopes and to provide enhanced facilities for
basic research in frontier areas of science and
for applied research related to development and
testing of nuclear fuel and reactor materials.
Advanced Heavy Water Reactor (AHWR)
The AHWR Thermal hydraulic Test Facility
(ATTF) is being setup at R&D Center, Tarapur,
in collaboration with Nuclear Power Corporation
of India Ltd. (NPCIL), to establish thermal and
stability margins as well as to test the fuelling
machine at prototypical conditions. The various
work modules of the project like civil,
mechanical, electrical, instrumentation and
2
I
ISSUE NO. 318
I
JAN - FEB 2011
control are at an advanced stage of execution.
Thermal hydraulic analysis of AHWR with Low
Enriched Uranium (LEU) was carried out to
estimate the thermal margin. It was found that
adequate thermal margin exists with LEU in the
AHWR core. A feasibility study was also carried
out for the power uprating of AHWR using
pumped circulation with LEU.
In order to reduce the plutonium requirements
of the AHWR initial core, various options of
partial loading of AHWR initial core were
studied. Detailed studies related to AHWR
equilibrium core with Th-LEU fuel for a target
burnup of 60 GWd/te were carried out. An initial
core with LEU fuel has been designed with
desirable operational features during refueling
and transition to the equilibrium core.
The design of the secondary shut down system
of AHWR was modified to have eight injection
tubes at two elevations. The jet dynamics was
modeled using an indigenously developed
methodology and the worths were estimated.
Compact High Temperature Reactor
(CHTR) and 600 MWth High Temperature
Reactor (HTR) for Hydrogen Production
Solid modeling of CHTR systems and
components was completed. CHTR fuel rod
simulator costing about 1% of the imported option
was developed. Fabrication of molten salt loop
and corrosion test facility for high temperature
reactor application has been completed.
The challenging task of treating the double
heterogeneity effect created by lumping the fuel
into particles and those into pebbles has been
done using the Reactivity equivalent Physical
Transform (RPT) method. The results were
compared with reference results from Monte
BARC NEWSLETTER
Carlo simulation of a pebble, in which double
heterogeneity has been treated explicitly.
been qualified and are being inducted into the
production line.
CHTR physics design simulations were
performed with new design modifications such
as use of thinner control rods for finer control,
Reduction in the available locations (18 to 12)
for control rod etc. Efforts were made to minimise
the single CR worth at criticality by varying the
content of burnable poison.
The regular production of Mixed Oxide (MOX)
fuel pins for PFBR has started at Advanced Fuel
Fabrication Facility (AFFF) and a new fuel pin
welding line has been recently commissioned.
The experimental PFBR MOX fuel being
irradiated at FBTR has now reached a burn-up
of 107,000 MWd/T, exceeding the design target
burn-up of 100,000 MWd/T.
Study of Thorium utilisation in Pressurised
Water Reactors
A study of possibility of thorium utilisation in a
Pressurised Water Reactor (PWR) was made
by considering the (Th-LEU (19.75% U235))MOX fuel. PWR cores fuelled with thorium
using different fissile compositions were studied.
LWR studies
An updated WIMS library in 172 groups has
been generated in-house with burn-up chain
extended up to 252Cf. This library contains 185
nuclides and resonance integral tabulation for
48 resonant nuclides, including several minor
actinides with temperature extended up to
2500°K. This library has performed successfully
for the VVER simulations.
Fuel development and supply
BARC has the responsibility of supplying
plutonium bearing fuels for the Fast Reactor
Programme, including Fast Breeder Test Reactor
(FBTR) and Prototype Fast Breeder Reactor
(PFBR) (under construction) at Kalpakkam.
For the production of U-Pu mixed carbide fuel
pins for FBTR, new technologies like Laser
welding for the fuel pin end-plug closure and
Laser engraving unit for fuel pin numbering have
BARC is also involved in R&D on metallic fuel
for the advanced fast breeder reactors with high
breeding ratio. Thermophysical properties like
phase transition temperatures, solidus
temperature and eutectic temperature between
U-15%Pu fuel and T-91 cladding has been
determined. A glove box train consisting of
injection casting, demoulding and eddy current
inspection of fuel slugs has been set up at Atomic
Fuels Division (AFD)
For the AHWR Fuel Fabrication mock-up
facility project, radiation resistance remote
viewing system has been developed indigenously
for hot cell and shielded enclosure applications
for AHWR fuel fabrication.
Based on the post irradiation examination of the
thoria-4%plutonia mixed oxide fuel elements,
two of the intact fuel elements were certified to
be fit for re-irradiation in CIRUS reactor. These
two fuel elements, along with fresh fuel elements
containing thoria-8%plutonia of AHWR fuel
design, manufactured at AFFF, were
reconstituted into an irradiation rig and loaded
into CIRUS for irradiation. This exercise has
helped us to arrive at the procedure for quality
assurance for reloading and re-irradiation of
experimental fuels in the test loops of research
reactor. Both the irradiated pins, despite being
ISSUE NO. 318
I JAN - FEB 2011 I
3
BARC NEWSLETTER
cooled for more than twelve years in the spent
fuel storage pool, could withstand the irradiation,
till the closure of the CIRUS.
Neutron radiography set-up for irradiated fuel
pin at CIRUS was installed and commissioned.
After trial runs with unirradiated fuel pin, neutron
radiography of irradiated Pressurised Heavy
Water Reactor (PHWR) fuel pin and
experimental thoria-plutonia MOX fuel pins
were carried out. Defects like, fuel cracks,
hydriding of clad, and swelling and dislocation
of fuel were detected. Details of fuel pin like
pellet gap, spring inside the pin at the end were
also clearly visible in the neutron radiograph.
Decrease in fuel column length was observed
in the experimental thoria-plutonia fuel pins
having low density pellets. Formation of central
void was found in experimental thoria-plutonia
MOX high burnup fuel pin.
Detailed post-irradiation examination has been
carried out on Zr-2.5Nb-0.5Cu loose fit garter
springs, taken out from 10 high flux channels,
five each from Kakrapar Atomic Power Station1 (KAPS-1) and Narora Atomic Power Station1 (NAPS-1) PHWR reactors. These garter
springs were retrieved during the EMCCR
operation after around 10.5 Effective Full
Power Year (EFPY) of operation.
An indigenous micro-wave heating system (1-6
kW power), adapted and retrofitted to existing
hot-cell (without any alteration), was tested. It
will be used for the dissolution of irradiated thoria
based fuels and materials and also for actinide
separation studies of advanced fuels.
Reprocessing and Waste Management
Reprocessing plants at Trombay and Kalpakkam
continued to operate safely and satisfactorily.
Radioactive wastes generated from nuclear
installations both at Trombay & Kalpakkam were
4
I
ISSUE NO. 318
I
JAN - FEB 2011
managed safely. In addition, during the year,
radioactive wastes generated during partial
decommissioning of Apsara was managed quite
efficiently.
The development of oblong-shaped metallic
melter to achieve higher through-put in waste
vitrification process was completed and the unit
was commissioned.
As a part of automation programme for
plutonium reconversion laboratory, extensive trial
runs were taken on rotary vacuum drum filter
and continuous screw calciner. Automation of
reconversion laboratory, besides increasing the
through-put, helps in bringing down the load on
operator and man-rem expenditure.
Towards deep geological repository programme,
developmental activities were continued. Setting
up of an underground research laboratory has
been initiated. This laboratory will facilitate
conducting various experiments under inactive
conditions, such as studying the effect of vitrified
waste canister on the host rock, its remote
handling aspects, validation of codes for
migration of various radio-nuclides, etc.
An incinerator for radioactive solid waste at
Radioactive Solid Waste Management Site
(RSMS), BARC, Trombay has been refurbished
and commissioned. A volume reduction factor
of hundred was achieved and the airborne
activity during the incineration was below
detection limit, indicating effectiveness of air
treatment system.
Installation and testing of Resin Fixation Facility
for conditioning of spent resins in polymer matrix
is nearing completion at RSMS, Trombay. The
facility has incorporated the process for
immobilisation of spent resins in specific cement
also.
BARC NEWSLETTER
At Centralised Waste Management Facility
(CWMF), Kalpakkam, a new facility for
retrieval, volume reduction and disposal of stored
pressure tubes has been designed and a work
order has been released after obtaining
necessary safety clearances. A facility for melt
densification has been in continuous use for
treatment of plastic/polythene waste. Based
upon the experience gained from the facility, a
new scaled up facility with certain modification
is being set up.
Feasibility studies have been initiated for
vitrification of High Level Waste (HLW) from
AHWR and Fast Reactor Fuel Cycle Facility
(FRFCF) in sodium borosilicate glass matrix.
Irradiation of typical sodium borosilicate glass
composition to study long term radiation stability
of glass matrix with respect to alpha radiation
and recoil damage has been completed. Thermal
property of acid and molten glass resistant
refractory material has been enhanced by
addition of bubble alumina.
Further development work is in progress for Cold
Crucible Induction Melting technology for
vitrification of HLW. Green heating experiments
have been carried out successfully. Modelbased design of cold crucible for hull melt
densification has been completed.
Separation of useful isotopes such as 106Ru, 90Y
etc. was continued for supplying these materials
for medicinal use. Techniques for quality control
of the recovered 90Y were also developed.
An underground research laboratory is being set
up in one of the captive sites of the Department.
This laboratory will help in conducting various
experiments such as study of the effect of
heat generating canister on the disposal
environment, development of methodologies for
emplacement/retrieval of the canister remotely,
validation of various codes for predicting the
migration of activity, mechanical stresses in
the host rock due to the digging of the tunnel
etc.
Health, Safety and Environment
Environmental Studies
Environmental surveys for the baseline studies
of the new uranium mining projects at
Tummalapalle (A.P.) and new BARC campus
at Vizag are currently in progress. Preoperational survey at new Nuclear Power Plant
sites of Hissar in Haryana and Mithivirdi in
Gujarat were also initiated.
Studies on assessment of radiological impact of
the proposed uranium tailings pond at Seripalli
in Nalgonda district of Andhra Pradesh have
concluded that the radiological impact of the
proposed uranium tailings pond is trivial up to a
period of 2000 years and will be of no concern
after this period.
A Cone Beam Optical Computed Tomography
(CBOCT) system has been designed, developed
and tested for obtaining 3-D dose distribution
from advanced radiotherapy equipment using
polymer gel dosimeter. The facility for preparing
polymer gel dosimeter has also been established.
The system will be useful for dose verification
in radiotherapy.
There was a need for dosimeters in the dose
range of 100 to 1000 Gy for low dose applications
of food irradiation, especially for mango
irradiation. Accordingly, two new dosimeters
were developed in the dose range mentioned
using i) Glycine & (ii) Lithium formate. These
systems being indigenously developed are costeffective.
ISSUE NO. 318
I JAN - FEB 2011 I
5
BARC NEWSLETTER
Analysis of the data on the effect of radiation
on congenital malformations, such as mental
retardation (MR) and cleft lip/palate (CLP),
using case control methodology, generated under
the three year epidemiological study project, has
been completed. The results indicate no
statistically significant excess relative risks for
the occurrence of these malformations
attributable to natural background radiation.
Safety studies
BARCOM Test Model for Ultimate Load
Capacity Assessment
The 1:4 size BARC Containment (BARCOM)
Test Model simulating the 540 MWe PHWR
inner containment was subjected to overpressure test till the first appearance of crack
was realised. This occurred at a pressure of
0.2207 MPs, which is 1.56 times its design
pressure. The failure initiation was attributed to
inelastic strains developed in the discontinuity
regions of Main Air Lock and Emergency Air
Lock. The data collected during the
pressurisation has been compared with analytical
predictions reported by various International
Round Robin Participants, including that of inhouse code ULCA from BARC.
Cyclic Fracture Tests on Narrow Gap
Welded (NGW) SS304LN Stainless Steel
Pipes
Cyclic fracture tests were conducted to address
the concern about the effect of cyclic loading
anticipated during a seismic event. Apart from
pipes with cracks in base metal; conventionally
welded pipes using Submerged Metal Arc
Welding (SMAW) and those welded using Hot
Wire Pulsed Gas Tungsten Arc Welding
(GTAW), with narrow gap were also tested. The
investigation has revealed that the Cyclic Tearing
and monotonic fracture resistance of narrow gap
GTAW is superior to SMAW, supplementing the
6
I
ISSUE NO. 318
I
JAN - FEB 2011
other advantages of GTAW, such as lower
residual stress and reduced susceptibility to
sensitisation.
A supercritical test facility was set up earlier
to investigate heat transfer, pressure drop and
stability behaviour of supercritical fluids. The
facility was earlier operated with supercritical
carbon-dioxide up to 90 bar pressure. The facility
was modified for operation with Supercritical
Water (SCW) up to 250 bars and 400 oC and
experiments are going on.
Channel Heat up Studies for PHWR
Pressure Tube is expected to have a
circumferential temperature gradient during flow
stratification for a small break Loss of Coolant
Accident (LOCA) situation in a PHWR. A trial
experiment for asymmetric heating
(circumferential) of pressure tube for 220 MWe
PHWR at atmospheric pressure has been
carried out with a 19 Fuel Pin Simulator.
Seismic Qualification of glove boxes
The seismic qualification tests were performed
on different configurations of glove boxes viz.
single glove box, glove box train and double
module glove box. The studies concluded that
the glove boxes could safely withstand a ground
acceleration of 0.2 g. Necessary modifications
have been identified, which would enable them
to withstand higher acceleration.
AHWR safety
As a part of demonstration of safety margins
available in AHWR, analyses were carried out
to identify plant symptoms generated during
Beyond Design Basis Event for “decrease in
inventory” category. It was shown that, even
for the scenario involving a 200% break at inlet
header along with un-availability of Emergency
core Cooling System (ECCS) and loss of
BARC NEWSLETTER
moderator as a heat sink, symptoms can be
identified and sufficient time is available for well
defined operator action to prevent fuel
temperature excursion.
Production of U-metal ingots was continued and
utilised for fuel fabrication for research reactors,
proposed Sub-cirtical Facility at Purnima and
specific requirements at Metallif Fuels Division
(MFD).
Physics
CIRUS Reactor has been used for neutron
tomography of hydrogen blister in Zircaloy and
for neutron based phase contrast imaging of
substances embedded inside dense material.
A high power/high energy Nd:Glass laser system
of 20 joules and pulse width 300 – 800 pico
second with focusable intensity better than
5 x 10 14 watts/cm 2 has been indigenously
developed. This laser system has been used to
generate shock pressure exceeding 25 Mega bar
in several materials.
The performance of the indigenously developed
Folded Tandem Ion Accelerator (FOTIA) has
been steadily improving. Recently, the proton
beam current from this accelerator has reached
a high value of 2 micro amp, one of the best
values one can get from a low energy
accelerator of this type.
Materials and metallurgy
A process for the separation of rare earths
comprising of yttrium as major constituent, along
with erbium, holmium, ytterbium as minor
components from merchant grade phosphoric
acid, employing DNPPA+TOPO as synergistic
extractant mixture, was developed by selective
scrubbing with 40% sulphuric acid. The scrub
solution was further subjected to sodium double
sulphate precipitation, followed by re-dissolution
and oxalate precipitation and conversion to oxide.
The rare earth product was purified to > 99%,
with respect to sodium by digesting with hot
water. Counter-current tests showed overall
90% recovery.
Development of tubular solid oxide fuel cell
(TSOFC)
Process has been established to fabricate single
SOFC cell of tubular configuration (both in
anode and cathode supported ) through coisostatic pressing followed by co-firing. Anode
supported cell was found to give a maximum of
62 mW.cm -2 power density when tested at
900 oC. Work is in progress to improve the
performance by addressing the issues related
to fuel distribution, sealing and current collection
of SOFC cell.
Development of catalyst material for
decomposition of sulphuric acid in I-S
processes for hydrogen production
A process has been developed for bulk
preparation of iron oxide based catalyst pebbles
for use in the decomposition of sulphuric acid in
I-S processes for hydrogen production. The
catalyst showed high (~78%) yield for
conversion of H 2SO4 to SO 2 with long run
stability. Bulk preparation is under progress for
carrying out pilot test in Chemical Technology
Division
The stress corrosion crack growth rates in
AHWR simulated high purity water at 288
degree C in a recirculating test facility have been
successfully established on the materials
proposed to be used in AHWR. SS 304L with
addition of 0.08 and 0.16 wt% nitrogen were
used in sensitized condition and also in as –
received materials with 20% warm working
(non-sensitised) conditions. These results on our
ISSUE NO. 318
I JAN - FEB 2011 I
7
BARC NEWSLETTER
materials to be used in AHWR provide important
inputs about crack growth behaviour of the
materials. Stainless steels have been proton
irradiated at FOTIA and at PELLETRON at
4.8 MeV and at a temperature of 300 degree
C. The Radiation Induced Segregation (RIS) has
been successfully characterised using a new
approach of electrochemical and atomic force
microscopic characterisation.
The measurements carried out up to 3270 K at
a height of 400 mm were compared with the
estimated values for the thermal velocity,
terminal Mach number velocity and velocity due
to internal conversion of energy from metastable energy levels upto 5000cm-1 into kinetic
energy.
Lasers and Accelerators
As a part of the ongoing programme on
generating an ultra precision frequency reference
for atomic clock, a coherent population trapping
signal with a width of 14 KHz was achieved
through use of a special vertical cavity laser with
RF modulation and side band generation.
10 MeV Linear Accelerator (Linac)
The depth dose distribution of the electron beam
of the 10 MeV RF linear electron accelerator
were measured using B3 Radiochromic films.
The electron beam has been employed for
demonstrating industrial applications towards
cross-linking of poly-ethylene rings (more than
1 lakh pieces), diamond coloration, Teflon
degradation and production of photoneutrons.
BARC- ECIL RF LINAC
The 9 MeV cargo scanning RF Linac was
operated with beam parameters of 9 MeV, 60
mA, 7 microsecond duration at 250 Hz pulse
repetition rate. Experiments on electron beam
transport and beam focusing at X-ray target were
carried out. X-ray spot size of 2.5 mm diameter
on the target and a dose of 24 Gy/minute at 1
meter from the target was measured. The Xray collimator has been developed and installed.
AVLIS programme
The knowledge of the velocity of atomic beam
and thermal ion content is important in various
processes involved in our AVLIS programme.
The experimental measurements of atomic flux,
flow velocity and thermal ion content were
carried into a 100kW zirconium evaporator using
micro-balance and Langmuir probes.
8
I
ISSUE NO. 318
I
JAN - FEB 2011
Demonstration of narrow CPT Resonance
Test Blanket Module (TBM) development
for ITER programme
As a part of Test Blanket Module development
for Indian ITER programme, joint MHD
experiments at high magnetic fields with BARCIPR Test-sections at Institute of Physics,
University of Latvia (IPUL) have commenced
and experimental test-sections made of austenitic
steels have been tested.
Development of 15 kV, 6 kW Electron Beam
Melting Machine
An indigenous 15 kV, 6 kW Electron beam
melting machine was designed and developed.
This computer controlled machine will be used
for production of high purity Uranium and
Thorium alloys in the form of buttons, rings and
fingers by EB melting and consolidation.
DM&AG
An Autonomous Guided Vehicle (AGV) based
Material Transfer System has been developed,
which can be used in manufacturing
environments for autonomous transfer or
BARC NEWSLETTER
distribution of materials from a supply point to
several machining shops. The same solution
can also be used for unmanned transfer of
radioactive materials in nuclear installations like
Board of Radiation & Isotope Technology
(BRIT), Nuclear Fuel Complex (NFC), etc.
The system autonomously monitors stock levels
at the delivery points and initiates appropriate
transfers to maintain uniform satisfaction at all
delivery points.
ChTG/RMP
Design, development and manufacturing of a
prototype batch of Micro Electro Mechanical
Systems (MEMS) based pressure and optomechanical pressure sensors using micro-nano
engineering technology has been successfully
completed.
With the successful criticality crossing of a
prototype Advanced Multi-section metallic High
Speed Rotor, capacity of producing the
separative output of the existing machines will
be doubled.
About 1800 acres of land in Challekere Taluk
of Chitradurga District has been acquired for
setting up of Special Material Facility during the
XII Plan.
Prototype Tritium monitors based on
Bremsstrahlung technique have been
successfully developed.
Computational Analysis Division
A five (5) Teraflop High Performance
Computing Facility has been set up at the Facility
for Electromagnetic Systems (FEMS), BARC,
Visakhapatnam. A variety of in-house codes
have been parallelized for efficient use of this
system. By end-2011, it is proposed to upgrade
this to a 20 Teraflop system.
An electromagnetic coil-gun, accelerating
metallic projectiles weighing 30-50 grams to
velocities upto 100 meters/sec, has been set up
and in regular operation. A 2-D MHD computer
code, developed in-house for modelling this gun,
has yielded good agreement with experiments,
and is being used for optimization. The gun,
which yields reproducible results, will be used
for studying high velocity impact and penetration
phenomena.
Development of Instrumented and Caliper
Pipe Inspection Gauges (PIGs)
In continuation with the development of
instrumented pigs and caliper pigs for in-line
inspection of pipelines, tools for 24" nominal bore
pipelines have been integrated and delivered to
Indian Oil Corporation (IOC). They are tested
in wet evaluation facility of IOC R&D Centre,
Faridabad. The instruments use state-of-the-art
digital signal processing (DSP) electronics for
acquisition and on-line processing of magnetic
flux leakage data. 12" instrumented PIG
developed earlier is upgraded and successfully
run for 200 km of Allahabad-Kanpur section of
IOC pipeline. The defect report has been used
for repairing severe defects.
Basic Research in Chemistry
An indigenous synthesis of the ligand, MIBI has
been developed and used successfully for the
preparation of the heart imaging agent, Tc-MIBI
complex. Following the approval by the
Radiopharmaceutical Committee, the product is
currently being marketed by BRIT and supplied
to the hospitals of Maharashtra. This is an import
substitute and has reduced the cost of the
medicine drastically.
ISSUE NO. 318
I JAN - FEB 2011 I
9
BARC NEWSLETTER
A new pyromethene (PM) laser dye, with
significantly improved photo-chemical stability
than the commercially available dye has been
designed. The new dye shows similar lasing
efficacy as that of the commercial one, and is
currently being considered for use in the Uenrichment programme.
Using Microwave Plasma Chemical Vapour
Deposition (CVD) technique, high quality and
highly oriented CVD diamond thin films were
grown on silicon wafer (1-5 cm2 area) to make
alpha detectors, configured in the form of metalinsulator-semiconductor hetero-structure. The
detectors were successfully tested for alpha
sensitivity in air, using electroplated 238Pu source.
A granular biofilm based process for
denitrification of high strength nitrate-bearing
effluents generated in the nuclear industry has
been developed. Denitrification of upto
12,000 mg/l nitrate was achieved in lab scale
bio-reactors. Effluent nitrate/nitrite levels at the
end of 24 h cycle time were less than 10 mg/l,
which can be safely discharged to the
environment.
A biological process is under development for
the removal of sulphate from sulphate-bearing
barren effluents, such as those produced at
Uranium Corporation of India Ltd. (UCIL),
Jaduguda. In this method, a series of three bioreactors employing sulphate reducing bacteria
was used to sequentially bring down sulphate
concentration from 18,000 ppm to below 100
ppm. Experiments are being conducted to
reduce operational cost by making use of cheap
carbon sources for the growth of the SRB.
A fuel cell based hydrogen burner has been
developed for burning the deuterium formed
during chemical decontamination and the
deuterium formed in stoichiometric excess in the
moderator cover gas during normal operation.
10
I
ISSUE NO. 318
I
JAN - FEB 2011
The method consists of a fuel cell and a heated
palladium catalyst column as pre-treatment
facility for removing oxygen from deuterium. The
catalyst column ensures the removal of oxygen
from deuterium and the pure deuterium coming
from the catalyst column is allowed to pass
through the fuel cell, where it combines with
oxygen to form D2O.
Nuclear Agriculture
A new mungbean variety TM-2000-2 (Pairy
mung) with early maturity and disease resistance,
suitable for rabi and utera (rice fallow) cultivation
conditions has been released and notified for
Chhattisgarh State. The total number of
Trombay crop varieties released and notified by
Ministry of Agriculture, Government of India
for commercial cultivation has now reached 39.
In groundnut, two simple sequence repeat (SSR)
markers were found to be tightly linked with rust
resistance gene for use in marker assisted
breeding.
Rainwater harvesting facility was developed at
agricultural farm of Nuclear Agriculture & BioTechnology Division (NABTD), BARC,
Gauribidanur for breeder and nucleus seed
production.
45 Nisargaruna solid waste treatment plants
were established in various places in the country
under the guidance from BARC.
Technology Transfer and (Advanced
Knowledge and Rural Technology
Implementation) (AKRUTI) programme
Besides filing three international patents, and
one national patent based on in-house R&D
activities, seven new technologies in the area of
safe drinking water, one in medical electronics
and one in solid waste management were
transferred to industry successfully.
BARC NEWSLETTER
As a part of development of BARC Centre for
Incubation of Technology (BARCIT), civil,
electrical, air-conditioning work at the five
Technology Incubation Cells are in advanced
stages of completion and are likely to start the
operation by March 2011, under Phase I of the
operation of BARCIT.
Among the ten MoUs signed with different
organisations during the year, commercial use
of KRUSHAK Irradiator, Lasalgaon by
Maharashtra State Agriculture and Marketing
Board (Pune) and Barge Mounted Sea Water
Reverse Osmosis Plant for Production of
Drinking Water, by IREL are noteworthy.
BARC has signed seven AKRUTI Tech Pack
agreements for deployment of technologies in
rural sector. These include four private
companies, 2 NGOS and one woman
entrepreneur. Tissue Culture Laboratory at
AKRUTI-CARD (Centre for Appropriate Rural
Development) in Anjangaon-Surji, Amravati has
become operational.
Isotope Hydrology based identification of bore
well location has been successfully implemented
in AKRUTI-CARD (Community Action for
Rural Development), Amaravati in a water
scarce area. The farmers were asked to drill
borehole about 60 m deep at the identified site
at Anjangaon village, Amravati district,
Maharashtra. The borehole is now yielding
~30,000 Litres of water per hour and is a
perennial source of good quality drinking water
for 5- 6 villages. Encouraged by the success of
the model project, six more projects are
underway.
Medical Services
As you all know, our BARC hospital, along with
its 12 zonal dispensaries caters to more than
87,000 registered beneficiaries, While every
effort is being made to improve our on-line
services, two new machines viz., Radial Fluro
X-ray machine and Computerised Radiography
System have been installed and are being used
for needy patients. The newly renovated ward
4A is now made available, along with 18 normal
beds, 6 air conditioned beds and 14 emergency
beds to the patients. It is also proposed to
introduce new dispensary at Kharghar, Navi
Mumbai for the convenience of the beneficiaries
of Navi Mumbai. Land for this dispensary has
already been occupied, and further work is
under progress. It will take 3 years for full
functioning of this dispensary.
A multiplex polymerase chain reaction (PCR)
protocol, involving two genes for detection of
tuberculosis, was standardised and validated. It
has been given to BRIT for the formulation of a
TB detection kit and its commercialisation.
177
-Lu labeled dotatate synthesised in-house is
being used for radiotherapy of neuroendocrine
tumors at RMC. With the installation of a new
Dual Head Gamma Camera, it has become
possible to handle more number of cancer
patients in RMC now.
XI Plan activities
We are shortly coming to the close of our XIth
plan project activities. In order to formulate our
programmes for the XIIth plan project, it is
essential to critically review our progress and
judiciously extrapolate to decide about closing
the projects or, if necessary, continuing under
the next plan. This process is currently on through
various group Boards. Based on the outcome
of this activity, we will be in a position to put up
new programmes under the next plan. I earnestly
appeal to all of you to timely contribute to this
process.
ISSUE NO. 318
I JAN - FEB 2011 I
11
BARC NEWSLETTER
Physical Protection
Physical protection of our Centre and its various
installations is of paramount importance. I am
sure, all my colleagues will understand that the
concern of security has further increased in the
present time. I strongly urge our Fire Service
personnel to maintain a constant vigil on the
various establishments of our centre and strive
to improve their coordination with security and
the concerned Divisions.
I also compliment all officers and staff of our
Centre for extending their cooperation with the
security personnel in discharging their duties
effectively for implementing the higher level of
security procedures. Finally, I urge all my
colleagues in our Centre to remain vigilant and
alert in the present environment.
The contribution made by the personnel of our
Landscape & Cosmetics Maintenance Section
is aptly demonstrated by the beautiful ambience
of this venue.
Conclusion
My dear colleagues, on one hand, we have
committed ourselves to be at the frontiers of
science and technology at international level. On
12
I
ISSUE NO. 318
I
JAN - FEB 2011
the other hand, we also have a commitment to
provide benefits of our knowledge and
technologies to the Indian society at large, at all
levels. You may know very well that it has been
our mandate to develop national capability in all
areas associated with nuclear sciences and
technologies and our fulfillment of this mandate,
inspite of an embargo regime, has been the key
to make us strong enough to acquire a
pronounced international stature. This spirit of
self-reliance and development of indigenous
solutions must continue. Currently, we are in
the process of formulating our ideas for the XII
Five Year Plan period. Let us carry out a rigorous
analysis of any residual gaps and vulnerabilities
and formulate projects and activities to bridge
the gaps indigenously.
I am sure, all of you will continue to put in your
efforts so as to sustain our tradition of excellence
in the years to come.
Friends, therefore, on this very special day, let
us firmly resolve and rededicate ourselves to
continue our pursuit of excellence in the frontier
areas of nuclear science and technology for the
betterment of life of our people.
Jai Hind ”.
BARC NEWSLETTER
Our Gratitude to Dr. Homi J. Bhabha
Dr. S.V.K. Rao
(Retd. Head, Ceramics Section, Metallurgy Divn., BARC)
Scientists and Engineers in the OYC building, I
could gather my impressions about Dr. Bhabha
and how he created such a huge Scientific
Establishment at Trombay, in such a short time.
Initially the Honourable Prime Minister Pandit
Jawaharlal Nehru invited Dr. Bhabha and asked
him to plan the entire developmental process of
Atomic Energy for power generation and other
peaceful applications for India. Dr. Bhabha was
given Carte Blanche to put his plan into action.
Dr. Homi J. Bhabha
In 1956, I joined the AEET, Atomic Energy
Establishment Trombay, (later renamed BARC)
in the Metallurgy Division, operating from the
Old Yatch Club (OYC) Building near the
Gateway of India. This building housed Dr.
Bhabha’s office, Administrative, Accounts and
Purchase Divisional offices and some Labs
including the Metallurgy Lab.
The entire BARC campus, as we see now, was
non-existent and it was the vision of Dr. Bhabha
and his team which has made it possible.
Through my interaction for some 8 years with
the Administrative, Accounts and Purchase
Divisional staff and with some of the other
Dr. Bhabha himself selected a team of well
qualified, experienced and very competent
Scientists and Engineers representing all the
major Scientific and Engineering fields and gave
them full freedom to plan, recruit staff, expand
and diversify, and set up their R&D Labs and
installations. Several newly appointed Scientists
and Engineers were deputed to Canada, USA,
UK and France to work there and gain
experience in operating power reactors. I was
fortunate to have been deputed to the Atomic
Energy of Canada Ltd. (AECL), where I had
the opportunity to carry out research
investigations on the development of Ceramic
Nuclear Fuels and their irradiation behavior. Dr.
Lewis, the Chairman of AECL, was known to
be a great friend of Dr. Bhabha from their
Cambridge University days and extended
training facilities to a large number of Scientists
and Engineers from BARC. The CIRUS
Research Reactor at BARC is the outcome of
this Indo-Canadian co-operation.
Most of the engineering equipment and
installations, for large scale Civil Engineering
ISSUE NO. 318
I JAN - FEB 2011 I
13
BARC NEWSLETTER
constructions and infrastructure and
sophisticated scientific equipment were acquired
for AEET, through the offices of Dr. Bhabha as
Secretary, DAE and Chairman/AEC. This
expedited the entire process.
Dr. Bhabha identified reputed and well
established large private organizations with
proven track records, competence and integrity
and gave assignments to them for the execution
of the jobs. Thus, by a combination of all these
factors, he could build such a huge establishment
in such a short time.
Dr. Bhabha wanted the R&D labs of all the
scientific disciplines to be under one roof, as it
would facilitate carrying out multidisciplinary
R&D projects. So we were all asked to design
our respective Labs on a modular design basis,
so that, each module would have all the service
facilities. Thus the Modular Laboratories came
into being. Dr. Bhabha was particular that the
building should not block the view of the Sea,
therefore, he wanted it to be raised on pillars.
Our Chief Engineer (Civil) and his staff told me,
that they went through tense moments of
suspense when Dr. Bhabha came and scrutinized
the 3- dimensional scale model of the building.
He studied the model for a long time silently
and seriously and finally gave his approval. He
was very fond of Architecture and wanted all
the buildings on the campus to be of different
geometrical shapes, so that, they did not look
stereotyped and boring. The whole campus was
landscaped with lavish lawns, flower beds and
gardens and thus provided pleasant
surroundings.
One of the major steps that Dr. Bhabha had
taken was, to delink the Public Service
Commission from our staff recruitment
programme. He justified this by saying, that
scientific work in Atomic Energy areas was of
14
I
ISSUE NO. 318
I
JAN - FEB 2011
a very specialized nature and our multidisciplinary
qualified Scientists could take care of staff
recruitments. Subsequently, the Training School
was started in 1957, which has been providing
qualified entry level Scientists and Engineers for
various programmes and projects of BARC as
well as DAE.
Initially the designations of the Scientific staff,
to give a few examples, were Junior Scientific
Officer, Scientific Officer, Senior Scientific
Officer, Principal Scientific Officer and Chief
Scientific Officer etc. Dr. Bhabha wanted to
create an atmosphere of equality among the
scientific community, which wouldn’t be rank
conscious. To this end, he changed the
designations in such a way, that all were
Scientific Officers- SOs with only ascending
alphabets within brackets, which showed their
seniority. Thus they were changed to SO(SC),
SO(SD), SO(SE), SO(SF), SO(SG) etc.
Dr. Bhabha was fully aware of the hardships of
lack of accommodation, commuting over long
distances, and unaffordable medical expenses
of a big-city life for new entrants to our
organization. He took care of all these problems.
He planned a huge township of staff quarters in
Anushaktinagar. As this ambitious plan would
take several years to complete, he arranged to
purchase outright, any group of newly
constructed residential buildings put up for sale,
wherever available in the city and suburbs. Such
groups of buildings were purchased and
converted to staff quarters in many locations in
the city and suburbs. From all these widely
scattered locations, depending on public transport
for commuting to the Establishment in Trombay
was real hardship. To solve this, Dr. Bhabha had
put forth, that in a large establishment with
thousands of employees, in case of a nuclear
event, the entire staff would have to be vacated
very rapidly. This would require a large fleet of
BARC NEWSLETTER
buses on the campus, maintained in running
condition. BARC is thus one of the few R&D
centres in Mumbai, which offers transport
facilities to its employees.
According to Dr. Bhabha, most of the
Laboratories handle radioactive materials in an
Atomic Energy Establishment and if the staff
members get exposed to radiation, despite all
precautions, the treatment would require very
specialized medical facilities. Eventually a very
large centralized full-fledged Hospital was built
and set up, with numerous dispensaries in many
locations. The entire medical treatment for the
staff and their families is highly subsidized.
I can never forget the unfortunate day, January
24th, 1966. On that day in the evening, we were
standing outside, opposite the Modular
Laboratory, waiting for our buses. I suddenly
saw a couple of cars come rapidly and stop on
the Mod Labs side of the road. Across the road,
I could see Dr. Bhabha and others getting down
from their vehicles. Dr. Bhabha was silently
looking at the Mod Labs building which was in
an advanced stage of construction, as though
taking a last look. After observing for a while,
they all went away. None of us standing there
realized that it was to be our last glimpse of Dr.
Bhabha. That night Dr. Bhabha left by an Air
India flight to Paris. Next day we were all
shattered to see screaming headlines in the
newspapers that Air India Flight AI 101 had
crashed in Europe by colliding against the snow
clad Mount Blanc peak of the Alps and that there
were no survivors. In fact, Dr. Bhabha was to
take the same flight exactly one day before the
previous night, for which he was booked. But
due to a mishap in one of the Technical Physics
Labs at South Site, Dr. Bhabha had to visit the
site and postpone his journey by a day, only to
leave by the fateful flight. It was the hand of
destiny. It was a great loss of a person who had
done so much for all of us, and for the whole
nation.
Thus, today the staff of BARC are housed in
decent staff quarters, commute in BARC buses,
and have excellent medical facilities and as
regards working environment, all the buildings,
Labs as well as offices are centrally air
conditioned with a beautiful environment of well
maintained green lawns, flower beds and
gardens. For the scientists, the legacy of Dr.
Bhabha continues, which enables them to work
in an atmosphere of equal opportunity,
encouragement and recognition of merit. Unlike
many other Government Departments, our
BARC Administrative, Accounts, Purchase,
Stores and Security staff are exceptionally
sincere, dedicated and very helpful, consistent
with the BARC culture and carrying on the
legacy of Dr. Bhabha.
After Dr. Bhabha, successive Chairmen of AEC
and Directors of BARC, have taken BARC and
all the constituent Units under DAE, to greater
heights of achievements.
Now after retirement, whenever I interact with
our BARC Doctors and staff, the dedicated
care, sincerity, courtesy and commitment they
show, reminds me of the legacy of Dr. Bhabha.
And occasionally whenever I phone our
Administration or Accounts, for some
clarification, I find that even very senior officers,
unlike in many other Govt. Departments, respond
promptly with courtesy and sincerity, reflecting
the culture inculcated by Dr. Bhabha.
Even today, 21 years after retiring from BARC,
all this makes me to continue to be grateful to
Dr. Homi J. Bhabha.
ISSUE NO. 318
I JAN - FEB 2011 I
15
TECHNOLOGY DEVELOPMENT ARTICLE
BARC NEWSLETTER
Development of Technologically Important
Crystals and Devices
S.G. Singh, M. Tyagi, D.G. Desai, A.K. Singh, Babita Tiwari, Shashwati Sen,
A.K. Chauhan and S.C. Gadkari
Technical Physics Division
Abstract
Device-grade single crystals of technologically important materials for use as scintillators in nuclear radiation
detection, lasers and optical devices are grown in Crystal Technology Section of the Technical Physics Division.
The expertise has been developed to establish crystal growth processes and design and fabricate crystal
growth equipment. In addition, single crystals of new materials to be used in neutron and gamma detection are
also being studied and developed currently. The processing, characterization and testing of devices are carried
out using in-house facilities as well as in collaboration with other Divisions.
Introduction
Though research on nano-materials is in full
swing, single crystals are still on the top in vital
areas like radiation detection (γ-ray, X-ray,
neutron, IR), solid state lasers, optical windows
etc, and even in nano technologies like thin films
and quantum dots, the substrates used are
invariably made from single crystals. Due to their
technological importance and denial by developed
countries there is a dedicated facility for single
crystal growth in BARC (Crystal Technology
Section, T.P.D.). Broadly there are three
categories of crystals that are of current interest;
(i) Scintillator crystals, (ii) Laser host crystals
and (ii) Optical crystals. These are grown from
melts using Czochralski and Bridgeman
techniques for the single crystal growth.
The materials which convert the energy of high
energy electromagnetic radiation (short wave
length X-ray, gamma-ray, UV) or particles
16
I
ISSUE NO. 318
I
JAN - FEB 2011
(electron, proton, alpha etc) into visible light are
called scintillator materials and used in radiation
detection. Since the discovery of NaI:Tl doped
scintillator crystal in 1948 [1], this field developed
very fast and presently many brilliant scintillator
materials are in fray. Few important scintillators
among these are CsI:Tl, Bi 4Ge 3O 12 (BGO),
PbWO 4 (PWO), PbMoO 4 (PMO), CdWO 4
(CWO), ZnWO 4, Lu 2SiO5 (LSO), Lu 2Si 2O 7,
LaBr 3:Ce, Li 6 Gd(BO 3 ) 3 (LGBO), Li 2 B 4 O 7
(LBO), NaBi(WO4)2 (NBW) etc [2-4]. Among
these crystals CsI, LGBO, LBO, PMO and
NBW are presently being grown in our lab while
NaI, PWO and BGO have been grown in the
past.
Some oxide and halide crystals doped with rare
earth elements (Nd, Yb, Ho etc) are important
solid state materials for generating laser light in
visible to infrared region. Important among these
are Nd:Y3Al5O12 (Nd-YAG), Al2O3:Cr (ruby),
double tungstates NaY(WO 4 ) 2 (NYW),
BARC NEWSLETTER
TECHNOLOGY DEVELOPMENT ARTICLE
NaGd(WO 4) 2 (NGW), NaLa(WO 4) 2, NBW,
KY(WO4)2, KGd(WO4)2 etc. [5]. Currently, we
are involved in the growth of Nd doped NYW
and Yb doped NGW crystals. These crystals
will be used in the diode-pumped high power qswitched lasers due to their broad absorption and
emission bands arising from their disordered
structures.
Optical window is a piece (mostly circular but
sometimes rectangular, optically flat and parallel
disc) of a transparent optical material that allows
light (for a wavelength range of interest) into an
optical instrument isolated from vacuum or other
medium. Highly transparent optical windows in
deep UV and IR region are technologically
important. The materials to be used in these
applications should have large band gap, isotropic
and of good mechanical properties. Most popular
materials used in optical windows are CaF2, LiF,
BaF2, ZnS etc [6]. At present we are involved
in the growth of farmer three crystals.
Other crystals that have been grown in our lab
in the past are lead germanate, Al2O3, YAG, KCl,
NaCl and KBr etc.
of the solid favors the reduction of free energy.
This process is known as “nucleation”. Once
the system (vapor, melt, or solution) is in thermal
equilibrium with its nucleus, the latter is capable
of growing by attaching more and more material
to it, and this process is termed as “growth”.
There are various methods for the growth of
single crystals e.g. melt growth, high temperature
solution growth, low temperature solution growth,
vapor deposition growth, hydrothermal growth
etc. [7]. Nearly 80% of all the single crystals
are grown by melt growth techniques. Due to
relatively faster growth rates the melt growth is
suitable for large scale production. Different
techniques employed for the melt growth, are
mainly (i) Czochralski technique, (ii) Bridgman
technique, (iii) Float Zone technique and (iv)
Verneuil technique. Among these Czochralski and
Bridgman techniques were used to grow most
of the halide and oxide single crystals for
materials study as well as for the industrial
production. A brief description of these two
popular single crystal growth methods is given
here.
Czochralski Technique
Crystal
Growth
Instruments
Techniques
and
The crystal growth process involves a change
of phase, where the molecules of the material
gradually, uniformly and continuously lose their
random character (in liquid form) and achieve
crystalline solid character. Single crystal growth
proceeds on a seed crystal (may be of same
material) that provides a nucleation center for
the growth. In the absence of a seed crystal, it
is necessary for a system to super-cool or to
attain a certain degree of super-saturation. Such
super-saturated solutions are in the metastable
states. Due to thermodynamic fluctuations, tiny
solids called nuclei emerge when the critical size
This technique was first developed by Jan
Czochralski (after which it was named), a polish
chemist, in 1918 [8]. The Czochralski technique
(Cz) is a popular method of crystal growth
because it can produce large, dislocation free
crystals at a relatively faster rate. In Cz technique
crystal is grown by slow pulling of a seed/wire/
capillary from the free surface of a melt
contained in a crucible. A growth station, to
contain crucible and minimizes heat losses (by
conduction and radiation), is made using
appropriate ceramic tubes, felts, and wools.
Material to be grown is melted in the crucible by
heating it in a suitable furnace (resistive heating,
RF heating, Arc heating). A seed is lowered in
ISSUE NO. 318
I JAN - FEB 2011 I
17
TECHNOLOGY DEVELOPMENT ARTICLE
BARC NEWSLETTER
to the melt, and then pulled (at a rate 0.2-5 mm/
h) along with rotation (5-25 rpm) at a slow rate
after achieving dynamic equilibrium at the solidmelt interface. After the completion of crystal
growth with desired length, the process is
terminated by suitably adjusting pull rate and
temperature at the solid-melt interface. The
grown crystal is, then, cooled down to room
temperatures at a slow cooling rate suitable for
the material.
During the growth the melt temperature is nearly
constant in normal conditions (no stoichiometric
deviation due decomposition and dissimilar
evaporation of melt components). The shape of
the crystal can be determined by controlling the
diameter of the growing crystal through the
manipulation of the melt temperature and pull
rate depending on properties of the material
under consideration.
Theoretically, every material that melts
congruently and does not undergo any phase
transition during cooling, can be grown by this
technique but there are some practical restrain
which put some limits on the material properties
which can be grown by this technique [7]. These
limits are:
i)
ii)
iii)
iv)
Suitable crucible material (should be
unreative, withstand high temperatures,
easy in cleaning, easy in fabrication, e.g.
Pt, Ir etc).
Material should have a low vapor
pressure. (Though there are modified
method for the growth of such materials
but not very convenient)
Thermal conductivity of the material
should be high (to conduct away the heat
released from crystallization at the
solid-melt interface).
Materials in crystalline form should not
have pronounced cleavage planes.
18
I
ISSUE NO. 318
I
JAN - FEB 2011
Bridgman Technique
This method is based on the work of Bridgman
in 1925 [9]. This is a popular technique to grow
single crystals of various halides. In this method
temperature gradient moves slowly relative to a
crucible (vertically or horizontally) until the melt
in the crucible solidifies. The main economic
advantage of the method is simple basic
apparatus, and little operator attention.
Disadvantages arise from the contact between
container and melt/solid which can give spurious
nucleation, sticking of the crystal ingot inside the
crucible and consequently generating thermal and
mechanical stresses. Therefore to choose
appropriate crucible material and its proper
processing and design are important
considerations. The system consists of two
heating zones controlled independently and
separated from each other using a baffle to
increase the temperature gradient and minimize
temperature fluctuations (Fig.1). A crucible
containing the material is kept in the upper zone
(hot zone) for complete melting then it is slowly
lowered (1-5 mm/h) to the lower zone (cold
zone) through an optimized temperature gradient
until complete solidification.
A modified form of Bridgman method and
probably simplest method for directional
crystallization is gradient freeze technique. In
this method freezing isotherm is moved by slowly
reducing the power input to the furnace. The
main advantage lies in absence of any movement
of either furnace or crucible which eliminates
any possibility of vibration or other mechanical
problems. Though it is difficult to keep a constant
growth rate throughout the crystal growth
process due to a relatively small temperature
gradient (otherwise temperatures at the top of
the furnace will be out of limit), though in some
cases it is achievable by a segmented cooling
program in accordance with the temperature
gradient to keep the rate of movement of freezing
BARC NEWSLETTER
TECHNOLOGY DEVELOPMENT ARTICLE
isotherm constant.
Fluorides crystals are grown in vacuum Bridgman
furnace which consists of vacuum chamber
containing a graphite heater. Electrodes and
translation mechanism are isolated from vacuum
chamber by different types of sealing. The
growth usually commence under high vacuum
conditions.
Growth of Single Crystals
Scintillator Crystals
There are two categories of scintillator crystals
that are grown at present namely (i) halides (CsI,
NaI) and (ii) oxide crystals (PWO, PMO, ZWO,
BWO, NBW). Halide crystals are generally
grown by Bridgman technique while oxide
crystals are grown by Czochralski technique.
at high temperatures [10]. Here we describe the
growth of cesium iodide crystals up to size of 40
mm diameter and 40 mm length employing two
different methods
(i) Using graphite crucibles by vertical
Bridgman technique:
Single crystals of cesium iodide were grown in
the resin impregnated graphite crucibles [10].
To demonstrate the use of the present method,
a graphite crucible that had polished inner
surfaces was loaded with the high purity
anhydrous CsI (having 0.2% Tl) material and
placed in a silica glass ampoule. The ampoule
was evacuated and sealed under a pressure of
10-2 mbar. A home-built Bridgman crystal growth
system (Fig.1) was used that has a three zone
furnace operating in the normal ambient
conditions by two independently controlled heater
elements.
Alkali Halide Scintillator Crystals
High quality single crystals of alkali-metal halide
material are important as optical elements and
as scintillation crystals in various types of
radiation detectors. Among these sodium iodide
(NaI) and cesium iodide (CsI) activated with
thallium occupy important place in gamma-ray
spectroscopy and high energy particle detection.
Scintillation properties and radiation hardness of
these crystals are highly sensitive to crystal
growth condition and post growth treatment.
These crystals are generally grown in crucibles
of noble-metals (platinum, platinum-alloy, iridium
etc.), silica glass or ceramic employing the
Bridgman technique. While the noble-metal
crucibles are very expensive, the silica glass and
ceramic crucibles have several inherent
problems such as crucible contamination and the
grown crystals adhering to the crucible.
Extraction of grown crystals is very difficult and
invariably requires an inversion of the ampoule
Fig. 1: Schematic of Bridgman furnace for growth of alkali
halide crystals.
The crucible sealed in the silica glass ampoule
was located in the upper zone and the
temperature was raised to about 650°C to melt
the material. After attaining equilibrium the
ampoule was lowered at a rate of about 1.5 mm/
h through a temperature gradient of about 20°C/
cm. The lowering was stopped when the crucible
in the silica glass ampoule reached the lowest
zone and held here at about 550°C for 2 h before
ISSUE NO. 318
I JAN - FEB 2011 I
19
TECHNOLOGY DEVELOPMENT ARTICLE
BARC NEWSLETTER
finally cooling down to the room temperature at
a rate of about 50°C/h. The silica glass ampoule
was cut open and the grown crystal could be
easily removed from the graphite crucible. Both,
the ampoule and the crucible were reusable for
the next several experiments.
(ii) Using carbon coated silica by gradient
freeze technique:
A crystal growth furnace has been designed to
have a positive temperature gradient from top
to bottom. Plot ‘a’ of Fig. 2 shows the gradient
of the furnace with a blank crucible.
Temperature profile in the melt is shown in plot
‘b’ in the figure. Silica crucibles of one inch
diameter and having conical bottom were used
for the growth. Carbon coating on the inner
surfaces of the crucible was carried out by
cracking of organic solvents at high temperatures
Fig. 2: Temperature gradient of gradient
freeze furnace with blank crucible (a) and
with crucible containing melt (b).
Fig. 4: Transmission (a) and
luminescence spectra of CsI:Tl shown in
Fig. 3.
20
I
ISSUE NO. 318
I
in an inert ambient. As-coated crucible was then
transferred in a vacuum furnace and annealed
at 1100ºC. High pure (99.995%) and dry CsI
and Tl (0.2 mole%) were taken in the carbon
coated crucible and sealed under 10 -3 mbar
running vacuum at 200ºC. Crucible was then
placed inside the furnace on a growth station
and temperature of the furnace was raised so
that the bottom of the crucible was at 640ºC
(about 20ºC higher than the melting temperature
of the CsI). The melt was kept at this
temperature for about 4 h and then the furnace
was cooled at a rate of 4ºC/h until complete
solidification of the melt into single crystal.
Photograph of a polished CsI:Tl single crystal is
shown in Fig. 3.
Though both the methods yielded good quality
crystals, the later one is simpler and is more
suitable for production of the crystals at
industrial levels.
Characterization of
grown crystals was
done by recording
transmission and
photoluminescence
spectra.
Typical
transmission and
luminescence
spectra are shown
in Fig. 4. Scintillation
Fig. 3: Photograph of a polished single
properties
were
crystal of CsI:Tl grown by gradient freeze
technique in carbon coated crucible.
tested on a homebuilt
gamma spectrometer.
Linearity of the
pulse height response
of
a
detector
fabricated
using
the grown crystal
was checked up to
1332 keV gamma
photon. A calibration
Fig. 5: Calibration line (a) of gamma detector
fabricated using crystal shown in fig.3 along
curve
for
the
with typical gamma spectra of 137Cs (b).
detector is shown in
JAN - FEB 2011
BARC NEWSLETTER
TECHNOLOGY DEVELOPMENT ARTICLE
Fig. 5 and a typical 137Cs gamma spectrum is
shown in the same figure exhibiting an energy
resolution of ~7.8% at 662 keV which is
comparable to or better than reported values.
Oxide Crystal Scintillators
High density, ultra radiation-hard luminescent
oxide crystals are forerunners in the fray for
applications in high energy particle detection in
ultra high energy particle accelerator like LHC.
Search for an ideal scintillator crystal having high
density, ultra radiation-hardness, fast decay time,
inert to ambient and high light output is going on
for the past half century. Bi4Ge3O12, PbWO4,
PbMoO 4 , CdWO 4 , ZnWO 4 , Lu 2 SiO 5 :Ce,
Lu2Si2O7:Ce, Li2(1-x)Y2xSO:Ce, and NaBi(WO4)2
are a few crystals which fulfill most of the, if
not all, properties of an ideal scintillator. Among
these Lu2SiO5:Ce, Lu2Si2O7:Ce, Li2(1-x)Y2xSO:Ce
are the most prominent candidates owing to their
high light yield and fast decay constant but their
growth is relatively difficult due to their high
melting temperatures (> 2000ºC). Another
drawback is their high cast due to the use of
lutetium which is very rare. On the other hand
Bi4Ge3O12, PbWO4, PbMoO4, and NaBi(WO4)2
are materials that are relatively cheap and have
all properties of ideal scintillator except their low
light yield which is not a crucial parameter in the
high energy physics. These crystals are relatively
easy to grow and are very much cast effective
therefore can be produced at large scale to be
used in large size detector systems.
These crystals are grown by the Czochralski
growth technique. For the crystal growth,
synthesized polycrystalline material or
constituent oxides was taken in a platinum
crucible (typically 50 mm diameter and 50 mm
height) and was placed inside a growth station.
Heating was carried out at a rate of about 100ºC/
h until complete melting of the material. The
molten material was allowed to soak for 1-2 h at
the temperature 30-50 ºC above the melting point.
To start the growth process, a seed crystal or a
platinum wire in absence of a seed crystal, is
used. Seed crystal/Pt wire is slowly lowered to
touch the melt surface and allowed there for
some time to attain thermal equilibrium with the
melt. After that, pulling is started according to
predetermined parameters using crystal growth
software though initially few changes have to
be made manually. The grown crystals are
cooled down to room temperatures at a uniform
rate (typically 30- 50ºC/h) depending on the
material.
Various studies have shown some aspects of the
complex relation between the crystal growth
parameters and the resultant optical properties
[11, 12]. The most severe problem during growth
is stoichiometric variation due to decomposition
of the material at elevated temperature and
selective evaporation of the constituent oxides.
Coloration, frequent cracking, inclusion, core
formation in the grown crystals are the
consequences of the stoichiometric variations
during the growth. Other reason of the coloration
in the crystals could be extrinsic impurities.
Growth parameters, related problems and their
remedies of individual crystals are as follows.
(i) PbWO4 (PWO)
Single crystal of lead tungstate grown under
normal conditions turned yellowish showing an
absorption band at 420 nm. The yellow coloration
of PbWO 4 crystals may arise due to the
stoichiometric deviation and/or presence of trace
impurities in the starting material. In lead
tungstate PbO evaporates selectively and single
crystal deficient in PbO has various defects
related to Pb centers. To compensate for the
PbO losses from the melt a known amount of
PbO is added in the initial charge. But by
conducting several growth runs it was established
that stoichiometric deviation is not the only factor
responsible for the coloration. It is, thus, apparent
ISSUE NO. 318
I JAN - FEB 2011 I
21
TECHNOLOGY DEVELOPMENT ARTICLE
BARC NEWSLETTER
that the coloration is caused by other defects/
trace impurities too. Studies have shown that
growth ambient also had a pronounced effect
on the coloration. Using already crystallized
charge and oxygen rich ambient colorless crystal
could be grown. A gradual change in color of
single crystals from yellow color to colorless in
successive experiments is shown in Fig. 6.
Cracking problem of this crystal is highly
depended on the after-growth cooling rates. A
detailed study showed that cracking could be
prevented (for crystals having diameter >20 mm)
only if the cooling rate was less than 20ºC/h.
Further, it was found to be independent of the
growth direction. We believe that cracking
problem in PbWO4 is due to the cleavage planes,
which for this crystal is (101), known to get
cleaved by application of a very little force.
(ii) PbMoO4 (PMO):
The single crystal growth was carried out by
the Czochralski technique, using an automatic
diameter-controlled crystal puller (Cyberstar
model: Oxypuller). For the growth of 20mm
diameter and 50 mm long crystals, a pull rate of
2 mm/h and a crystal rotation rate of 20 rpm
were employed [12]. Seed crystal used for the
growth was oriented along the c-axis. Cracking
and coloration are the major problems faced with
the Czochralski growth of PMO crystals. Apart
from the cooling rate and orientation the main
reason behind cracking of this crystal was found
to be the stoichiometry variation during the
growth. In lead molybdate, unlike PWO, the
selective evaporation of MoO3 took place which
makes crystal Mo deficient.
Fig. 6: Color transformation from yellow to transparent
in PbWO4 crystals.
22
I
ISSUE NO. 318
I
JAN - FEB 2011
Fig. 7: PMO crystals grown using different
stoichiometric starting charges under different ambient:
(a) stoichiometric/air, (b) stoichiometric /Ar, (c) 1wt% Pb
excess/air,(d) 1wt% Mo excess/air, and (e) 1wt% Mo
excess/Ar.
Therefore to grow crack-free crystals one has
to take utmost care to compensate for the MoO3
stoichiometry. Fig. 7 shows the photographs of
crystals grown under identical conditions but
using starting charges of different compositions
and under different ambient viz., (a)
stoichiometric/ in air (b) stoichiometric/ in argon,
(c) 1% excess of PbO/ in air, (d) 1% excess of
MoO3/ in air and (e) 1% excess of MoO3/ in
argon. The photographs show clearly that the
crystal having excess of PbO like (a), and (c)
shows high density of microcracks. On the other
hand, crystals grown using charges of
stoichiometric composition in argon ambient (b)
or those from charges having an excess of 1%
MoO3 (d) and (e) did not crack either during
growth/annealing or on subsequent handling and
Fig. 8: Transmission spectra of PMO crystals grown
using different stoichiometric starting charges:
(a) stoichiometric/air, (b) stoichiometric /Ar,
(c) 1wt% Pb excess/air, (d) 1wt% Mo excess /air,
and (e) 1wt% Mo excess/Ar.
BARC NEWSLETTER
TECHNOLOGY DEVELOPMENT ARTICLE
also showed superior transmission characteristics
as shown in Fig. 8.
The results show that the crystals grown from
charges containing slightly excess of MoO3 are
more resistant to cracking, whereas an excess
of Pb promotes the generation of microcracks.
This is an important result from the point of
crystal cracking which shows that to obtain a
crack-free crystal the starting charge must be
slightly rich in MoO3.
(iii) NaBi(WO4-)2 (NBW)
Single crystals of NBW were grown in air by
the Czochralski technique employing automatic
diameter controlled Cyberstar crystal pullers,
having a 50 kW induction heater in Oxypuller
model (axial gradient 60°C/cm) and 12 kW
molybdenum silicide resistance furnace in TSSG
model (axial gradient 6°C/cm). A uniform pull
rate of 2 mm/h and a rotation of 15 rpm were
employed for growing crystals of 20 mm
diameter from the melt contained in 50 mm
diameter platinum crucibles. A uniform post
growth cooling rate of 40°C/h was employed in
the regular crystal growth experiments. Two
types of initial charges were used for the crystal
growth; (i) material synthesized by sintering of
constituent oxides at 750°C for a total duration
of about 100 h, in multiple segments involving
grinding and mixing after every 24 h, (ii)
transparent crystal chunks of previously grown
crystals [13]. Typical photographs of three
crystals referred as A, B and C, grown from the
two differently prepared starting charges under
two different temperature profiles are shown in
Fig. 9.
It can be seen that diameter of A-type crystals
grown from sintered charge under low gradients
(6°C/cm-1) is not well controlled along with
yellow coloration. Though the use of a high
temperature gradient was helpful in the precise
Fig. 9: Photographs of NaBi(WO4)2 crystals grown from
‘A’: sintered charge under 6°C/cm gradient, ‘B’: sintered
charge and ‘C’: re-crystallized charge under 60°C/cm
gradient.
diameter control (crystal B) but coloration still
persist in the crystal. Also the segregation of an
impurity phase material can be seen at the bottom
suggesting the presence of other impure phases
along with NBW. This problem was solved by
using a charge refined by multiple crystallization
and large temperature gradient (crystal C). The
C-type crystals show better radiation hardness
as compared to the other two types crystals [4].
(iv) BaWO4
The growth process is somewhat similar to that
discussed above for the growth of PbWO 4
crystals. But the problem in this case is the high
melting point i.e. 1475ºC of the material which
is close to softening temperature of the Ptcrucible. The pulling rate was initially fixed at 4
mm/h and a fixed rotation rate of 15 rpm was
used. After the growth, crystals were cooled
down to room temperature at a constant rate of
30ºC/h. The grown crystals were colorless, and
did not show any major influence of the ambient
i.e. air or oxygen. However, the cracking of
crystals, as shown in Fig.10, was frequently
observed, and was a matter of concern. In order
to investigate this problem, thermal expansion
measurements were carried out on the grown
crystals [14]. Sample for these measurements
ISSUE NO. 318
I JAN - FEB 2011 I
23
TECHNOLOGY DEVELOPMENT ARTICLE
BARC NEWSLETTER
was prepared by carefully cutting the crystal into
a rectangular piece of dimension 6.5mm x 4.5mm
x 4.0mm having faces parallel to (100), (010)
and (001) crystallographic planes. Measurements
were carried out using a dilatometer (modelTMA/92 Setaram, France) with a silica probe,
in the temperature range 30-1000°C employing
a heating rate of 10°C/min in high pure Ar
ambient. The results of experiment show that
expansion coefficient is quite high in <001>
direction compared to that in other two directions
i.e. <100> and <010>. Therefore <001> direction
was selected for the growth in order to allow
maximum expansion in the growth direction and
thus keeping isotropic expansion directions in the
rotation plane. The cracking was successfully
avoided in this manner.
(v) LBO/LGBO
Lithium tetra borate and lithium gadolinium tri
borate have elements like Li, B, Gd that have
high neutron capture cross-sections and hence
can be effectively used in neutron detection and
dosimetry. Being low-z materials these are also
gamma transparent which is a crucial property
for materials to be used as a neutron detector in
high gamma background, like reactors. These
materials are mostly grown by the CZ method.
LBO has a tendency to go into a glassy phase
during the cooling which limits its growth rate.
Fig. 10: Photograph of BaWO4 crystals
showing cracks.
24
I
ISSUE NO. 318
I
JAN - FEB 2011
To avoid the glassy phase a very slow pull rate
has to be employed (typically 0.2-0.5 mm/h)
therefore to grow a 20 mm diameter and 20 mm
length crystal it takes about a week. Another
growth related problem in the case of LBO is
the core formation which is due to decomposition
and selective evaporation of LBO at elevated
temperatures.
LBO crystals doped with Cu and Ag were also
grown by the Cz method. The doped LBO crystal
is an excellent dosimeteric material (thermally
stimulated as well as optically stimulated
luminescence dosimetery) [3]. Typical
photographs of doped and undoped crystals are
shown in Fig.11.
LGBO is a new material and has potential to be
used as a scintillation detector for neutrons when
activated with Ce. Its growth is relatively easy
compared to LBO. But due to the presence of
cleavage planes, cracking in a large size crystal
is still an unresolved problem. We have grown
crack-free transparent crystal having 12 mm
diameter and 40 mm length, as shown in Fig. 12.
Research is going on in order to increase the
dimensions further
Laser Crystals
Oxide materials like YAG, Al2O3, NYW, NGW
KYW, KGW are a few of the excellent laser
Fig. 11: Photographs of LBO single
crystals (as-grown).
Fig. 12: Photograph of asgrown single crystal of
Li6Gd(BO3)3.
BARC NEWSLETTER
TECHNOLOGY DEVELOPMENT ARTICLE
hosts. Here in crystal technology lab we have
grown single crystals of NYW, NGW doped with
Nd and Yb, respectively. These crystals are
grown by the Czochralski techniques (CZ).
Growth details and problem encountered during
the growth of these crystals are as follows:
Czochralski technique employing the starting
charge rich in Y2(WO4)3 that rectified all the
growth related problems except those which may
arise probably due to the anisotropy in thermal
properties of the crystal. A polished disc from
the grown crystal (undoped) is shown in Fig.13
which shows a good transparency.
(i) NaY(WO4)2 (NYW)
Single crystals of NYW are grown by the CZ
technique. The occurrence of compositional
changes during the growth of NYW crystals
causes instabilities in the mass growth rate and
increases the vulnerability of these crystals
towards development of cracks. Analysis of
different regions of grown crystals and post
growth residual charges revealed the presence
of excess Y2O3 in the upper portion of ingots
and excess of Na2O in the residual charge, in
the form of binary compounds of sodium
tungstate. Phase purification through recrystallization, as achieved in another double
tungstate crystal NaBi(WO4)2, was not effective
in NYW, due to a lack of segregation of all
foreign components into the melt and
decomposition of the material.
The phase diagram of the Na2WO4-Y2(WO4)3
pseudo-binary system shows that there exists a
congruent melting composition corresponding
to a 1:1 molar ratio in this systems. However,
crystal growth from a congruent melting
composition did not yield a good quality crystal
and suffered from the above mentioned
problems. In our recent work on this material,
several off-stoichiometric compositions were
prepared along with a stoichiometric compound
using a solid-state route and characterized for
their thermal and structural behavior using DTA
and XRD measurements. Based on results of
this study, a suitable composition rich in the
Y2(WO4)3 for the growth of NYW crystal was
suggested [15]. Furthermore, crystal growth
experiments were carried out on NYW by the
(ii) NaGd(WO4)2 (NGW)
Yb doped NaGd(WO 4) 2 single crystals are
important for applications in high power tuned
laser sources in the near-infrared region due to
their relatively smaller stock-shifts and broad
absorption/emission bands. Single crystals of 4%
Yb doped NaGd(WO4)2 (NGW) were grown
from stoichiometric charges using the
Czochralski technique under normal ambient
conditions. The grown crystals were transparent
with a slight greenish tinge. The coloration of
the grown crystals was increased when the same
charge was used in the following growth runs
by replenishing the drawn amount with an
equivalent amount of the fresh charge. After
many growth run the leftover charge was
analyzed and it was found that it was rich in
foreign phases like sodium tungstates and
Na5Gd(WO4)4. Annealing studies revealed that
the oxygen related defects were the main cause
behind the coloration. Based on these feedbacks
a recrystalized charge was used that yielded less
Fig. 13: Photograph of as-grown single crystal of
NaY(WO4)2 (left) and polished disc.
ISSUE NO. 318
I JAN - FEB 2011 I
25
TECHNOLOGY DEVELOPMENT ARTICLE
BARC NEWSLETTER
colored crystals. Crystal growth experiments
with different ambient are also planned in order
to minimize the coloration. Photographs of asgrown crystals and polished disc and cubes are
shown in Fig. 14.
growth is the most serious problem in growing
high quality device grade fluoride crystals for
applications in optics. The oxygen scavenger like
PbF2 that does not affect other optical properties
of crystals is used to minimize the oxidation of
materials during the growth. Dehydration and
proper fluorination are also necessary steps to
grow high quality crystals. Fluorination of the
material is done in a special furnace which is
resistant to HF. Typical photograph of 80 mm
diameter LiF (as-grown) and a 50 mm polished
disc of CaF2 is shown in Fig.15.
Fig. 14: Photographs of as-grown crystals and polished
disc and cubes of NaGd(WO4)2.
Transmission and absorption spectra were
recorded at room temperatures employing a
spectrophotometer in the 200-1100 nm range.
The absorption spectrum of Yb was fitted in multi
Gaussian peaks centered around 936, 954, 964,
975, 981, 996 and 1010 nm that matched well
with the theoretically predicted values [16]. This
result also confirmed the quasi three level nature
of the Yb 2F-7/2 → 2F-5/2 system.
Optical crystals
Fluoride optical crystals CaF2, BaF2, LiF are
grown using the vacuum Bridgman furnaces. A
graphite heater is used for the resistive heating
of graphite crucibles containing the material.
Lowering mechanism is coupled with the crucible
using a Wilson seal. All the systems including
growth chamber, electrodes, pulling mechanism
are cooled using a complex heat exchanger
mechanism.
The growth of these materials is relatively easy
though there are few problems which had to be
conquered. Even after high vacuum of the order
of 10-5 mbar, contamination of oxygen during the
26
I
ISSUE NO. 318
I
JAN - FEB 2011
Fig. 15: Photographs of (a) LiF as-grown crystal and
(b) polished disc of CaF2.
Crystal growth and characterization facilities
at CTS
Under the single roof of the crystal technology
building, there are several sophisticated crystal
growth facilities equipped with advanced
Czochralski crystal pullers and indigenously
developed high temperature vacuum Bridgman
furnaces in the clean-room environments.
Photograph having panoramic view of
Czochralski pullers and vacuum furnaces are
shown in Fig.16 and Fig.17, respectively. In
addition, there are various instruments for
characterization of grown crystals including
powder X-ray diffraction instrument, X-ray
fluorescence instrument, photoluminescence
spectrometer (200-900 nm), differential thermal
BARC NEWSLETTER
TECHNOLOGY DEVELOPMENT ARTICLE
Fig. 16: Photograph of Czochralski crystal puller lab.
Fig. 17: Photograph of vacuum Bridgman furnace lab.
analyzer (50-1750ºC), thermo-mechanical
analyzer (50-2400ºC), in-house developed
gamma-ray spectrometer for scintillation testing
and thermoluminescence reader and
spectrometers. Results of these experiments are
used as feedbacks in successive growth runs to
develop the device-grade crystals.
8.
J. Czochralski, Z. Phys. Chem. 92
(1918) 219-221.
9.
P.W. Bridgman, Proc. Amer. Acad. Arts
Sci. 60 (1925) 303-383.
10.
K. Chennakesavulu, S.G. Singh, A.K.
Singh, S.C. Gadkari, Proc. NSGDSC,
BARC, (2009), India.
References
11.
Robert Hofstadter, Phys. Rev. 75 (1949)
796-810.
K. Nitsch, M. Nikl, S. Ganschaw, P.
Reiche, R. Uecker, J. Crystal Growth,
165 (1996) 163-165.
12.
S.E. Derenzo, M.J. Weber, E. BourretCourchesne, M.K. Klintenberg, Nucl.
Instr. and Meth. A 505 (2003) 111–117.
Mohit Tyagi, S.G. Singh, A.K. Singh, S.C.
Gadkari, Phys. Status Solidi A 207 (2010)
1802-1807.
13.
S. G. Singh, M. Tyagi, A. K. Singh, and
Sangeeta, Cryst. Res. Technol. 45 (2010),
18 – 24.
14.
A.K. Chauhan, J. Crystal Growth, 254
(2003) 418-422.
15.
R.G. Salunke, S.G. Singh, A.K. Singh, D.G.
Desai, S.W. Gosavi, A.K. Chauhan, S.C.
Gadkari. American Institute of Phys.:
Conf. Proc. 1313 PEFM (2010) 397.
16.
S.G. Singh, M. Tyagi, D.G. Desai, A.K.
Singh and S.C. Gadkari, 14th National
Seminar on Crystal Growth, NSCG-XIV,
VIT University, Vellore (2010).
1.
2.
3.
Babita Tiwari, N.S. Rawat, D.G. Desai,
S.G. Singh, M. Tyagi, P. Ratna, S.C.
Gadkari, M.S. Kulkarni, J. Lumin. 130
(2010) 2076 – 2083.
4.
S.G. Singh, Mohit Tyagi, A.K. Singh, S.C.
Gadkari, Nuclear Instrum. Methods In
Phys. Res. A 621 (2010) 111-115.
5.
Alexander A. Kaminskii, Phys. Stat. Sol.
(a) 200 (2003) 215–296.
6.
www.globalopticsuk.com
7.
J.C. Brice, “The Growth of Crystals
from Liquids”, North-Holland Publishing
Co., 1973.
ISSUE NO. 318
I JAN - FEB 2011 I
27
TECHNOLOGY DEVELOPMENT ARTICLE
BARC NEWSLETTER
Heavy Liquid Metal Technology Development
A. Borgohain, N.K. Maheshwari, P.K.Vijayan and R.K. Sinha
Reactor Design & Development Group
Abstract
Liquid metal is increasingly getting more attention as the coolant for advanced reactor systems.
This article deals with the activities performed on coolant technology for high temperature reactor applications.
A lead bismuth natural circulation loop has been set up, for thermal hydraulics, instrument development and
material related studies relevant to the Compact High Temperature Reactor.
Introduction
Many reactor designs based on heavy liquid
metal as coolant have been envisaged by various
countries for high temperature process heat
applications such as hydrogen production by
thermo-chemical processes. Heavy liquid metal
systems are excellent spallation targets for
Accelerator Driven Systems (ADS). Liquid
metal especially lead-lithium is also considered
for the blanket in the International
Thermonuclear Experimental Reactor (ITER).
Natural circulation of liquid metal coolant is being
considered as the normal core cooling mode in
some advanced reactor designs including the
Lead cooled Fast Reactors (LFR) being
developed by Generation IV International Forum
(GIF) [1]. Presently, technology development
for a small power Compact High Temperature
Reactor (CHTR) capable of supplying high
temperature process heat at 1273K is being
carried out in BARC.
primary system- a safety hall mark of liquid
metal cooled reactors, which essentially
precludes the loss of coolant accident initiator.
Very high coolant boiling point precludes boiling
induced voiding. This holds when the properties
of the lead alloys are exploited to raise core outlet
temperature in a range (1173-1273K) suitable
for hydrogen production missions. This margin
allows room for passive safety strategies to work.
Lead and lead alloys are used as a coolant
because they do not react vigorously with air
and water. Neutronicallly, lead (and lead alloys
generally) exhibit low neutron absorption and low
neutron slowing down power. Lead alloys are
excellent gamma ray shields. Activation of the
coolant is significant for Pb-Bi alloy and is
significantly less for pure lead. The long-term
activation which might affect decommissioning
waste streams exceeds that of sodium. Their
ability to corrode iron-based structural materials
requires a regime of rigorous coolant chemistry
control to maintain protective surface layers on
the structural members.
Attributes of Lead Alloys as a Reactor
Coolant
R&D Scope and Challenges
Lead and lead alloys have extremely high boiling
temperature at atmospheric pressure (19432023K). This facilitates an ambient pressure
Lead alloy cooled thermal reactor concepts will
require several years of “technology focused”
R & D in order to establish some of the
28
I
ISSUE NO. 318
I
JAN - FEB 2011
BARC NEWSLETTER
TECHNOLOGY DEVELOPMENT ARTICLE
fundamental data and understanding required
beyond the pre-conceptual design. Research and
development required for reactor design and
development to use lead alloy as a coolant in the
field of analytical chemistry and engineering
application is listed below and it would later be
followed by more extensive development to
actually bring a product to use.
operation by corrosion of metal surfaces,
diffusion of metal constituents through the metal
and via maintenance operations involving access
inside the system. The monitoring of the
impurities is essential for online detection up to
a very low level.
Material compatibility at high temperature
In lead bismuth eutectic, the generation of
radioactive polonium (Po-210, t1/2=138.3 days)
resulting from an (n, γ) reaction with 209Bi and
subsequent beta-decay is an issue. Polonium210 is very toxic and troublesome in the event
of leakage owing to its tendency to scatter
through the available volume. The methods for
effective removal of polonium from
contaminated surfaces and from the atmosphere
are required to be developed and tested.
In the CHTR [2], beryllia and graphite are
extensively used as reactor core materials. The
compatibility of lead alloy coolant with these
materials is required to be assessed.
Furthermore, issues have been raised concerning
the possibility of leaching out of alloying agents
from structural materials containing very hot
flowing lead and lead-bismuth. The compatibility
of materials are first to be assessed separately
and then in combinations. The coolant additives
or high temperature coatings may result in
acceptable material compatibility at high
temperature and is required to be assessed from
corrosion chemistry and integrity point of view.
Oxygen control and measurement
The amount of dissolved oxygen in liquid lead
alloys should not increase beyond a limit to avoid
the contamination of the liquid system by lead
and bismuth oxides and should not be less than a
certain limit which may cause dissolution of
alloying element of the structural material.
Therefore the oxygen level must be constantly
monitored and kept within a certain range [3].
The development of robust oxygen sensor for
online measurement of dissolved oxygen is also
an important requirement for safe operation of
the system.
Solid impurities control
Impurities enter the coolant during reactor
Coolant activation
Thermal hydraulics
Systematic studies on the degradation of heat
transfer due to oxide formation on heat transfer
surface are needed for design of reactor coolant
circuit and heat exchangers. The studies on
behaviour of liquid metal during natural
circulation under various transients are rare. For
3-D thermal hydraulic analysis of reactor systems
involving natural circulation, CFD codes are
found to be very useful. But proper validation of
the codes for liquid metal application is essential
before using it for the actual system analysis.
Another area of importance is the coupling of
the system codes with 3-D CFD codes. This
will help in coupled 1-D and 3-D analysis of the
whole reactor system accurately and
economically.
The liquid metal systems using lead (Pb) or leadbismuth eutectic (LBE) require measurement
technologies especially adapted to them.
Instruments for measurement of pressure,
pressure drop and low flow rate for high
ISSUE NO. 318
I JAN - FEB 2011 I
29
TECHNOLOGY DEVELOPMENT ARTICLE
BARC NEWSLETTER
temperature application are required to be
developed.
Activities on Lead Bismuth Coolant
Technology Development
Lead-Bismuth test loop
A lead-bismuth natural circulation loop has been
set up, for thermal hydraulics, instrument
development and material related studies
relevant to CHTR. Steady state and transient
studies are carried out in the loop. Fig. 1 shows
the isometric view of the loop and a photograph.
More details of the loop and experimental studies
can be found in [4]. The loop mainly consists of
a heated section, air heat exchanger, valves,
various tanks and argon gas control system. All
the components and piping are made of SS316L.
The LBE ingots are melted in a melt tank and
then transferred to the sump tank. The LBE
coolant in the sump tank is then pressurized by
argon gas system. Due to pressurization molten
LBE flows into the loop and subsequently fills
up the loop. After filling, the loop was isolated
from the sump tank by a valve. Natural circulation
of the coolant takes place in the loop due to
heating of the coolant in the heated section and
cooling in the heat exchanger. Air is used as the
secondary side coolant in the heat exchanger.
After losing heat in the heat exchanger LBE
enters the heated section through 15mm Nominal
Bore (NB) pipeline.
Fig. 1: 3D view of the main loop and photograph
Fig. 2: In-house developed oxygen sensor
Oxygen measurement and control
An oxygen sensor was developed to measure
dissolved oxygen level in LBE. The oxygen
sensor consists of a one-end closed YSZ tube.
Bismuth and Bismuth oxide is used as reference
electrode. The sensor has been tested in a
separate test set up [5] before installation in the
loop. Fig. 2 shows the oxygen sensor used in the
30
I
ISSUE NO. 318
I
JAN - FEB 2011
Fig. 3: Variation of temperature and EMF with time
loop. Fig. 3 shows the variation of emf of the
sensor during operation of the loop.
BARC NEWSLETTER
TECHNOLOGY DEVELOPMENT ARTICLE
Material testing
environment
in
Lead-Bismuth
Material compatibility related studies with lead
bismuth coolant at high temperature are in
progress. Fig. 4 shows the micrograph of
graphite sample tested at 1123K in LBE medium
for 500 hrs. No significant corrosion or
penetration of LBE into the graphite material is
observed after the test. Material compatibility
studies on stainless steel and graphite in LBE
medium have also been carried out by other
researchers [6, 7].
Fig. 4: Micrograph of graphite after 500 hrs operation in
LBE at 1123K
the same inputs as initial conditions in the test
loop and results obtained were plotted for
comparison. Fig. 5 shows the steady state results
at various heater powers and the comparison of
the prediction of LeBENC code. Fig. 6 shows a
comparison of theoretical results with
experimental data for start up of natural
circulation from stagnant condition with heater
power of 1800W in the loop.
Fig. 5: Steady state natural circulation results at different
power levels
Computer code development and its validation
A computer code, LeBENC (Lead Bismuth
Eutectic Natural Circulation) is developed to
study the steady state and transient behaviour
of liquid metal natural circulation in a closed loop.
The code can handle uniform and non-uniform
diameter piping in the loop, different working
fluids (water and LBE) and accounts for axial
conduction in the fluid and pipe wall. The details
of the code can be found in [3]. The code was
first validated [8] with experimental data on
natural circulation in water.
Validation in the Lead-Bismuth loop
Steady state and transient experiments were
carried out. In transient studies start up of
the natural circulation, loss of heat sink and
loss of heater power were studied. For all the
experiments, the computer code was run with
Fig. 6: Start-up of the loop from stagnation condition,
heater power 1800W
CFD analysis
Computational Fluid Dynamics (CFD) is used
for the 3-D thermal hydraulic analysis related to
CHTR. PHOENICS, a general purpose CFD
ISSUE NO. 318
I JAN - FEB 2011 I
31
TECHNOLOGY DEVELOPMENT ARTICLE
BARC NEWSLETTER
code is used for the analysis. The code has been
assessed for liquid metal heat transfer analysis
[9]. Based on the assessment 3-D thermal
hydraulic analysis of the CHTR core [2] is
carried out. The full-scale reactor core has been
modelled in PHOENICS. Natural circulation
of the coolant is modelled with Boussinesq
approximation. Fig.7 shows the 3D temperature
distribution in the core for normal operating
condition. The average flow velocity of the
coolant in the fuel tube is found to be 3.3m/min.
CFD analysis on the lead bismuth loop has also
been carried out. Fig. 8 shows the steady state
3D temperature distribution of the loop with
heater power 2000W.
Concluding Remarks
Steady state and transient studies have been
carried out in the Lead-Bismuth loop. Sensor
for online measurement of dissolved oxygen in
LBE at high temperature was developed and
tested in the loop. A computer code is developed
and results are compared with the experimental
data. The development of instruments for liquid
metal application and material testing are in
progress.
References
1.
Annual Report-GIF, 2009, http://www.gen4.org/PDFs/GIF-2009-AnnualReport.pdf.
2.
I. V. Dulera and R. K. Sinha, 2008, “High
Temperature Reactor”, J.
Nucl.
Materials, 383 1-2, 15, 183-188.
3.
X. Wu, J. Ma, Y. Jiang, B. Fu, W. Hang,
J. Zhang, and
N. Li,
2006,
“Instrumentation of YSZ Oxygen Sensor
Clibration in Lquid Lad-Bsmuth Etectic”,
IEEexplorer, accessed at: http://
ieeexplore.ieee.org/stamp
stamp.jsp?tp=&arnumber=1464945
&userType=inst.
4.
A. Borgohain, B. K Jaiswal, N. K.
Maheshwari, P. K. Vijayan, D. Saha and
R. K. Sinha, “Natural Circulation Studies
in a Lead Bismuth Eutectic Loop”, J.
Nucl. Progress (accepted for publication).
5.
A. Borgohain, N. K. Maheshwari, P. K.
Vijayan, D. Saha and R. K. Sinha, 2008,
“Development of High Temperature
Oxygen Sensor for Lead Bismuth
Eutectic”, Proc. Discussion meet on
Electro Analytical Techniques & their
applications”, ISEAC Munnar, Kerala, Feb
25-28.
Fig. 7: Temperature Distribution in the CHTR core.
Fig. 8: Temperature distribution in the loop,
heater power 2000W.
32
I
ISSUE NO. 318
I
JAN - FEB 2011
BARC NEWSLETTER
TECHNOLOGY DEVELOPMENT ARTICLE
6.
C.M. Das and R. Fotedar, “Experiences
on Lead-Bismuth Loops”, 2008, Workshop
on Steel and Fabrication Technologies for
Fusion Programme (WSFT-08), Institute
for Plasma Research, Ahmedabad.
7.
A. K. Sengupta, R. K. Bhagat, A. Laik,
G.B. Kale, T. Jarvis, S. Majumdar and H.S.
Kamath’ 2006, “Out of Pile Chemical
Compatibility of Pb-Bi Eutectic Alloy with
Gaphite”, International Journal for
Materials Research, 97, 834-837.
8.
B.K. Jaiswal, P.K. Vijayan, N. K.
Maheshwari, A. Borgohain, 2008,
“Development of a Computer Code to
Study the Steady State and Transient
Behaviour of Liquid Metal Natural
Circulation Loop”, 19th National and 8th
ISHMT-ASME heat and mass transfer
conference, JNTU Hyderabad, India.
9.
A. Borgohain, N.K. Maheshwari, P.K.
Vijayan, D. Saha and R. K. Sinha, 2008,
“Heat Transfer Studies on Lead-Bismuth
Eutectic Flows in Circular Tubes”,
Proceedings of 16 th International
Conference on Nuclear Engineering
(ICONE), May 11"15, Orlando Florida.
ISSUE NO. 318
I JAN - FEB 2011 I
33
TECHNOLOGY DEVELOPMENT ARTICLE
BARC NEWSLETTER
Indigenous Development of Silicon PIN
Photodiodes Using
a 4" Integrated Circuit Processing Facility
Anita Topkar, Arvind Singh, Bharti Aggarwal and C.K. Pithawa
Electronics Division
and
A.S. Rawat
Laser & Plasma Technology Division
Abstract
A wide range of single element silicon PIN photodiodes and 16-element PIN photodiode linear arrays have
been indigenously developed using the 4" integrated circuit processing facility of Bharat Electronics Limited,
Bangalore. The photodiodes show low dark currents and good optical performance in the visible range. The
overview of this technology development activity is presented in this article.
Introduction
Silicon PIN photodiodes feature high speed, low
series resistance, low dark current and low
junction capacitance resulting in low noise and
fast response time of the order of a few ns.
Compared to photomultiplier tubes, silicon
photodiodes offer specific advantages such as
low operating voltage (<100V), high quantum
efficiency, insensitivity to magnetic fields, and
small sizes. As a result, PIN photodiodes are
now being used extensively in wide range of
applications involving radiation monitoring,
nuclear physics (for medium-energy charged
particle detection) and particle physics
experiments (electromagnetic calorimeters).
These devices are widely used in laser based
metrology applications (measurements of
diameter, surface roughness, projectile velocity,
distance and vibration) and beam parameter
measurements (power, temporal profile, pulse
energy). As scintillation detectors, major
34
I
ISSUE NO. 318
I
JAN - FEB 2011
applications of PIN photodiodes are in the arena
of security systems such as X-ray baggage
scanning and cargo scanning, industrial
tomography and medical imaging systems. The
technology for the production of PIN photodiodes
for the above mentioned applications was not
available in our country resulting in dependency
upon the foreign commercial suppliers for these
devices. Therefore, indigenous development of
these devices was taken up.
Fabrication Technology
Considering the range of applications of silicon
photodiodes as mentioned above, indigenous
technology development of silicon PIN
photodiodes has been carried out using a 4"
processing line of Bharat Electronics Limited
(BEL), Bangalore. The silicon photodiodes have
been fabricated using silicon IC fabrication
technology. A planar process which combines
oxide passivation with ion implantation gives
BARC NEWSLETTER
TECHNOLOGY DEVELOPMENT ARTICLE
better device properties compared to diffused
junction devices, and hence this process has been
adopted for fabrication of the photodiodes. Oxide
passivation over the surface is useful for
reduction of leakage currents whereas ion
implantation allows accurate control of junctions.
N Type, <111>, 4-6 kΩ-cm high purity silicon
wafers of 300μm thickness are used as starting
material and the subsequent process steps have
been optimized so that the generation of defects
is minimized. The front P+ region has been
obtained by boron ion implantation while
phosphorous has been used to obtain a N+ region
at the back. Several process steps have been
incorporated to reduce the dark current. The
breakdown voltage has been tuned to enable
operation in full depletion mode so as to get a
minimum terminal capacitance. Silicon dioxide
has been used as an anti-reflection layer over
the active region and it has been tuned for the
wave length of CsI scintillator. Initially, process
runs have been carried out using a test-mask to
optimize the required electrical and optical
performance. Subsequent to process
development, another mask was designed to
incorporate different types of photodiodes. This
design incorporated photodiodes with sensitive
area ranging from 0.5mm2-150mm2, quadrant
detectors and 16-element linear arrays of
photodiodes. The main fabrication steps used for
the fabrication of photodiodes are given below:
•
•
•
•
•
•
Initial oxidation
P+ lithography
Screen oxidation
P+ implant of boron
P+ drive-in and anneal
Back N+ implant of phosphorous, drive–in
and anneal
•
Contact opening, metallization and
passivation on the front side
•
Dicing and packaging
Subsequent to wafer fabrication, the photodiodes
are packaged in different types of packages such
as metal TO (Transistor Outline) packages with
glass window or flat package using ceramic
substrates. The packages were custom
developed at BEL, Bangalore.
Fig.1 shows the photograph of fabricated wafer
incorporating various types of photodiodes.
Fig. 1: Fabricated wafer showing various types of PIN
photodiodes
Performance of Photodiodes
The characterization of the photodiodes has been
carried out by measuring the dark currents and
reverse capacitance at different bias voltage
using automated measurement setups.
The typical dark currents at different bias voltages
for a number of photodiodes of area 100mm2
are shown in Fig. 2. The dark currents at voltages
exceeding full depletion voltage are about
3-5nA/cm 2 . The typical capacitance vs
voltage characteristics for photodiode with area
of 100mm2 is as shown in Fig. 3. As can be seen,
the capacitance at full depletion voltage is about
45 pF/cm2.
ISSUE NO. 318
I JAN - FEB 2011 I
35
TECHNOLOGY DEVELOPMENT ARTICLE
BARC NEWSLETTER
The optical response of the photodiodes was
compared with commercially available
photodiodes of similar specifications. The spatial
uniformity of the optical response and linearity
at different input optical powers was also
measured.
The optical performance of the photodiodes has
been observed to be as good as that of imported
commercial photodiodes (Fig.4).
Fig. 2: Typical dark current vs voltage characteristic for
photodiodes of area 100mm2
Fig. 4: Responsivity of photodiodes at different
wavelengths in the visible range
Fig. 3: Typical capacitance vs voltage characteristic of
photodiode of area 100mm2
The optical characterization has been carried
out by measuring the responsivity at different
wave lengths of light in the visible range. The
responsivity has been measured at 543nm,
632nm and 940nm wavelengths using laser/
LED. During these measurements, the optical
power of incident light on the photodiode was
measured using a power meter. The current
generated due the incident photons in the
photodiode was measured using a trans
impedance amplifier. The diodes were used in
photoconductive mode and the output voltage
was measured to calculate the photocurrent.
36
I
ISSUE NO. 318
I
JAN - FEB 2011
The spectroscopic performance of indigenously
developed CsI-photodiode detector assembly for
different gamma energies was investigated by
coupling the photodiode to CsI scintillator. The
CsI scintilator was grown at TPD, BARC. A
CsI scintillator with dimensions of 10x10x15 mm3
was coupled to a photodiode of 10mmx10mm
geometry for carrying out these measurements.
Fig. 5 shows the response of CsI:PIN photodiode
detector assembly for different gamma-ray
energies over a range of 511keV to 1275keV
[1].
The CsI-photodiode detector shows a good
linearity in the 511 keV -1275 keV range. The
detector shows energy resolution of about 16%
at energy of 662 keV.
BARC NEWSLETTER
TECHNOLOGY DEVELOPMENT ARTICLE
Quadrant detector with total
active area of 150/50mm2
and with a glass window
PIN photodiode with active
area of 50/100mm2 and with
a glass window
PIN photodiode with a
square geometry, with active
area of 100mm2 and with a
glass window
Fig. 5: Response of CsI:PIN photodiode detector
assembly for different gamma-ray energies [1]
Types of Photodiodes Developed
16-element PIN photodiode linear arrays
for X-ray imaging with scintillator
Various types of photodiodes which have been
developed include single element diodes,
quadrant detectors and 16-element linear arrays.
Some of these photodiodes are shown below:
Element geometry of
1.57mm x1.22 mm and
pitch of 1.57mm
PIN photodiode with active
area of 0.2 mm 2 (0.5mm
dia.) and with a mini-lense
window
Element geometry of
2.5 mm x 2.15mm and
pitch of 2.5mm
PIN photodiode with active
area of 0.78 mm 2 (1mm
dia.) and with a mini-lense
window
Quadrant detector with
each element of 1.3mm x
1.3mm, 0.1mm gap and with
a glass window
PIN photodiode with active
area of 25 mm2 and with a
glass window
Element geometry of
10 mm x 0.8mm and
pitch of 1.3 mm
Summary
Various types of PIN photodiodes have been
indigenously developed using the 4" integrated
processing facility of BEL, Bangalore and
their performance has been evaluated.
The photodiodes have been observed to have
ISSUE NO. 318
I JAN - FEB 2011 I
37
TECHNOLOGY DEVELOPMENT ARTICLE
BARC NEWSLETTER
performance comparable to that of commercial
photodiodes. As this technology development
was carried out using the foundry facility of BEL,
the photodiodes will be commercially available
from BEL, Bangalore. Using the technology
developed, it would be also possible to tune the
specifications such as geometry, types of
segmentation, spectral response, etc., for specific
applications.
Acknowledgement
The authors would like to thank Mr. G.P.
Srivastava, Director E&IG, Dr L. M. Gantayet,
Director, BTDG, Mr. R.K Patil, Associate
Director (C), E&IG and Dr A.K. Das, Head,
38
I
ISSUE NO. 318
I
JAN - FEB 2011
L&PTD for their support in carrying out this
work. The contribution of Dr S.C. Gadkari, TPD
and Mr. S.G. Singh, TPD, BARC in investigating
the gamma response of CsI-photodiode detector
is acknowledged.
References
1.
S.G. Singh, Arvind Singh, Anita Topkar,
S.C. Gadkari, “Performance of
indigenously developed CsI(Tl)photodiode detector for gamma-ray
spectroscopy”, presented in 55 th DAESolid State Physics Symposium
(DAE-SSPS 2010), Paper in press in AIP
Conference Proceedings.
BARC NEWSLETTER
TECHNOLOGY DEVELOPMENT ARTICLE
Development of Room Temperature NH3 Gas
Sensors based on Ultrathin SnO2 Films
Sipra Choudhury, C.A. Betty, K.G. Girija
Chemistry Division
Abstract
Ultrathin SnO2 film deposited by Langmuir–Blodgett technique showed high sensitivity (< 3 ppm) for NH3 gas
at room temperature with fast response (<1 min) and 90% recovery within half-an-hour. The sensitivity remained
the same and was reproducible even after one year indicating the long term stability of the sensor. The sensor
was highly specific to NH3 in presence of the other reducing gases - H2S, SO2, CO, H2 and CH4. In the presence
of H2S and SO2, the film conductivity increased whereas it decreased with ammonia. There was no response
with other reducing gases.
Introduction
The current era of high technology and advanced
industry has produced an incredible rise in living
standards. However, this has also been
accompanied by a variety of serious
environmental problems, for example, the
atmospheric release of various chemical
pollutants, including NOx, SOx, HCl, NH3, CO2,
volatile organic compounds (VOCs) and
fluorocarbons from industries, automobiles, and
homes. These polluting gases result in serious
global environmental issues, such as acid rain,
greenhouse effect, sick house syndrome and
ozone depletion. To prevent or minimize the
damage caused by atmospheric pollution,
monitoring and controlling systems are needed
that can rapidly and reliably detect and quantify
pollution sources within the range of the
regulating standard values. Till now, air pollutant
measurements have been carried out with
analytical instruments using optical spectroscopy,
gas chromatography or mass spectrometry.
Although these instruments can give a precise
analysis, they are time-consuming, expensive, and
can seldom be used in real-time in the field.
Therefore, a gas sensor that is compact and
robust with versatile applications and low cost,
could be an equally effective or better alternative.
Gas sensors for detecting air pollutants must
be able to operate in a stable manner under
deleterious conditions, including chemical
and / or thermal attack. Therefore, solid-state
gas sensors would appear to be the most
appropriate ones in terms of their practical
robustness. There are several solid-state
gas sensors currently available for gases such
as O 2 , H 2 O, H 2 S, LPG at relatively high
concentrations [1]. However, the range of
air pollutant concentrations that is to be detected
reaches as low as few ppm in combustion
exhaust control or indoor monitoring and
few ppb in atmospheric environmental
monitoring. Therefore, the development of more
sensitive and selective gas sensors than the
conventional ones is still required. Over the past
ISSUE NO. 318
I JAN - FEB 2011 I
39
TECHNOLOGY DEVELOPMENT ARTICLE
BARC NEWSLETTER
few decades solid state gas sensors based on
polycrystalline SnO2 thin films have become
predominant for gas alarms in domestic,
commercial and industrial premises. These
sensors are usually operated at temperature
>200oC to achieve reversibility and fast response
and they are mainly used for H2S, CO and H2
sensing. Sensors operated at high temperature,
though specific to a particular gas at that
temperature, suffer from shorter life-time and
high thermal budget. Besides, in an explosive
environment, the high-temperature operation of
these oxide sensors is not favorable. Evidently,
room temperature operation is preferable,
however, in the case of polycrystalline thin films
the bottleneck for room temperature operation
lies in the dominant grain boundary barrier
resistance (Schottky diode). This can be readily
overcome by exploiting nano-scale structures
of SnO2. Very small grain size and high surfaceto-volume ratio associated with the
nanocrystallites allow the sensors to be operated
in the most sensitive, grain-controlled mode,
having a completely depleted space charge
region.
Depending on the degree of
nonstoichiometry (SnO2-x) of the
film, exposure to oxygen leads
to some of the oxygen being
adsorbed at surface defects. The
adsorption passivates the surface
vacancies, drawing electrons
from the bulk and localizing them
on the chemisorbed / ionosorbed
oxygen, thereby creating a space
charge region of positively
charged ions near the surface.
The effect of grain size and grain
boundary barrier on carrier
density modulation (Δn e) is
schematically shown in Fig. 1
(ne vs. film thickness l), for micro
40
I
ISSUE NO. 318
I
and nanogranular films. The two cases are scaled
using Debye length LD in SnO2 film for a given
temperature. Fig. 1(i) and (ii) (upper part) show
the top view of the polycrystalline interconnected
micrograins and nanograins respectively without
any amorphous phase in between. The distance
between the grain boundaries to the dotted line
indicates the Debye layer thickness LD created
by the charge transfer with the surface adsorbed
species. With the film thicknesses l > 2LD, band
bending due to oxygen chemisorptions exists only
near the surface [2] (the band diagram is shown
later in Fig.6). The corresponding electron density
plot (lower part of Fig. 1 (i)) shows that there is
no effect on the bulk electron density except on
the grain boundary due to the adsorbed species.
In contrast, the effect of adsorption on
nanostructures ( l < 2L D) is to deplete the
nanograin completely of the charge carriers (Fig.
1(ii) upper part). This in turn changes the location
of the Fermi level (which is proportional to Δne)
within the band gap of the nanostructure (Fig. 1
(ii), right bottom panel) causing an appreciable
conductance drop. In order to exploit the above
Fig.1: Schematic diagrams of space charge formation at the grain
boundaries (upper part) and carrier density modulation (lower part) due
to surface adsorbed species (O-, O2-) on micro and nano granular film.
The continuous lines (upper part) represent grain boundaries. LD is the
Debye length, l is the grain size, ne is carrier density, Δne change in carrier
density. (+) indicates the charge on Sn atom inside the grain.
JAN - FEB 2011
BARC NEWSLETTER
TECHNOLOGY DEVELOPMENT ARTICLE
mentioned nanostructure properties in gas sensor
design we have deposited ultrathin films with
LD > l/2 by controlling the thickness of SnO2
films using Langmuir–Blodgett technique. Gas
sensors fabricated using these ultrathin SnO2
films have been successfully demonstrated for
their room temperature response to NH 3
detection with high sensitivity and fast response.
Deposition of ultra thin SnO2 film
Ultrathin SnO2 film was deposited by LangmuirBlodgett (LB) technique, which provided highly
ordered thin films of SnO2. This technique of
depositing thin tin oxide film has advantages over
other methods as it does not require vacuum and
needs only moderate temperature. It also
Fig. 2: Flow chart of the preparation of ultra thin SnO2
film from LB film precursor
provides very good control of film thickness and
uniformity of the ordered multilayers. Multilayer
LB films of the anionic tin complexes with
octadecyl amine (ODA) deposited on various
substrates (Si, quartz and glass) were
decomposed at 600° C (2 hours) for desorption
of long hydrocarbon chain. In the presence of
oxygen, the tin ions formed oxides on the
substrates (Fig. 2). SnO2 films of 15-20 nm were
formed on various substrates from 120 layers
of octadecyl (ODA) stannate LB film [3,4].
Surface morphology in SEM examination
appeared to be non-porous (Fig. 2).
XRD pattern of the decomposed LB film
showed peaks that are characteristic of
cassiterite structure of SnO2 (Fig. 3(i)). Using
the Scherrer equation, analysis of <110> peak
of cassiterite gave an approximate crystallite
size of 8 nm. In the XPS spectra, peaks were
observed at 486.6 and 495 eV (Fig. 3(ii)a) with
full width at half-maximum of 1.6 eV
representing one oxidation state of Sn. Two
oxygen peaks (Fig. 3(ii)b) are observed at 530.1
eV and 532.2 eV. The lower binding energy
peak is attributed to lattice oxygen in the SnO2
crystal structure. The shoulder peak at higher
binding energy in O1s spectrum of the SnO2
film corresponds to adsorbed oxygen at the
surface [3].
Fig. 3: XRD pattern (i) and XPS spectra (ii) of Sn 3d (a) and O1s (b) of ultrathin SnO2 film.
ISSUE NO. 318
I JAN - FEB 2011 I
41
TECHNOLOGY DEVELOPMENT ARTICLE
BARC NEWSLETTER
Gas sensor fabrication
Inter-digitated gold electrodes were deposited
by physical vapour deposition using shadow
mask on the SnO2 ultrathin film grown on quartz
substrate. An opaque glass chamber was
designed and fabricated for testing the sensors
at different ambients. The chamber was further
wrapped with a dark adhesive tape to prevent
interference from any stray light. The chamber
has inlet and outlet stopcocks for exposing it to
ambient air or for sweeping the carrier gas and
an injection port for the specific gas to be tested.
Fig. 4 shows the block diagram and the
photograph of the gas testing facility.
Testing and specificity studies
Known amounts of various gases (NH3, H2S,
SO2, CO, H2 and CH4) from small canisters
were injected into the chamber without any
carrier gas flow, using gas tight syringes through
rubber septum. The chamber was kept closed
completely till the sensor response saturated and
then the stop cocks were opened for recovery,
by exposing to atmosphere. The room
temperature sensitivity of the ultrathin SnO2 films
towards ammonia gas was studied by measuring
the change in conductivity with time using an
electrometer interfaced to a personal computer.
Typical time response to ammonia gas at room
temperature is shown in Fig. 5(i). The response
time was less than 1 min and 90% recovery
took place within half-an-hour. The lowest
sensitivity observed (~ 3 ppm) is comparable to
the requirement for the air quality monitoring
(50 ppm for 2 h exposure). Repeated
measurements were carried out on a single
device over a period of 1 year and it showed
the same response to ammonia indicating the
stability and reproducibility of the
sensor (Fig. 5(ii)). It was found
that the response and recovery
times were slower after one year.
The reason for the slow recovery
after a year could be due to
exposure of the unpackaged
sensor to ambient over a long
time
Fig. 4: Block diagram and the photograph of the gas testing facility
Fig. 5: (i)Typical response (INH3/Iair) curve of SnO2 with ammonia
(ii) Sensitivity ((RNH3-Rair) x 100)/Rair) plots of freshly prepared and one
year old SnO2 sensor.
42
I
ISSUE NO. 318
I
JAN - FEB 2011
Gas sensing mechanism
As already mentioned the
surface of nonstoichiometric
SnO 2-x chemisorbs oxygen
forming an electric double layer,
through partial sharing of
conduction band electrons. The
response of this oxygen adsorbed
surface to different gases
depends on their electrochemical
activities. Strong reducing gases
will uproot the adsorbed oxygen
BARC NEWSLETTER
TECHNOLOGY DEVELOPMENT ARTICLE
layer for their own oxidation and in that process
SnO 2-x surface gets back its shared band
electrons as well as conductivity. Presence of
strong oxidizing gases on the other hand results
in transformation of the double layer towards
stoichiometric SnO2, decreasing the electrical
conductivity. Thus strongly reducing / oxidizing
gases bring about irreversible changes in the
surface properties and it requires either air flow
or proper heat treatment to gain back the
sensing property. Interestingly, interaction of
ammonia with the ultrathin film has caused a
decrease in conductivity as shown in Fig. 5. The
sensing mechanism of NH3 is schematically
shown in Fig. 6. NH3 which is a mild reducing
gas, is a polar molecule containing partial positive
charge on its H atoms (Fig. 6). When NH3 gas
is injected into the chamber, it settles on the
surface double layer through polar interaction
(Fig. 6) and in this process reduces the
conduction band electrons of SnO2-x, thereby
reducing the conductivity. As the polar interaction
is weak, NH 3 molecules undergo instant
detachment (disperse) from the double layer
during the recovery phase. This makes the
sensor unique and specific to ammonia at room
temperature.
Specificity
Fig. 6: Schematic band diagram indicating the energy
levels on the surface of SnO2 thin film in presence of
surface adsorbed species and the target gas NH3; EC, EF,
EV, ESS: energy levels of conduction band, Fermi level,
valence band and surface states respectively. (Xad)δnegatively charged surface adsorbed species.
As for other gases like CO, CH4 and H2 which
are not polar, they do not show any effect on
the SnO2 film (Fig. 7(i)). In case of H2S gas,
reduction reaction dominates on the SnO 2
surface forming a new species making the
response (increase in current) and recovery
slower. While testing with a gas mixture of NH3
(10 ppm) and H2S (1 ppm) (Fig. 7(ii)) it was
observed that current decreased initially due to
ammonia gas (fast response, marked as 1)
showing immediate response with ammonia.
Subsequently, the current increased slowly due
Fig.7: (i) Response of the sensor with NH3, H2, CO and O2 gases. (ii) Response with NH3 and H2S.
Circle indicates NH3 response with decrease in current.
ISSUE NO. 318
I JAN - FEB 2011 I
43
TECHNOLOGY DEVELOPMENT ARTICLE
BARC NEWSLETTER
Table 1: Specifications of ultrathin SnO2 sensor
Property
Drift in base current
Sensitivity
S=((RNH3-Rair)x 100)/Rair
Response time
Recovery time (after opening of
stopcocks, without any carrier
gas flow)
Reproducibility after a year
Specificity
to the presence of H2S gas (slow response).
After the saturation of current with H2S gas,
ammonia was injected again (marked as 2) and
its characteristic response was observed. Even
in the presence of H2S gas, subsequent ammonia
injection showed similar response (marked as
3) as in the earlier case. These studies indicated
the specificity of the SnO 2 sensor towards
ammonia gas even in the presence of other
reducing gas like H2S. Table 1 summarizes the
specific properties of SnO 2 based room
temperature NH3 sensor.
Value
2-3 %
10-14 % for 5 ppm of NH3
40 sec (for 5 ppm NH3)
30 mins for 90 % recovery
Sensitivity intact
Response time
200 sec (5 ppm of NH3)
Recovery time
1 hr (5 ppm of NH3)
Specific to NH3 in presence of other
reducing gases (H2S, SO2, CO, H2,CH4)
ultrathin oxide film with controlled thickness,
which is useful for many device applications.
The entire fabrication process is cost effective.
Acknowledgements
Authors are thankful to Dr. D. Das, Head,
Chemistry Division, BARC, for his constant
encouragement, fruitful discussion and
constructive suggestions during the course of
the work.
References
Conclusions
It has been demonstrated that ultra thin SnO2
films fabricated from the thermal decomposition
of LB film precursor, exhibit room temperature
gas sensitivity comparable to that required for
air quality monitoring. The sensor is specific to
NH3 gas at room temperature and shows fast
response and recovery without any carrier gas
flow. The stability studies indicated that these
sensors are stable at least for a year with no
significant change in sensitivity. The present
study also shows the applicability of the
alternative LB technique for the formation of
44
I
ISSUE NO. 318
I
JAN - FEB 2011
1.
N. S. Ramgir, I. S. Mulla, K. P.
Vijayamohanan, Sens.& Actuat, B,
Chem. 107 (2005) 708-715.
2.
W. Gopel, K.D. Schierbaum, Sens.&
Actuat, B, Chem. 26 (1995) 1-12.
3.
Sipra Choudhury, C. A. Betty, K.G. Girija,
S. K. Kulshreshtha, Appl. Phys. Lett. 89
(2006) 071914-16
4.
Sipra Choudhury, C. A. Betty, K. G. Girija,
Thin Solid Films 517 (2008) 923-928.
BARC NEWSLETTER
TECHNOLOGY DEVELOPMENT ARTICLE
Development of Online Radon and Thoron
Monitoring Systems for Occupational and
General Environments
J.J. Gaware, B.K. Sahoo, B.K. Sapra, Y.S. Mayya
Radiological Physics and Advisory Division
Abstract
Online radon and thoron monitors have been developed using ZnS(Ag) detector for continuous monitoring of
concentrations in occupational and general environments. Their performance has been tested successfully
both in laboratory and field conditions. Special features of these monitors include low cost, high sensitivity
and non-interference of humidity and trace gases. The capability of these radon monitors for networked radon
monitoring in U mines and in the U-tailings pond has been demonstrated. The thoron monitor is designed for
stack monitoring of thoron release in a thorium processing facility. Being highly sensitive, these monitors can
also be used for radon/thoron monitoring in dwellings, radon exhalation measurements, radon concentration
in water samples and thoron emission measurements from monazite sands in High Background Radiation
Areas.
Introduction
Unlike time-integrated monitoring of radon and
thoron which is mainly limited to dosimetric
applications, continuous online monitoring yields
insight into spatio-temporal correlations, buildup in confined spaces, hourly variations induced
by pressure and temperature variations,
atmospheric transport, extreme excursions,
duration of specific highs and lows etc. While
the increased computational capabilities on
environmental modeling have given rise to
greater needs for real time data, the
corresponding developments in networking and
data transmissions have made it possible to
achieve
large
scale
simultaneous
measurements. Such facilities are being
increasingly developed as part of systems for
earthquake predictions, in uranium mining,
environmental monitoring and geophysical
research.
Apart from these general applications, monitoring
radon concentrations in Uranium mining and
thorium processing facilities is important to
evolve effective strategies to reduce radiation
doses to occupational workers. With this in view,
automatic radon and thoron monitors have been
developed as described below.
Description of systems
Online Radon Monitor
Traditionally, the Lucas scintillaton cell is used
for one point sampling of radon (Lucas, 1957;
Abbady et.al., 2004). The counting is carried out
after a delay of 3 hrs, allowing for the decay
products to achieve radioactive equilibrium
with radon. The same Lucas cell may be used
for continuous radon measurements with
the help of an algorithm for calculation
of radon concentration for each sampling time
interval. The algorithm accounts for the
ISSUE NO. 318
I JAN - FEB 2011 I
45
TECHNOLOGY DEVELOPMENT ARTICLE
BARC NEWSLETTER
fractions of radon decay products contributing
to the total counts formed by radon in the current
interval and in its preceding intervals. This
innovative algorithm for correlating the counts
with the radon concentration has been developed
in-house, based on the theoretical growth and
decay equations of radon decay products. Using
this algorithm, two versions of radon monitor
have been developed. The portable version called
SRM (Scintillation Radon Monitor), utilizes a
ZnS:Ag based scintillation cell for measurement
of alpha from radon and its decay products. The
other version named as ECAS (Electrostatic
Collection and Alpha Scintillation) is developed
using an electrostatic chamber for collection of
charged decay products of radon on the ZnS:Ag
surface. The details of these two versions are
described below.
Considering the limitations on the range of the
alpha particles (~6 cm), the dimensions of the
scintillation cell were optimized to achieve high
sensitivity (1.2 cph/Bqm-3) with lower detector
volume (150 cc). The low detector volume,
delivering very high sensitivity per unit activity
of radon (6000 cph/Bq), is very useful for
measurements of mass exhalation and surface
exhalation of radon from various naturally
occurring radioactive materials
Portable Radon Monitor - SRM
High Sensitivity Radon Monitor - ECAS
The schematic of the microprocessor based SRM
and its photograph are shown in Figs.1a & 1b
respectively. Radon is sampled into the
scintillation cell (150 cc) through a “progeny
filter” and “thoron discriminator” eliminating
radon progenies and thoron. The thoron
discriminator based on “diffusion-time delay”
does not allow the short lived thoron 220Rn (half
life 55.6 sec) to pass thorough. The alpha
The low range of the alpha particles (~ 6 cm),
makes it difficult to enhance the sensitivity of
the SRM monitor just by increasing the
dimensions (or volume) of the scintillation cell.
Hence, an electrostatic collection technique for
charged decay products of radon, namely 218Po+
and 214Pb+ ions, on the ZnS:Ag scintillator has
been used. The schematic and the photograph
of ECAS are shown in Figs.2a & 2b respectively.
As in SRM, the sampling of radon into the
Fig. 1a: Schematic diagram for Portable Radon Monitor
(SRM)
Fig. 1b: Photograph of Portable Radon Monitor (SRM)
46
I
ISSUE NO. 318
I
JAN - FEB 2011
scintillations from radon and its decay products
formed inside the cell are continuously counted
for a user-programmable counting period by the
PMT and the associated counting electronics.
The alpha counts obtained are processed by a
microprocessor unit as per the developed
algorithm to display the concentration of radon.
BARC NEWSLETTER
TECHNOLOGY DEVELOPMENT ARTICLE
Fig. 2b: Photograph of high sensitivity radon monitor
(ECAS)
Fig. 2a: Schematic diagram for high sensitivity radon
monitor (ECAS)
detector volume (1000 cc) is carried out by
diffusion through “progeny filter” and “thoron
discriminator” in succession. The electric field
for various detector geometries and dimensions
were modeled using commercial software and
the optimal field with this simple-to-fabricate
cathode and anode design was obtained.
Accordingly, an electrical potential of –2 KV is
applied to an aluminized mylar (12µm thickness)
covering the ZnS:Ag scintillator coated on the
cathode which is a solid perpex cylindrical block
with a hemispherical head. The alpha
scintillations produced by 222Rn, 218Po and 214Po
are detected by the PMT and the associated
counting electronics. The alpha counts obtained
are processed by a microprocessor unit to display
the concentration of radon.
Online Thoron Monitor
Fig. 3a: Schematic diagram for online thoron monitor
Fig. 3b: Photograph of online thoron monitor
The indigenously developed microprocessor
based thoron monitor consists of two Lucas
scintillation cells (LSCs) which are coupled to a
separate photomultiplier tube with associated
pulse preamplifier and scalar. Its schematic
diagram and photograph are shown in Figs.3a
& 3b respectively. The LSC is a 2" dia and 3"
height cell built in S.S. 316 material with inbuilt
two levels of radon-thoron progeny pre- filters
for reducing the background contamination. The
flow to either LSC is switched by microprocessor
ISSUE NO. 318
I JAN - FEB 2011 I
47
TECHNOLOGY DEVELOPMENT ARTICLE
BARC NEWSLETTER
at the intervals specified through programmable
parameters. During each interval, while one cell
counts the background, the other cell measures
counts due to both thoron and the background
activity. The unit automatically calculates and
logs the thoron concentration data in the memory.
Performance evaluation
Various tests were carried out under controlled
conditions in a chamber to evaluate the
performance of the monitors. The first set of
experiments was carried out to compare the
measurements of online radon monitors against
the commercially available system
AlphaGUARD. A fair agreement was seen
between ECAS, SRM and AlphaGUARD as
shown in Fig. 4. Similarly, the measurements
with the indigenous thoron gas monitor was
compared with that obtained with the
commercial unit RAD-7
(Fig. 5). Since the
background is high at higher thoron
concentrations, the thoron monitor is tested upto
2 MBq/m3. For both the monitors, the variations
were within 3%.
Fig. 5: Comparison of measurements of Thoron monitor
with RAD7
To evaluate the response time of SRM radon
monitor and also to study the effectiveness of
algorithm based calculation, the measurements
of radon counts and concentration for sudden
rise and fall of radon was carried out which is
shown in Fig. 6. The radon concentration of
the order of 10 KBq m-3 was suddenly introduced
inside a closed chamber and after 3 hrs, it was
suddenly brought down to 100 Bq m-3 (a factor
of 100). The gross counts show a slow rise due
to time taken to build-up and a slow fall due to
the presence of residue activity. However, the
algorithm used for the estimation of radon
concentration as measured by SRM corrects
for these delays and depicts the sharp changes
in the concentration as expected. To demonstrate
the capability of ECAS to operate in high
humidity conditions measurements were carried
out by varying the humidity as shown in Fig.7.
As may be seen, the effect of humidity does not
arise as the electrostatic voltage is not utilized
for collection of radon progenies
Fig. 4: Comparison of radon measurements by SRM and
ECAS against Alphaguard
Fig. 6: Response of SRM radon monitor to sudden
variations in radon concentration
48
I
ISSUE NO. 318
I
JAN - FEB 2011
BARC NEWSLETTER
TECHNOLOGY DEVELOPMENT ARTICLE
Fig. 7: Radon concentration measurements with varying
humidity conditions
Fig. 8: Ambient radon measurements by ECAS and SRM
for a period of about two weeks
To assess the long term measurement capability of
SRM and ECAS radon monitor, they were operated
continuously in a room for about two weeks without any manual attendance. Both the instruments
performed successfully with agreements in radon
concentration as seen by the trends given in Fig. 8.
Additional tests were also carried out in controlled
conditions to obtain technical specifications of radon and thoron monitors. These specifications are
summarized in Table 1.
Table 1: Technical Specifications of online radon/thoron monitor
Parameters
Online Radon Monitor
Online Thoron monitor
Sensitivity
ECAS: 2.8 cph/(Bq/m3)
SRM: 1.2 cph/(Bq/m3)
0.7 cph/(Bq/m3)
MDL
ECAS: 8 Bq/m3 at 95% confidence,
1 hr counting
SRM: 14 Bq/m3 at 95%confidence,
1 hr counting
15 Bq/m3 at 95% confidence,
1 hr counting
Upper Detection Limit
50 MBq/m3
50 MBq/m3
Cycle time
15 / 30 / 60 min – Fast mode
1 / 2 / 3 h – Sensitive mode
10 / 30 / 60 min
Radon Response time
20 min for 95% of radon in air
10 min for 95% of thoron
in air
Thoron Interference
< 5% using thoron discriminator
Not applicable
Humidity and Trace gas
effect
<5% in ambient environment
(20% to 60% RH) and <10% in
highly humid environment
(60% to 95% RH) for ECAS.
Negligible for SRM.
Negligible
ISSUE NO. 318
I JAN - FEB 2011 I
49
TECHNOLOGY DEVELOPMENT ARTICLE
BARC NEWSLETTER
Applications of radon monitors
The features such as uninterrupted online
operation, high sensitivity and free from
humidity / trace gas interference open up diverse
applications in radon and thoron studies. These
include calibration of passive detector systems,
indoor/outdoor radon monitoring, network
based online radon monitoring in workplaces such
as underground uranium mines, radon emission
studies from soil/water/building materials, field
survey and site monitoring such as uranium
tailings pond. Some of the potential applications
have been demonstrated below.
accumulator technique of Sahoo and Mayya
(2010) was followed to measure the radon
emission rate from soil which was found to be
80 Bq m -2 h -1. This was close to the value
obtained using RAD-7. Knowing that building
materials are the second most importance source
of radon, we used ECAS to measure the radon
emission from cement samples (Fig. 10) using
Measurement of radon emission from soil and
building materials.
Soil in the earth’s crust is the major source of
radon emission into the environment. We have
demonstrated the use of ECAS for measuring
the rate of radon emission from soil. The
“accumulator” technique has been used for this.
The soil area of interest is covered with the
accumulator and the radon build up in it
monitored using ECAS connected in a closed
loop fashion with an external pump. The buildup
data is fitted to an appropriate model to extract
the radon emission rate from soil. The experiment
was conducted in an open ground (Fig. 9). The
Fig. 9: Measurement of radon emission from soil
50
I
ISSUE NO. 318
I
JAN - FEB 2011
Fig. 10: Measurement of radon emission from a cement
sample
the mass exhalation measurement procedure of
Sahoo et. al. (2007). The emission rate was found
to be 7.2 mBq kg-1 h-1 which falls within the
range reported by Sahoo et al., 2007.
Fig. 11: Schematic diagram of Radon monitoring network
at Turamdih U Mines
BARC NEWSLETTER
TECHNOLOGY DEVELOPMENT ARTICLE
Networking in Uranium
Turamdih - field trial
mines
at
The networking capability with fast response of
ECAS is useful for monitoring uranium mines
and tailings pond, with multiple such units
networked to give real-time spatial profiles of
radon. In this context, few online monitors were
installed inside the uranium mines (Fig.11) at the
locations where the concentration of radon is
expected to be high. Results of the
measurements are shown in Fig.12.
indigenous monitors will serve as import
substitutes for the Indian radon/thoron research
programmes.
Acknowledgements
The authors would like to thank Mr.. H.S.
Kushwaha, Ex-Director, HS&EG and Dr. A.K.
Ghosh, Director, HS&EG, BARC, for their
constant encouragement and support towards
this work.
References
1. Abbady A, Abbady AG, Michel R., Indoor
radon measurement with the Lucas cell
technique, Appl Radiat Isot., 61(6)
(2004):1469-1475.
2. Lucas F.H. Improved low-level alphascintillation counter for radon. Rev. of Sci.
Inst., 28 (1957): 680-683.
Fig. 12: Radon levels monitored at various locations
inside Uranium mines
Summary and Conclusions
Different versions of online radon and thoron
monitors have been developed using ZnS(Ag)
detector for applications in front end nuclear fuel
cycle. Special features of these monitors include
low cost, high sensitivity and non- interference
of humidity and trace gases. The performance
of these monitors were tested successfully both
in laboratory and field conditions. They find wide
applications for networked based radon
monitoring in U mines, tailings pond region and
stack monitoring of thoron release in a thorium
processing facility. Being highly sensitive, they
can also be used for ambient measurements such
as radon/thoron monitoring in dwellings, radon
exhalation measurements, thoron emission
measurements from monazite sands etc. These
3. Sahoo BK, Mayya YS. Two dimensional
diffusion theory of trace gas buildup in soil
chambers for flux measurements. Agric.
and Forest Meteorol. 150 (2010):12111224.
4. Sahoo BK, Nathwani D, Eappen KP,
Ramachandran TV, Gaware JJ, Mayya YS.
Estimation of radon emanation factor in
Indian building materials, Rad. Meas. 42
(2007): 1422-1425.
ISSUE NO. 318
I JAN - FEB 2011 I
51
FEATURE ARTICLE
BARC NEWSLETTER
Formal Model Based Methodology for
Developing Software for Nuclear Applications
A. Wakankar, R. Mitra , A.K. Bhattacharjee, S.V. Shrikhande,
S.D. Dhodapkar, B.B. Biswas and R.K. Patil
Reactor Control Division
Abstract
The approach used in model based design is to build the model of the system in graphical/textual language. In
older model based design approach, the correctness of the model is usually established by simulation. Simulation which is analogous to testing, cannot guarantee that the design meets the system requirements under all
possible scenarios. This is however possible if the modeling language is based on formal semantics so that the
developed model can be subjected to formal verification of properties based on specification. The verified
model can then be translated into an implementation through reliable/verified code generator thereby reducing
the necessity of low level testing. Such a methodology is admissible as per guidelines of IEC60880 standard
applicable to software used in computer based systems performing category A functions in nuclear power plant
and would also be acceptable for category B functions.
In this artical, we present our experience in implementation and formal verification of important controllers
used in the process control system of a nuclear reactor. We have used the SCADE (Safety Critical System
Analysis & Design Environment) environment to model the controllers. The modeling language used in
SCADE is based on the synchronous dataflow model of computation. A set of safety properties has been
verified using formal verification technique.
Introduction
The approach used in model based design is to
build the model of application in some modeling
language and then obtain the implementation in
a programming language automatically using
code generator. In older model based approach
(e.g. UML tools [1]), the correctness of the
model is mainly established by simulation.
However simulation cannot guarantee that the
design meets the system requirements under all
possible scenarios. This is possible only if the
modeling language is based on formal semantics
and the model can be subjected to formal
verification of system properties, which are
derived from system requirements. Verification
52
I
ISSUE NO. 318
I
JAN - FEB 2011
of these properties establishes that the model
meets the system requirements. Such a model
driven design methodology where the modeling
language has formal semantics and environment
supports formal verification of properties is
termed here as Formal Model Based Design
Approach [2].
The advantage of this approach is that, any
change in the requirement can be directly
introduced in the model and verified (both via
simulation and formal verification) before code
is generated automatically, thereby keeping the
implementation in sync with the design. This is a
significant advantage in implementing change
requests.
BARC NEWSLETTER
FEATURE ARTICLE
Such methodology for the development of
software used in safety class applications
conforms closely to the design guidelines
recommended by IEC60880. In fact since it is
possible to rigorously verify safety properties,
the design process can meet most of the
guidelines in appendix E of IEC60880. Since
use of formal model based technique represented
methodology change, it was decided to carry out
implementation for two important controllers for
which earlier implementation existed for
comparative purposes. SCADE [5], a model
based design environment was chosen for this
purpose. SCADE supports a graphical modeling
language having an underlying formal semantics
defined on synchronous dataflow model of
computation. The SCADE environment also
supports model simulation, model test coverage
(MTC) analyzer, formal verification tool and
certified code generator. It allows model
verification through interactive simulation and
formal verification. Another important aspect is
that the SCADE models are built using graphical
notation that is easily understood, thus greatly
helping to simplify review of models by control
engineers.
Two controllers viz Steam Generator Pressure
Controller (SGPC) and Primary Heat Transport
Pressure Controller (PHTPC) were selected for
implementation. These controllers were earlier
implemented using conventional software
development techniques and are in actual use.
In that way it was possible for us to compare
the effectiveness of the new technique. The
complete development process was followed
which included modeling, simulation, test
coverage measurement and code generation.
This was followed by testing in target hardware
with I/O simulation. For the verification of safety
properties the SCADE Design Verifier was
used. Two controllers were implemented using
SCADE but only SGPC controller is described
herein.
Background
Process Control Systems in Nuclear Reactor
The objective of SGPCS (Steam Generator
Pressure Control System) [8, 9] is to regulate
the steam generator (SG) pressure by controlling
the total amount of steam drawn from the SG.
The heat input to the SG through Primary Heat
Transport system is a function of reactor power,
which is controlled independently. When the
energy in the steam drawn from SG equals the
energy released from reactor fuel into the primary
coolant, the primary fluid temperature and steam
temperature (and hence the pressure) are
maintained at steady values. The steam pressure
regulation is achieved by controlling the valves
in various steam lines taking steam to either the
turbine (turbine governor valves TGVs) or
dumping into condenser (condenser steam
dump valves CSDVs) or discharging to
atmosphere (atmospheric steam discharge
valves ASDVs). So the objective of the SGPC
system is to generate the control signals for
valves specified above. The control signal is
generated by applying PID control algorithm to
the error signal calculated based on the
difference between measured SG pressure and
operational pressure setpoint (OPSP). The
operational pressure setpoint is function of
reactor power and is calculated using no load
setpoint (NLSP) and DT, the measured
differential temperature across SG, which is a
measure of reactor power. The main control
signal is generated by applying PID control
algorithm to the error, which is then split into
three ranges to derive control signals for the
three types of actuating valves i.e. TGVs,
CSDVs and ASDVs. Since these controllers
perform critical functions, the input
measurements are triplicated /quadruplicated to
provide redundancy.
ISSUE NO. 318
I JAN - FEB 2011 I
53
FEATURE ARTICLE
BARC NEWSLETTER
SCADE Specification Language
The SCADE [5, 6] modeling notation supports
Dataflow Equation and Safe State Machine for
modeling the system. A dataflow equation
describes the logical relationship between input
and output variables. Safe state machine
describes the control flow in the system in terms
of state transitions. Set of dataflow equations
are evaluated in parallel unless there is a data
dependency between them. Internally the
SCADE models are represented in SCADE
textual language. SCADE textual language is
based on the dataflow formalism, which is similar
to the Synchronous dataflow language Lustre
[4].
Synchronous languages [3] are based on
synchrony hypothesis, which assumes that the
program is able to react to an external event,
before any further event occurs. In dataflow
language a program is described as network of
operators transforming flows of data. SCADE
model is graphically represented as network of
operators. For example a basic counter that
counts up from 0 can be expressed in SCADE
textual language as
N = 0 → pre (N) + 1 ...............(1)
In above equation N is a variable that stores the
value of counter at a given instance of time. The
operator → is called the “followed by” operator
and it is used for initialization. Operator “pre” is
used to refer to the value of variable at previous
instant of time. Therefore the above equation
specifies that the initial value of variable N is 0
and thereafter its value is one more than the
previous value.
54
I
ISSUE NO. 318
I
JAN - FEB 2011
Fig. 1: SCADE Operator Diagram
SCADE model corresponding to above equation
is shown in Fig.1. A network of operators in
SCADE can be encapsulated as a new reusable
operator that is called a node or SCADE operator.
The requirements of the system to be
implemented are mapped in the form of network
of SCADE operators, where each operator
provides a specific functionality independently
or by interaction with the other SCADE
operators.
SCADE Suite contains an editor for modeling
the system behavior, a SCADE model simulator
for validating the model with the help of test cases,
a SCADE MTC module for accessing the
coverage of the model during simulation (based
on MC/DC structural coverage criteria) and a
SCADE Design Verifier to apply formal
verification technique for proving important
properties of developed SCADE model.
SCADE Design Verifier supports formal
verification based on model checking technique.
The verification engine supports two kinds of
verification; debug mode, which involves
bounded model checking [10] and proof mode
involving exhaustive verification. A property that
is shown to be true in debug mode (bounded by
BARC NEWSLETTER
FEATURE ARTICLE
given depth) should not be assumed to be
true under all possible cycles of execution.
The proof strategy can take enormous
amount of time (may not terminate in a
bounded time) if the property is not verifiable
within certain search depth because the
system may have very large state space.
Fig. 2: SGPCS Inputs and Outputs
The verification interface provides strategy
The equations expressing relationship between
options for terminating the search if the
output and input variables were grouped and
verification is not successful within a specified
implemented graphically in SCADE as different
amount of time. It is to be noted that the property
nodes, according to the functionality they
verifications reported in the later part of the paper
provide. In this way the SCADE model is
were done using the proof mode.
modularized and these modules can be reused
in other implementation. The representative
Development of the Model for SGPCS in
signals for all the discrete and analog inputs that
SCADE
are used in the model are read from the interface
of the signal processing logic already
The processing logic of the SGPCS can be
implemented in the existing code.
categorized as Signal Processing Logic and
Control Logic
This is shown schematically in Fig. 2. For
all the important processes parameters,
triplicate or quadruplicate measurements are
provided. Signal processing logic performs
the validation of input signals and generation
of “representative” (good) signal for each
input parameter from multiple measurements
rejecting where necessary any faulty
measurements, to ensure reliable operation
even in case of some sensor failures.
Control logic involves the implementation of
process control algorithm for SGPC system.
Fig. 3: SCADE Nodes and Data Flow
The “representative” signals from signal
processing logic are the inputs to the control logic
Control Logic is divided into nodes. The nodes,
and it generates the required control signal for
which generate actual control signals are
Turbine Governor Valves (TGVs), Condenser
Calc_NLSP, Calc_Control_Signal and
Steam Dump Valves (CSDVs) and Atmospheric
Calc_ASDV_Control_ Signal. The function of
Steam Discharge Valves (ASDVs). The formal
these nodes is to generate “No Load Set Point
model has been developed in SCADE only for
(NLSP)”, “Control Signal for TGVs and
the Application Control Logic since this
CSDVs” and “Control signal for ASDVs”
component could be cleanly substituted in old
respectively as shown in Fig. 3.
implementation without any other modification.
ISSUE NO. 318
I JAN - FEB 2011 I
55
FEATURE ARTICLE
BARC NEWSLETTER
Calc_Control_Signal is the most complicated
node because this node implements the algorithm
for computation of pressure set point (OPSP)
for SG and calculates the control signal by
applying PID control algorithm to the error signal.
The brief overview of node Calc_Control_Signal
is depicted in Fig. 4.
Fig. 5: Hierarchical architecture of SCADE model of
SGPCS
Fig. 4: Schematic of SCADE Node Calc Control Signal
The lower level nodes realize the control
functionalities like PID control within
Calc_Control_Signal, lookup tables and range
conversion algorithms. Fig. 5 shows the
hierarchical architecture of the SCADE model
of SGPCS, along with the coupling among nodes
and number of instances of each node.
Validation of SGPCS model
The validation of SGPCS model is done by
simulating the SCADE model. We have to apply
a sequence of input vectors to test a given system
behavior. The trend of outputs with the applied
input sequence is observed and compared with
the expected outputs, for analyzing the
correctness of the model. Each test sequence
that may expand over several cycles is stored
as a separate scenario file. The scenario file
stores the value of all the input vectors applied
during each cycle. The scenario files are useful
to automatically regenerate the previously
conducted test whenever required.
To assess how thoroughly the behavior of the
56
I
ISSUE NO. 318
I
JAN - FEB 2011
model is simulated, we have used Model Test
Coverage (MTC). MTC is a SCADE Suite
module, which allows measuring the coverage
of model during model simulation activity.
SCADE MTC analyzer uses MC/DC [7]
structural coverage criteria to assess the model
coverage. The MTC is done by using the scenario
files stored during the model simulation. The use
of scenario files ensures that the same test cases
are applied during simulation and MTC. Hence
the coverage results observed after MTC shows
that how extensively the behavior of the model
was simulated and points out the part of the
model that was not covered during model
simulation. We can then design new test cases
for covering those parts of the model that are
not covered. By applying test cases as per the
previously prepared test plan, we could achieve
97 percent model coverage.
From the analysis of the operators that were not
tested using the test plan, we designed new test
cases for increasing the model coverage. An
example for derivation of such a test case can
be illustrated using the Fig.6. Each operator
in the figure is labeled with an instance number
to distinguish between two instances of same
BARC NEWSLETTER
FEATURE ARTICLE
operator. So to identify each operator uniquely
during illustration, we have used operator name
followed by its instance number e.g. the AND
operator labeled with instance number 2 will be
depicted as AND2. Similarly the inputs of each
operator are identified as I1, I2…In, depicting
1st, 2nd … nth input respectively. In the figure
below MTC shows that the operator AND2 is
not covered completely. According to the MC/
DC criteria the three input AND gate, having
inputs I1, I2 and I3 is said to be covered
completely if the following conditions are
simulated.
I1, I2 and I3 are true
Only I1 is false
Only I2 is false
Only I3 is false
The coverage analysis shows that, for the
operator AND2 the condition “Only I2 is false”
was not simulated. From the Fig.6 it could be
determined that to simulate this condition, we
should have an input combination where
NOT(ASDV_auto) is true, NOT(ASDV_HC)
is false and ASDV_CM_raise is true. This
derived input test vector is added to the test plan
to increase the model coverage.
We have also observed that some conditions
required to completely cover the operator
according to MC/DC criteria were physically
infeasible. Fig.7 shows one such condition. The
MTC in this figure shows that the operator AND6
is not covered because the condition “only I1 is
false” was not simulated. To simulate this
condition, input I1 for operator AND6 should be
false keeping inputs I2 and I3 as true. I2 for the
AND6 is output of operator timer1. The output
of timer1 operator becomes true only if input is
true for specified time interval or more; otherwise
its output is false. So it can be determined that if
I1 is false then output of timer1 will be false and
hence I2 will also be false i.e. whenever I1 is
false, I2 will also be false. So we cannot design
test case, which simulates the condition “only I1
false” for the operator AND6.
Fig. 6: Derivation of
Test Case from the
Result of MTC
Fig. 7: Part of
Calc_Control_Signal
node
ISSUE NO. 318
I JAN - FEB 2011 I
57
FEATURE ARTICLE
BARC NEWSLETTER
Infeasible scenarios as described above had to
be left out and hence it was possible to achieve
99.8 percent model coverage.
Formal Verification of Requirements of
SGPCS
The verification of the SGPCS model was carried
out by using the formal verification technique
called model checking. It involves expressing a
system requirement as a property and checking
whether property is satisfied by the model. Each
of the properties to be verified was modeled as
an “observer node” using built-in SCADE
verification operators. The composition of
“observer node” with the system model was
used for model checking using the SCADE
Design Verifier.
Some of the important system properties of
SGPCS that were formalized and verified are
explained below. Each property is first stated in
English as it appears in specification followed
by brief explanation. Later the property is stated
formally using SCADE notation and explanation
is provided whenever required.
Property1
If manual_crash_cool or auto_crash_cool
signal is true then No Load Set Point (NLSP)
should decrease till lower saturation limit
(100.0) is reached.
The signals manual_crash_cool and
auto_crash_cool are two discrete inputs, which
are used to maneuver the pressure setpoint
(NLSP) during some emergency condition. If
at least one of these inputs is true then NLSP is
decreased till the limiter clamps the value of
NLSP to 100.0
Formal Specification of the property1 in SCADE
is shown in Fig. 8. In figure, the block
“verif::implies” implements the mathematical
implication (p!q). The first input denotes ‘p’ and
second input denotes ‘q’. The output of the block
is true if (p!q) holds. The output of this block is
assigned to the Boolean output property1.
Property 2
If NLSP_lower and NLSP_raise both signals
are true then NLSP should decrease till lower
limit (100.0) is reached.
The signals NLSP_lower and NLSP_raise are
discrete inputs used to lower and raise the value
of NLSP respectively, however if both the
signals are true simultaneously then
NLSP_lower signal must have a higher priority
over NLSP_raise.
Formal Specification of the property2 is shown
in Fig. 9.
Fig. 8: SCADE Observer
for Property1
Fig. 9: SCADE Observer
for Property2
58
I
ISSUE NO. 318
I
JAN - FEB 2011
BARC NEWSLETTER
FEATURE ARTICLE
Property3
If the loss_of_electric_load or turbine_trip
signal is true and reactor power exceeds 20%
Full Power then Anticipatory Action (AA)
should start and should get completed in time
T1+T2, where T1 and T2 are predefined
constants. AA lowers the operational set point
(OPSP) in proportion to reactor power based
on the following equation.
OPSP = NLSP - K *DT .......................(2)
The variation of K before, during and after AA
is shown in Fig.10, where K1 and K2 are positive
constants.
Fig.10: Timing diagram for Anticipatory Action
The signals loss_of_electrical_load and
turbine_trip are the discrete inputs to the
SGPC model, which decide the condition for start
and termination of AA
In SCADE, the time is measured in terms of
number of execution cycles. The number of
execution cycles in time T1+T2 can be
determined by dividing time T1+T2 by sampling
time (0.175 sec). The value of T1 and T2 is 1
and 2 respectively. Hence the number of
execution cycles is (1+2)/0.175 = 17.14 = 17.
However Fig.10 shows that the value of K at
the first and last cycles is equal to K1. Therefore
the number of cycles during which AA will be
present is two less than the calculated number
of cycles in time (T1+T2). Hence AA should
appear for (17-2) =15 cycles”.
Formal Specification of the property3 in SCADE
is shown in Fig.11. In figure the block
specifies an if-else condition as “O1= if C1 then
I1 else I2”. The block verif::AfterNthTick is
used to express that the output equals input,
except for the first N (N=1) cycles during which
the
output
is
true.
The
block
verify::AtLeastNTicks express that the output
equals the input as soon as the input is true for
N=15 cycles, before that the output is false.
Similarly the block verify::HasNeverBeenTrue
is used to express that the output becomes false
as soon as its input becomes true for the first
time, after this cycle the output remains false.
Property 4
Anticipatory action is discontinued after a reactor
trip or when both initiating conditions i.e.
Fig.11: SCADE
Observer for
Property3
ISSUE NO. 318
I JAN - FEB 2011 I
59
FEATURE ARTICLE
BARC NEWSLETTER
loss_of_electrical_load and turbine_trip are
not true.
This property specifies the condition for the
termination of anticipatory action. Thus if
required condition for anticipatory action does
not exist or if it disappears then anticipatory
action will terminate.
The formal specification of the property4 in
SCADE is shown in Fig.12.
Property5
If ASDV is in computer manual mode (i.e.
ASDV is neither in auto mode nor in hand
controller mode) and
a) ASDV_CM_raise
is
true
and
ASDV_CM_lower
is
false
then
ASDV_control_signal will increase.
b) ASDV_CM_raise and ASDV_CM_lower
both are true then ASDV_control_signal
will remain unchanged.
c) ASDV_CM_raise
is
false
and
ASDV_CM_lower
is
true
then
ASDV_control_signal will decrease.
mode is determined by two input variables
ASDV_auto and ASDV_HC. If input
ASDV_auto is true then mode is auto, if input
ASDV_HC is true then mode is hand controller
and if both inputs are false then mode is computer
manual. Inputs ASDV_CM_raise and
ASDV_CM_lower are used to raise and lower
the ASDV_control_signal respectively.
The formal specification of the property5 in
SCADE is shown in Fig. 13. The property could
not be proved and a counter example was
generated. The property could not be proved
because the specification does not place any
restriction on mode of ASDV in the instant
before coming to computer manual mode.
Therefore if in the previous instant the mode
was other than computer manual the control
signal values before and after mode change do
not conform to the property specification. The
model was later corrected to implement the
bumpless transfer functionality.
The time required for verification of these
properties was found to be less than 10 seconds
on a XEON Server with 4GB RAM.
Code Generation and Integration
The final control signal for ASDVs is calculated
based on the mode of operation. ASDVs can be
in one of the three modes: auto, hand control
or computer manual, which are selected from
a three-position switch. Hence in the model the
Fig.12: SCADE Observer for Property4
60
I
ISSUE NO. 318
I
JAN - FEB 2011
SCADE environment provides IEC61508 SIL3
certified automatic code generator (KCG). The
verified model was used to generate the C code
automatically. The use of certified code
BARC NEWSLETTER
FEATURE ARTICLE
Fig.13: SCADE Observers for Property5a, Property5b and Property5c
generator ensures that every specification in the
model is correctly reflected in the code, which
eliminates the need for unit testing.
The SGPC module developed using SCADE
was integrated with prototype system in the lab.
This was done by replacing old handwritten
SGPC code by the one developed with SCADE.
Two identical hardware based controller setups
were available. One was loaded with the old
handwritten SGPC code. This implementation
is in use for several years. The other controller
was loaded with automatically generated code
from the SCADE model. There was no
discrepancy observed in the output of these two
systems during testing.
The final size of the executable generated was
~163 KB whereas the size of old executable
was ~167 KB, which was comparable.
Conclusion and Future work
This methodology is suitable for the systems
whose output behavior involves cyclic executions
of read, compute and output. Software based
controllers used in embedded control applications
typically fall in this class of systems. It has been
our experience that it is quite easy to adopt the
methodology in the design life cycle of such
software and comply with the recommended
practices of IEC60880. This is because the
SCADE environment supports a formal language
and has tool support for testing the model
conforming to MC/DC structural coverage and
formal verification. The availability of IEC 61508
SIL3 certified code generator has reduced the
code generation effort to a push button and
there is no effort required for low level testing.
It must be emphasized that once the model is
validated and code is generated from the model,
it is not recommended to do any manual changes
ISSUE NO. 318
I JAN - FEB 2011 I
61
FEATURE ARTICLE
BARC NEWSLETTER
in the generated code. The availability of
certified code generator is a great advantage
over the other traditional development
methodologies (e.g. UML) involving modeling
language having less formal semantic foundation.
The lack of semantics in such modeling language
hinders complete automated code generation and
hence no certifiable code generation is possible
for the entire modeling language.
During formal verification, it was observed that
most of the time was spent on reviewing property
expressed in SCADE with corresponding English
specification. Although the tool supports an easy
to use interface to the back end verification
engine, the user is expected to know the
limitations of formal verification of systems
involving integer, real and nonlinear arithmetic.
SCADE supports predefined operators for
specifying verification conditions. However
formal logics such as LTL are more expressive
and it is possible to express properties much more
succinctly in these notations. For example, the
property 3, in section V.C, could have been
specified as (s → (p U15 q)), where s is the
initiating event (turbine trip or loss of electrical
power), p is the Boolean condition for
anticipatory action and q is the Boolean condition
signifying the end of anticipatory action. The subexpression p U15 q in the verification condition
demands that p is true for 15 ticks and
henceforth q is true and the complete property
states that if s is true and remains true then p
shall remain true for 15 ticks and subsequently q
shall remain true. It is felt that such properties
are difficult to express using standard SCADE
blocks. SCADE does not support a tool that can
translate specifications in such logic as explained
above into equivalent SCADE property
observers. We are now working on to develop
such a property synthesis tool and integrate in
the SCADE environment.
62
I
ISSUE NO. 318
I
JAN - FEB 2011
Acknowledgements
We are thankful to Shri G.P. Srivastava, Director
E&I Group for his encouragement during this
work. We are thankful to Shri C.K. Pithwa,
Head, ED (earlier Head, CCDS, RCnD), for
providing us the initial specification of SGPCS
from which the formal model has been
developed. Thanks are also due to Mrs. Ratna
Bhamra for helping us to understand the initial
specifications.
References
1. Unified Modeling Language http://
www.omg.org/technology/ documents/
formal/ uml.htm.
2. A. Wakankar et. al., Formal Model Based
Methodology for Developing controllers for
Nuclear Applications, Proceedings of 20th
IEEE International Symposium on Software
Reliability Engineering (ISSRE-2009),
Mysore, India.
3. N. Halbwachs, Synchronous programming
of reactive systems. Kluwer Academic Pub,
1993.
4. N. Halbwachs, P. Caspi, P. Raymond and
D. Pilaud, The synchronous dataflow
programming language Lustre. Proceedings
of the IEEE, vol. 79(9). September 1991.
5. SCADE Tool http://www.estereltechnologies. com/.
6. SCADE Language Reference Manual, Ver
6.1, Esterel Technologies Ltd., France
7. SCADE User Manual, Ver 6.1, Esterel
Technologies Ltd., France
8. S. Glasstone and A. Sesonske Nuclear
Reactor Engineering, Chapman & Hall,
New York.
9. Software Requirement Specification for
DPHS-PCS Rev 2 USI 63000 Internal
Document RCnD, BARC, Feb. 2005
10. A. Biere, et.al., Bounded Model Checking
Vol. 58, Advances in Computers, 2003
(Academic Press).
BARC NEWSLETTER
FEATURE ARTICLE
Development of Digital Radiotherapy
Simulator: A Device for
Tumour Localization,
Radiotherapy Planning and Verification
D.C. Kar, R. Sahu, K. Jayarajan, D.D. Ray and Manjit Singh
Division of Remote Handling and Robotics
Abstract
Radiation therapy is one of the established modes of cancer treatment. For the safe and effective radiation
therapy, it is necessary to plan and deliver the radiation beam accurately. Radiotherapy Simulator helps in
identifying the organs at risk and in localising the cancer-affected tissues. For teletherapy, the Simulator would
also help in choosing the right radiation beam and aiming it at the target. Although, radiotherapy simulator is an
essential tool for improving the quality of teletherapy, there is acute shortage of such machines in our country
due to the high cost of the imported units and the lack of indigenous technology. In fact, many cancer hospitals
with teletherapy units do not have radiotherapy simulator. Considering the growing incidence of cancer and
the need for such devices, Bhabha Atomic Research Centre (BARC), Mumbai has recently developed
a Radiotherapy Simulator. This article briefly describes some of the features of the indigenous Radiotherapy
Simulator.
Introduction
Cancer is a major health concern in our country,
and majority of the patients require radiotherapy
during the course of treatment. Radiotherapy
simulator is a machine that helps in radiotherapy
planning, prior to the treatment delivery. It helps
to diagnose the physical extent of the tumour
and its relation to the surrounding tissues for
proper selection of the size and orientation of
the radiotherapy beams. It also helps to plan the
treatment, to protect the critical organs adjacent
to the tumour to be treated. The capability of a
simulator for real-time review of the images and
their analysis helps in accurate planning and
verification in a short time. Advances in
acquisition, storage and transfer of images have
dramatically improved the image quality leading
to improved performances in radiation therapy
planning [1].
In India, there is wide gap between the demand
and availability of radiotherapy facilities [2].
Among the few centres with teletherapy facilities,
many do not have radiotherapy simulator for
accurate delivery of radiation therapy. They
generally depend on conventional radiography
units for tumour localization.
In the conventional form, a radiotherapy
simulator is similar to an isocentric external beam
therapy machine. It can reproduce the geometric
movements of (external beam) radiotherapy
machines. However, unlike a teletherapy
machine that delivers high-energy radiation
beams for treatment, a radiotherapy simulator
ISSUE NO. 318
I JAN - FEB 2011 I
63
FEATURE ARTICLE
BARC NEWSLETTER
uses diagnostic X-ray beams for imaging,
either in radiography or fluoroscopy mode.
Unlike the complex CT-Simulators, which
performs virtual simulations, radiotherapy
simulators are less expensive, and easy to
operate and maintain [3]. The conventional
design of Radiotherapy Simulator does not pose
any restriction on the size of the patient.
Considering the growing requirement for such
machines in our country, BARC has initiated the
development of radiotherapy simulator. The
development is successful and the first indigenous
collimator subassembly and the X-ray tube. The
imaging subsystem is mounted on the other end
of the C-arm. The collimator sub-assembly can
move radially closer to or away from the
isocenter to change the focus to axis distance
(FAD). This helps the simulator to adapt with
teletherapy machines of different source to axis
distances.The image intensifier arm also can
move radially closer to or away from the
isocenter. This helps in capturing images with
varying magnifications and avoiding collision
between the image intensifier and the couch,
during continuous gantry rotation.
Fig. 1: Indigenous Radiotherapy Simulator installed at
Indian Red Cross Society Hospital, Nellore, AP
Fig. 2: Schematic layout of the Radiotherapy Simulator
unit is installed in Indian Red Cross Society
Hospital, Nellore, Andhra Pradesh (Fig. 1). This
article describes the development in brief.
Brief Description of the Unit
Major sub-systems in the radiotherapy simulator
are gantry, collimator, X-ray tube, imaging unit,
patient support/positioning system, and remote
control console. The schematic layout of the
machine is shown in Fig. 2.
Gantry
The Gantry consists of a C-arm, which can rotate
about the longitudinal axis passing through the
isocenter. One end of the C-arm holds the
64
I
ISSUE NO. 318
I
JAN - FEB 2011
Collimator
The aperture control mechanism or the collimator
provides a rectangular opening of the X-ray
beam. Each side is independently controlled to
generate an arbitrary rectangular radiation field.
Both pairs of the jaws can be moved in
symmetric as well as asymmetric mode. The
collimator is designed with over-travel to suit the
latest radiation therapy units. Four independently
actuated delineator wires are provided to define
the tumour boundary within the radiation field
(Fig. 3). The collimator assembly can also be
rotated about an axis orthogonal to the gantry
rotation axis, passing through the centre of the
X-ray beam.
BARC NEWSLETTER
FEATURE ARTICLE
To visualize the projection of the X-ray field on
the patient’s skin, a field light projection
mechanism is used. An optical distance indicator
(ODI) system is also mounted on the collimator
to facilitate measurement of focus to skin
distance by projecting an optical scale on
patient’s body.
X-ray Tube
The X-ray Tube is of rotating anode type with
dual focal spots (0.4mm, 0.8mm) for sharper
image. It has high heat storage capacity for
Couch
The patient support/positioning system or couch
is a pit-mounted, isocentric platform with four
independently actuated motions: vertical linear,
lateral linear, longitudinal linear, and isocentric
rotation. It has a radio-transparent thin sheet of
carbon-fibre composite mounted on the top. The
couch platform can be lowered to a level
convenient for the patient to lie down. Two
keypads (Fig. 4) are mounted on either side of
the couch at convenient locations for interactive
patient setup. All the motions of the gantry,
collimator, and the image intensifier support arm
can be controlled through these keypads as well
as from the remote control console. The values
of important positioning parameters are
displayed on the wall-mounted display monitor.
The patient remains immobilized during
simulation with the help of restraining straps,
Fig. 3: Schematic layout of the collimated field
uninterrupted usage. 15° anode angle is adequate
to cover X-ray field sizes required for
radiotherapy simulation applications.
Imaging Sub-system
The imaging subsystem consists of a12" tri-field
image intensifier coupled with 1024 x 1024 - pixel
CCD camera system. It provides sharp digital
images in fluoroscopy as well as radiography
mode. It is interfaced with microprocessorcontrolled HF generator for quick image
processing. Automatic exposure control ensures
uniformity in dose per image. The camera-lens
assembly captures the images and passes in
digital form. The image intensifier support arm
has two orthogonal (lateral and longitudinal)
motorized motions for remote and interactive
positioning of the image intensifier at the region
of interest.
Fig. 4: Keypad located on the sides of the couch
blocks, masks etc to minimize patient’s motion
during simulation. This couch also has the
provision for the use of indexed positioning
devices for fast and accurate reproduction of a
setup.
Control Console
The control console is located at a remote
location outside the simulator room. After
immobilizing the patient on the simulator couch,
the operator leaves the room, and operates the
machine from this console. The control console
consists of a desktop computer, a mouse,
ISSUE NO. 318
I JAN - FEB 2011 I
65
FEATURE ARTICLE
BARC NEWSLETTER
a physical key switch, and two buttons for
activating the X-ray beam. One more desktop
computer is used for display and storage of the
acquired images. The operator can control all
the unit motions, viz. gantry, collimator, imaging
arm and the couch, through the graphical user
interface as shown in Fig. 5. The digital readouts
for all the motions remain displayed on the
console. For imaging, the operator can select
one of the two modes : fluoroscopy or
radiography. In fluoroscopy mode, the live
images of any moving organ can be viewed. This
mode can also be used while one or more unit
motions are active, for determining appropriate
beam (for therapy) directions. Static anatomical
images can be captured in the radiography mode.
For either of these modes, the operator can select
the exposure parameters, such as kV, mA and
mAs.
Fig. 5: Graphical user interface at the control console
66
I
ISSUE NO. 318
I
JAN - FEB 2011
Important features viz. automatic correction of
image distortion, last image hold, MLC (multi
leaf collimator) overlay, DICOM (digital image
communications in medicine) compatibility,
storage and management of acquired images,
annotations, image manipulation and viewing
tools, printing etc. are implemented for the
convenience of the user as well as smooth
workflow.
Auxiliary sub-systems
Patient Positioning Lasers
Accurate patient positioning is essential for
effective treatment simulation. The laser system
consists of three linear red diode lasers: two in
cross planes and one in sagittal plane. It is similar
to the laser system used for teletherapy
machines. The projections of these lasers mark
the isocentre, which serves as the reference for
BARC NEWSLETTER
FEATURE ARTICLE
various setup parameters in order to reproduce
exact positions on treatment machines.
Technical Specifications
Gantry Rotation
Safety Interlocks and Emergency Stop
Buttons
Many safety interlocks are provided to protect
the patient and the operators from unwanted
exposure to radiation. These include door
interlock of the treatment room (to prevent
exposure by accidental opening of door), external
mains power supply interlock and emergency
interlock (due to fault in any of the unit motions).
Emergency stop buttons are installed in the base
housing, couch, door, control console and on the
passage wall inside the room.
Visual Monitoring
Radiotherapy simulation requires special rooms
with adequate shielding to protect the operating
personals, the public as well as the environment
from the harmful effects of ionizing radiation.
During simulation, the patient is monitored
continuously from the control console through
the lead-glass window.
Wall Mounted Display
A monitor in the treatment room displays
important parameters related to the machine.
Whenever an authorized user logs into the
system, system parameters like FAD, image
intensifier distance, gantry rotation angle,
collimator rotation angle, positions of the
collimator blades, delineator wires, couch
longitudinal, lateral, vertical and isocentric
rotation etc. are displayed in the monitor.
At FAD =100cm (°)
± 185
Isocenter height (cm)
128
Max. Speed (rpm)
1
Auto stops (at deg)
± 90 & ± 180
Anti-collision
Logic
Focus to Axis Distance (FAD)
Range (cm)
80-120
Auto stop at FAD(cm)
80,100,120
Max. Speed (cm/min)
100
Collimator
Rotation (deg)
± 95
Max. Speed (rpm)
1.0
X-ray field (delineators)
Field size (cm x cm)
45 x 45 (max.)
Jaw motions
Independent
Max. overtravel (cm)
20
X-ray field (shielding jaws)
Field size (cm x cm)
0.5 x 0.5 to 50 x 50
Independent jaw motion
Yes
Over travel (cm)
20
Pairing delineators
Yes
FAD tracking
Yes
Image Intensifier Arm
Support Arm Motions
Longitudinal (cm)
±20
Lateral (cm)
±20
Radial (cm)
0 to 60
Auto recenter
Yes
Max. speed (cm/sec)
2.5
Anti-collision
Logic
X-Ray Generator
Power (KW)
65
KV Peak (KVp)
Fluroscopy
40-125
Radiography
40-150
Milli Amperage (mA)
ISSUE NO. 318
I JAN - FEB 2011 I
67
FEATURE ARTICLE
BARC NEWSLETTER
Fluroscopy
1-20
Radiography
1-800
Power Supply
400VAC, 3phase
X-Ray Tube
Focal Spot Size (mm)
0.4, 0.8
Target Angle (deg)
15
Heat Storage Capacity (KJ) 280
Image Intensifier
Tri-Field (max dia., mm)
290
Contrast Ratio
13:1
Conversion Factor
240 ((cd/m2)/(mR/s))
Central Resolution(lp/cm)
44
Couch
Motions
Vertical(cm, from floor)
68-135
Vertical speed (cm/min)
60, 110
Longitudinal (cm)
90
Longitudinal speed(cm/min) 35, 200
Lateral (cm)
Lateral speed (cm/min)
Isocentric Rotation (deg)
Anti-collision
Auto Setup
Table top
Carbon fibre
Transmission (mm,eq.Al)
Deflection (mm, at 90 Kg)
Load capacity (Kg)
Yes
1.0
< 2.0
135
Software
PC operating System
Storage of digital images
Network Mode
Calibration facility
MLC overlay on image
Image processing tools
WinXP/2000
Yes
DICOM
Yes
Yes
Yes
68
I
ISSUE NO. 318
Quality Assurances and Regulatory
Compliances
I
±20
35, 200
±95
Logic
Yes
JAN - FEB 2011
Radiotherapy simulator has major influence on
the overall performance of the radiation therapy
process. Although not used directly for the dose
delivery, its role is important in determining the
target location, treatment planning and spatial
accuracy in dose delivery. As the simulator has
many features of therapy machine and diagnostic
radiology unit, it has to conform to requirements
of both the applications.
The unit is tested and is found to be conforming
to the International Electrotechnical Commission
(IEC) Standards [4-6]. The machine will be used
clinically, after the clearance by Atomic Energy
Regulatory Board (AERB).
Conclusion
The technology for our indigenous radiotherapy
simulator is developed successfully. The first
machine is installed in Indian Red Cross Society
Hospital, Nellore, Andhra Pradesh. This
computer-controlled machine is simple and userfriendly. Other features of the machine, such as
filmless operations and ease of transfer and
storage of digital images can streamline the
workflow and improve overall performances of
the department. The indigenous machine is less
expensive, compared to imported simulators.
Therefore, smaller radiotherapy centres,
especially those at remote places, will be able to
afford this simulator, leading to safer and more
effective radiation dose delivery.
References
1. Cho, P. S., Lindsley, K. L., Douglas, J. G.,
Stelzer, K. J., and Griffin, T. W. (1998),
Digital
Radiotherapy
Simulator,
BARC NEWSLETTER
FEATURE ARTICLE
Computerized Medical Imaging and
Graphics, Volume 22, pp.1-7.
2. Jayarajan K., Kar D.C., Sahu R and Singh
Manjit, Bhabhatron: An Indigenous
Telecobalt Machine for Cancer Treatment,
BARC Newsletter, Founder’s Day Special
Issue, Issue No 297, October 2008, page
27-34.
3. Suhag V., Kaushal, V., Yadav, R., and Das,
B. P. (2006), Comparison of Simulator- CT
versus simulator fluoroscopy versus surface
marking based radiation treatment planning:
A prospective study by three-dimensional
evaluation, Radiotherapy and Oncology,
Volume 78, pp.84-90.
4. IEC 60601-1 – Medical Electrical
Equipment- Part 1: General Requirements
for Basic Safety and Essential
Performance,
Edition
3,
2004,
International
Electrotechnical
Commission, Geneva
5. IEC 60601-2-29 - Medical Electrical
EquipmentPart
2:
Particular
Requirements for the Safety of
Radiotherapy Simulators, Edition 2,
1999, International Electrotechnical
Commission, Geneva
6. IEC 61168- Radiotherapy SimulatorsFunctional Performance Characteristics,
Edition
1,
1993,
International
Electrotechnical Commission, Geneva.
ISSUE NO. 318
I JAN - FEB 2011 I
69
NEWS & EVENTS
BARC NEWSLETTER
National Conference on Advances in Nuclear
Technology (ADNUTECH 2010): a report
A two-day national conference on Advances in
Nuclear Technology (ADNUTECH 2010),
organized jointly by the Department of Atomic
Energy (DAE) and the Indian National Academy
of Engineering (INAE) was held during
December 2-3, 2010 at the Nabhikiya Urja
Bhavan, Anushakti Nagar, Trombay. The
Conference was aimed at highlighting the recent
advances in the field of nuclear technology in
India, including nuclear power scenario, emerging
reactor technologies, nuclear instrumentation,
control & computing, nuclear fuels and materials,
laser, plasma and accelerator technologies,
applications of radioisotopes in agriculture and
healthcare. The Conference hosted eminent
experts and academicians from the field of
nuclear technology in the country, who had been
invited to deliver talks during various plenary
sessions. Ms/s NPCIL and WIL were the
corporate sponsors of the Conference. The
Conference was attended by about 400 scientists,
engineers, academicians and technocrats.
Welcoming the galaxy of scientists and
technocrats, Shri V. K. Mehra, Director, Reactor
Projects Group & Convener, ADNUTECH2010, stressed on the significance of synergy
between R & D efforts at various centres of
the DAE and the industry, especially in the wake
of a global nuclear renaissance.
Dr. P. S. Goel, President INAE, also addressed
Dr. S.K. Jain, CMD, MDCIL inaugurating the technical exhibition at ADNUTECH. Dr. R.K. Sinha, Director, BARC
(extreme left) can be seen along with other senior scientists.
70
I
ISSUE NO. 318
I JAN - FEB 2011
BARC NEWSLETTER
NEWS & EVENTS
account, the concerns about global
climate changes and shrinking
reserves of conventional energy
resources.
Welcome address by Shri V. K. Mehra, Director, Reactor Projects
Group & Convener ADNUTECH
the gathering. He said that the INAE aims at
promoting developments in engineering and
sciences for their application to problems of
national importance. He added that developments
in the field of nuclear technology have proven to
be of immense benefit to the society and the
Academy would continue to support efforts in
this direction.
Dr. R.K. Sinha, Director, BARC, in his inaugural
address, spoke about various R & D initiatives
taken up by BARC. Dr. Sinha reiterated that
scientists and engineers at BARC strive
relentlessly to achieve the vision of Dr. Bhabha.
He stressed on the need to develop cutting edge
technologies so that we remain in the forefront.
He also highlighted the need to develop
technologies which address the needs of the
society. He impressed upon the need to develop
safe nuclear reactors in which security concerns
have to be addressed in the design stage itself.
The keynote address was delivered by the Chief
Guest Dr. Kirit Parikh, Chairman, Integrated
Research and Action for Development & former
Member, Planning Commission. Dr. Parikh
outlined the ways to achieve an equitable level
of human development in India, taking into
Shri R. S. Yadav, Associate
Director, Reactor Projects Group
and Secretary, Organizing
Committee ADNUTECH-2010,
proposed the vote of thanks. He
thanked all speakers, industry
sponsors and DAE units for
extending their whole-hearted
support in organizing the event.
Later, a technical exhibition
showcasing various technologies developed as
part of various programmes of DAE was
inaugurated by Dr. S. K. Jain, CMD, Nuclear
Power Corporation of India Limited. Various
industries participated in the exhibition and
showcased their products.
The Conference concluded with a discussion on
the key topic “Challenges for implementing
Nuclear Power Programme.” The panel chaired
by Shri V. K. Mehra, Director RPG & ESG,
BARC also included Dr. S. K. Jain, CMD
NPCIL, Dr. A. K. Suri, Director MG, BARC,
Shri S. C. Chetal, Director, REG, IGCAR,
Shri S. K. Chande, Vice-chairman AERB,
Shri G.P. Srivastava, Director, E & I Group,
Shri M. V. Kotwal, Sr. Ex VP & Director,
L & T Ltd. and Shri Kaustubh Shukla, COO,
Godrej Precision Engg. Ltd. Discussions were
centered around achieving installed capacity of
63 GWe of nuclear power by 2030 and the
contribution of nuclear power. Panelists felt that
a judicious mix of imported light water reactors
and indigenous PHWRs, would be necessary to
achieve the target. Contributions to be made by
designers, vendors, utilities, regulatory authority
to achieve the target, were also emphasized.
ISSUE NO. 318
I JAN - FEB 2011 I
71
NEWS & EVENTS
BARC NEWSLETTER
DAE-BRNS Workshop on
“High Resolution Gamma Ray Spectrometry
(HRGS-2010)”: a report
A two-day DAE-BRNS Workshop on “High
Resolution Gamma Ray Spectrometry using
HPGe detectors (HRGS-2010)” was organized
by the Radiochemistry Division, BARC,
Mumbai, during October 7-8, 2010. Gamma-ray
spectrometry plays an important role at every
stage of nuclear fuel cycle and is used
extensively to quantify fission and activation
products during operation of nuclear reactors
and other fuel cycle facilities, environmental
radioactivity near the site of nuclear fuel cycle
facilities and also in R&D work in
Radiochemical laboratories. With the advent of
commercially available high volume as well as
high-resolution HPGe detectors, gamma-ray
spectrometry plays an increasingly vital role in
detection, identification and estimation of gamma
emitting radionuclides, in the programme related
to Production and Application of radioisotopes.
For quantitative estimation of radionuclides, it is
necessary to calibrate the detector for absolute
detection efficiency as a function of gamma ray
energy in a standard source-to-detector
geometry. With an objective to bring uniformity
in gamma ray spectrometric measurements
carried out at various laboratories of DAE as
well as academic institutes, an intercomparison
exercise for the measurement of gamma-ray
emission rates of 133Ba and 152Eu sources using
HPGe detectors was conducted in 2002, by the
Radiochemistry Division, BARC and this was
followed by a two-day Workshop during June
19-20, 2003. It provided an opportunity for the
participants, to assess the relative accuracy
achieved by their individual laboratories and
scope for further improvement.
On the dais (L-R): Dr. V.K. Manchanda, Chairman, HRGS-2010 and Head, Radiochemistry Division, BARC
Mr. G. Nageswara Rao, Director (O), NPCIL and Dr. S. Kailas, Director, Physics Group, BARC
72
I
ISSUE NO. 318
I
JAN - FEB 2011
BARC NEWSLETTER
NEWS & EVENTS
It was observed that during the last seven years
there was significant growth in the number of
laboratories in various units of DAE, engaged in
gamma spectrometric analysis of a variety of
samples. Radiochemistry Division receives large
number of requests form various DAE
laboratories from all over the country for
lectures, training and supply of calibration
standards sources. With the main objective to
get acquainted with recent progress made in
gamma ray spectrometry, gamma spectrometric
analysis using advanced software, efficiency
calibration and also to bring uniformity in gamma
ray spectrometric measurements in various labs,
the present two-day BRNS sponsored Workshop
was organized at Computer Division Auditorium,
BARC, Mumbai. There was an overwhelming
response from various units of DAE including
BARC. A total of 127 delegates participated from
various units/divisions of NPCIL, ESL, Health
Physics units, IRE, AMD, BRIT, RMC, AFFF,
IGCAR and BARC.
The Workshop was inaugurated on 7th October
2010. Dr. V.K. Manchanda, Chairman, HRGS2010 and Head, Radiochemistry Division, BARC
delivered the welcome address and explained
the relevance of this workshop. He also gave a
brief account of contribution of Radiochemistry
Division for the said purpose over the years. Dr.
S. Kailas, Director, Physics Group, BARC gave
inaugural address and highlighted the importance
of gamma-ray spectrometry in various activities
in DAE and applauded the efforts of the
members of RCD for organizing HRGS-2010.
Shri G. Nageswara Rao, Director (O), NPCIL
was the Chief Guest and in his remarks, he
emphasized the need for accurate determination
of radionuclides in nuclear power programme
for which knowledge in latest developments in
gamma ray spectrometry and expertise are very
essential, for the scientists working at NPCIL.
Dr. Sarbjit Singh, Convener, HRGS-2010,
Radiochemistry Division, BARC proposed the
vote of thanks.
The Workshop consisted of six lectures including
demonstration of analysis of gamma-ray spectra.
The resource personnel were: Dr. A. Goswami
– Interaction of gamma-ray with matter, Dr. B.S.
Tomar- Detectors for gamma ray spectrometry,
Dr. Sarbjit Singh – High resolution gamma –ray
spectrometry, Shri S. Venkiteswaran –
Instrumentation for gamm-ray spectrometry, Dr.
R. Acharya – Analysis of Gamm-ray spectra
and Dr. K. Sudarshan – Demonstration of
gamma-ray spectra analysis with PHAST
software. Each lecture was followed by
discussion, in which sufficient time was given
for clarifications. Lecture notes were provided
to all the participants. The lecture notes contain
Standard Operation Procedures (SOP) for high
resolution gamma ray spectrometry,
determination of detector resolution, energy and
efficiency calibration and relevant nuclear data
on gamma-ray standard sources.
The feedback and valedictory session was held
on 8th October 2010, in which Dr. V. Venugopal,
Director RC&IG was the chief guest. Written
as well as verbal feed back was taken from the
participants. Dr. Venugopal gave his remarks on
HRGS-2010 and appreciated the effort of RCD
for conducting this two-day workshop. Dr.
Venugopal also distributed the participation
certificates to the delegates. Dr. V. K.
Manchanda, Chairman, HRGS-2010, thanked
Director, RC&I Group as Chairman, RTAC,
BRNS for support, all the resource persons for
excellent technical programme and delegates for
very active participation. Dr. Sarbjit Singh,
Convenor, HRGS-2010 briefed about the
experience of the workshop and future work in
this regard.
ISSUE NO. 318
I JAN - FEB 2011 I
73
NEWS & EVENTS
BARC NEWSLETTER
Workshop on Protection against Sabotage
and Vital Area Identification: a report
IAEA-India National Workshop on “Protection
against Sabotage and Vital Area
Identification” (VAI) was organized at
Mumbai during October 4 – 8, 2010. This was
the first National workshop organized in India
with IAEA on “Protection against Sabotage
and Vital Area Identification”. The workshop
was held at CTCRS building, AERB complex,
Anushaktinagar, Mumbai.
The workshop was inaugurated by Shri S K
Chande, Vice Chairman, Atomic Energy
Regulatory Board (AERB), India. The workshop
was attended by 33 participants from different
DAE organizations. Participants were carefully
chosen to represent various types of nuclear
facilities like nuclear power plant, back end
and front end fuel cycle facilities and
regulatory bodies etc. A total of 16 faculty
members were involved for deliberations
lectures and for conducting workgroup
exercises. There were 4 expert faculty members
Group of participants at the Workshop
74
I
ISSUE NO. 318
I
JAN - FEB 2011
from abroad: 2 from Sandia National Laboratory
(SNL), USA, one from Lithuania and one IAEA
staff member. 12 faculty members from India
were involved in lecture presentation and as
workgroup instructors.
The workshop duration was 5 days which
included 19 lectures and 7 workgroup exercises.
Topics covered in the workshop were Vital Area
Identification process, Protection against
sabotage, Policy Consideration for VAI,VAI
process including logic development,
Management and organization of VAI process.
Workshop material was printed in three different
sets providing lecture presentation, text and
subgroup exercises. A Workshop CD containing
all the presentations was also prepared.
Workshop kit containing three printed books, a
CD and other necessary materials were
distributed to all participants and faculties.
The workshop was concluded on 8th October
afternoon after a
feedback session
from the participants.
Certificates were
distributed to all
participants by Shri G.
P. Srivastava, Course
Director, Shri Jose
Rodriguez, IAEA,
Shri Bruce Vernado,
Mr. Bruce Berry
from SNL, USA
a n d D r. G e o r g i j
Krivoshein from
Lithuania.
BARC NEWSLETTER
NEWS & EVENTS
Valedictory Function of the Health Physics
Training Course 15th Batch: a report
The Health, Safety and Environment Group
concluded of its regular one-year training course
for science graduates. These graduates were
recruited for operational radiation protection and
associated functions of the nuclear fuel cycle
facilities. The valedictory function of this course
was held at the auditorium of Radiation Protection
Training & Information Centre on November 08,
2010. Dr. S. Kailas, Director, Physics Group
was the chief guest for the function. Dr. A. K.
Ghosh, Director, Health, Safety & Environment
Group, Dr. D. N. Sharma, Associate Director,
HS&EG, Mr. R. Bhattacharya, Secretary, AERB,
Dr. P. K. Sarkar, Head, Health Physics Division
and Mr. R. G. Purohit, Head, ORPRS, HPD were
also present on the dais. The invitees included
course coordinators, faculty members and senior
officers of Health, Safety & Environment
Group.
Dr. P. K. Sarkar welcomed the chief guest,
dignitaries, invitees and the faculty. He presented
a brief outline of the training course which was
started in 1989 with the specific objective of
developing trained manpower in the specialized
discipline of radiological safety required for the
nuclear fuel cycle facilities, including nuclear
power plants. He observed that, Health Physics
being a specialized discipline, a combination of
different branches of science and engineering,
is not offered as a regular course by any of the
universities in India.
He remarked that over the years, the Health
Physics training programme has undergone
significant changes with respect to the syllabus,
structure of the training programme, training
methodology, assessment procedures etc. The
changes were based on the feedback received
from the faculty and the trainees and under the
expert guidance of the apex committee and was
essentially required, to bring up this training to
meet the growing needs of our department and
maintaing our training programmes with
international standards.
He expressed happiness over the fact that
presently the Health Physics training programme
was acknowledged by other Divisions of BARC
and that HPD had extended guidance and
assistance to others when it became mandatory
in BARC that all recruitments of technical staff
shall be through formal training schemes only.
He noted that a large number of faculty and
senior officers were associated with the training
programme and that Health Physics Division had
received whole-hearted cooperation from a
number of Officers in arranging the practicals
and the On-the-Job Training at different
facilities. He attributed the success of the
training programme to the combined efforts of
all Divisions of HS&EG. He congratulated all
the 35 trainees for their excellent performance
and welcomed the youngsters.
Dr. D. N. Sharma, Associate Director, HS&EG
while addressing the gathering, congratulated the
trainees for their hard work which has resulted
in their excellent performance in the course and
enabled them to score additional increments in
the Scientific Assistant grade at the time of
absorption. He called upon them to continue their
studies and to get actively involved with the
ongoing programmes of the department. On this
occasion, he recalled his continuing association
with the training programme for the past few
ISSUE NO. 317
I JAN - FEB 2011 I
75
NEWS & EVENTS
BARC NEWSLETTER
years from the process of selection of the
trainees to their final absorption interview.
In his presidential address, Dr. A. K. Ghosh,
Director, HS&EG observed that the objective
of the training programme was to give the
candidates an in - depth awareness on the
systems, procedures and technical aspects. It
was also required to prepare them to adopt a
scientific approach to the tasks assigned, to
inculcate an analytical attitude in solving
problems and to develop the required skills in
their respective field of work. He appreciated
the structure of the training programme and the
syllabus, covering a wide variety of subjects
including basic sciences, nuclear engineering and
nuclear fuel cycle facilities.
He also expressed his happiness at the
encouragement received from the Atomic
Energy Regulatory Board for this training course
through the ‘AERB awards to the merit holders’
which is given to the 1st and 2nd rank holders of
each batch.
In the valedictory address, the Chief Guest, Dr.
S. Kailas, Director, Physics Group stressed on
the importance of formal training to make oneself
understand the concepts of nuclear and
radiological safety aspects and also to have a
clear awareness of the systems. He appreciated
the efforts of Health Physics Division to impart
professional training to the graduates in this
specialized discipline and to make them
competent to shoulder the responsibility of
ensuring radiological safety in the nuclear
facilities. He also congratulated the Health
Physics Division for their efforts in building up
a full-fledged infrastructure for carrying out the
training programmes uninterruptedly for the last
20 years. The function concluded with a vote of
thanks by Mr. R.G. Purohit, Head, ORPRS,HPD.
Chief guest, Dr. S. Kailas addressing the gathering. Seated from left to right are Dr. P. K. Sarkar, Head,
Health Physics Division, Dr. A. K. Ghosh, Director, HS&EG, Shri R. Bhattacharya, Secretary, AERB, Dr. D. N. Sharma,
Associate Director, HS&EG and Shri R. G. Purohit, Head, ORPRS, HPD
76
I
ISSUE NO. 317
I
JAN - FEB 2011
BARC NEWSLETTER
NEWS & EVENTS
National Science Day Celebrations at BARC
It was on 28th February 1928, that the great
Indian Physicist Sir C.V. Raman discovered the
Raman Effect, while working in the laboratory
of the Indian Association for the Cultivation of
Science, Kolkata. He received the Nobel Prize
in Physics in 1930, for his work on the scattering
of light and for the discovery of the effect named
after him. This day is of great importance for
the Indian scientific community and is celebrated
all over the country every year, as National
Science Day.
The Scientific Information Resource Division
took the initiative of celebrating the National
Science Day at BARC. It was celebrated on
28th February, 2011, at the Central Complex
auditorium. As part of the programme, the
following events were organized.
1.
Fusion Engineering Exhibition: The
International Thermonuclear Experimental
Reactor (ITER) is one of the most
ambitious programmes which was
launched in 1985, to develop Fusion
energy as a viable energy alternative and
to harness it for peaceful purposes. India
became a member of this international
collaborative activity in 2005. A number
of R&D projects are currently being
carried out in various Divisions of BARC
as well as in other DAE units. The
exhibition gave a flavour of all these global
activities through posters, publications and
audio-visual presentations.
2.
Homi Bhabha Pavilion: The life and the
work of Dr Homi Jehangir Bhabha was
portrayed through a series of posters. It
Dr. Srikumar Banerjee, Chairman, AEC inaugurating the Fusion Engineering Exhibition
ISSUE NO. 317
I JAN - FEB 2011 I
77
NEWS & EVENTS
BARC NEWSLETTER
was a fitting tribute to this great visionary
on this day, who pioneered the
development of nuclear energy in India
and laid a firm foundation.
3.
BARC Technologies: R&D spinoffs:
Over the years, BARC has developed a
large number of technologies, some of
which have even been transferred to
various private firms for industrial
production. All these technologies were
showcased in the form of posters. BARC
Scientists and Engineers who were
involved in the development of these
technologies, were present on the
occasion, to interact and explain the
significance of these technologies.
All the three exhibitions of one month duration
were inaugurated by Dr. Srikumar Banerjee,
Chairman, Atomic Energy Commission. Dr.
Banerjee showed keen interest in the exhibits.
Dr. K. Bhanumurthy, Head, SIRD extended a
warm welcome to all the invitees and colleagues.
Dr. A.K. Suri, Director Materials Group,
BARC, introduced the Chief Guest, Shri S.K.
Sharma, Former Chairman, AERB. Dr.
Banerjee gave an invited talk on “Order and
Chaos”. On this occasion, a compilation of
R&D publications of Dr. Srikumar Banerjee,
both in the form of hard copy volumes as well
as a CD, (compiled by SIRD) was released by
the Chief Guest. Shri R.K. Singh, Head,
MR&PAS, SIRD gave a vote of thanks.
Dr. R.K. Sinha, Director, BARC also visited
these exhibitions on the 4th of March, 2011 and
appreciated the effort. About 600 scientists and
engineers have visited these exhibitions so far.
Dr. R.K. Sinha, Director, BARC at the Fusion Engineering Exhibition, Dr. A.K. Suri, Director, Materials Group and
Dr. K. Bhanumurthy, Head, SIRD can be seen with him.
78
I
ISSUE NO. 317
I
JAN - FEB 2011
BARC NEWSLETTER
BARC Scientists Honoured
Name of the Scientists:
Mr. N.K. Goel, Virendra Kumar, Y.K. Bhardwaj and S.Sabharwal
Radiation Technology Development Division, Radiochemistry and Isotope Group
Title of the paper
:
“Radiation synthesized stimuli-responsive HEMA-co-MAETC hydrogels”
Award
:
Best Poster presentation award
Presented at
:
3rd Asia Pacific Symposium on Radiation Chemistry (APSRC-2010) and
DAE BRNS 10 th Biennial Trombay Symposium on Radiation and Photochemistry
(TSRP-2010)” held at Lonavla during September 14-17, 2010
Name of the Scientist :
Mr. S.K. Lalwani, Electronics Division
Award
:
“NDT Achievement Award-2010” for his outstanding contributions
Awarded by
:
to “R&D in NDT”
Indian Society for Non-destructive Testing (ISNT), Mumbai chapter
Name of the Scientist :
Ms. Shagufta Shaikh, Medical Division
Title of the paper
“Bull’s Multirule Algorithm, An Excellent means of Internal Quality Control for Hematology
:
Analyzers”
Award
:
Best Paper Award 2nd prize
Presented at
:
AIIMT 20 th Congress of Bio-Medical Laboratory Science held at Tiruchirappali,
Tamil Nadu during Dec. 18-19, 2010
Name of the Scientist :
Dr. B.N. Jagatap
Outstanding Scientist & Head, Atomic & Molecular Physics Division
Honour
:
Indian
Elected unanimously as the President, Physical Sciences Section of the 99th Session of
Science Congress
:
99 th session of Indian Science Congress will be held at Bhubaneshwar during
January 03-07, 2012, to be jointly organized by Kalinga Institute of Industrial Technology
(KIlT) and National Institute of Science Education and Research (NISER).
Name of the Scientist :
Dr. H.S. Misra, Head, Molecular Genetics Section, Molecular Biology Division
Award
:
“B. S. Sarma Memorial Award- 2010” for his outstanding contributions in Biological
Awarded at
:
Chemistry and Allied Sciences
79th annual meeting of the society held at Indian Institute of Science, Bangaluru. organized
by the Society of Biological Chemsists of India.


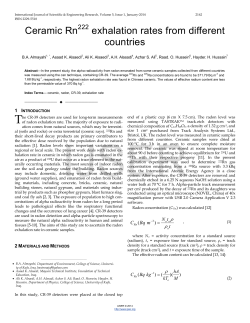

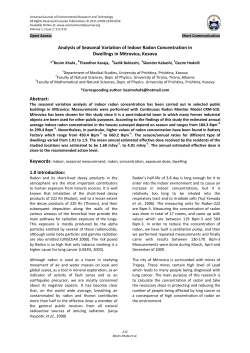


© Copyright 2026