
Dynamic bus lanes in Sweden – a pre-study
K2 RESEARCH 2015:5
Dynamic bus lanes in Sweden
– a pre-study
PROVDYK – Final report
JOHAN OLSTAM
CARL-HENRIK HÄLL
GÖRAN SMITH
AZRA HABIBOVIC
ANNA ANUND
© Copyright Johan Olstam, Carl-Henrik Häll, Göran Smith, Azra Habibovic och Anna Anund
Datum: 2015-08-20
ISBN: 978-91-7623-449-5
Tryck: Media-Tryck, Lunds universitet, 2015
De slutsatser och rekommendationer som uttrycks är författarnas egna och speglar inte nödvändigtvis
K2:s uppfattning.
Contents
Preface .............................................................................................................................................. 5 Sammanfattning .............................................................................................................................. 7 Summary........................................................................................................................................... 9 1. Introduction ............................................................................................................................ 11 1.1. Background ....................................................................................................................................................... 11 1.2. Purpose and goal ............................................................................................................................................ 11 1.3. Approach and outline .................................................................................................................................... 12 2. State of art ............................................................................................................................... 13 2.1. Purpose and goal ............................................................................................................................................ 13 2.2. Approach ............................................................................................................................................................ 13 2.3. The dynamic bus lane concept .................................................................................................................. 13 2.3.1. Variants of dynamic bus lanes ......................................................................................................... 15 2.3.2. System architecture............................................................................................................................. 15 2.3.3. Related concepts .................................................................................................................................. 16 2.3.4. Areas of application............................................................................................................................. 16 2.4. Level of service ................................................................................................................................................. 17 2.5. User experience ............................................................................................................................................... 18 2.6. Road safety ........................................................................................................................................................ 18 3. Specification of use cases considered in this pre-study ...................................................... 20 3.1. Purpose and goal ............................................................................................................................................ 20 3.2. Approach ............................................................................................................................................................ 20 3.3. Use case 1 – The present and near future .............................................................................................. 20 3.4. Use case 2 – The distant future .................................................................................................................. 21 4. Legal aspects ........................................................................................................................... 23 4.1. Purpose and goal ............................................................................................................................................ 23 4.2. Approach ............................................................................................................................................................ 23 4.3. Swedish road traffic legislation .................................................................................................................. 23 4.4. Lanes for certain vehicles ............................................................................................................................. 23 4.5. Variable messages........................................................................................................................................... 25 4.6. Road user liability ............................................................................................................................................ 26 4.7. Discussion and conclusions ......................................................................................................................... 26 5. System architecture ............................................................................................................... 28 5.1. Purpose and goal ............................................................................................................................................ 28 5.2. Approach ............................................................................................................................................................ 28 5.3. Overall dynamic bus lane system architecture .................................................................................... 28 5.3.1. System control unit ............................................................................................................................. 29 5.4. Solution I: Today and near future .............................................................................................................. 30 5.4.1. System control unit ............................................................................................................................. 30 5.4.2. User interface ......................................................................................................................................... 31 5.4.3. Compliance control unit .................................................................................................................... 31 5.4.4. Incremental system upgrade ........................................................................................................... 31 5.5. Solution II: Distant future.............................................................................................................................. 32 K2 Research 2015:5
3
5.5.1. Control system unit ............................................................................................................................. 32 5.5.2. Interface ................................................................................................................................................... 32 5.5.3. Compliance control unit .................................................................................................................... 32 5.6. Discussion and conclusions ......................................................................................................................... 33 6. Level of service ....................................................................................................................... 34 6.1. Purpose and goal ............................................................................................................................................ 34 6.2. Approach ............................................................................................................................................................ 34 6.3. Bus delays........................................................................................................................................................... 34 6.4. Level of service in the literature ................................................................................................................. 35 6.4.1. Effects with or without transit signal priority............................................................................. 35 6.4.2. Effects compared to dedicated bus lanes and normal mixed lanes .................................. 36 6.4.3. Effects due to weaving at the start of a dynamic bus lane ................................................... 36 6.4.4. Field tests ................................................................................................................................................ 37 6.5. Capacity effects in a Swedish context ..................................................................................................... 37 6.6. When are dynamic bus lanes applicable? .............................................................................................. 41 6.7. Discussion and conclusions ......................................................................................................................... 42 7. User experience and safety.................................................................................................... 44 7.1. Purpose and aim .............................................................................................................................................. 44 7.2. Approach ............................................................................................................................................................ 44 7.3. Workshop design ............................................................................................................................................ 44 7.4. Workshop results ............................................................................................................................................. 45 7.4.1. Experiences ............................................................................................................................................ 45 7.4.2. Reactions ................................................................................................................................................. 46 7.4.3. Consequences ....................................................................................................................................... 46 7.4.4. Design guidelines................................................................................................................................. 46 7.4.5. Future scenario ..................................................................................................................................... 47 7.5. Discussion and conclusions ......................................................................................................................... 48 8. Conclusion and future work .................................................................................................. 50 8.1. Conclusions ....................................................................................................................................................... 50 8.2. Potential cases for dynamic bus lanes based on lessons learnt ..................................................... 51 8.3. Further research needs and suggestions for next step ..................................................................... 52 9. References ............................................................................................................................... 53 K2 Research 2015:5
Preface
This report presents the results of the research pre-study PROVDYK (PRiOritering aV bussar genom
DYnamiska Körfält – en förstudie kring potential och begränsningar / Priority of buses by dynamic
lanes - a pre study of potential and limits). The project was conducted by a consortium including
research institutes (VTI and Viktoria Swedish ICT), academic institutions (Linköpings University and
Lund University), governmental organisations (Trafikverket and Transportstyrelsen), industry (Volvo,
Scania and FältCom) and municipalities (Lund, Malmö, Stockholm, and Göteborg). The work has
been organized into four work packages involving the following participants:
Legal aspects
System architecture
Level of service
User experience and
safety
Niclas Nilsson
Per Öhgren
Einar Tufvesson
Azra Habibovic
Johan Olstam
Azra Habibovic
Claes Pihl
Anders Berger
Lina Wigermo
Håkan Schildt
Basso Rafael
Leif Ohlsson
Mats Näsman
Göran Smith
Johan Olstam
Carl-Henrik Häll
Göran Smith
Samuel Yngve
Erik Lokka Hollander
Mattias Sjöholm
Mikael Thylander
Johan Irvenå
Inge Melin
Fredrik Pettersson
Göran Smith
Anna Anund
Samuel Yngve
Claes Pihl
Mattias Sjöholm
Kajsa Högenå
Hossein Ashouri
Inge Melin
Johan Hellberg
Rickar Winberg
The report was peer reviewed by Professor Tom Rye, Edinburgh Napier University.
Linköping, August 2015
Johan Olstam
Project coordinator
K2 Research 2015:5
5
K2 Research 2015:5
Sammanfattning
Busskörfält (körfält för fordon i linjetrafik m.fl.) och bussgator har under senare år blivit vanliga
åtgärder för att prioritera kollektivtrafik. Genom att säkerställa fri väg längs med bussrutten så bidrar
de till att öka bussarnas medelhastighet och restidssäkerhet. En nackdel är dock att den totala kapacitet
på dessa vägar minskar. Dessa åtgärder är således endast lämpliga när trafikflödet är tillräckligt lågt
för att klara en reducering av antalet körfält; när övrig trafik kan dirigeras om; eller när det finns
möjlighet att utöka vägen med ytterligare körfält. En alternativ åtgärd kan vara att använda dynamiska
busskörfält (internationellt även benämnt som ”intermittent bus lanes” och ”bus lanes with intermittent
priority”). Dynamiska busskörfält är endast reserverade för kollektivtrafik när kollektivtrafiken
behöver det och annars tillgängliga för alla fordon. Övrig trafik är endast förbjuden att använda det
dynamiska busskörfältet när det finns en buss i närheten. Denna rapport presenterar en förstudie som
undersökt vilken potential som dynamiska körfält har som åtgärd för prioritering av kollektivtrafik på
svenska vägar.
Kunskapen om i vilka trafiksituationer som dynamiska busskörfält har störst potential och vilka krav
och begränsningar som finns för ett införande i Sverige är otillräcklig. Det är också oklart hur ett
införande skulle påverka trafiksäkerhet, framkomlighet och användarna. Två fältförsök har
genomförts; ett i Lissabon och ett i Melbourne. Installationen i Melbourne blev permanent och
används för att prioritera spårvagnar på en vägsträcka. Fältförsöket i Lissabon blev inte permanent
även om resultaten visade på stora vinster for bussarna och endast begränsad effekt på övrig trafik.
Dynamiska busskörfält har även undersökts med hjälp av trafikmodellsanalyser och
trafiksimuleringsexperiment. Studierna visar på att effekten på bussarnas restid är positiv och att
fördröjningen för övriga fordon överlag är begränsad. Resultat från exempelberäkningar från denna
förstudie visar på att detta kan vara sant även för svenska förhållanden. Effekterna på restid beror
kraftigt på faktorer som: det totala trafikflödet; bussflödet; vägens- och korsningarnas kapacitet;
avståndet mellan korsningar och busshållplatser; typ av busshållplats; och väjningsregler vid
busshållplatser. Effekterna på restidsosäkerhet är oklara och behöver undersökas ytterligare.
Det har generellt sett genomförts få undersökningar av användarupplevelser och
trafiksäkerhetseffekter av olika bussprioriteringsåtgärder och slutsatserna från de undersökningar som
finns är delvis motstridiga. Erfarenheterna från Lissabon och Melbourne visar på att förarna i
närliggande körfält i allmänhet förstår och accepterar att de inte får använda det dynamiska körfältet
när bussen behöver det. Inget av fältförsöken visade på några negativa effekter på trafiksäkerheten.
Inom ramen för förstudien genomfördes en workshop för att ytterligare undersöka möjliga effekter
från användarnas perspektiv. Resultaten indikerar att: bussförarnas stressnivå kan komma att minska;
den relativa attraktiviteten för bussresor kan komma att öka; samt att privatbilister troligen kommer att
uppfatta dynamiska busskörfält som varken bra eller dåliga så länge systemet är intuitivt.
Det finns befintliga tekniska lösningar som kan användas för att implementera dynamiska busskörfält.
Ett system för dynamiska busskörfält skulle kräva utveckling av en styrapparat samt integrering med
buss-sensorer, detektorer (för att mäta trafikflöde), variabla meddelandeskyltar (för att informerar
trafikanterna om aktuella status för det dynamiska busskörfältet) och trafiksignaler. Vidare verkar det
möjligt att utforma lokala trafikregler för reglering av dynamiska busskörfält. En sådan regel måste
dock utformas, förmedlas och märks ut på ett korrekt och lättförståeligt sätt.
Förstudiens generella slutsats är att dynamiska busskörfält har potential och kan vara ett intressant
komplement för att prioritera kollektivtrafikfordon, speciellt när ett fast busskörfält inte är möjligt eller
önskvärt. Men en testinstallation i Sverige föregången av en trafikanalys behövs för att fullt ut kunna
utvärdera potentialen och konsekvenserna. Ett naturligt nästa steg vore således att genomföra en
projektering för en verklig implementation. Dels för att kunna utvärdera kostnader och dels för att
generera indata till studier av framkomlighet, förarbeteende och användaracceptans. Körsimulator- och
trafiksimuleringsexperiment är lämpliga metoder för att studera detta.
K2 Research 2015:5
7
8
K2 Research 2015:5
Summary
Dedicated bus lanes and bus streets have, in recent years, become common measures for prioritisation
of public transport. By ensuring free path along routes, they increase average speed and travel time
reliability of buses. However, a major drawback is that the total traffic capacities of the roads decrease.
Hence, these measures are only suitable when the total traffic flow is low enough to allow for a
reduction of lanes; if it is possible to reroute adjacent traffic; or if it is possible to extend the road with
additional lanes. A supplementary priority measure could be to utilize dynamic bus lanes (also called
intermittent bus lanes and bus lanes with intermittent priority). Dynamic bus lanes are only dedicated
for buses when and where the buses need them, and otherwise open for all vehicles to use. At any
given point, adjacent traffic is only permitted from using the dynamic bus lanes at the stretches where
buses are in the vicinity. This report presents the results from a pre-study, investigating the potential
that dynamic bus lanes could have as a priority measure for public transport in a Swedish context.
Knowledge of situations in which dynamic bus lanes have the highest potential, and their
implementation requirements is scarce. It is moreover uncertain how they would affect traffic safety,
level of service and user experience. Two real world field tests have been conducted; one in Lisbon
and one in Melbourne. The installation in Melbourne is now permanently applied for trams on one
street. The field test in Lisbon was on the contrary not made permanent, although the results showed
large benefits for buses and limited adverse effects on other vehicles. Dynamic bus lanes have also
been investigated by means of traffic analysis and traffic simulation experiments. In general, these
studies show that the effects on travel time for buses are in general positive and delays for other
vehicles are limited. Results from example calculations in this pre-study show that this also could be
true for a Swedish context. It has also been identified that the effects on travel times are highly
dependent on factors such as: the total traffic flow; the bus flow, the capacity of roads and junctions;
the distance between junctions and bus stops; the type of bus stops and the yielding rules at bus stops.
The effects on travel time variations are unclear and need to be further investigated.
Few rigorous research studies have in general been undertaken to measure the user experiences or road
safety implications of bus priority schemes, and evidence from those that do exist are mixed. Anyhow,
the experiences from Lisbon and Melbourne suggest that drivers in adjacent lanes in general
understand and accept that they are deprived of the right to use the lane when the buses need it, and
that they will behave appropriately. Neither of the field tests has observed any negative impact on road
safety. A workshop was conducted within this pre-study in order to further investigate plausible user
experiences. The results indicate that bus drivers’ stress levels could be reduced; the relative
attractiveness of travelling by bus might rise; and that motorists probably would experience the
introduction of dynamic bus lanes as neither good nor bad, as long as the system is fairly intuitive.
Technical solutions for implementing dynamic bus lanes exist. A dynamic bus lane system would
require development of a system control unit and integration with bus sensors, sensors for traffic flow
measurement, variable message signs (to inform road users of the current status of the dynamic bus
lane) and traffic signals. It is moreover, in Sweden, possible to develop a local traffic rule that
regulates dynamic bus lanes. However, the rule needs to be properly specified, designed,
communicated, signed and marked on the road.
The overall conclusion form the pre-study is that dynamic bus lanes could be a useful complementary
priority measure for public transport vehicles in Sweden, especially when dedicated bus lanes are not
feasible or desirable. However, a real world installation in Sweden, including pre implementation
traffic analysis, is needed, in order to further investigate the potential and consequences. Thus, the
next step is to plan for an implementation on a specific road stretch. That would include both
estimation of costs, and generate input to further studies of effect on level of service and user
experience. Driving simulators and traffic simulation experiments are applicable methods for
investigating these issues.
K2 Research 2015:5
9
10
K2 Research 2015:5
1. Introduction
1.1.
Background
Effectiveness and reliability have been identified as two key factors to increase the attractiveness of
public transport (Ipsos, 2013, Johansson et al., 2010). Thus, to not be impeded by adjecent traffic
along bus routes is critical for bus services’ performance. In mixed traffic, buses cannot perform better
than what the traffic situation allows them to, and traffic queues frequently delay buses, especially
during rush hour. This undermines the bus services’ reliability and effectiveness and thereby the
attractiveness of the transport mode. Dedicated bus lanes and dedicated bus streets have as a
consequence become common measures for separating buses from adjacent traffic. They have proven
to be effective in ensuring free path for buses and thus increasing both their average speed (Andersson
and Gibrand, 2008) and their reliability (Trafikverket, 2014b). A major drawback is however that the
total traffic capacity significantly decreases when dedicating one lane for the public transport. Hence,
these priority measures can only be used where and when the traffic flow is low enough to allow for a
reduction of normal lanes; if it is possible to reroute adjacent traffic; or if it is possible to extend the
road with additional lanes. More often than not, none of these alternatives are economically viable.
A supplementary priority measure is to utilize dynamic bus lanes (also called Intermittent Bus Lanes
(IBL) and Bus Lanes with Intermittent Priority (BLIP)). Dynamic bus lanes are only dedicated for
buses when and where the buses need it, and otherwise open for all vehicles to use. At any given point,
only the sections of the dynamic bus lane where buses are in the vicinity are dedicated for buses.
Therefore, dynamic bus lanes can, in appropriate settings (e.g. suitable traffic flow), ensure bus
accessibility without deteriorating the total traffic capacity. The measure moreover utilise existing
infrastructure and is thus a comparatively inexpensive priority scheme.
The concept of dynamic bus lanes was initially proposed by Viegas and Lu (1996). Since then
analytical evaluations, simulation studies and a field test has been performed. A version of the
measure has moreover been permanently applied for trams on one street in Melbourne since 2001
(Currie and Lai, 2008). The results of these studies indicate reduced travel time and travel time
variability, usually without any significant impact on adjacent traffic. However, knowledge of the
requirements for implementing dynamic bus lanes, in which traffic situations they have the highest
potential, and how they would affect traffic safety, level of service and user experience remains scarce.
Further investigations are also needed for assessing which design that can be used in a Swedish traffic
context.
1.2.
Purpose and goal
The aim of this pre-study was to investigate which potential dynamic bus lanes have as a measure to
prioritise public transport in a Swedish context. The following research questions were therefore
investigated:
•
•
•
•
•
What is the state-of-art of dynamic bus lanes?
Are there any legal constraints on their implementation in Sweden?
What technology is available and what technical solutions still need to be developed?
How would level of service for buses and for adjacent traffic be affected?
How would road users view and experience the introduction of dynamic bus lanes in Sweden; how
would they react and what consequences would the introduction thereby have, especially on road
safety?
K2 Research 2015:5
11
1.3.
Approach and outline
Reviewing the state of art and how it applies for a Swedish context has been the core of the pre-study
project. The pre-study was divided into four work packages, each package dealing with a specific
aspect of dynamic bus lanes. The packages were:
•
•
•
•
legal aspects (chapter 4)
system architecture (chapter 5)
level of service (chapter 6)
user experience and safety (chapter 7).
The methods and approaches utilised differ to some extent between the different work packages and
more detailed descriptions can be found in each chapter. The conclusions from the different work
packages are summarized and discussed in chapter 7.
12
K2 Research 2015:5
2. State of art
2.1.
Purpose and goal
This chapter describes current state of art regarding dynamic bus lanes based on an initial literature
review. The purpose was to understand how this pre-study could contribute to the knowledge field and
to create a common baseline for the pre-study project group.
2.2.
Approach
Literature to review was found through searches in the Scopus (http://www.scopus.com/home.url) and
Trid (http://trid.trb.org/) databases using the following keywords (with different synonyms for bus as
public transport, transit and tram):
•
•
•
•
•
•
•
•
•
dedicated bus lane
conditional bus priority
flexible bus lane
dynamic bus lanes
dynamic lane allocation
variable bus lanes
intermittent bus lanes
bus lanes with intermittent priority
reversible bus lanes.
The findings from the literature review were summarized in an interim report and discussed during the
project's start-up meeting. It was later used as baseline for developing use cases (presented in chapter
3) and as point of departure for pursuing the different work packages.
2.3.
The dynamic bus lane concept
The main goal with dynamic bus lanes is to utilise the existing infrastructure in order create the same
benefits for bus service as with dedicated bus lanes but with less impact on adjacent traffic. In other
words, the goal is that the travel time and travel time variability of buses should decrease without the
travel time and travel time variability for adjacent traffic deteriorating significantly. The method to
achieve this is to only dedicate the bus lane for buses when they need it. Figure 1 and Figure 2
illustrates the basic principles of the dynamic bus lane concept, which was originally described in
Viegas and Lu (1999) as:
"When a bus is approaching such a section, the status of the lane is changed to
BUS lane, and after the bus moves out of the section, it becomes a normal lane
again" (Viegas and Lu, 1999).
Figure 1 Illustration of the dynamic bus lane concept. (Illustrator: Göran Smith)
K2 Research 2015:5
13
Figure 2 Illustration of the dynamic bus lane concept. (Illustrator: Göran Smith)
Thus, the buses independency of adjacent traffic is guaranteed while adjacent traffic can use any lanes
when no bus is near. This leads to that the road's capacity reduction will both be much smaller
(compared to using dedicated bus lanes) and that it is directly related to the number of buses. For
example, the ideal reduced maximum capacity is 94% of the original capacity instead of 50% for a
two-lane road section with speed limit of 50 km/hour, with 5 minutes headway between buses and 500
meters free path in front of the bus1.
According to Eichler (2005), the travel time for buses on scheduled routes can roughly be estimated by
adding the following factors:
•
•
•
the length of the public transport line divided by the ideal speed
time at traffic signals (time due to red light + time due to queue)
time at bus stops (time of acceleration and deceleration + time of embarkation and disembarkation
+ time to get out to traffic).
If dynamic bus lanes are functioning properly, they remove all the traffic in front of the bus. The delay
to the bus arisen due to queues and the time to get in to traffic after the bus stops is therefore
eliminated. This reduces the buses average travel time and, since the main external factor is excluded
from the equation, the travel time variability (i.e. reliability) also increases. How large the reduction
becomes will vary from case to case and depends on e.g. the current traffic situation along the route
(Eichler and Daganzo, 2006). Dynamic bus lanes can preferably be combined with transit signal
priority (TSP), In this case, the travel time and travel time variability are reduced further since delays
due to traffic signals are minimized (Spinak et al., 2008).
In summary, the main benefits of introducing dynamic bus lanes are the following:
•
•
•
increases the attractiveness and perceived quality of buses by increasing efficiency and ensuring
reliability
reduces the operators' costs by enabling that the same service can be provided with fewer buses (if
the travel time reduction is larger than the length of the headway between buses) and reduces the
need for spare buses due to higher reliability
reduces emissions, including noise, by shortening travel times and reducing the number of
accelerations and decelerations.
1
If the bus travels at 50 km/h and there are no bus stops it takes the bus 36 s to traverse a road section of 500
meters, which means that this lane will be blocked 12% of the time and that the average blocking time
(theoretical capacity reduction) is 6 %.
14
K2 Research 2015:5
2.3.1.
Variants of dynamic bus lanes
Previous proposed variants of dynamic bus lanes can be divided into two categories: Intermittent Bus
Lanes (IBL) and Bus Lanes with Intermittent Priority (BLIP). The main difference is that other
vehicles that are already in the lane when it is converted into a bus lane are allowed to remain in that
lane in the IBL version, while in the BLIP version they must change lanes, see illustration of the
difference in Figure 3. Eichler (2005) who introduced bus lanes with intermittent priority argued for
this addition to the system since it becomes less dependent on traffic signal priority in order to avoid
the formation of queues in front of the buses. The version of dynamic bus lanes used for trams in
Melbourne is called Dynamic Fairway (DF) (e.g. Currie and Lai, 2008) and the system proposed in
Bologna is called Flexible Bus Lane (FBL) (e.g. Vreeswijk et al., 2008). The terms Moving Bus Lanes
(MBL) (e.g. Currie and Lai, 2008) and Dynamic Bus Lanes (DBL) (e.g. Joskowicz, 2012) are
moreover mentioned in the literature, but are more or less other denominations for IBL.
This report utilizes Dynamic Bus Lane (DBL) as an umbrella term for all the variants. It is however
mainly the IBL-configuration that is considered, as can be seen in chapter 3.
Figure 3 Illustration of the difference between intermittent bus lanes (IBL) and bus lanes with
intermittent priority (BLIP). (Illustrator: Göran Smith)
2.3.2.
System architecture
The basic design of dynamic bus lanes has three main components; a component for bus location, a
control component and a component for communicating the status of the lane to other road users
(Eichler, 2005). In the system that was tested in Lisbon, loop detectors were the primary tool for
locating the buses, and to measure traffic. The information was then sent to the control system that
determined which parts of the lane that should be reserved for buses. To communicate the lane status
to other road users, the control system then activated variable message signs and in-pavement lights
(Viegas, 2007). In addition, static signs were also used to inform road users. The experiences from
Lisbon were good and applications to patent technology were submitted (Girão et al., 2006).
Other dynamic bus lane systems proposed have had similar structures, but most often have had bus
location systems based on GPS. An illustration of a general system architecture and the different parts
of the system is shown in Figure 4. Many of the proposed approaches also combines the dynamic bus
lane with transit signal priority, which means that traffic signal control will be added to the system
architecture. The system might then also need to be coordinated with adjacent traffic management
system (Hounsell and Shrestha, 2005). Furthermore Viegas and Lu (2004) suggest that dynamic bus
lanes with signal priority should be coordinated along the complete bus route and not only for
individual junctions. Viegas and Lu (2004) state that:
K2 Research 2015:5
15
"In conclusion, joint consideration of IBL signals and traffic light signals at
intersections leads to lower time losses in bus operation, but these gains can be
significantly improved if there is an integrated control of several intersections
along the bus line, with bigger advantages obtained for bus movements, with less
similar delays imposed to adjacent traffic flow" (Viegas and Lu, 2004).
Figure 4 Illustration of an example of a system architecture. (Illustrator: Göran Smith)
2.3.3.
Related concepts
Two related priority measures that can be used to achieve similar goals to dynamic bus lanes (i.e.,
primarily to avoid queues at traffic signals without affecting adjacent traffic) are queue jumper lanes
and pre-signals. The queue jumper lane is a strategy that allows buses to use the right turn lane or the
shoulder at a signalized junction to the pass the queue (Guler and Menendez, 2013). Thus, the strategy
can simplify introduction of a dedicated bus lane just before the junction. Nowlin and Fitzpatrick
(1997), who introduced the strategy, concluded that the system in combination with signal priority can
increase average bus speeds up to 15km/h. Pre-signals, which was proposed by Wu and Hounsell
(1998), does the opposite, i.e. the dedicated bus lane is terminated a while before the signalised
junction (where pre-signal is installed). With this system, the bus will be first to the junction since
adjacent traffic is queueing at the pre-signal. This also means that the total capacity of the junction is
retained, since all lanes can be used by all road users. Different versions of pre-signals are in use in
London and Zurich (Guler and Cassidy, 2010) and an empirical study in Zurich Guler and Menendez
(2013) showed that the delay for buses at the junction was significantly less than that of the cars,
which suggests that the strategy does not affect the priority of buses negatively.
2.3.4.
Areas of application
The dynamic bus lane is a concept that can complement and/or be combined with established methods
for prioritizing bus services (particularly dedicated bus lanes and transit signal priority). Anyhow, for
dynamic bus lanes to be viable, there must be an alternative route for the adjacent traffic when they are
unable to use the dynamic bus lane. This alternative route could either be an adjacent lane on the same
road (most common in the literature) or in the form of an alternative road stretch (Vreeswijk et al.,
2008)). The application area that the literature focuses on is main roads with two or more lanes and
one or more signalized junctions, as exemplified by the statement by Eichler and Daganzo (2006):
"The primarily benefit to the bus is jumping traffic queues at intersections"
(Eichler and Daganzo, 2006).
However, there is not really anything that says that signalized junctions must be the cause of the traffic
situations that dynamic bus lanes are intended to resolve for the bus (Guler and Cassidy, 2010).
For dynamic bus lanes to be of any use, the problem that the measure attempts to overcome must be
what causes the buses delays, i.e. that they are hindered by adjacent traffic. If it for example is right
turns or pedestrians that cause bus delays, more infrastructure-intensive solutions such as Bus Rapid
Transit (BRT) systems should be considered (Eichler and Daganzo, 2006).
16
K2 Research 2015:5
If the bus gets stuck in traffic, it is usually because a high traffic density on the road. In other words,
there should be a relatively high traffic volume for dynamic bus lanes to have any effect. If the traffic
load varies a lot, the system can be defined so that it is only activated when the traffic flow exceeds a
certain limit. The traffic flow must not be too high though, since the capacity reduction with the
introduction of a dynamic bus lane could risk reaching critically high traffic density on the road
concerned. Eichler and Daganzo (2006) state that:
"The main factors determining whether an intermittent system saves time are: the
traffic saturation level; the bus frequency; the improvement in bus travel time
achieved by the special lane; and the ratio of bus and car occupant flows"
(Eichler and Daganzo, 2006).
2.4.
Level of service
Analytical studies, simulations and field tests have all been performed in attempt to estimate how
dynamic bus lanes affect the performance of both buses and adjacent traffic. Some of this previous
work is briefly covered in this section, and discussed in more detail in Chapter 6.
One of the most interesting papers of those presenting analytical models to estimate the effects of
dynamic bus lanes is that of Eichler and Daganzo (2006). The paper presents an analytical model
showing the effect of bus lanes with intermittent priority over road segments including several
junctions. Eichler and Daganzo (2006) conclude that dynamic bus lanes do not significantly reduce
capacity and that delays for other traffic is limited as long as traffic demand does not exceed the
capacity of the non-dynamic bus lanes. The analytical model of Chiabaut et al. (2012) also considers
the merging of vehicles that occurs where the bus lane with intermittent priority starts. This merging
reduces the capacity upstream, and this capacity drop will affect cars as well as buses upstream of the
first activation point. Viegas and Lu (2004) describe a dynamic bus lane system where there are
several bus lines operating within the same area. It explains how to calculate the signal setting within
the area when several connected bus lines exist - bus lines that can potentially affect each other.
Many papers describing simulation studies of dynamic bus lanes evaluate the introduction of a
dynamic bus lane in combination with the introduction of transit signal priority i.e. bus priority in
signalized junctions. So, from many of those studies it is difficult to draw any conclusions regarding
the effects of dynamic bus lanes in comparison to mixed-traffic lanes already operating with good
transit signal priority at junctions. However, the work of Carey et al. (2009) presents a simulation
study where it is possible to isolate the effects of dynamic bus lanes. The simulations use the
microscopic traffic simulation tool VISSIM (Fellendorf and Vortisch, 2010) and are based on a
scenario where the buses traverse a straight road, of approximately 2 km, including 9 signalized
junctions. The results show small effects on bus travel times using bus lanes with intermittent priority
and transit signal priority in comparison to only transit signal priority. The travel time variation for the
buses is nevertheless reduced significantly (15%).
Viegas et al. (2007) describe a real world demonstration project from Lisbon. In the project, a 600meter long dynamic bus lane was demonstrated and evaluated during six months in 2005-2006. The
results showed that the average bus speed increased approximately 20%, and that the average bus
speed during peak hour increased approximately 50% over the length of the intermittent bus lane.
Currie and Lai (2008) describe a real world implementation of a dynamic bus lane concept adapted for
tramways in Melbourne. The results indicate speed improvements in morning peak of approximately
10 % but only around 1 % in the afternoon peak.
To sum up, the analytical studies, simulations and field tests have indicated promising effects on travel
time and travel time variability for buses and adjacent traffic. However, assumptions and models are
poorly described and the conditions are not always applicable for a Swedish context.
K2 Research 2015:5
17
2.5.
User experience
Few of the reports, articles and presentations that were reviewed beforehand focus on how the
different types of road users might be affected by the introduction of dynamic bus lanes. There are
additionally no publicly available observations regarding how bus riders or bus drivers responded to
the introduction of dynamic lanes from either the field test in Lisbon or from the permanent tram
application in Melbourne. Spinak et al. (2008) include some comments regarding the behaviour of
other road users in Lisbon and Currie and Lai (2008) develop a few design recommendations based on
the experience from Melbourne. Eichler (2005) moreover presents his predictions on the impact on
different user groups, largely based on recorded results from introductions of similar systems. Lastly, a
few articles deal with the system’s impact on road safety (Goh et al., 2014, Yang and Wang, 2009).
The combined knowledge is summarized below.
Eichler (2005) predicts that bus riders would react similarly to how the Los Angeles residents did
when signal priority was introduced for some of their buses and thus decreased the buses’ travel time
and travel time variability. Results from before and after surveys indicated that the prioritization of
buses increased ridership, improved satisfaction and caused changes in the demographics of the user
group. Men and high-income earners started using the bus system more frequently (MTA, 2002). The
hypothesis presented in Eichler (2005) is that the bus riders’ experience would be noticeably affected
by how dynamic bus lanes changed the overall performance of the buses, but not so much of the
specifics of the design of the dynamic lane system.
Eichler (2005) argues, similarly, that the main influence on bus drivers’ experience would be how
their time schedules altered due to the introduction of the system. Faster trips and fewer delays could
lead to reduced fatigue and stress. It could however also, on the contrary, result in that the temporal
overlaps between loops (slack times) that currently are used as informal breaks vanish. The bus
drivers’ perceived workload would in that case become higher. Hence, Eichler (2005) notes that it is
essential to adapt the fundamental framework conditions for the bus drivers' work situation, such as
e.g. time schedules and shift length, to eventual changes in circumstances.
Both the field test in Lisbon and the application in Melbourne have reported good compliance from
other drivers (mainly car drivers). Good lane discipline has been displayed with regard to the systems
(Currie and Lai, 2008). Police enforcement was moreover only needed during the first few weeks in
Lisbon and primarily for informative and educational purposes (Viegas et al., 2007). Motorists have in
general understood and accepted that they do not have the right to use the lane when the buses need it
(Spinak et al., 2008). Currie and Lai (2008) list the following basic recommendations for a successful
implementation of dynamic bus lanes based on the experiences from Lisbon and Melbourne:
•
•
•
•
it must be clear to other road users what to do
it must be possible for other road users to do what is required
the system must provide a benefit for the bus or tram in terms of travel time or reliability, or both
it must be possible for the use of the lane to be enforced.
Currie and Lai (2008) lastly conclude that both the field test in Lisbon and the application in
Melbourne have demonstrated that other road users will modify their behaviours in response to the
dynamic lane system. Carefully positioning dynamic signs and marketing the concept to other road
users are however seen as key issues to make it work. An in-depth educational campaign aimed at
other road users is therefore seen as a prerequisite in many of the articles reviewed (e.g. Carey et al.,
2009).
2.6.
Road safety
Few rigorous research studies have in general been undertaken to measure the road safety implications
of bus priority schemes and evidence from those that do exist are mixed. In a rare attempt, Goh et al.
(2014) concluded that the bus priority measures in Melbourne addressed manoeuvrability issues for
18
K2 Research 2015:5
buses and thus reduces the proportion of accidents involving buses hitting stationary objects and
vehicles as well as collisions when buses are entering or leaving bus stops. The interaction of buses
and traffic at bus lane setbacks (the part of the nearside lane close to the stop line where there is no bus
lane and general traffic is permitted in order to maintain capacity at the stop line and to allow right
turns) and prolonged pedestrian crossings caused augmented safety concerns though.
The impact on road safety due to introduction of dynamic bus lanes is more or less unexplored and to
our knowledge there is no publicly available documentation of the road safety impact during the
Lisbon demonstration. However, Currie and Lai (2008) report that no particular changes in safety
compliance have been associated with the tram application in Melbourne. Yang and Wang (2009)
found in contrast, in a very simplified simulation model, that the number of traffic conflicts would
increase by between 20 and 50 % if dynamic bus lanes were to be introduced. Their main explanation
was that adjacent traffic would have fewer opportunities to change lanes to avoid conflicts due to the
reduction of lane availability and increased traffic density. Deploying dynamic bus lanes will however,
according to their study, yield less risk compared to introducing dedicated bus lanes since there are
still opportunities for adjacent traffic to use the bus lanes.
Eichler (2005) believes that the number of crashes would decrease when implementing dynamic bus
lanes, at least initially. Eichler (2005) likens it to when Sweden changed to right-hand traffic and
believes that other road users probably would drive more cautiously when confronted with unfamiliar
situations. Anyhow, he suggests that standard signs should be used as far as possible and stresses the
need for preventive educational campaigns.
To sum up, dynamic bus lanes does not seem to have a negative effect on road safety, but the
knowledge is still scarce.
K2 Research 2015:5
19
3. Specification of use cases considered in this pre-study
3.1.
Purpose and goal
The following framework conditions were developed and used as a baseline in the project. The
thought behind developing the framework conditions was to create a common ground between the
different work packages in order to make it easier to draw joint conclusion from the different
outcomes.
3.2.
Approach
The use cases are mainly constructed based on findings from the literature review above, discussions
during the start-up meeting and an initial joint review of how the dynamic bus lane concept might fit
in a Swedish context (including the legal aspects described in chapter 4).
3.3.
Use case 1 – The present and near future
Figure 5 Illustration of use case 1 - The present and near future. (Illustrator: Göran Smith)
The following framework conditions was considered for the first use case (2015 – 2035), i.e. if
dynamic bus lanes would be introduced in Sweden today.
•
•
•
•
•
•
20
Dynamic bus lanes are uncommon.
Road vehicles are generally neither connected, nor autonomous.
The primary application scenario is on multi-lane arterials with traffic signals. Speed limits are
thereby around 50 to 70 km/h.
The risk for vulnerable road users such as pedestrians and cyclists in the dynamic bus lane is low,
except in the vicinity of bus stops and pedestrian crossings. User groups can thereby roughly be
divided into car drivers, bus drivers and other professional drivers (drivers of trucks, taxis and
emergency vehicles).
Trucks and taxis do not have access to the dynamic bus lane when it is reserved for buses.
Non-prioritized vehicle that are in the dynamic bus lane when it becomes reserved for buses do not
have to leave it (the intermittent bus lane concept). The system is instead reliant on signal priority
to flush queues in front of the buses.
K2 Research 2015:5
•
•
•
•
•
•
•
•
•
•
•
•
The dynamic bus lane is situated in the outermost lane.
The dynamic bus lane passes several traffic signals.
The marking between the dynamic bus lane and the normal lane is solid (no passing) except at a
few points where the traffic in the normal lane can enter the dynamic bus lane. Information is
displayed at these points on whether the dynamic bus lane is reserved for buses or not.
The dynamic bus lane is introduced when a new road is built or replaces a normal traffic lane. A
dedicated bus lane is thus not redesigned into a dynamic bus lane.
The system is only active when the total traffic flow is within certain limits, i.e. normally not in
the middle of the day or when the traffic is completely stationary in a traffic jam or queue.
The reservation for buses is activated by the use of either GPS-signals and/or loop detectors.
The reservation for buses is made road section by road section.
The reservation for buses is activated earlier if the traffic flow is higher in order to guarantee free
passage for the buses regardless of the traffic conditions.
Violation of the rules of the dynamic bus lanes are treated in the same way as for dedicated bus
lanes.
The bus drivers do not have to do anything in order to activate the system or to reserve certain
sections for buses.
Neither bus drivers, nor other drivers get any information regarding the dynamic bus lane through
their vehicles’ information systems.
Dynamic signs do not display any information when the dynamic bus lane is not reserved for
buses.
3.4.
Use case 2 – The distant future
Figure 6 Illustration of use case 2 - The distant future. (Illustrator: Göran Smith)
The framework conditions for the present scenario also applies to future scenarios (>2035). However,
additions and changes to the framework conditions was considered for the future scenario.
•
•
Dynamic bus lanes are still quite uncommon, but there are examples in many of the bigger cities
in Sweden.
A majority of road vehicles are connected, which enables information sharing between vehicles
and between vehicles and the infrastructure. Many vehicles are also semi-autonomous, where a
K2 Research 2015:5
21
•
•
•
•
22
subset of decisions is shifted from the driver to the vehicle itself. All vehicles have drivers,
though, and all drivers must keep their hands on the steering wheel.
Connected vehicles display complementary information regarding the availability of the dynamic
bus lane through their information systems. Some autonomous vehicles can decide whether to
enter the dynamic bus lane or not.
The decision making process regarding when to reserve which part of the dynamic bus lane for
buses is smarter and more efficient compared to the present scenario, partly since the decision is
based on more information from buses and other vehicles.
The reservation of the dynamic bus lane is not made road section by road section. There is instead
a continuous “free passage distance” in front of the buses. The length of this distance is altered
upon traffic conditions.
Dynamic bus lanes are integrated with signal priority and adjacent traffic management tools at a
central level.
K2 Research 2015:5
4. Legal aspects
4.1.
Purpose and goal
This chapter describes legal framework regarding dynamic bus lanes. The aim was to identify if the
implementation of such lanes in a Swedish context would be feasible from the legal perspective, and
whether there are some specific constraints that require attention.
4.2.
Approach
This chapter is mainly based on a review of the relevant regulatory documents at the national and
international level, as well as discussions with the experts in the field.
4.3.
Swedish road traffic legislation
In Sweden, as well as in many other European countries, the traffic legislation is generally in
compliance with the Vienna Convention on Road Traffic (Economic Comission for Europe - Inland
Transport Committee, 1968b) (hereinafter referred to as the Convention). However, the Convention is
not directly applicable as a Swedish law and the authorities act in accordance with national legislation.
Basically, the provisions in the Convention are adapted into the Swedish Road Traffic Ordinance
(SFS 1998:1276) that includes provisions for on-road and off-road traffic. Sweden has also signed the
Vienna Convention on Road Signs and Signals (Economic Comission for Europe - Inland Transport
Committee, 1968a), and adapted its provisions into the Swedish Road Signs Ordinance (SFS 2007:90).
The Swedish government has the overall responsibility for ensuring that Sweden fulfils its obligations
in accordance with the conventions. However, the government has authorized municipalities and
county administrative boards to issue special road traffic rules and instructions for road signs and
markings in accordance with the ordinances.
Special road traffic rules for a specific road or section of road, or for all roads within a certain area or
for an area or track off-road, are issued via local traffic regulations. Chapter 10(1) of the Swedish Road
Traffic Ordinance (SFS 1998:1276) states that special road traffic rules may be issued via local traffic
regulations in respect of matters such as speed limits, prohibition of stopping and parking vehicles, a
specific area being used for lanes for public transport, restriction to smaller widths, etc. Chapter 10(2)
states that certain regulations with special road traffic rules may relate to a) a specific group of road
users, b) a specific vehicle type or specific vehicle types, or c) vehicles with loads of a specific nature.
In general, Swedish municipalities determine local traffic regulations for public roads in urban areas
(i.e. where the municipalities are responsible for the operation and maintenance of the roads). The
county administrative boards determine on local traffic regulations for public roads outside urban
areas (i.e. where the Swedish Transport Administration is responsible for operation and maintenance
of the roads).
4.4.
Lanes for certain vehicles
Public roads in Sweden are open to public traffic and it must be possible for all kinds of vehicles to
use them (SFS, 1971). Roads are divided into different carriageways and lanes. Some carriageways are
reserved for certain types of traffic, while others can be used by all kinds of traffic.
The current legislation does not leave much room for regulating special lanes or carriageways for
certain vehicles. However, the municipalities and county administrative boards can issue special road
traffic rules through local traffic regulations stating that certain lanes are lanes for public transport and
that they only may be used by public transport.
The lanes for public transport are indicated using the road sign D10. Mandatory lane or carriageway
for public transport, etc. (Figure 7a). Such a sign is generally applicable to the nearest junction, and
K2 Research 2015:5
23
repeated after the junction if it also applies after the junction. In situations when it is not clear that
such a road sign is not applicable any more, the road sign D11. End of lane or carriageway reserved
for public transport, etc. is used (Figure 7b). In addition, lanes for public transport are marked with
special road markings. Mark M6. Line for public transport vehicles, etc. indicates the boundary
between the lanes for public transport vehicles and another lane (Figure 8).
a)
b)
Figure 7. Example of signs for local traffic regulations: a) D10 and b) D11 (Source:
Transportstyrelsen 2 3)
Figure 8. Mark M6 (Source: Transportstyrelsen 4)
The Mandatory lane or carriageway for public transport sign is sometimes combined with an
additional road sign T6. Indications of valid time intervals (Figure 9). Also, road users can be
informed about the presence of a lane for public transport in advance by means of the additional road
sign T2. Distance or T12. Direction (Figure 10). Such preparatory information can also be included in
place indication signs.
Figure 9. Example of signs for local traffic regulations: T6 (Source: Transportstyrelsen 5)
2
http://www.transportstyrelsen.se/sv/vagtrafik/Vagmarken/Pabudsmarken/Pabjudet-korfalt-eller-korbana-forfordon-i-linjetrafik-mfl/
3
http://www.transportstyrelsen.se/sv/vagtrafik/Vagmarken/Pabudsmarken/Slut-pa-pabjuden-bana-korfalt-vageller-led/
4
http://www.transportstyrelsen.se/sv/vagtrafik/Vagmarken/Vagmarkeringar/Linje-for-fordon-i-linjetra-fik-mfl/
5
http://www.transportstyrelsen.se/sv/vagtrafik/Vagmarken/Tillaggstavlor/Tidsangivelse/
24
K2 Research 2015:5
a)
b)
Figure 10. Additional signs that can be used to inform road users about lanes for public transport: a)
T2 and b) T12. (Source: Transportstyrelsen 6 7)
Other than public transport vehicles, cyclists and moped drivers (class II) are also allowed to use the
lane for public transport if the lane is located on the right hand side in the direction of travel. If other
vehicles are allowed to operate in the lane, it is indicated on an additional road sign. Exception rules
stated in the Swedish Road Traffic Ordinance (SFS 1998:1276) permit also some other vehicles to use
such lanes under certain circumstances (e.g., vehicles used by the Swedish Prison and Probation
Service when transporting detainees or carrying out urgent errands, and ambulances transporting
patients to health care providers)).
It should also be noted that local traffic regulations must be in accordance with the Ordinance the
electronic publication of certain traffic regulations (SFS 2007:231). This means basically that local
traffic regulations, including those on lanes for public transport, need to be published electronically on
a special website. The website is hosted by the Swedish Transport Agency and is accessible without
any fees. The authorities whose regulations must be published on the website are responsible for the
accuracy of the information and for providing the information in electronic and safe manner to the
Swedish Transport Agency. The regulations shall be published on the website as soon as possible
before they enter into force.
4.5.
Variable messages
Variable messages and markers are commonly used today to communicate different types of
information to road users (Figure 11). Signs used to display such information are commonly referred
to as Variable Message Signs (VMS). Examples of such signs include: a) sign with speed limit altered
depending on weather or traffic conditions, or both, b) sign activated by speeding drivers, c) parking
sign showing if there are available spaces in a car park, d) tunnel management, i.e. overhead signs
showing which lanes can be used for entering the tunnel, e) lane allocation at junctions, and f) signs
warning for a danger.
Similarly to the static road signs described in the previous sections, the design and position of VMS
must be in line with the Swedish Road Signs Ordinance (SFS 2007:90) and thereby comply with the
Recommended Signs of the Vienna Convention for Use on VMS (Economic Comission for Europe Inland Transport Committee, 2010). One of the key requirements stated in the ordinance is that VMS
should allow road users to see and understand them in time.
6
7
http://www.transportstyrelsen.se/sv/vagtrafik/Vagmarken/Tillaggstavlor/Avstand/
http://www.transportstyrelsen.se/sv/vagtrafik/Vagmarken/Tillaggstavlor/Riktning/
K2 Research 2015:5
25
Figure 11. Examples of variable speed limits. (Photo: Magnus Pajnert and Joakim Kling8)
4.6.
Road user liability
The Swedish Road Traffic Ordinance (SFS 1998:1276) demands that road users respect traffic rules.
The authority responsible for a given rule (e.g., Mandatory lane or carriageway for public transport,
etc.) must ensure that the road signs indicate same information to road users as stated in the local
traffic regulations. A pre-condition for a road user to be liable for violation of such a rule is thus that
the regulations are published correctly and marked out correctly in accordance with the Swedish Road
Signs Ordinance (SFS 2007:90) . This means that the police, prosecutors and courts need to assess the
following regarding the rule Mandatory lane or carriageway for public transport:
where a given lane for public transport starts/ends according to the regulations
if a given lane for public transport is properly marked out
if the regulations regarding a given lane for public transport are properly announced on the public
website for traffic regulations
if the road user was allowed to travel in a given lane for public transport and if the violation is
done intentionally or negligently.
•
•
•
•
4.7.
Discussion and conclusions
Based on the previously described road traffic legislation in Sweden, a reasonable conclusion is that
creating a traffic rule that regulates dynamic bus lanes may be possible. However, the rule needs to be
properly designed, explained and marked out.
Introducing a new traffic rule for dynamic bus lanes may require measures ensuring compliance with
such a traffic rule and how to allocate liability and prosecute those who violate the rule. One
prerequisite for allocating liability in accordance with the Swedish Road Traffic Ordinance (SFS
1998:1276) and the Swedish Road Traffic Offences Act (SFS 1951:649) is whether the driver is
deliberately or unintentionally breaching the provisions.
The issue of allocating liability is similar to the issue that authorities face today regarding compliance
with the systems for variable speed limits. However, the compliance with the static dedicated bus
lanes in Stockholm is relatively good, i.e. it is uncommon that unauthorized vehicles enter and travel
in such lanes. Similar conclusions can be drawn for the Malmö and Lund area.
It should also be noted that given the current traffic legislation, it might only be feasible to mark
dynamic bus lanes by means of static road traffic signs and Variable Message Signs (VMS). These
should, similarly to the current systems for variable speed limits, be in compliance with the Swedish
8
http://www.trafikverket.se/Pressrum/Bilder-och-filmer/Bilder/Variabla-hastigheter/
26
K2 Research 2015:5
Road Signs Ordinance (SFS 2007:90) and with the Vienna Convention on Road Signs and Signals
(Economic Comission for Europe - Inland Transport Committee, 1968a). Solutions involving light
emitting diodes (LEDs) in the roadway, or similar technical solutions, are currently either not allowed
or have no formal meaning. In the long term, however, even such technical solutions may be feasible.
K2 Research 2015:5
27
5. System architecture
5.1.
Purpose and goal
This chapter describes technical solutions that may be used to facilitate dynamic bus lanes on a road in
Sweden.
5.2.
Approach
The technical solutions presented in this section have mainly emerged from an in-depth literature
review and several expert discussions in workshops (Figure 12). The literature review has focused on
identifying system components and technologies used in the previous studies (see chapter 2 for more
details). The discussions focused on identifying how dynamic bus lanes can be applied in typical
Swedish traffic contexts. Also, the discussions considered current and future technology trends and
how these could affect development of dynamic bus lanes in Sweden.
Figure 12 Approach used to identify possible technical solutions.
The study has identified an overall architecture for a dynamic bus lane system that could be applied in
a typical traffic context in Sweden. Based on that architecture, two solutions for two different timehorizons are identified where the major difference lays in the number of connected and automated
vehicles (Table 1), see chapter 3.
•
•
Solution I: The present and near future (< 2035).
Solution II: Distant future (> 2035).
Both the overall architecture and the two solutions are presented in the following sections.
Table 1. Major differences between Solution I and Solution II
Solution I
Solution II
Number of connected vehicles
Few-many
Majority
Number of automated vehicles
Few
Many
5.3.
Overall dynamic bus lane system architecture
The overall architecture of the dynamic bus lane system suggested in this study is shown in Figure 13.
It consists of the components.
•
28
System control unit - This is a unit where decisions to activate/deactivate the dynamic bus lane
system are made. The decisions are typically based on information from various sources, including
traffic signal information and traffic sensors as well information about buses (e.g., position). The
K2 Research 2015:5
•
decisions could also be based on the information from the traffic control centre having the overall
responsibility for the traffic in the area.
User interface - This is an interface that informs the road users about the presence of the dynamic
bus lane and its current status.
In addition, the dynamic bus lane system could also be supplemented with a Compliance control unit
that ensures that the road users respect the dynamic bus lane, i.e. avoid accessing the lane when it is
available only to buses.
Figure 13 Overall architecture of the Dynamic bus lane system suggested in this study.
5.3.1. System control unit
The system control unit is central to the dynamic bus lane system. Currently, it is difficult to say
anything definite about processing requirements for this unit. However, it is necessary that the unit is
reliable and that the processing is done in real-time.
In order to make decisions about when it is appropriate to activate a dynamic bus lane system, the
following parameters can be used individually, or in combination:
•
•
•
position of the bus
the priority needs of the bus
current traffic situation
It is also possible to include additional information such as current weather conditions and the number
of passengers in the bus.
The current traffic situation will determine whether it is appropriate to enable a dynamic bus lane. If
the traffic density is low, the bus can travel at a reasonable speed without activating the dynamic bus
lane system. If the traffic on the other hand is very dense, it may not be possible to create a dedicated
bus lane since there are many other (slow moving or stationary) vehicles. Depending on the traffic
situation, it may be required to activate the dynamic bus lane system earlier, or later (i.e. it is required
to take into consideration how long time it takes to clear the lane of vehicles already in it).
The settings where dynamic bus lanes might be introduced are likely to involve signalized junctions.
In order to guarantee that the other vehicles in the bus lane do not slow down the buses, dynamic bus
lanes involving a signalized junction should take into account traffic light status and transit signal
priority. Typically, a dynamic bus lane system relies on transit signal priority to clear the lane of
vehicles queued at traffic signals ahead of the buses. Transit signal priority can decrease bus travel
times by allowing buses to pre-empt or extend traffic signals to allow the buses to proceed through a
junction. Several studies have shown the benefits of transit signal priority, and it is today commonly
used in several larger Swedish cities. It should, however, be noted that the transit signal priority does
not apply at non-signalized roundabouts; buses cannot be prioritized there due to the nature of such
K2 Research 2015:5
29
junctions. There are, however, some indications that transit signal priority can severely impact crossstreet traffic as it changes the timing of any signal with which it interacts. This also complicates the
analysis of dynamic bus lane impacts by introducing additional delay to cross-street traffic.
Road users need to be notified of the presence of the dynamic bus lane in order to be ready for the lane
changing status to a dedicated bus lane. They need also to be clearly informed about the status of the
dynamic bus lane, that is, whether it is currently active or not.
There may be a need for a system that controls or facilitates the control of the dynamic bus lane
system compliance. This system may be standalone or integrated as a part of the dynamic bus lane
system.
5.4. Solution I: Today and near future
Solution I: Today and near future is based on the technology that is commercially available today and
can be used within the system without extensive further development. The solution makes the dynamic
bus lane dynamic only in the time perspective (i.e., the location of the dynamic bus lane is predefined
but its status changes over time from a lane for general traffic to a lane for buses).
The solution requires buses to be able to communicate with traffic signals and traffic management
centres (given that the dynamic bus lane incorporates signalized junctions). However, the solution
does not require any other vehicles to be connected. The solution could however be upgraded as more
advanced technologies become commercially available and installed in vehicles. The technology that
needs to be installed in the buses and in the infrastructure to realize Solution I in its simplest form is
summarized in Table 2. It should be noted that a compliance control unit is not necessary for the
system operation. However, it could provide the system control unit with useful information as well as
ensure that other users respect the dynamic lane.
Table 2. Technology in the buses and infrastructure required for realization of Solution I
Buses
GPS (for bus
positioning)
Access to the bus time
schedule
Infrastructure
System control unit;
Static road signs (similar to the current road signs for
the stationary bus lanes)
Variable Message Signs (VMS)
Early warning signs – to all drivers
Sensor for traffic flow measurement (e.g. inductive
loops or cameras)
Input to control unit
Bus position and time
schedule (e.g., integrated with
bus operators)
Traffic density
Traffic signal status (incl.
transit signal priority)
5.4.1. System control unit
Buses operating in large Swedish cities are often equipped with communication units that enable them
to a) exchange information with the traffic management centres and b) exchange information with
traffic signals. Buses are also equipped with navigation systems (GPS) that allow both the drivers and
traffic control centres to keep track of the current position of the bus and its adherence to schedule.
Hence, incorporating the bus position and its time schedule into the dynamic bus lane system decision
would in theory not require any additional equipment on the buses.
To obtain information about the current traffic situation, some infrastructure-based sensors are needed.
Such sensors are already in use in Swedish traffic (e.g., inductive loop detectors and traffic cameras).
To start with, it may be sufficient to measure the traffic flow at one single point. However, decisionmaking may be improved if the traffic flow is measured at several points.
The system control unit is preferably integrated in the traffic management system since important
information is available there. However, placing the unit in the bus could be an option for a simple test
system with one or a few buses involved.
30
K2 Research 2015:5
5.4.2. User interface
Currently, it is not possible to wirelessly transmit information to all vehicles and display information
about the dynamic bus lanes by means of in-vehicle interfaces. Therefore, it is necessary to rely on
traditional technology in the form of road signs.
To inform road users of the current status of the dynamic bus lane, variable message signs are
recommended. The sign could be a gateway sign displaying the reserved bus lane sign (see Figure 7).
One or more signs may also be need to install in the infrastructure to make the road users aware of the
approaching dynamic bus lane. These signs do not necessarily need to be gateway signs; it may be
enough with signs at the side of the road.
Sustainability Innovation Inv
It is also recommended to have some form of signalling along the dynamic bus lane, e.g., in the form
of light in the roadway. This may, however, make the dynamic bus lane system more expensive and at
the same time make it less flexible. There are also legal constraints in the current Swedish legislation
which do not allow lights in the roadway (see the discussion in chapter 4).
An example of road signage for a dynamic bus lane that was evaluated
Lisbon is shownInnovation
in Figure Inventory
SII –inSustainability
12. An explanatory sign (left) tells drivers to look for signs indicating a change from a “regular lane”
Authors:
Abby
Spinak,
Dave Chiu,
Federico
Casalegno,
to a “bus lane.” When a bus is approaching in an dynamic
bus
lane,
the vertical
traffic
sign (centre)
July 2008
indicates that the lane has changed to aSustainability
bus lane,Innovation
whileInventory
lights between the dynamic bus lane and
adjacent traffic lanes (right) turn on to signal to vehicles that entering the dynamic bus lane is not
Intermittent Bus Lane System (Lisbon)
permitted.
The IBL indicators used in the 2005-2006 Lisbon test are shown below:
Figure 14. Road signs that were tested in Lisbon (Source: Viegas et al. (2007)).
Executive Summary
5.4.3. Compliance control unit
The Intermittent Bus Lane System is a traffic management system that improves the efficie
public transportation without significantly curtailing available road space for other vehicles
A dynamic bus lane is probably more difficult to monitor and enforce than a traditional bus lane. For
Buses are often considered less reliable than other forms of public transportation, because
example, a vehicle that enters the dynamic bus laneaffected
when by
thetraffic
dynamic
busand
lane
system
is activated
congestion
other
public roadway
delays. While designated bus lane
Figure 1: Signs Used in the Lisbon IBL. An explanatory sign (top right) tells drivers
to lookthese
for
address
delays, restricting
access
to bus lanes
results
in an inefficient use of road s
(i.e.
showing
red)
could
be
stopped
and
fined.
However,
if
a
vehicle
enters
the
dynamic
bus
lane
after
signs indicating a change from a “regular lane” to a “bus lane.” When a bus is approaching in an IBL,
other vehicles during high traffic conditions. However, low frequency bus routes (fewer tha
the vertical traffic sign (top left) indicates that the lane has changed to a bus lane, while lights
passing
theandsignal,
it lanes
may(bottom)
be difficult
to prove
that
the
vehicle
actually
crossed
the red
light,buses
andunhindered
not
buses/hour)
can
be managed
electronically
to allow
travel while keeping
between
the IBL
other traffic
turn on to signal
to cars that
entering
the
IBL is not
lane open to other traffic in between buses. This traffic management strategy, called the I
permitted.
entered the dynamic bus lane while it was still allowed.
Bus Lane (IBL) System, uses GPS information on bus locations and visual cues on the roa
Technology
& Experience
Roadmap
A possibility
is to incorporate
designate a bus lane as open or closed based on expected bus arrival times.
video monitoring, such as safety cameras or automatic reading of
Preliminary data from a Universidade de Lisboa IBL project implemented in Lisbon, Portug
license
plate,
and
thereby
provide
control.
Ininthis
case,demonstrated
the legal and
economical
months
2005-2006
an average
increaserather
in speed of public buses on the I
IBL systems can be configured in a number of different an
waysautomatic
to maximize efficiency
and reliability.
Because they rely on GPS data and electronic signals, IBL systems can be combined
withofother
route
20-25%.
At
times
of
peak
traffic
congestion,
bus speed
than
technical
aspects
set
the
limits.
As
mentioned
previously,
the
system
could
operate
without
a showed gains of up to 50%
available technology to effectively manage traffic flow in traffic-prone areas and encourage
use on
of non-bus traffic were shown to be insignificant in this study.
of the IBL
public
transportation.
compliance
control unit, however, it may be useful to include such a unit.
Transit Signal Priority (TSP) for Buses
5.4.4. Incremental system upgrade
The 2005-2006 Lisbon study additionally showed that drivers tended to accept the IBL and
comply with IBL traffic signals without the need for strict enforcement.
Transit Signal Priority (TSP) is a low-cost method of establishing right-of-way for buses – it enables
buses to extend green traffic signals to pass quickly through intersections. IBL studies indicate that
giving buses right-of-way through intersections offers the potential for significant time savings on bus
routes (Viegas and Lu, 2004). Combining IBL signals with TSP could therefore improve the efficiency
of public buses.
In about 5-10 years a large portion of the vehicle fleet in Sweden is expected to be connected via
cellular networks (4G / LTE, 5G) and short-range communication (802.11p). Currently, it is unclear
TSP for Non-bus Traffic in Intermittent Bus Lanes
what
will
equipped
with
these
communication technologies, but a reasonable
TSP
can proportion
also be used in anof
IBLvehicles
system to “flush
the be
queues”
of traffic ahead
of the
bus (Eichler,
2005). This traffic, which is allowed to stay in an IBL after an oncoming bus has been indicated, can
assumption
is
that
it
will
not
involve
the
entire
fleet.
It
is
natural to assume that Solution I
create delays during peak traffic conditions. Additional management strategies for this traffictherefore
could
make IBL systems more reliable.
will utilize these technologies as they become deployed (e.g., for positioning of vehicles in the vicinity
of the dynamic bus lane, providing in-vehicle information to the road users), but that external
Page 3
K2 Research 2015:5
31
signalling must remain. It is lastly also expected that applications for more detailed information about
buses (e.g., passenger counting) will emerge and eventually be included in decision making to
improve the control and effectiveness of the dynamic bus lane.
It is also likely that the traditional traffic flow measurement will be removed and that it will be
possible to rely on the information obtained from the connected vehicles.
5.5. Solution II: Distant future
Solution II: Distant future is in fact an upgraded version of the Solution I. It requires that a majority of
vehicles are able to exchange information with the system. According to Telematics Update, in the
time period 2023-2030 about 84% of vehicles are expected to have a connectivity solution, and this
number is expected to increase beyond 2030 (Telematics Update, 2013). It is also assumed that
automated vehicles constitute a significant part of the total vehicle fleet. The technology that is
required to realize Solution II is summarized in Table 3.
Table 3. Technology in buses, vehicles, and infrastructure that is required for realization of Solution II
Buses
GPS (for bus
positioning)
Access to the bus time
schedule
HMI enabling the driver
to influence the system
Load measurement
Infrastructure
Simple / fewer road signs
Other vehicles
Communication units
(4G/5G/802.11p)
In-vehicle HMI/nomadic
devices
Input to control unit
Bus position and time
schedule (e.g., integrated
with bus operator)
Traffic density
Weather conditions
Road conditions
Load factor of the bus
(e.g., weight)
5.5.1. Control system unit
The system has information about the current traffic situation down to the individual vehicle level and
can therefore make a very good forecast of the progression of the bus through traffic.
If the bus requires prioritization, individual cars are redirected so that they create a clear lane for the
bus. This can be described as an invisible “plough“ running a few hundred meters in front of the bus.
The plough could be designed in a way that clears only those vehicles that have low speed. This would
warrant that vehicles are not slowing down buses downstream.
5.5.2. Interface
A great majority of the other road users can be informed about the dynamic bus lane by means onboard interfaces and / or via portable devices. This means that the traditional signs in Solution I can be
removed to a large extent, however, the basic information about the dynamic lane will remain in the
infrastructure (equivalent to today's signage for the bus lanes). Automated vehicle will receive
information about the dynamic lane in the same way as they receive information about the traffic
signal.
There is also an interface in the buses that enables the bus drivers to obtain information about the
dynamic bus lane and, if needed, to influence the dynamic bus lane (e.g., send a priority request).
5.5.3. Compliance control unit
When the majority of the vehicles are connected, it will be possible to introduce new strategies for
compliance control. For autonomous vehicle, one can assume that there will not be any need for such a
control, as these vehicles will be programmed to obey traffic rules. Similarly, for vehicles that are
connected one could formulate strategies involving incentives that reduce the risk that drivers will
enter the dynamic bus lane when prohibited.
32
K2 Research 2015:5
5.6.
Discussion and conclusions
The information provided in the previous sections indicates that dynamic bus lanes can be
implemented now, using existing technology. A system that facilitates a dynamic bus lane involves
mainly a system control unit where decisions to activate/deactivate the lane are made, and a user
interface consisting of static and variable message signs (VMS) that inform road users about its
presence and its current status.
To provide a basis for decision-making, the control unit should be provided with the information such
as the bus position and time-schedule, traffic light status and traffic flow. Consequently, integration of
the system with corresponding information sources may be required. These information sources are
generally available today, however, some additional infrastructure-based sensors for traffic flow
measurement may be needed (e.g., inductive loops or cameras). It should also be noted that a great
majority of the buses operating in Swedish cities are already equipped with communication and
positioning devices (GPS), and a system for dynamic bus lanes would in theory not require any
additional devices in the buses.
It can also be concluded that a compliance control unit (e.g., automatic plate recognition) may be
needed to ensure that road users respect the dynamic bus lane, i.e. that they do not access it when it is
dedicated to buses. This issue is similar to the current compliance issues related to variable speed
limits.
In future, the number of connected and automated vehicles is expected to grow, which in turn will
facilitate more advanced systems for dynamic bus lanes. Road users could, for example, obtain
information about the dynamic bus lanes by means of in-vehicle displays making it, at least
theoretically, possible to start and end dynamic bus lanes across the network and not only at fixed
locations. Also, access to individual vehicle data may enable more enhanced decisions at the same
time as enforcement may become easier since automated vehicles will be programmed to respect
traffic rules.
K2 Research 2015:5
33
6. Level of service
6.1.
Purpose and goal
The aim of this work package was to investigate how dynamic bus lanes influence capacity and level
of service for the public transport vehicles as well as for adjacent traffic. The main questions that were
investigated were:
•
•
•
What effects on level of service have been found in previous investigations?
Are the results presented in the literature relevant and applicable to the Swedish context?
When are dynamic bus lanes appropriate and in which traffic situations is the potential for
dynamic bus lanes the largest?
6.2.
Approach
The first question (“What effects on level of service have been found in previous investigations?”) was
investigated by an extended review and analysis of literature, see chapter 2. The second question (“Are
the results presented in the literature relevant and applicable to the Swedish context?”) was discussed
in the working group and investigated by example calculations for a more typical Swedish road and
traffic condition than utilized in the investigations presented in the literature. The third question
(“When are dynamic bus lanes appropriate and in which traffic situations is the potential for dynamic
bus lanes the largest?”) was investigated by means of sample calculations for different types of road
and traffic conditions in combination with analysis of the recommendations given in the literature.
6.3.
Bus delays
Wendle (1997) presents an investigation of when and where buses are delayed. The study is based on
four sites (two in Lund and two in Malmö). Common problems, found in the paper, are delays due to
passenger boarding and that the bus cannot drive as fast as cars around sharp bends. However, there
are furthermore several situations where the traffic conditions affect the travel time of buses, for
example:
•
•
•
in connection with bus stops
at junctions
on the road segments between junctions
Buses might be delayed when leaving bus stops due to the fact that it can be difficult for the bus driver
to find a sufficient opening in the stream of vehicles to be able to exit from the bus stop and enter the
lane. This of course depends on the geometry and design of the bus stop and the weaving delay is in
principle only a problem for bus stops in a bus bay or when the bus stops on the shoulder. For on street
bus stops the bus already stands in the lane and other vehicles have to wait behind the bus or try to
overtake it. However, in the Swedish context, this effect is not believed to be as big as in some other
countries, since drivers of private cars are required to give way to buses leaving bus stops, at least for
streets with speed limits up to 50 km/h.
Buses can be delayed at junctions due to adjacent traffic, especially related to queuing time. Delay at
junctions can be divided into:
•
•
•
34
geometric delay – e.g. due to lower possible speed through an roundabout or when turning
waiting time at the yield/stop line – either for finding a gap at a yield/stop junction or at a
roundabout or the time until getting green signal in a signalized junction
queueing time – the time spent in queuing in order to get to the yield/stop line
K2 Research 2015:5
Buses can also be delayed on particular road segments due to adjacent traffic. This can be due to high
traffic volumes, congestion or the effect of single slow moving vehicles on the road (including slow
moving buses).
At the same time as buses would benefit from a dynamic bus lane, car users may experience increased
travel time when such a system is introduced. This increase can be due to:
•
•
•
vehicles weaving at the start of a section of a dynamic bus lane
the temporary capacity reduction arising when one lane is reserved for buses
queue spillback
6.4.
Level of service in the literature
Analytical studies, simulations and field tests have been performed to estimate how dynamic bus lane
systems affect the performance of both buses and adjacent traffic. The results from the different
studies are difficult to compare though since they partly rely on various assumptions and uses diverse
methods to produce the numerical results, but also because they use different measures to describe the
performance.
6.4.1.
Effects with or without transit signal priority
Several studies evaluate the introduction of dynamic bus lanes in combination with introduction of
transit signal priority, i.e. bus priority in signalized junctions, and compare the results to a traffic
situation with no dynamic bus lane nor any transit signal priority. From one perspective this is
reasonable, since it is unwise to introduce dynamic bus lanes without any transit signal priority
scheme. However, at the same time it becomes difficult to estimate how much of the impact is due to
the dynamic bus lane system, and how much effect the introduction of transit signal priority alone
would have had.
Viegas and Lu (1999) simulates the effects appearing from a combination of intermittent bus lanes and
transit signal priority in one single junction. Results show that the average travel time through the
junction is reduced by 4 seconds (which is about 30%). In Sweden, transit signal priority is often used
to prioritize buses at junctions. So from this perspective the truly interesting question is what benefits,
and costs, are added when an Intermittent Bus Lane-system is introduced to a system where transit
signal priority is already in use. Unfortunately, this is not investigated by Viegas and Lu (1999).
Carey et al. (2009) simulates a bus lanes with intermittent priority system, both with and without
transit signal priority, and also transit signal priority without Bus Lanes With Intermittent Priority.
This gives the possibility to analyse only the effects given by the introduction of a bus lane with
intermittent priority for a road section already using transit signal priority. The simulations are done
using the microscopic traffic simulation tool VISSIM (Fellendorf and Vortisch, 2010) and are based
on a scenario where the buses traverse a straight road, of approximately 2 km, including 9 signalized
junctions. The results show small effects on bus travel times using bus lanes with intermittent priority
and transit signal priority in comparison to only transit signal priority. However, the travel time
variation for the buses is reduced a lot (up to 15%).
Transit signal priority is an important tool to increase the performance of a bus system (operating with
or without dynamic bus lanes). However in areas operated by several bus lines, giving short bus
headways on some road segments, there are often conflicting interests when setting up the transit
signal priority. Viegas and Lu (2004) describes an intermittent bus lane system where there are several
bus lines operating within the same area. It presents how to calculate the signal setting within the area
when several connected bus lines exists, that potentially can affect each other. Results show that
controlling several junctions jointly (in an integrated manner), can improve the effects of dynamic bus
lanes further. In this way, the planning of the transit signal priority increases the gain obtained for
buses, without imposing any new losses for adjacent traffic.
K2 Research 2015:5
35
If buses experience delays also on links (road segments) and not only in junctions, the bus lane with
intermittent priority concept could be more useful than the intermittent bus lane concept. Eichler and
Daganzo (2006) presents analytical models showing the effect of a bus lane with intermittent priority
for a road consisting of several road segments and junctions. The analysis includes cases both with and
without transit signal priority. The estimated effect show that only introducing bus lanes with
intermittent priority increases the average speed of buses by 15 %, while introducing bus lanes with
intermittent priority together with transit signal priority increases average bus speed by 35 %.
6.4.2.
Effects compared to dedicated bus lanes and normal mixed lanes
If implemented properly, a dynamic bus lane should have almost the same positive effect for the buses
as a dedicated bus lane, while affecting the adjacent traffic in a less negative way. However, many
studies do not show what the effect on cars would have been using a dedicated bus lane instead. This
is of course essential knowledge if confronted by the choice of either implementing a dedicated bus
lane or a dynamic bus lane. Yang and Wang (2009) studied, by simulation, the effects of using IBL in
comparison to regular lane usage (mixed traffic) and compared to dedicated bus lanes. The results
show that when headway between buses are really short (i.e. a high bus frequency), the IBL effects
cars in the same way as a dedicated bus lane (as expected). As headway increases, the IBL will have
lesser and lesser effect on other vehicles (which is reasonable).
Also Zhu (2010) compares the effects of a dynamic bus lane to those of a dedicated bus lane, and to
mixed traffic lanes. The results are discussed in terms of flow-density relationships for the different
lane configurations. These relationships are compared both for buses and cars. The results show that
the car flow when having a dynamic bus lane is almost as high as when only mixed lanes are operated.
There can also be reasons as to why one should not consider only either dedicated bus lanes or
dynamic bus lanes. They can complement each other in some situations. For example, as suggested by
Guler and Cassidy (2012), a dynamic bus lane can be used where a physical (geometric) bottleneck
occurs, making it unsuitable to have a dedicated bus lane at that specific part of a roadway. E.g.
assume a roadway with one dedicated bus lane (and one or more other lanes). When a physical
bottleneck occurs, the dedicated bus lane is converted into a dynamic bus lane, and after the
bottleneck, the lane is converted back to a dedicated bus lane. In practice this means that on road
segments with limited capacity, the underused bus lane is converted into a regular mixed-traffic lane.
This approach is not intended for use on arterials, but rather in roadways where infrequent bottlenecks
occur.
6.4.3.
Effects due to weaving at the start of a dynamic bus lane
Chiabaut et al. (2012) presents an analytical model that also considers the weaving of vehicles that
occur where a bus lane with intermittent priority starts and how this might reduce the capacity
upstream. This decrease in capacity will affect cars as well as buses upstream of the first activation
point. Based on this, the downstream benefits a bus will perceive due to the bus lane with intermittent
priority have to be greater than the extra time caused by the decrease in capacity upstream due to the
weaving. The results show that, since the main benefits of the bus lane with intermittent priority is
gained in the junctions, several (more than 5) junctions have to be located along the bus lane with
intermittent priority system route. Therefore, their recommendations are that bus lanes with
intermittent priority are suitable for long urban corridors. However the numerical results are quite
extreme and the article lack important information on how the vehicles weaving behaviour was
modelled and how far in advance they were informed of the upcoming bus lane with intermittent
priority and when they start the merge. Most other analytical models in the literature have not
considered this effect and it is therefore difficult to evaluate the validity of the conclusions presented
in Chiabaut et al. (2012). Since the analytical models presented in Chiabaut et al. (2012) quite roughly
36
K2 Research 2015:5
estimates the effects of lane changing manoeuvres, the work was extended in Xie et al. (2012) using
simulation. The results of the simulations are comparable with results from the analytical model.
One way to tackle the existence of a “weaving effect” could be to activate the first bus lane with
intermittent priority section further in advance than the following sections. The weaving situation
when activating a dynamic bus lane can be compared to the weaving situation when using dedicated
bus lanes. The difference is that the drivers know that they always have to merge in the case of a
dedicated bus lane. However, one would expect drivers to adapt and try to avoid being in the “wrong”
lane if there is an upcoming road stretch with a dynamic bus lane. Arnet (2014) states that it would be
possible to draw important conclusions on dynamic bus lanes by studying real world dedicated bus
lanes. Arnet (2014) therefore conducted analysis of several streets with dedicated bus lanes in Zurich
and concluded that drivers developed new lane changing behaviour due to the introduced bus lanes,
e.g. stated as
“drivers in Zurich prefer not to use lanes which are later converted to dedicated
bus lanes. They want to avoid enforced lane changes, which could possibly become
due at inconvenient moments” (Arnet, 2014).
Based on this Arnet (2014) draw the conclusion that the bus lanes with intermittent priority concept (in
which drivers are forced to leave the dynamic bus lane when it is activated) would not be accepted by
the drivers in Zurich, while the intermittent bus lane concept would be accepted since it is a less strict
version of dedicated bus lanes.
6.4.4.
Field tests
A few real-world implementations/field test have also been conducted. Viegas et al. (2007) describes a
real world demonstration project from Lisbon. In the project, a 600 meter long intermittent bus lane
was demonstrated and evaluated during six months in 2005-2006. The intermittent bus lane was
implemented on a one-way street with an average peak-hour flow of 1400 vehicles/hour, and with
approximately 14 buses/hour. The quantitative evaluation was based on average travel time over a
stretch of 1 km including one bus-stop before the intermittent bus lane section and one bus stop within
the intermittent bus lane section. The results gave that the average bus speed increased approximately
20 %, and that the average bus speed during peak hour increased approximately 50 %. This of course
mean that the travel time variation between on-peak hour and off-peak hours is reduced. At the same
time, they reported that no significant impact was seen on adjacent traffic. Viegas et al. (2007) state
that there was a plan for an extension in time of the field test. However the extended demonstration
project never went through and there was no permanent installation either. According to Viegas (2015)
this was due to limited interest from the public transport provider and municipality who preferred
dedicated bus lanes.
Currie and Lai (2008) describes a real world implementation of a dynamic bus lane concept adapted
for tramways in Melbourne. The concept, called Dynamic Fairways (DF), was introduced in 2001. The
system covers junction approaches over a 2.1 km long stretch of a two-by-two lane road with tram
tracks in the centre lanes. The system is only activated during peak hour, and the results indicate speed
improvements in morning peak of approximately 10 % but only around 1 % in the afternoon peak.
6.5.
Capacity effects in a Swedish context
In order to illustrate the potential effect on buses and adjacent traffic, some example calculations using
the analytical model are presented in Eichler and Daganzo (2006) were performed. The model is based
on the traffic flow theory of moving bottlenecks in which the buses (and the activation of a bus lane
with intermittent priority section) are treated as a moving bottleneck. The moving bottleneck (i.e. the
bus) will imply a temporary reduction in capacity but since the bottleneck is not stationary but moves
with the speed of the bus, the temporary capacity reduction will disappear when the bus leaves the
K2 Research 2015:5
37
road section. This implies that the overall capacity reduction on a one hour period depends on the bus
headway. The overall capacity can according to Eichler and Daganzo (2006) be estimated as:
𝑞!"# = 𝑞!"#"$%"& !"#$ ⋅ 𝑐 𝐻 + 𝑞!"#$%& ⋅ 1 − 𝑐 𝐻 ,
where 𝑞!"#"$%"& !"#$ is the capacity when one of 𝑛 lanes is reserved for a bus (𝑞!"#$ = 𝑞!"#$%& (𝑛 −
1)/𝑛), 𝑞!"#$%& is the normal capacity on the road section taking capacity at junctions into account
(e.g. the green time share of the signal cycle time), 𝐻 is the bus headway (i.e. the average time
between bus arrivals) and 𝑐 is the time needed to clear the lane before the bus arrival (assumed to be
two signal cycle times). If the bus headway decreases and gets close to 𝑐 the capacity impacts will
approach the capacity of a dedicated lane system (as expected) and if the bus headway increases and
approaches infinity the capacity will approach the normal mixed lane capacity.
In Eichler and Daganzo (2006) the moving bottleneck theory is applied to estimate the effects of a bus
lane with intermittent priority. However, the theory applies also for an intermittent bus lane (or other
version of dynamic bus lane systems) but as discussed in Eichler and Daganzo (2006), the intermittent
bus lane concept might require changes in the signal settings, for example increasing the green time
and maybe the signal cycle time and thereby 𝑐.
The gain for buses is estimated to be the difference in bus pace for driving in a mixed lane (i.e.
including delays due to slower vehicles on the road link, queuing at junctions and waiting at red or for
a gap) and the bus pace when driving without any surrounding traffic (but still suffering from delays
waiting at the yield/stop line). In our calculations, the gain is assumed to be the queuing time at the
junctions, i.e. we assume that with a dynamic bus lane the bus would always arrive first in line at the
next junction but still has to wait until the signal turns to green.
Eichler and Daganzo (2006) show that the penalty for adjacent traffic increase linearly with both the
traffic demand and the average bus pace. The effect of the bus headway is somewhat more
complicated since it indirectly affects the increase in travel time since a decrease in bus headway
decreases capacity.
The purpose of the example calculations presented here is twofold. Firstly, there is a need for a more
straightforward illustration of the gains and losses than the ones presented in Eichler and Daganzo
(2006) and other publications. Secondly, the bus headways, signal timings, traffic flows, average
distance between junctions, bus paces, etc. used in the example calculations in the literature seldom
match typical Swedish conditions. Two different cases have been investigated: one general 50 km/h
street case and one case corresponding to a road without junctions and speed limit 70 km/h, see Table
4 for a specification of the two cases.
38
K2 Research 2015:5
Table 4 Description of the input data used for the three different test cases.
Street with
junctions
Arterial without
junctions
Speed limit [km/h]
50
70
Number of lanes
2
2
Bus stop time [min/km]
1
0
Length [km]
1
1
Junctions/km
3
0
Green time to cycle ratio
0.5
-
Cycle length [min]
1
-
Time needed to clear the lane [min]
2
2
Road capacity [veh/h]
3600
3900
(Junction) capacity [veh/h]
1800
-
Evaluated traffic demands [veh/h]
1200, 1400, 1600
3000, 3300, 3600
The delay at junctions given the cycle length, green to cycle ratios, road capacity and traffic demand is
estimated using the Webster’s junction delay function (Webster, 1958).
Figure 15 presents the gain in bus travel time and the loss in vehicle travel time per vehicle for the 50
km/h street with junctions. The delay for other vehicles is quite limited even for bus headways down
to 4 minutes. It is important to notice that the moving bottleneck theory do not take any eventual
delays due to the weaving at the start of the dynamic bus lane section or delays on vehicles on
secondary roads.
Gain in travel time per bus vs. loss in travel time per car 50 Gain/Delay [s/vehicle] 45 40 35 Bus gain at 1200 veh/h 30 Car penalty at 1200 veh/h 25 Bus gain at 1400 veh/h 20 15 Car penalty at 1400 veh/h 10 Bus gain at 1600 veh/h 5 Car penalty at 1600 veh/h 0 0 5 10 15 20 25 Bus headway [min] Figure 15 Gains in travel time per bus [s/bus] and losses in travel time per car [s/car] on a 1 km two
lane road stretch with three junctions and speed limit 50 km/h.
Another way to illustrate the gains and losses is to present the total delay for all travellers over one
hour, see Figure 16. The results are presented in minutes instead of seconds and are based on the
assumption that there is only one person per car and 15 passengers on each bus (pax). Figure 16 shows
K2 Research 2015:5
39
more clearly the effect of the decreasing bus headway for the different traffic demands. Higher traffic
demands imply that the bus headway has to be larger in order reach 0 vehicle delay.
Vehicle Penalty and bus gain [min] Total gain in travel times for bus travellers (pax=15) vs. total loss in travel time for cars travellers (pax=1) during one hour 800 700 600 Bus gain at 1200 veh/h 500 Car penalty at 1200 veh/h 400 Bus gain at 1400 veh/h 300 Car penalty at 1400 veh/h 200 Bus gain at 1600 veh/h 100 Car penalty at 1600 veh/h 0 0 5 10 15 20 25 Bus headway [min] Figure 16 Total gain in travel time [min] for buses and total losses in travel time [min] for cars per
hour on a 1 km two lane road stretch with three junctions and speed limit 50 km/h.
The results in Figure 15 and Figure 16 are quite sensitive for changes in traffic demand, signal
settings, junction capacity, distance between junctions etc. This makes it difficult to make general
guidelines for which traffic situations that dynamic bus lanes are appropriate.
In order to investigate to what extent dynamic bus lanes could be an effective measure for bus priority
on road segments without junctions, further analysis was carried out. The travel speed of cars and
buses are based on the official stepwise linear speed flow relationships in the Swedish capacity manual
(Trafikverket, 2014a, Trafikverket, 2014c). The gain and losses per vehicle over a 1 km road stretch
are presented in Figure 17. It is worth noting that the speed for buses in the Swedish speed flow
relationships are for trucks and buses and the travel speed for public transport buses on bus lines might
differ from the travel speed of trucks.
40
K2 Research 2015:5
Gain/Delay [s/vehicle] Gain in travel time per bus vs. loss in travel time per car 20 18 16 14 12 10 8 6 4 2 0 Bus gain at 3000 veh/h Car penalty at 3000 veh/h Bus gain at 3300 veh/h Car penalty at 3300 veh/h Bus gain at 3600 veh/h Car penalty at 3600 veh/h 0 5 10 15 20 25 30 35 Bus headway [min] Figure 17 Gains in travel time per bus [s/bus] and losses in travel time per car [s/car] on a 1 km long
road section with two lanes, no junctions and a speed limit of 70 km/h.
Figure 18 show the gains and losses for all vehicles traversing a 1 km road stretch over one hour, again
assuming 1 driver per car and 15 passengers per bus.
Vehicle Penalty and bus gain [min] Total gain in travel times for bus travellers (pax=15) vs. total loss in travel time for cars travellers (pax=1) during one hour 20,0 18,0 16,0 14,0 12,0 10,0 8,0 6,0 4,0 2,0 0,0 Bus gain at 3000 veh/h Car penalty at 3000 veh/h Bus gain at 3300 veh/h Car penalty at 3300 veh/h Bus gain at 3600 veh/h 0 5 10 15 20 25 30 35 Car penalty at 3600 veh/h Bus headway [min] Figure 18 Gains in travel time for buses and losses in travel time for cars on two lane link with speed
limit 70 km/h (without junctions).
The results from all example calculations estimates that the buses could gain in travel time and that the
effect for other vehicles depend on the bus headway, the traffic flow, distance between junctions etc.
However, in general the delay for other vehicles seems to be limited, especially for higher bus
headways.
6.6.
When are dynamic bus lanes applicable?
Qiu et al. (2015) uses both analytical models and simulation models to evaluate under what traffic
conditions an intermittent bus lane is applicable. On the two-way road section used in the analysis, the
results show that intermittent bus lanes have a positive effect, i.e. that it reduces the travel time per
K2 Research 2015:5
41
capita (based on different assumptions regarding average number of passengers in cars and buses) for
vehicle densities corresponding to 25 – 74 pce/km (Passenger Car Equivalent per km).
Based on calculations using the moving bottleneck traffic theory, Eichler and Daganzo (2006)
proposed the following principles to choose between dedicated bus lanes, dynamic bus lanes and
signal priority:
•
•
•
dedicated bus lane, with or without signal priority, when traffic flow is less than 80-90% of
the reduced capacity
dynamic bus lane, with or without signal priority, when traffic flow is close to the reduced
capacity
transit signal priority when traffic flow is more than 120% of the reduced capacity.
The reduced capacity refers to the capacity when dedicating one lane for buses. Translating this to
recommendations in terms of density (as used in Qiu et al. (2015)) depends on the speed, both free
flow speed and speed at capacity. Based on the official Swedish speed-flow relationships
(Trafikverket, 2014a) the density at capacity flow for arterials with speed limit 50-70 km/h lies around
70 vehicles/km (assuming 12 % trucks) and estimates on the density at capacity for the example
calculations presented in section 6.5 gives similar values. Thus, the recommendations in Qiu et al.
(2015) and Eichler and Daganzo (2006) are similar in terms of the maximum vehicle density and flow
levels for which dynamic bus lanes should be utilized. The difference is that Eichler and Daganzo
(2006) propose to use dedicated bus lanes for lower flows and densities than Qiu et al. (2015).
The recommendations in Qiu et al. (2015) and Eichler and Daganzo (2006) focus on traffic demand,
but the bus flow should not be too high either since the lane in such a case would in practice serve as a
dedicated bus lane. Spinak et al. (2008) proposed a limit of about 20 buses per hour. Finally, also the
distance between junctions should be long enough to allow for safe lane changes (Joskowicz, 2012).
Eichler and Daganzo (2006) also discussed the possibility to use dynamic bus lanes to get a more
flexible version of time limited dedicated bus lane. They make the following comment:
“Note that a BLIP operation can be turned off or morphed into a dedicated lane at
will. Therefore, it may be useful where traffic conditions or bus frequencies change
with time.” (Eichler and Daganzo, 2006).
Dynamic bus lanes could for example be used to dynamically vary for which time period that the time
limited dedicated bus lane is activated (i.e. instead of using the extra sign T6 Indications of valid time
intervals (see Figure 9 in section 4.3). Such an approach might decrease the workload for the drivers
who do not need to read the extra sign with information on valid time intervals.
6.7.
Discussion and conclusions
Dynamic bus lanes were originally suggested by Viegas and Lu (1996) and implemented on a two lane
signalised arterial in Lisbon (Viegas et al., 2007). Two or three lane signalised arterials are also the
road and traffic control conditions considered in most of the analysis presented in the literature. In
Sweden, several signalised junctions have been rebuilt into roundabouts during the last decades.
However, there are no investigations into how dynamic bus lanes could operate on roads and streets
with roundabouts. One drawback with roundabouts is the difficulty of prioritising public transport
vehicles (although signalized roundabouts exists). Hence, dynamic bus lanes might have even greater
positive effects on roadways with roundabouts.
Based on the literature findings and discussions in the project group the following aspects are
important to consider when evaluating if a dynamic bus lane is suitable or not:
•
•
42
traffic flow
bus flow
K2 Research 2015:5
•
•
•
•
•
•
bus flow in relation to traffic flow
the road and junction capacity
distance between junctions
type of bus stops: normal on street or bus bays
yielding rules at bus stops
bus delay due to junctions, traffic flow and slow vehicles.
To conclude our main findings from the previous literature in this field, it is clear that all authors of
the papers agree that dynamic bus lanes (intermittent bus lanes or bus lanes with intermittent priority),
under right conditions, have the ability to reduce travel times for buses. For example Goh et al. (2014)
states that:
"Regardless of its form, there has been overwhelming evidence that bus priority
brings about improved travel time, reliability and attractiveness of public
transport". (Goh et al., 2014)
In many cases it is shown that the implementation of dynamic bus lanes can be done with limited (or
no) impact on adjacent traffic and that it is therefore a potential method of prioritizing buses.
However, the huge difference in effects obtained in the Melbourne case and the Lisbon case, and also
from several different simulation studies, indicate both that the effects of intermittent bus lanes are
quite case-specific and that they are difficult to predict.
The conclusions with respect to dynamic bus lanes effects on level of service for buses and other
vehicles can be summarized in the following way:
•
•
•
•
•
•
There is a lack of field tests and the documentation of the field tests is not complete – i.e. there is
an uncertainty on the generality of the results due to few observations.
The simulation studies and the analytical calculations conducted often have limited documentation
of the underlying conditions and assumptions – i.e. it is difficult to conduct critical analysis of the
validity of the results.
There are few investigations into how dynamic bus lanes affect travel time variation and
reliability. There are some investigations into how dynamic bus lanes affect the difference in bus
travel time under peak and off peak conditions, but none that investigate the variation in travel
time for a specific bus departure or time window. Travel time variation or travel time reliability is
an important factor for the attractiveness of a public transport system and needs to be further
investigated.
The bus headways investigated in the studies are often higher or in the higher end of the range of
bus headways common in a Swedish context.
So far, mainly multi-lane roads and signalized junctions where the buses travel straight ahead have
been investigated. Roads with roundabouts or road sections where the bus need to turn at a
junction have not been investigated.
Effects on vehicles on secondary roads are not included in the investigations presented in the
literature. Effects on secondary road vehicles are problematic only a problem if changes in the
signal settings are needed for the dynamic bus lane implementation, but this has to be investigated.
K2 Research 2015:5
43
7. User experience and safety
7.1.
Purpose and aim
The main purpose of this work package was to generate hypotheses regarding how different road users
would view and experience the introduction of dynamic bus lanes in Sweden; how they would react;
and what consequences their introduction would have, especially on road safety.
7.2.
Approach
Framework conditions as well as important user groups and key scenarios to investigate further were
identified based on a review of the dynamic bus lane concept (see Chapters 2 and 3). The findings
were used as a baseline for the setup of a workshop focused on car, bus and truck drivers. Hypothesis
for experiences, reactions and consequences were then developed based on the findings from literature
and the workshop. Recommendations for the design, operation and maintenance of dynamic bus lanes
were moreover proposed.
7.3.
Workshop design
A full day workshop was held in Lund on the 15th of December 2015. It was jointly organized by
Viktoria Swedish ICT and VTI and attracted nine participants from AB Volvo, Netbuss Lund, Scania,
Skånetrafiken and the municipalities of Malmö, Lund and Gothenburg.
The purpose of the workshop was to deepen the understanding of how potential users and their road
safety might be affected by the introduction of dynamic bus lanes in Sweden. The workshop addressed
both if dynamic bus lanes were to be introduced in the current traffic situation, with existing
techniques and regulations, and if they were to be introduced in the future (2035), with the
prerequisites that may be assumed for then (see Chapter 3).
Workshop participants were firstly introduced to the dynamic bus lane concept, the purpose of it and
how it might appear in the present scenario. They were then assigned a fictional character each – a
persona, and divided into two groups (five participants in one and four in the other). The fictional
characters encompassed private motorists, bus drivers and other professional drivers of different age
and gender and were communicated through a sketch (see Figure 19) and a short descriptive text.
Figure 19 Illustrations of the personas used during the workshop. (Illustrator: Göran Smith)
A present day introduction of dynamic bus lanes in Sweden was then problematized and discussed,
with the participants playing their fictional characters. The main goal of the discussions was to
cooperatively fill in a matrix summarizing the possible experiences and reactions from different types
of users and the consequences of these experiences and reactions. The two developed matrixes were at
first discussed in the two groups and then merged into one before lunch.
After lunch, all participants jointly developed guidelines for the design and operation of dynamic bus
lanes based on the outcome of the morning's discussions. The aim of the developed guidelines was to
reinforce positive experiences, reactions and consequences and to diminish or prevent negative ones.
After that, the group briefly looked into the future (2035) and discussed how the dynamic bus lanes
could work in a future scenario, before they finally were asked to individually rank aspects of the
guidelines developed that they thought were more important to implement.
44
K2 Research 2015:5
7.4.
Workshop results
The workshop generated insight into how present car drivers, bus drivers and other professional
drivers believe that their user groups would experience and react to the introduction of dynamic bus
lanes, and what the consequences of these experiences and reactions would be. The workshop
participants’ thoughts are described below.
7.4.1.
Experiences
If the system functions as it should, bus drivers would in all probability rate the uncongested path that
it creates for them as a hugely positive benefit. Being able to drive through the city unhindered would
be a great experience, especially during rush hour. Bus drivers might also in general be more confident
that they can complete their task without complications, as long as the performance of the system is
reliable. They would however get stressed out if the system was not effective and would definitely get
annoyed if there were other road users who did not give way when they should, or who might even try
to fool the system.
The discussions also highlighted that taxi drivers might feel marginalized by the setup of the system.
They are by definition a part of the public transport sector in Sweden and do have access to regular
bus lanes. There is a risk that they might wonder why they are then stuck in normal traffic and not
permitted to use the bus lane. Drivers of emergency vehicles, which on the contrary are indeed
prioritized by the system, would most truly find the free path through the city as very positive.
The discussion highlighted that car drivers would experience a positive change if a dedicated bus lane
was redesigned into a dynamic bus lane, since they would perceive that they would then gain access to
more road space. However, this would in fact not be the case, rather the opposite (see Chapter 3). Car
drivers would hence likely feel deprived of the right to use a lane, if a dynamic bus lane was
introduced. Longer queues, less road space and longer driving times would most probably cause
annoyance and anger among car users, especially if the system is introduced where the traffic is heavy
or if the system’s performance in terms of speed and reliability is shaky. Some car users might
moreover become irritated and confused by the new situation to which they are unaccustomed, with
new types of traffic signals, traffic rules etc. On the other hand it was also discussed that it is likely
that many car users would approve the solution since there seem to be a support for the need to
prioritise public transport for environmental reasons. It was underlined that this acceptance requires
appropriate communication and transparency as well as a system that functions well, that is, that the
lane only is earmarked for buses when the buses need it, and that the negative effect on adjacent traffic
is marginal. Furthermore, regular bus lanes are common in several Swedish cities, and dynamic bus
lanes may possibly be perceived as a smarter, more flexible and more efficient solution.
According to the discussions held, the most critical point for car drivers and truck drivers as well as
for other professional drivers is the entrance point to the dynamic bus lane. Based on the discussions
this is where the users are required to obtain and assimilate information, make decisions and perform
actions. Ultimately this is where the traffic of two lanes should be smoothly merged into one during
periods when the dynamic bus lane is reserved for buses. The lane-changing manoeuvre was consider
to be a major stress factor for the drivers situated in the right lane, trying to enter the heavily trafficked
left lane with the knowledge in mind that a bus is approaching from behind. Drivers in the left lane
might also be affected, having to deal with unpredictable behaviour and lane-changing manoeuvres
from other drivers. The stress factor was considered to be a problem especially for inexperienced,
older drivers and those new to the location(s) of the dynamic bus lane. These user groups were seen as
likely to find it harder to adapt to the new system. Drivers who get accustomed to the system will
probably get used to the new circumstances over time and thus not experience as much stress as they
did initially.
K2 Research 2015:5
45
During the discussions it was also mentioned that truck drivers might experience more negative
impacts of the system compared to other road uses. The argument was that they are in general more
used to dealing with challenging situations than private car drivers, but that their vehicles are less
manoeuvrable, require more space and accelerate more slowly.
7.4.2.
Reactions
It was hypothesized that it will be easier for bus drivers to follow the time schedule, but also that the
degree of interaction with other road users will be reduced thanks to the system. Bus drivers might
therefore adopt a calmers and smoother style of driving. Negative reactions were also discussed; one
point mentioned was that bus drivers might over-exploit their newfound opportunities, driving too fast
when they have empty road ahead, or trying to shift other traffic out of their way even on sections of
road where buses aren’t prioritized. Many bus drivers will moreover most probably resort to using
their horns rather more in locations and at times when the system fails to provide them with a clear
road ahead.
The workshop participants did not believe that car users in general would start breaking laws in
response to poor performance of the system, but that they might adopt a more aggressive style of
driving if the effect on adjacent traffic is poor. Some motorists might also cheat, and use the dynamic
bus lane even when it is reserved for buses, if it is too problematic to change lane. Car users that drive
next to the dynamic bus lane frequently will probably also develop adaptive behaviour. Some drivers
might stop using the right lane at all, while others will switch to the left lane as early as possible,
regardless of whether the right lane is reserved for buses or not. It was also mentioned that some
drivers that are aware of the dynamic bus lane might take detours or chose other times to travel
through the system in order to avoid rush hour congestion.
It is probable that certain motorists will try to crack the system to get through as quickly as possible.
One particular way of gaining advantage that might be used is to follow very closely behind a bus and
“float” with it, and thus make use of its prioritization. Taxi drivers will probably be faster than other
groups to adopt this kind of behaviour.
7.4.3.
Consequences
The introduction of the dynamic bus lane is considered to make it less cumbersome and stressful for
bus drivers to perform their obligations. They might even have time for coffee breaks during the rush
hour. The attractiveness of the profession will consequently in the long run become higher. Fewer
interactions with adjacent traffic and reduced blind spot problems at bus stops will additionally
increase road safety for bus drivers and bus passengers.
If the entrance point cause anxiety and stress, conscious misconduct among adjacent traffic might
become more common as well as sudden and unplanned actions. In addition to incidents and
accidents, the uncertainty and difficulty might furthermore create severe congestion. Thus, the
attractiveness for adjacent traffic of using the road will decrease, especially during rush hour. This will
likely redistribute traffic across the network and over the day.
7.4.4.
Design guidelines
The following guidelines on the design and operation of dynamic bus lanes emerged during the
plenary workshop discussion. The guidelines are based on the experiences, reactions and
consequences described above. The overall recommendations were to reinforce positive experiences,
reactions and consequences for car and bus drivers as well as for other professional drivers and to
remove the negative equivalents. As a final exercise, the nine participants were given five points each
(post-it notes) to distribute among the guidelines, rating their importance. 41 points out of the 45 were
distributed. The reason for the discrepancy is unknown.
46
K2 Research 2015:5
Suggested guideline
Rating
Ensure that the system always works
7 points
Use design measures that facilitate the interweaving or obviate the need for it
7 points
Secure that the vehicle flow never is too high
5 points
Develop a clear and simple regulatory framework
5 points
Communicate the message to motorists that they get an opportunity to use the dynamic bus lane
every now and then – not vice versa
5 points
Use digital signage that informs other users when emergency vehicles are emerging
3 points
Display information well in advance of the lane entrance
2 points
Digital information signs regarding interweaving of lanes
2 points
Combine the system with switching from regular timetables to headway based ones
2 points
Employ an information campaign for bus drivers
1 point
Disconnect the system when it doesn’t work
1 point
Restrict traffic flow into the system – Stop high flows earlier in the system
1 point
Focus on a simple road design – easy to understand
1 point
Make sure it is easy for motorists to get out of the way
1 point
Enable emergency vehicle drivers to trigger the system themselves
1 point
Focus on steady speed
0 points
Utilize trigger algorithms that recognize different types of vehicles
0 points
Build a barrier (physical or psychological) between the lanes
0 points
Display information about the travel time difference between buses and cars
0 points
Use a predictive warning sign that counts down the time to the closure of the dynamic bus lane
0 points
Identify appropriate punishment for those drivers who fail to comply with the dynamic bus lane
0 points
Find appropriate locations in which to implement the lane so as to never have to turn it off
0 points
Secure other routes for freight traffic
0 points
Inform taxi drivers that the alternative is to reserve the lane for buses permanently
0 points
Monitor taxi drivers use of the dynamic bus lane
0 points
Systematically evaluate changes in traffic volumes
0 points
Table X Suggested design guidelines
7.4.5.
Future scenario
The following comments were expressed regarding how experiences, reactions and consequences of
dynamic bus lanes (and thereby guidelines) would be different, compared to above, if it was 2035.
There is all in all not too much difference between now and then. The participants expressed that
overall the situation will become a little more positive due to the increased assistance from technology.
The intelligence of the system, the infrastructure and the vehicles are smarter. The system is therefore
more efficient and trustworthy, which is appreciated by users. The experience of the system is also less
stressful for car and truck drivers who have vehicles that make decisions and perform actions. Drivers
with disconnected, unintelligent and non-automated vehicles will have a similar experience as users
today, although problems might arise at the interface between new and old technology. Other drivers
will moreover probably avoid them since they imply greater safety risks. The joint conclusion from the
workshop is that there will be no problems in the future if we can develop a functioning system in the
present day.
K2 Research 2015:5
47
7.5.
Discussion and conclusions
Experiences from Lisbon and Melbourne suggest that drivers in adjacent lanes will in general
understand and accept that they are deprived of the right to use the lane when the buses need it, and
that they will behave appropriately. Earlier reviews of dynamic bus lanes moreover find that bus
drivers and bus riders will be affected primarily by the overall performance of the system and not by
the details of it. The workshop participants echoed these expectations. They argued that all user groups
would accept the system as long as the adverse effect on adjacent traffic is not too great. Reduced
stress among bus drivers and increased ridership are the anticipated results of an effective, functioning
system. If the system performs poorly, it will be perceived negatively by all user groups, but
particularly by the users that are most affected, that is, drivers in adjacent lanes.
Road safety impacts do not seem to have been a concern in either Lisbon or Melbourne. One of the
few articles that addresses the issue suggests however that the number of traffic conflicts would
increase due to reduced road space. The workshop participants agreed that this could be a problem if
the system is not designed right. The interweaving of lanes at the entrance point of the dynamic bus
lane is considered to be the main problem. It would be an unusual and potentially unsafe situation that
requires high situation awareness, quick decision-making and skilful execution from drivers. It might
be difficult for some motorists to understand that they should change lanes and to understand why, but
also to actually perform the action. Anxiety, irritation, queues and traffic incidents and collisions could
hence arise. It was proposed by the workshop participants that it is crucial to only choose suitable
application locations as well as to work on careful road design, signposting, and information
campaigns in order to facilitate safe lane-changing manoeuvres. It is in general necessary to design a
robust system that all user groups perceive as intuitive. The system must also ensure enough road
space and time to enable drivers to receive and assimilate information, take decisions and execute
actions. Furthermore, it will be important for both the user experience and road safety to develop and
communicate a clear regulatory framework as well as to base the system on recognizable components.
There were no concerns regarding introduction of the system in the future. Neither connected nor
autonomous vehicles will cause any harm. If drivers can get information through several channels and
if the vehicles perform certain acts themselves, this could reduce stress. Furthermore, the system could
become smarter and more efficient due to the technological development. Smoother and faster flow
for buses was considered to have several positive consequences. The buses’ environmental impact
drops marginally, travellers’ trust rises considerably and the system is a publicly acceptable way of
making bus priority more acceptable and of marketing public transport in general. It is reasonable to
suspect that a well-functioning dynamic bus lane will cause a modal shift and increase bus ridership.
Based on findings from the literature review and the workshop, we suggest that an introduction of
dynamic bus lanes in a Swedish context would likely give rise to the experiences, reactions and
consequences listed below. We furthermore propose a number of recommendations on how to design
and implement dynamic bus lanes in order to secure their positive effects and reduce the risks and
scale of negative effects.
Experiences
•
•
•
•
48
Bus drivers’ stress levels could decline since it might become easier for them to carry out their
duties.
Bus travellers’ confidence that the bus will arrive in time is likely to increase.
Most private motorists would probably experience the introduction of dynamic bus lanes as
neither good nor bad as long as the system is fairly intuitive, it is stress-free to change lanes at the
entrance point of the lane and the system doesn’t create a significant worsening of the situation for
adjacent traffic. A malfunctioning system could however cause anxiety and annoyance.
Professional drivers will probably have similar experiences as private motorists. The lanechanging manoeuvre at the entrance point might however be particularly difficult for truck drivers.
K2 Research 2015:5
Furthermore, taxi drivers may feel marginalized since they consider themselves as a part of the
public transport sector.
Reactions
• Bus drivers could become more relaxed, which may be reflected in their driving behaviour, which
in that case becomes calmer and smoother. There is nevertheless a risk that they respond angrily to
any misuse of the bus lane by other road users and adopt an increasingly aggressive style of
driving if the system fails to clear the path for them.
• Some motorists will most likely try to fool the system, but behavioural changes will probably be
marginal for most. If the lane-changing manoeuvre causes stress and irritation, there is however a
risk of intentional or/and unintentional misuse and thereby less safe road behaviour. Some
motorists will moreover probably change lane earlier, pick a different route or choose when to
pass the section more carefully, if the system causes severe congestion.
• Professional drivers might have a greater tendency than private motorists to adapt their behaviour.
Consequences
• The relative attractiveness of travelling by bus might rise due to Smoother flow and decreased
travel time variability. Thus, some degree of modal shift can be expected.
• Fewer interactions with adjacent traffic and lower stress levels probably lead to fewer bus
incidents and accidents. The working conditions for bus drivers might therefore become better.
• Weaving traffic may cause traffic accidents and create queues if the manoeuvre is too difficult or
if the traffic flow is too high. In that case, the attractiveness for adjacent traffic of using the road
will decrease, especially during rush hour. This will likely redistribute traffic across the network
and over the day.
Recommendations
• Be careful to pick suitable implementation locations. The system must provide a benefit for the
bus in terms of travel time or reliability, or both.
• Ensure robustness and reliability by making the system simple and by using standard components
as far as possible.
• Make sure that all drivers get the information they need by designing it for critical users, that is,
inexperienced drivers, older drivers and drivers who are not used the system.
• Increase intuitiveness by utilizing recognizable components and procedures.
• Facilitate weaving or obviate the need for it by ensuring appropriate vehicle flows and by
designing the entrance to the lane (including road design and signage) to give all drivers
(including truck drivers) the time and road space they need for manoeuvring safely.
• Develop a clear, simple and enforceable regulatory framework and communicate it.
• Allow motorists to believe that they get an opportunity to use the lane every now and then – not
that buses occasionally have space reserved.
• Carry out a comprehensive educational campaign at the same time as the introduction of the lane.
• Make sure to evaluate users’ experiences and reactions and the consequences of these.
K2 Research 2015:5
49
8. Conclusion and future work
This report presents the results of a pre-study on dynamic bus lanes as a concept for the prioritization
of public transport vehicles. The questions that were investigated were:
•
•
•
•
•
What is the state of the art in dynamic bus lanes?
Are there any legal constraints on their implementation in Sweden?
Which technical solutions are available and what technical solutions need to be developed?
How would level of service for buses and for adjacent traffic be affected?
How would road users experience dynamic bus lanes in Sweden; how would they react and what
consequences would the bus lanes have, especially on road safety?
8.1.
Conclusions
What is the state of art of dynamic bus lanes?
• Two real world tests have been conducted, one in Lisbon and one in Melbourne.
• The installation in Melbourne is permanently applied for trams on one street and planned to be
applied for more streets, but is unclear if this has been done.
• The field test in Lisbon was not made permanent although the results show large benefits for the
buses and limited effect on other vehicles. The main reason seems to be that the public transport
provider and the municipality preferred dedicated bus lanes and that dynamic bus lanes were seen
as a second best alternative.
Are there any legal constraints for an implementation in Sweden?
•
•
It is possible to develop a local traffic rule that regulates dynamic bus lanes. However, the rule
needs to be properly specified, designed, communicated and signed and marked on the road.
Assessing culpability in the case of non-compliance with the bus lane by other drivers might be
difficult since the police need to be able to show that the dynamic bus lane sign was showing
when the driver passed it.
Which technical solutions are available and what technical solutions need to be developed?
•
•
•
There are technical solutions that can be utilized to implement dynamic bus lanes. Such a system
would require the development of a system control unit and integration with other traffic
controllers, sensors for traffic flow measurement (e.g. traffic signals, inductive loops, cameras),
communication systems and variable message signs (to inform road users of the current status of
the dynamic bus lane).
Since surveillance of compliance is an issue from a legal aspect the system might need to be
extended with a compliance control unit (e.g., plate recognition).
Future traffic system including connected and autonomous vehicles might give possibilities for
enhanced dynamic bus lane systems, e.g. by informing drivers via the vehicles internal displays
making it possible to start and end a dynamic bus lane in any location and not only at those fixed
locations with a VMS.
How would level of service for buses and for adjacent traffic be affected?
• The effects on travel time for buses are in general positive and the delays for other vehicles are in
general limited.
• The effects on travel time depends highly on the traffic flow and the bus flow in relation to the
traffic flow, the capacity of the road and the junctions, distance between junctions and bus stops,
type of bus stops and yielding rules at bus stops. This makes it difficult to make general
recommendations on when dynamic bus lanes are applicable.
50
K2 Research 2015:5
•
The effects on travel time variation and travel time reliability are unclear and need to be further
investigated.
How would road users experience and react upon dynamic bus lanes in Sweden and what would
the consequences be?
• Bus drivers’ stress levels could decline, which may be reflected in their driving behaviour. Fewer
interactions with adjacent traffic and lower stress levels moreover lead to fewer bus incidents and
accidents. The working conditions for bus drivers might therefore become better.
• The relative attractiveness of travelling by bus might rise due to smoother flow and higher
reliability. Thus, some degree of modal shift in favour for public transport can be expected.
• Most private motorists would probably experience the introduction of dynamic bus lanes as
neither good nor bad as long as the system is fairly intuitive, it is stress-free to change lanes at the
entrance point of the lane and the system doesn’t create a significant worsening of the situation for
adjacent traffic. A malfunctioning system could however cause anxiety and annoyance. If the lanechanging manoeuvre causes stress and irritation, there is a risk of intentional or/and unintentional
misuse and thereby less safe road behaviour. Some motorists will moreover probably change lane
earlier, pick a different route or choose when to pass the section more carefully, if the system
causes severe congestion. This will likely redistribute traffic across the network and over the day.
• Professional drivers will probably have similar experiences as private motorists. The lanechanging manoeuvre at the entrance point might however be particularly difficult for truck drivers
and professional drivers might in general have a greater tendency than private motorists to adapt
their behaviour. Furthermore, taxi drivers may feel marginalized since they consider themselves as
a part of the public transport sector.
The conclusions can be summarized as follows. Dynamic bus lanes have the potential to be
complementary concept to prioritize public transport vehicles where dedicated bus lanes are not
feasible or desirable. However it is, based on the current state of art, not possible to draw conclusions
as to whether this is true in the Swedish context or not. More real world installations, including pre
implementation traffic analysis, are needed.
8.2.
Potential cases for dynamic bus lanes based on lessons learnt
Based on the literature review, workshops and discussions, the project group have come to the
conclusion that the potential locations and traffic situations for dynamic bus lanes in Sweden might
differ to some extent compared to the ones commonly investigated in the literature. Our view is that
dynamic bus lanes can be an alternative measure when the arguments for a dedicated bus lane are not
strong enough. This could, for example, be if the bus frequency is low (e.g., more than 5-10 minutes
between buses) or when the road space is limited (for example at bridges or under bridge passages).
Dynamic bus lanes mainly aims to solve the problem of buses being delayed due to queuing.
Therefore, the traffic demand is an important factor to consider when deciding where to implement
dynamic bus lanes. If the traffic demand is low, a dedicated bus lane is probably more appropriate than
a dynamic bus lane (even on streets with low bus frequencies). If the traffic demand is larger than the
capacity, the impact on adjacent traffic will probably be too high and neither a dedicated nor a
dynamic bus lane is appropriate. To summarize, our view is that dynamic bus lanes can be a suitable
bus priority measure in traffic situations fulfilling the following conditions:
•
•
•
•
buses are delayed and would benefit from prioritisation, e.g. due to queues (also delays due to
shorter queues of 5-10 vehicles) in connection with junctions or roundabouts
dedicated bus lanes are not feasible, e.g. due to too large delays for other traffic or limited
available space
the bus frequency is low (e.g. more than 5-10 minutes between buses)
the traffic demand is below the reduced capacity.
K2 Research 2015:5
51
8.3.
Further research needs and suggestions for next step
There are several topics that need further investigation, including effects of dynamic bus lanes on
travel time reliability, merging behaviour, installation costs, etc. We propose that the next step should
be to plan for an implementation on a specific road stretch, partly to enable estimation of installation
and maintenance costs, and partly as an input to driving simulator and traffic simulation experiments.
The driving simulator experiment could be used to investigate driver interaction with a dynamic bus
lane system interface, merging behaviour at the start of a dynamic bus lane, etc. Also, such
experiments could provide information for the traffic simulation experiments. The traffic simulation
experiment could be used to investigate performance of dynamic bus lanes in terms of travel time
savings and travel time variability for different bus frequencies and traffic flows. The analysis should
not only include dynamic bus lanes as the only bus prioritization measures, but should compare
alternative bus priority measures such as traffic signal priority, pre-signals, and bus queue jump lanes.
The traffic simulation experiments could also be utilized to evaluate the impacts of different merging
behaviours and percentage of non-compliant drivers.
52
K2 Research 2015:5
9. References
Andersson, P. and Gibrand, M. 2008. Litteratursammanställning över kollektivtrafiksystem - som
finns på världsmarknaden och är i bruk. Trivector.
Arnet, K. 2014. Evaluation of Dynamic Bus Lanes in Zurich. M.Sc., ETH Zurich.
http://www.ivt.ethz.ch/docs/students/sa433.pdf.
Carey, G., Bauer, T. and Giese, K. 2009. Bus Lane with Intermittent Priority (BLIMP) - Concept
Simulation Analysis, FTA-FL-26-7109.2009.8.
http://www.nbrti.org/docs/pdf/BLIMP%20FINAL%20REPORT%20APRIL%2019%202010_
508.pdf.
Chiabaut, N., Xie, X. and Leclercq, L. 2012. Road Capacity and Travel Times with Bus Lanes and
Intermittent Priority Activation: Analytical Investigations. Transportation Research Record:
Journal of the Transportation Research Board, pp 182–190.
Currie, G. and Lai, H. 2008. Intermittent and Dynamic Transit Lanes: Melbourne, Australia,
Experience. Transportation Research Record: Journal of the Transportation Research Board,
2072.
Economic Comission for Europe - Inland Transport Committee 1968a. Convention on road signs and
signals. E/Conf.56/17/Rev.1/Amend.1. Vienna.
http://www.unece.org/fileadmin/DAM/trans/conventn/crt1968e.pdf.
Economic Comission for Europe - Inland Transport Committee 1968b. Convention on road traffic.
E/Conf.56/Rev.1/Amend.1. Vienna.
http://www.unece.org/fileadmin/DAM/trans/conventn/crt1968e.pdf.
Economic Comission for Europe - Inland Transport Committee 2010. Recommended Signs of the
Vienna Convention for Use on VMS, Annex IX in Consolidated resolution on road signs and
signals (R.E.2). ECE/TRANS/WP.1/119/Rev.2.
http://www.unece.org/fileadmin/DAM/trans/main/wp1/wp1fdoc/ECE-TRANS-WP.1-119Rev.2%20e.pdf.
Eichler, M. 2005. Bus Lanes with Intermittent Priority: Assessment and Design. M.Sc., University of
California. http://www.its.berkeley.edu/volvocenter/blipeichlerthesis.pdf.
Eichler, M. and Daganzo, C. F. 2006. Bus lanes with intermittent priority: Strategy formulae and an
evaluation. Transportation Research Part B: Methodological, 40, 731-744.
Fellendorf, M. and Vortisch, P. 2010. Microscopic Traffic Flow Simulator VISSIM. In: BARCELÓ, J.
(ed.) Fundamentals of traffic simulation. 1st ed. New York.: Springer Science+Business
Media, LCC.
Girão, P. S., Alegria, F., Viegas, J. M., Lu, B. and Vieira, J. Wireless system for traffic control and law
enforcement. Proceedings of the IEEE International Conference on Industrial Technology,
2006. 1768-1770.
Goh, K. C. K., Currie, G., Sarvi, M. and Logan, D. 2014. Bus accident analysis of routes with/without
bus priority. Accident Analysis and Prevention, 65, 18-27.
Guler, I. and Cassidy, M. J. 2010. Deploying Underutilized Bus Lanes at Key Nodes in a Road
Network.
Guler, I. and Menendez, M. 2013. Empirical Evaluation of Bus and Car Delays at Pre-signals. 13th
Swiss Transport Research Conference. Monte Verità / Ascona.
Guler, S. I. and Cassidy, M. J. 2012. Strategies for sharing bottleneck capacity among buses and cars.
Transportation Research Part B: Methodological, 46, 1334-1345.
K2 Research 2015:5
53
Hounsell, N. B. and Shrestha, B. P. 2005. AVL based Bus Priority at Traffic Signals: A Review and
Case Study of Architectures. European Journal of Transport and Infrastructure Research, 1329.
Ipsos. 2013. Årsrapport 2012 – Kollektivtrafikbarometern, svensk kollektivtrafik [Online]. Available:
http://www.svenskkollektivtrafik.se/Global/Nyheter%202013/KOLBAR%20Ipsos_Rapport_H
el%C3%A5r%202012_v20130204.pdf.
Johansson, A., Waara, N. and Wärnmark, A. 2010. Översikt - Sju års VINNOVA-forskning om
kollektivtrafik, VR 2010:07. Vinnova. http://www.vinnova.se/upload/EPiStorePDF/vr-1007.pdf.
Joskowicz, I. F. 2012. Dynamic bus lane. The University of Texas at Arlington.
Mta 2002. Final report: Los Angeles metro rapid demonstration project. Technical report,
Metropolitan Transportation Authority and City of Los Angeles.
Nowlin, L. and Fitzpatrick, K. Performance of queue jumper lanes. Proceedings of the Conference on
Traffic Congestion and Traffic Safety in the 21st Century, 1997. 431-437.
Qiu, F., Li, W., Zhang, J., Zhang, X. and Xie, Q. 2015. Exploring suitable traffic conditions for
intermittent bus lanes. Journal of Advanced Transportation, 49, 309-325.
Sfs 1951. Lag om straff för vissa trafikbrott. 1951:649. Svensk författningssamling,.
http://www.riksdagen.se/sv/Dokument-Lagar/Lagar/Svenskforfattningssamling/Lag-1951649om-straff-for-v_sfs-1951-649/.
Sfs 1971. Väglag 1971:948. Svensk författningssamling,. http://www.riksdagen.se/sv/DokumentLagar/Lagar/Svenskforfattningssamling/Vaglag-1971948_sfs-1971-948/.
Sfs 1998. Trafikförordningen. 1998:1276. Svensk författningssamling.
http://www.riksdagen.se/sv/DokumentLagar/Lagar/Svenskforfattningssamling/Trafikforordning-19981276_sfs-1998-1276/.
Sfs 2007a. Förordning om elektroniskt kungörande av vissa trafikföreskrifter. 2007:231. Svensk
författningssamling,. http://www.riksdagen.se/sv/DokumentLagar/Lagar/Svenskforfattningssamling/Vagmarkesforordning-200790_sfs-2007-90/.
Sfs 2007b. Vägmärkesförordningen. 2007:90. Svensk författningssamling,.
http://www.riksdagen.se/sv/DokumentLagar/Lagar/Svenskforfattningssamling/Vagmarkesforordning-200790_sfs-2007-90/.
Spinak, A., Chiu, D. and Casalegno, F. 2008. Intermittent Bus Lane System (Lisbon). Sustainability
Innovation Inventory. Connected Urban Development.
Telematics Update 2013. Telematics Connectivity Strategies Report 2013.
http://www.slideshare.net/piersfrench/telematics-connectivity-strategies-report-2013-5minutes-findings.
Trafikverket 2014a. Kapitel 4 Tillgänglighet, Effektsamband för transportsystemet - Bygg om eller
bygg nytt. Version 2014-04-01. Borlänge: Trafikverket.
http://www.trafikverket.se/PageFiles/155466/04_kapitel_4_tillganglighet.pdf.
Trafikverket 2014b. Kapitel 5 Transportkvalitet, Effektsamband för transportsystemet - Bygg om eller
bygg nytt. Version 2014-04-01. Borlänge: Trafikverket.
http://www.trafikverket.se/PageFiles/155466/05_kapitel_5_transportkvalitet.pdf.
Trafikverket 2014c. TRVMB Kapacitet och framkomlighetseffekter - Trafikverkets metodbeskrivning
för beräkning av kapacitet och framkomlighetseffekter i vägtrafikanläggningar, TRV
2013:64343. Borlänge: Trafikverket.
Webster, F. V. 1958. Traffic Signal Settings, Technical Paper No. 39. London: Road Research
Laboratory.
54
K2 Research 2015:5
Wendle, B. 1997. Vad fördröjer bussen?: en studie av stadsbusstrafikens framkomlighet och förslag
till framkomlighetsfrämjande åtgärder. M.Sc. Thesis, Lunds universitet. Tekniska högskolan.
http://www.trivector.se/fileadmin/uploads/Traffic/Examensarbeten/wendle_vad_fordrojer_bus
sen.pdf.
Viegas, J. 2015. RE: Personal communication.
Viegas, J. and Lu, B. 1996. Turn of the century, survival of the compact city, revival of public
transport. In: MEERSMAN, H. & VOORDE, E. V. D. (eds.) Transforming the Port and
Transportation Business. Antwerp, Belgium, : Uitgeverij Acco.
Viegas, J. and Lu, B. 1999. Bus priority with intermittent bus lanes. Traffic Management, safety and
intelligent transport systems: proceedings of seminar held at the European Transport
Conference. Cambridge, UK: European transport conference.
Viegas, J. and Lu, B. 2004. The Intermittent Bus Lane signals setting within an area. Transportation
Research Part C: Emerging Technologies, 12, 453-469.
Viegas, J. M., Roque, R., Lu, B. and Vieira, J. 2007. The intermittent bus lane system: Lisbon
demonstration project. Public Transport International, 56, 40-43.
Vreeswijk, J., Armandi, M. and Campello, P. 2008. Flexible bus lanes in bologna. ITS Europe.
Geneve.
Wu, J. and Hounsell, N. 1998. Bus priority using pre-signals. Transportation Research Part A: Policy
and Practice, 32A, 563-583.
Xie, X., Chiabaut, N. and Leclercq, L. 2012. Improving Bus Transit in Cities with Appropriate
Dynamic Lane Allocating Strategies. Procedia - Social and Behavioral Sciences, 48, 14721481.
Yang, H. and Wang, W. An innovative dynamic bus lane system and its simulation-based performance
investigation. IEEE Intelligent Vehicles Symposium, Proceedings, 2009. 105-110.
Zhu, H. B. 2010. Numerical study of urban traffic flow with dedicated bus lane and intermittent bus
lane. Physica A: Statistical Mechanics and its Applications, 389, 3134-3139.
K2 Research 2015:5
55
56
K2 Research 2015:5
K2 är nationellt kunskapscentrum för kollektivtrafik med fokus på forskning och kompetensutveckling.
K2 är en mötesplats för nära samverkan mellan akademin och kollektivtrafikens aktörer. Samverkan sker såväl vid
utveckling av forskningsfrågor som vid genomförandet av forskning och spridningen av resultat.
K2 bidrar till kollektivtrafikens förnyelse och till framtidens attraktiva och hållbara storstadsregioner genom att utveckla
och tillgängliggöra kunskap.
K2 drivs av Lunds universitet, Malmö högskola och VTI i samarbete med Stockholms läns landsting, Västra
Götalandsregionen och Region Skåne samt med stöd av Vinnova, Formas och Trafikverket.
www.k2centrum.se


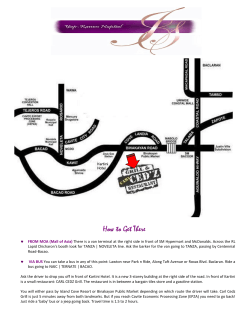


© Copyright 2026