
Document 426402
An Atlas of the Overbrook Neighborhood
of Pittsburgh 1977
OVERBROOK
UNIVERSITY CENTER fOR URBAN RESEARCH
UNIVERSITY Of PInSBURGH
249 NORTH CRAIG STREET
PITTSBURGH, PENNSYLVANIA 15260
1209-D, Cathed,al of Learning
University of Pittsburgh
Pittsburgh, Pennsylvania 15260
Phone: (412) 624-3465
PITTSBURGH NEIGHBORHOOD ATLAS
GOVERNING BOARD
ROGER AHLBRANDT, JR.
Univ"rslty of Pi ttsburgh, School of SocI.1 Work
Chal,p"I'Won
JAMES VALLAS
Shadyside
Vlc.Ch.lrplI'lon
BARBARA KELl. Y
Pliny-Hilltop
S":rllll1ry
TEARY WOODCOCK
Squirrel Hili
T .....ur..
RICHARD ARMSTEAD
Hili Dlltrlct
JOSEPH BORKOWSKI
LI .... e.e"cevllle
DANIEL. CHAPPELL
Hili DIstrict
MARY COYNE
W..t End
JIM CUNNINGHAM
Sh"dYllde
MARY LOU DANIEL
West End
JESE OEL GRE
HIli Dlltrlct
WILLIAM P. GALLAGHER
G.Hnfleld
MARY HALL
Squlrr.' Hili
ROSE JEWELL
Sh"dYllde
GABOR KISH
Elliott
ROBERT "BLUE" MARTIN
H••• I.... ood
THOMAS MURPHY
P" rty Hilltop
EXECUTIVE DIRECTOR
WENDELL D . JORDAN
AGENCIES
Actlon- Houllnll. Inc.
u .S. BUrMU of thl c.noUI
C",nesli. MIUOn Unlv .... ltv
Ch,lstlln Aosocllt..
City Council
Community Action Pittsburgh
County Pllnn'r'III o.p"tmlnt
H'"lth o!Io Weif..,
Pllnnlnll Anoclilion
Nltlon,1 In.tltutl of NIlghborhood Studl..
Unlv .... lty of Plttsburtilh School
01 Socl.1 Work
Southw..tlrn P.nnlylvlnl.
Reglonll Pllnnlnll Commlulon
St.l1 Deplnment 01
Community Affllr..
Unlli1d W.y
Urbin ,nd Community
Aft,l .. _ Un'vI,shy of Plmburgh
CONSULTANTS
Unl ....... lty of Pittsburgh Clnt...
lor Urbin R_rch
City Pllnnlnll Dep.rt .... nt
OZ SCHMIDT - GlOIIrlphy D.pt ..
Univ, .. lty of Pll1lbur(lh
JOHN YORIO _ Hltilhllnd Pork
STAFF
Wendell D. Jordan (East Liberty-Lemington-Lincoln)
Margaret K. Charny (Squirrel Hill)
Julia Whitener (Mexiean War Streets)
Millofred Russell (Homestead. Pa.)
Gerald S. Oswalt (Schenley Heights)
Katherine Knorr (East Liberty)
John Zingaro (Shadyside)
Dan Baskin
Vicky Leap
HCNard Williams
Ronald Madzy
Tony Gary
Mary Shea
SUPPORTIVE INSTITUTIONS
Pittsburgh Neighborhood Alliance
Center for Urban Research of the Univ. of Pgh.
School of Social Work of the Univ. of Pgh.
Architect Workshop
City Council of the City of Pgh.
Allegheny County Department of Elections
ACTION-Housing. Inc.
Department of City Planning of the City of Pgh.
Southwestern Penna. Regional Planning Commission
ACTION-Vista (Volunteers in Service to America)
Valley View Presbyterian Church
FUNDING SOURCES
Alcoa Foundation
Allegheny Conference on Community Development
Howard Heinz Endowment
Jones and Laughlin Steel Corporation
Koppers Company
Richard King Mellon Foundation
City Council of the City of Pittsburgh
The Pittsburgh Foundation
Henry Oliver Rea Charitable Trust
Sarah Scaife Foundation. Inc.
Weld Tooling Company
University of Pittsburgh (In Kind)
Initiated by the PITTSBURGH NEIGHBORHOOD ALLIANCE
INTRODUCTION
The Pi ttsburgb Neighborhood Al11ance was fanned in 1969 by a number of
neighborhood organizations that were concerned with improving the city's neighborhoods and their relations with city government. The mElllbers of the Al.l.lance
recognized that in order to negotiate effectively with city government about
sueh maJor concerns as public service needs, capital improvements and transportation, it was necessary to obtain accurate, up-to-date information about the
neighborhoods.
Unfortunately, this information was not available.
To remedy this situation, the A1liance developed its Pittsburgh Neighborhood Atlas project. First, the boundaries of the city's neigbborhoods had
to be determined. The Pittsburgh Neighborhood Atlas asked people attending
community meetings to name and describe the boundaries of' the neighborhoods in
which they lived. This infomation was a.l.sa provided by an Atlas-initiated
survey. Responses tram every voting district of the city were an&l.yzed to assure
citizen involvement at the neighborhood level. Seventy-eight neighborhoods were
thus identified, each made up of one or more whole voting districts in order to
comply with provisions in Pittsburgh's home rule charter relating to the election
of camnunity advisory boards.
The Atlas then gathered a body of useful and ~to-date intor.mation tor
every neighborhood.. It is the beginning of a neighborhood information system
that more closely reflects neighborhood boundaries as defined by residents instead of by public officials. In the past, statistics about sections ot the
city have been based on information published tor relatively large areas such
as census tracts. For the atlas, much ot the material describing neighborhood
characteristics came f'rcm figures compiled for smaller areas: voting districts
or census blocks. As a result, detailed information is now available tor neighborhoods whose boundaries differ substantially tram census tract boundaries.
The 1nto~tion in this atlas provides an insight into current neighborhood conditions and the direction in which the neighborhood is moving. The best
indicators showing the health of the neighborhood are provided by citizen satistaction with the neighborhood, and changes in residential real estate transaction
prices. Comparison of these statistics to those for the entire city provide a
basis to begin understanding issues of neighborhood It ability. In the years to
cane, as additional data are gathered for each of these indicators, trends will
became more obvious.
It is important to recognize that neighborhood cbange is a canplex p~
cess and that one indicator by itself ~ not be useful. Neighborhoods m~ be
hea.1tby regardl.ess of their level of inccm.e, and therefore incane-re1ated statistics ~ not be useful guides by themselVes. Neighborhoods muat be viewed
over time in terms of relative changes compared to the city as a whole, and any
~is of neighborhood coDditiona must toeus upon o.ll ot the data in order 11>
provide a c:anprebenaive understanding.
~o learn about specific sections of the neighborhood, figures by individual voting district or cenau.s tract ma;y be Obtained. Add1 tional information
on the neighborhood or the information aystem is available through the Center
for Urban Research of the University of Pittsburgh, which has made an outstanding
contribution to the development of this atlas.
-
=
=1=
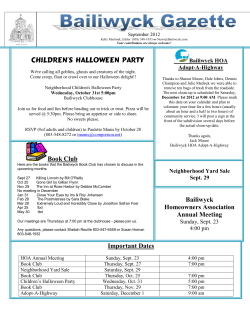
NEIGHBORHOOD DESCRIPTION
Overbrook is approximately 3.5 miles south of downtown. It is estimated
to be 636.0 acres in size, containing 1.9% of the city's land and 1.3% of its 1974
population. The voting districts in the neighborhood are 111 to {;4. and #6, Ward
32. (See Appendix for a listing of the neighborhood's census tracts.)
WHITEHALL
CASTLE
SHANNON
BORO
BORa
1
-2-
NEIGHBORHOOD HISTORY
OVERBROOK
Utilizing its clean, fast running stream, the Saw Mill Run, Overbrook's
first commercial enterprise was a grist mill established in the early 1800's. In
the late 19th century, a steam mill took its place.
Overbrook, then known as Fairhaven, was mostly farmland with few houses.
A blacksmith shop,built in 1885 on Library Road,flourished, drawing farmers from
miles around. Living quarters were so limited in Fairhaven that when J ohn Imblum
came to work in the shop in 1895, he had to commute from Duquesne Heights.
Jacob F. Doelbor, Overbrook's founder, moved there from Herron Hill in
1910. A retired 30 year employee of the Oil Well Supply Company. Doelbor
helped establish the Bethlehem Evangelical Church of Knoxville, and became an officer
of the Overbrook Building and Loan Association.
Development brought a number of small businesses to the area. Galley's
General Store and Post Office stood on the present site of Page Milk Company. Browdy's
Grocery Store on Ansonia near South Bank, flourished. Corcella's Butcher Shop,
Wymer's Drug Store and the Provost Lumber Company were other operations.
Overbrook has had three governmental organizations. It was originally a
part of Baldwin Township, formed in 1870 from parts of Mifflin Township, Jefferson
Township,and Upper and Lower St. Clair, and named in honor of Judge John Baldwin.
Over the years, the township proved too big and sparsely populated to be well governed.
The people of Overbrook grew dissatisfied and petitioned for a borough, feeling it
would be better able to provide good streets, lighting, and fire and police protection.
Overbrook was incorporated as a borough in 1919. Annexation to the City of Pittsburgh came in January 1930, following a community referendum and passage of an
ordinance of acceptance by Pittsburgh's City Council.
Overbrook paved its streets during the 1920's, building up debts which plagued
Pittsburgh's City Council following the borough's annexation to the city in 1930.
In 1938, the acting City Solicitor, Anne X. Alpern, took the case to the Pennsylvania State Supreme Court. The Court decided that Overbrook exceeded its borrowing
capacity in issuing contracts of indebtedness to cover paving contracts. Overbrook
was popularly accused of "paving frolic".
Citing the poor condition of streets and the lack of repairs, Overbrook
residents complained of neglect by the city during the 1930's. This neighborhood
concern has recurred over the next few decades. During the 1950's. residents
complained about transportation routes to Overbrook Elementary School. It was
charged that neighborhood children were forced to walk across and along sidewalkless Saw Mill Run Boulevard . In October 1971, Jean Fink led parents in a rush hour
blockage of the Boulevard in front of Overbrook School to protest the conditions
children faced in walking to school.
-3OVERBROOK
SUMMARY STATISTICS
Neighborhood
Population (1974)
6,055
-4'.
% Change (1970-1974)
t Black population (1970)
27-
1,788
Housing units (1974)
% Vacant
% Owner - occupied housing
unita (1974)
Average sales price of owner - occupied
dwellings (1975)
Pittsburgh
479,276
-8%
20.
166,625
2'.
6'.
84'.
54%
$22,014
$23,518
% Residential real estate transactions
with mortgages provided by financial
institutions (1975)
Crime rate (1975)
Average family income (1969)
Income index
8S
% of city index (1974)
% Satisfied with neighborhood (1976)
Major neighborhood problems (1976)
681-
597.
0.016
0.053
$10,900
$10,500
104%
50%
Poor roads
Dog litter
Stray dogs
417.
Poor roads
Dog litter
Burglary
CITIZEN SURVEY
The purpose of the citizen survey was to obtain attitudes about the
quality of the neighborhood environment . Citizens were asked to respond to
questions concerning the neighborhood as a whole, neighborhood problems, and
public services. The attitudinal data, heretofore not available, are key indicators of the relative health of the neighborhood . By specifying neighborhood
problems or public service needs, the information may be a useful guide for
public investment or service delivery decisions.
The city-wide survey was mailed to a randomly selected sample of
registered voters. Of approximately 35,000 households contacted, 9767 responded.
The sample provides a 5~ response rate for each of the city's 423 voting districts.
(See Appendix for a profile of the respondents as well as for statistics on voter
registration.)
-4I.
Neighborhood Satisfaction
Overbrook residents are generally more satisfied with their neighborhood than residents city-wide. Table 1 shows that 50% of the citizens
responding to the survey were satisfied with their neighborhood compared to
41% in all city neighborhoods. When asked to state whether the neighborhood
is better or worse than two years ago, 15% said that it was better which exceeded the city-wide response of 121..
Given the opport'Jnity to move from the
neighborhood, 42% said they would continue to live these compared to a response
of 45% for the city as a whole. The responses to these satisfaction questions
indicate a mixed attitude of residents toward their neighborhood compared to
citizens city-wide.
.I
TABLE 1
Neighborhood Satisfaction
Overbrook
Question 1:
Generally, how satisfied are you with conditions in the
neighborhood?
Satisfied
Overbrook
All neighborhoods
Question 2:
(%)
50
41
29
37
19
21
Do you think this neighborhood has gotten better or worse
over the past two years?
Overbrook
All neighborhoods
Worse
(%)
Not Changed
(%)
15
12
34
49
50
36
(%)
If you had your choice of where to live, would you continue
living in this neighborhood?
Overbrook
All neighborhoods
SOURCE :
Neither
(7.)
Better
Question 3:
Dissatisfied
(7;)
Yes
No
ill
ill
Not Sure
(7.)
42
29
27
45
32
18
Citizen Survey, 1976.
NOTE: The percent responses to each question do not add up to 100%. The
difference is accounted for by the following: "don't know". "unable to
evaluate", or no answer.
•
-5-
II.
Neighborhood Problems
In order to identify specific neighborhood problems, residents
were asked to consider twelve problems usually associated with urban
communities and rate them for the neighborhood. Table 2 compares the
problem ratings of the respondents from Overbrook to those from all city
neighborhoods. Areas of particular concern for the neighborhood include
poor roads, stray dogs, snd dog litter.
III.
Satisfaction with Public Services
Table 3 shows the satisfaction of Overbrook residents with their
public services snd compares the responses to data for all city neighborhoods. City-wide. residents are least satisfied with street snd alley
maintenance. Overbrook residents are more satisfied with respect to garbage
collection and the fire department. and less satisfied with respect to street
and alley maintenance. and parks and recreation.
The Citizen Survey also asked the respondents to list the services
with which they were the least satisfie~ and to explain the reasons for
their dissatisfaction. Residents from Overbrook gave the greatest number
of reasons for dissatisfaction to the services listed below. Included is a
summary of the major reasons for their dissatisfaction.
1.
Street and alley maintenance: Poor maintenance; need
better street repair program; problems with potholes;
poor service in bad weather (i.e .• snow removal. salting).
2.
Parks and recreation: No recreational facilities close
by; need more recreational facilities (i.e .• playgrounds,
equipment); need better supervision in recrestional areas.
3.
Sewage-sewer system:
Poor sewage system; dirty sewers .
-6TABLE 2
Neighborhood Problems
Overbrook
Problem Category
Problem Rating - Percent Response
Big or
Not a
Problem.
Minor or
Moderate
Unsafe streets
Overbrook
All neighborhoods
48
25
41
45
2
21
Vandalism
Overbrook
All neighborhoods
20
13
65
49
8
28
Overbrook
All neighborhoods
28
34
47
33
14
12
Burglary
OVerbrook
All neighborhoods
19
14
55
44
11
Poor roads
Overbrook
All neighborhoods
15
17
43
41
35
33
Trash and litter
Overbrook
All neighborhoods
33
27
49
41
15
24
Vacant buildings
Overbrook
All neighborhoods
68
49
15
24
13
Undesirable people maving
into the neighborhood
Overbrook
All neighborhoods
59
42
23
28
4
15
Stray dogs
Overbrook
All neighborhoods
30
25
44
38
22
18
Dog litter
Overbrook
All neighborhoods
29
21
42
38
25
32
Very Serious
Rats
SOURCE:
29
1
Citizen Survey, 1976.
NOTE: The percent responses to each question do not add up to 100%. The
difference is accounted for by the following: !tdon't know!t, !tunable to
evaluate", or no answer. The problem categories of alcoholism and drug
abuse are not included in the table because the response rates to these
questions were low.
s
-7-
TABLE 3
Satisfaction with Public Services
Overbrook
Percent Respons e
Servi ce
Satisfied
Neither
Parks and Recreation
Overbrook
All neighborhoods
42
51
15
15
35
23
Schools
Overbrook
All neighborhoods
49
46
16
12
22
21
Street maintenance
Overbrook
All neighborhoods
22
32
20
15
55
49
Alley maintenance
Overbrook
All neighborhoods
22
20
14
13
34
39
Garbage collection
Overbrook
All neighborhoods
86
74
7
10
6
13
Police
Overbrook
All neighborhoods
57
51
20
17
16
23
Public transportation
Overbrook
All neighborhoods
70
61
9
11
18
23
Fire Department
Overbrook
All neighborhoods
89
78
5
7
0
3
Sewage system
Overbrook
All neighborhoods
55
63
12
10
29
13
Condition and cost of housing
Overbrook
All neighborhoods
54
44
22
17
9
22
SOURCE:
Dissatisfied
Citizen Survey, 1976.
NOTE: The percent responses to each question do not add up to 1007. . The
difference is accounted for by the following: "don't know", "unable to
evaluate", or no answer. Public health and mental health/mental retardation
services are not included in the table because the response rates to these
questions were low.
I
-8-
CRIME RATE
The crime rate for major crimes has decreased over the last three
years (Table 4). In 1973 the number of major crimes per capita was .022
compared to .016 in 1975. The crime rate in the neighborhood was less than
the city per capita rate of .053 in 1975.
TABLE 4
Crime Rate:
Major Crimes
Overbrook
Major Crimes
Crime Rate
Neighborhood
Pittsburgh
Year
Number
1973
134
.022
.043
19)4
134
.022
.04)
19)5
9)
.016
.053
SOURCE:
Ci ty of Pittsburgh, Bureau of Police.
NOTE: Major crimes are murder, rape, robbery, assault, burglary,
and theft. The neighborhood crime rate is computed by dividing
the number of crimes committed in the neighborhood by its adjusted
population for 1974 .
,
1'7
•
-9THE PEOPLE
Table 5 Bnd Table 6 present data on the characteristics of the neighborhood
population Bnd compare them to city-wide statistics.
In 1974, the estimated pouulation of Overbrook was 6,055, down by 4% since
1970. This compares to a city-wide population decline of 8% during the same period.
Information on the racial composition of the neighborhood is not available for
1974; however, the number of Black households in the neighborhood increased during
the decade of the sixties, and the Black population was 1.5% of the neighborhood's
population in 1970, compared to 20.2% for the city.
The average household size in the neighborhood was 3.10 persons in 1974, down
from 1970. The percentage of the population 65 years and older was 9.6% in 1970,
compared to 13.5% for the city as a whole.
TABLE 5
Population and Household Characteristics, 1970 and 1974
Overbrook
Neishborhood
1970
1974
Population
7G Black
'%. 65 years and over
Households
% One -person households
% Retired head-of-household
7. Households with children
% Female head-of-household
with children
7- In owner-occupied housing unit
% Households changing place of
residence within past year
Average household size
SOURCES:
NOTE:
1.57.
9.6%
11.6%
82.27.
Pittsbursh
1970
1974
20.2%
13.57-
12.9721.9%
44.1%
3.1784.3"1.
25.4%
50.3%
15.37.
3 .36
3.10
25.57.
26.37.
32.7%
6.47.
54.2727.07.
2.82
2.67
U. S. Census (1970) and R. L. Polk & Co. (1974).
Dotted lines ( ..•• ) indicate data unavailable for that year.
The turnover rate of households in the neighborhood is less than that for all
of the city's neighborhoods. During 1973, 15 .3% of the households in the neighborhood changed their place of residence compared to a rate of 27.0% for the city.
(The figures represent households who have moved within the neighborhood or city
as well as those moving into or out of the neighborhood or city.)
i
-10Female-headed households with children in 1974 comprised 3.1% of the total
households in the neighborhood compared to 6.4% for the city as a whole. In
1974, one-person households consisted of 12.9% of the total households in the
neighborhood compared to 25.5% city-wide and to 11.6% for the nei ghborhood in
1970.
TABLE 6
Neighborhood Change:
Overbrook
1960-1970 and 1970-1974
Percent Change
Neighborhood
Pittsburgh
Number
Neighborhood
Population
1960
1970
1974
Households
6,644
6,312
6,055
- 5
4
-14
- 8
1
1960
1970
1974
1,879
1,876
1,760
Black households
less than - 1
- 6
- 6
-12
+63
+15
less than - 1
- 6
-12
2
1960
1970
1974
16
26
(not available)
Housing units
1960
1970
1974
SOURCES:
1,917
1,908
1,788
- 3
U. S. Census (1960; 1970) and R. L. Polk & Co. (1974).
NOTE: The population figures reported by Polk are adjusted to account for underreporting. Population includes persons living in institutions and other group
quarters, such as nursing homes, dormitories or jails. Differences in the population, household, or housing unit count between 1970 and 1974 are due primarily
to changes occurring in the neighborhood. A small percentage of the difference
may be accounted for, however, by variations in data gathering techniques. Census statistics were compiled from information provided by all city households
answering a standard questionnaire either by mail or interview on or about April 1,
1970. R. L. Polk collected its information by a door-to-door survey carried out
over a period of several months. (See Appendix.)
1The number of occupied housing unita equals the number of households.
~on-white households in 1960.
-11-
NEIGHBORHOOD INCOME
The average family income in Overbrook was $10.900, 104% of the city
average, for the year 1969. R. L. Polk and Company computes an income index
for each city census tract. This index, derived from the occupation of heads
of households , was used to calculate the income index of the nei ghborhood. In
1974, the index for OVerbrook was 104% of the figure for the city as 8 whole.
Table 7 shows the number of neighborho.:>d households receiving cash
grants in 1974, 1975 and 1976 under the public assistance program of the Pennsyl~
vania Department of Welfare. Public assistance in the form of food stamps,
Medicaid, and various social services are also available to these households, as
well as to other households in need. Public assistance payments were made to
5.0% of the nei ghborhood households in 1976, a lower proportion than for the
city overall and an increase since 1974.
TABLE 7
Public Assistance:
Overbrook
Households Receiving Cash Grants
Neighborhood
Number
Percent
1974
80
4.5
16.0
1975
90
5.1
17.2
1976
88
5.0
18.0
SOURCE:
I
Pittsburgh
Percent
Allegheny County Board of Assistance.
NOTE: The percentages are based on 1974 Polk households.
Only households receiving cash grants under Aid to Dependent Children, Aid to Dependent Children-Unemployed Parent;
General Assistance, and State Blind Pension programs are
tabulated. The count is of those on assistance as of April
5, 1974, February 28, 1975, and February 27, 1976; households whose grants were terminated between reporting dates
are not included.
-12-
HOUSING
Table 6 shows that the number of housing units in Overbrook decreased
slightly during the decade of the sixties and decreased from 1970 to 1974. Of
the occupied housing units, 84.3% were owner~occupied in 1974, compared to 8
city-wide rate of 54.27.. The vacancy rate for the neighborhood was 1.74 which
was less than the rate for the city as a whole. (See Table 8.)
The average value of owner-occupied housing in the neighborhood was
$14,200 in 1970, compared to a city-wide average of $14,800.
TABLE 8
Housing Characteristics, 1970 and 1974
Overbrook
Neighborhood
1970
1974
Pittsburgh
1970
1974
Housing units
1. Vacant
% One-unit structures
1.7
84.8
1.7
52.9
Occupied housing units
% Owner-occupied
82.2
84.3
Average value:
50.3
ownfr-
occupied units
SOURCES:
6.2
$14,200
$14,800
U. S. Census ( 1970) and R. L. Polk & Co. ( 1974).
lAverage value rounded to nearest one hundred dollars.
6.2
54.2
-13REAL ESTATE AND MORTGAGE LOAN TRANSACTIONS
The average sales price of owner-occupied housing was $22,014 in 1975.
(See Table 9.) Although the avera ge price was less than the city-wide average,
the implications of this divergence are difficult to judge because of variations
in the quality and size of the structures among city neighborhoods.
As additional
data are obtained, however, the trend in real estate prices for the neighborhood can
be compared to the trend for the city as a whole in order to determine relative
differences.
In order to evaluate the extent to which private lenders are involved
in the neighborhood, the number of mortgage loans made on residential property
each year must be divided by the number of residential real estate transactions
for that year. The percentage of residential real estate transactions financed
through financial institutions was 68% in 1975 in Overbrook compared to a citywide rate of 59%. The implications of the difference between the two rates are
difficult to discern because of variations in risk factors and income levels
among city neighborhoods. However, as additional data become available. trends
in lending activity within the neighborhood compared to other neighborhoods or to
the city as a whole can be assessed .
TABLE 9
Real Estate and
Overbrook
Mortg~e
Average salrs price:
dwellings
Loan Statistics
Neighborhood
Pittsburgh
$19,519
$22,014
$21,582
$23,518
owner-occupied
1974
1975
Number of residential mortgages
1973
1974
1975
63
52
47
% Residential real estate trsnsactions
with mortgages provided by financial
institutions
1974
1975
SOURCE:
1
74%
68%
City of Pittsburgh, Department of City Plsnning.
Data for 1975 not supplied for neighborhood census tract #3204.
58%
59%
-14-
APPENDIX
a. Data Sources: Information for the atlas was obtained from the 1960 and 1970
U. S. Census of Population and Housing; R. L. Polk and Company 's "Profiles of
Change" for Pittsburgh in 1974; Pittsburgh's Department of City Planning and
Bureau of Police; the Allegheny County Board of Assistance, and Department of
Elections and Voter Registration; Southwestern Pennsylvania Regional Planning
Commission; and the Citizen Survey conducted by the Pittsburgh Neighborhood Atlas.
b.
Neighborhood Census Tracts:
3202, 3204, sud part of 3201 and 3203.
c. MethodoloRY: The opinions and characteristics of survey respondents, as well
as voter regis tration, were recorded by voting district snd then compiled for
Overbrook by the Pittsburgh Neighborhood Atlas in conjunction with the Center for
Urban Research, University of Pittsburgh. Other material in the atlas was drawn
from statistics tabulated for city census tracts or census blocks.
The neighborhood boundaries, which were determined on the basis of whole voting
districts, do not conform exactly to census tract boundaries, so minor boundary
adjustments were made wherever possible to simplifv data collection efforts. In
Overbrook and in other parts of the ' city where substantial portions of a census tract
fall in more than one neighborhood, tbe neighborhood characteristics for 1960 and
1970 were arrived at by adding togetber data for the census blocks in the neighborhood, item by item. The statistics from sources other than the U. S. Census
were made available only by census tract, not by census block; therefore a method
for prorating the data among nei ghborhoods was developed. The procedure allocated
data for each neighborhood containing partial census tracts on the basis of the
proportion of total tract population, bouseholds, or housing units contained in
each sub-section.
To compensate for under-reporting, the 1974 figure for the neighborhood population
has been increased by 1.11, a factor that was derived from the U. S. Bureau of the
Census 1973 population estimate for Pittsburgh. An additional adjustment has been
made where applicable, since Polk and Co. does not count persons living in institutions or other group quarters. To arrive at the total estimated population
for 1974, the neighborhood population was further increased by adding the number
of persons in grou p quarters for the neighborhood according to the 1970 Census .
d. Characteristics of the Sample : In Overbrook, 143 citizens answered the questionnaires. Based on the number of replies to each question, the characteristics of
the respondents can be generally described as follows: an average age of 46; 61%
female; 1% Black; 86% with at least four years of high schoo l education; 85% homeowners; and an average of 20 years in the neighborhood. The median household income
falls in the range of $10,000 to $14,999; the average household size is 3 .66 persons;
and 50% of the households have no members under 18 years old living in the home.
The total sample (all respondents to the survey) was over-represented by homeowners
(68% compared to 50% for Pittsburgh in 1970) and under -represented by Blacks (14%
compared to a city Black population of 20% in 1970).
e. Voter Registration: In November, 1976, 2,922 residents of the neighborhood were
regis tered to vote, an increase of 54 (+1.9%) since November, 1975. In this period,
city registration increased by 1.3% to 233,028.
r
\


© Copyright 2026