
Dissertation submitted to the of the Ruperto-Carola University of Heidelberg, Germany
Dissertation
submitted to the
Combined Faculties for the Natural Sciences and for Mathematics
of the Ruperto-Carola University of Heidelberg, Germany
for the degree of
Doctor of Natural Sciences
Put forward by
Dipl.-Phys. Kim Melanie Kraus
Born in: Siegen
Oral examination: 15.01.2014
Dose Delivery Study for a Novel Compact Proton
Accelerator
Referees:
Prof. Dr. Uwe Oelfke
Prof. Dr. Wolfgang Schlegel
Dosisapplikationsstudie für einen neuen kompakten Protonenbeschleuniger
Seit mehr als 60 Jahren spielt Protonentherapie eine wichtige Rolle in der Behandlung von Krebs mit ionisierender Strahlung. 3D spot-scanning wurde entwickelt, um
eine höchst konformale Dosis im Tumor zu applizieren. Trotzdem ist die Verfügbarkeit
von Protonentherapie für die Patienten noch immer limitiert, teilweise aufgrund der hohen Kosten und der Dimensionen von großen Multi-Raum Protonentherapiezentren.
Deshalb wurde eine neue kompakte 1-Raum-Anlage für Protonentherapie, namentlich
TULIP (TUrning LInac for Proton therapy) entwickelt, basierend auf einem Linearbeschleuniger montiert auf einer Gantry. Dieser Beschleuniger ermöglicht aktive Energievariation auf einer Zeitskala von Millisekunden. Das Ziel dieser Arbeit ist, die Möglichkeiten der Dosisapplikation mit TULIP zu erarbeiten, um die vorteilhaften Eigenschaften
bezüglich der Dosisapplikation bestmöglich auszunutzen. Wir haben ein Softwareprogramm entwickelt, welches die Dosisapplikation in einem Tumor simuliert. Mit Hilfe dieses Programms haben wir verschiedene Dosisapplikationsmethoden untersucht und
herausgefunden, dass 3D spot scanning in Bezug auf Dosis und Zeit der Rotationstherapie mit Protonen überlegen ist. In einem zweiten Teil haben wir die Untersuchungen
auf Dosisabgabe an bewegte Tumore erweitert. Aufgrund schneller Energievariation ist
TULIP besonders geeignet für Rescanning, was durch Bestrahlungszeiten von wenigen
Minuten belegt werden konnte.
Dose Delivery Study for a Novel Compact Proton Accelerator
Proton therapy has played an important role in the treatment of cancer with radiation
therapy for more than 60 years. Active spot scanning to deliver highly conformal dose to the tumor has been developed. However, the availability of proton therapy to the
patients is still limited, partly, due to the high costs and sizes of large proton therapy
centers. Therefore, a novel compact proton single room facility based on a linear accelerator mounted on a gantry has been proposed, named TULIP (TUrning LInac for
Proton therapy). This accelerator allows for active energy variation on a milliseconds
time scale. This work aims to assess the possibilities of dose delivery with TULIP to exploit its beneficial features with respect to dose delivery. We developed a software tool,
simulating the dose delivery to the tumor. By means of this software tool, we assessed
different delivery methods and found 3D spot scanning to be superior to rotational dose
delivery with regard to dose and irradiation time. In a second part, we expanded the
investigations to dose delivery to moving targets. Due to fast energy variation, we found
TULIP to be preferably suitable for rescanning, confirmed by irradiation times of only a
few minutes.
i
Contents
1 Introduction
1.1 Objectives of this work . . . . . . . . . . . . . . . . . . . . . . . . . .
2 Proton Therapy
2.1 Basic physical properties of protons . . . . . . . . . . . . . .
2.2 Proton acceleration . . . . . . . . . . . . . . . . . . . . . .
2.2.1 Cyclotrons . . . . . . . . . . . . . . . . . . . . . . .
2.2.2 Synchrotrons . . . . . . . . . . . . . . . . . . . . . .
2.2.3 Fixed Field Alternating Gradient accelerators (FFAGs) .
2.3 Novel accelerator techniques . . . . . . . . . . . . . . . . .
2.3.1 Laser induced acceleration of protons . . . . . . . . .
2.3.2 Dielectric wall accelerator . . . . . . . . . . . . . . .
2.3.3 Linear particle accelerator . . . . . . . . . . . . . . .
2.4 Dose delivery and treatment planning with proton beams . . .
2.4.1 Introduction . . . . . . . . . . . . . . . . . . . . . .
2.4.2 Dose delivery methods for proton beams . . . . . . . .
2.4.3 Treatment planning . . . . . . . . . . . . . . . . . . .
2.4.4 Treatment planning for proton beams . . . . . . . . . .
2.5 Treatment of moving organs with protons . . . . . . . . . . .
2.5.1 Organ motion in radiation therapy . . . . . . . . . . .
2.5.2 Consequences of organ motion for proton beam therapy
2.5.2.1 Density changes . . . . . . . . . . . . . . .
2.5.2.2 Interplay effects . . . . . . . . . . . . . . . .
2.5.3 Motion management . . . . . . . . . . . . . . . . . .
2.5.3.1 Motion monitoring . . . . . . . . . . . . . .
2.5.3.2 Motion mitigation and dose delivery strategies
1
1
.
.
.
.
.
.
.
.
.
.
.
.
.
.
.
.
.
.
.
.
.
.
5
5
8
9
11
13
13
13
15
15
17
17
18
20
21
23
24
24
25
25
27
27
29
3 TULIP - TUrning LInac for Proton therapy
3.1 Introduction . . . . . . . . . . . . . . . . . . . . . . . . . . . . . . .
3.1.1 Motivation . . . . . . . . . . . . . . . . . . . . . . . . . . . .
3.1.2 TULIP - Design . . . . . . . . . . . . . . . . . . . . . . . . . .
35
35
35
36
ii
.
.
.
.
.
.
.
.
.
.
.
.
.
.
.
.
.
.
.
.
.
.
.
.
.
.
.
.
.
.
.
.
.
.
.
.
.
.
.
.
.
.
.
.
.
.
.
.
.
.
.
.
.
.
.
.
.
.
.
.
.
.
.
.
.
.
.
.
.
.
.
.
.
.
.
.
.
.
.
.
.
.
.
.
.
.
.
.
3.1.3 TULIP - accelerator and beam line . . . . . . . . . . . . . . . .
4 Static proton dose delivery with TULIP
4.1 Dose Delivery Simulation Software . . . . . . . . . . . . . . . . .
4.1.0.1 Input Data . . . . . . . . . . . . . . . . . . . . .
4.1.1 TUlip DOse CAlculation software -TuDoCa . . . . . . . . . .
4.1.2 Evaluation of the dose calculation software . . . . . . . . . .
4.1.2.1 Methods and Materials . . . . . . . . . . . . . . .
4.1.2.2 Results . . . . . . . . . . . . . . . . . . . . . . .
4.1.2.3 Discussion . . . . . . . . . . . . . . . . . . . . .
4.1.3 Influence of relative isocenter position on the dose distribution
4.1.3.1 Materials and Methods . . . . . . . . . . . . . . .
4.1.3.2 Results . . . . . . . . . . . . . . . . . . . . . . .
4.1.3.3 Discussion . . . . . . . . . . . . . . . . . . . . .
4.2 Dose delivery to static targets . . . . . . . . . . . . . . . . . . . .
4.2.1 Dynamic rotational dose delivery . . . . . . . . . . . . . . .
4.2.1.1 Materials and Methods . . . . . . . . . . . . . . .
4.2.1.2 Results . . . . . . . . . . . . . . . . . . . . . . .
4.2.1.3 Discussion . . . . . . . . . . . . . . . . . . . . .
4.2.2 3D spot scanning dose delivery with TULIP . . . . . . . . .
4.2.2.1 Materials and Methods . . . . . . . . . . . . . . .
4.2.2.2 Results . . . . . . . . . . . . . . . . . . . . . . .
4.2.2.3 Discussion . . . . . . . . . . . . . . . . . . . . .
4.2.3 Influence of breakdown rate on the dose distribution . . . . .
4.2.3.1 Materials and Methods . . . . . . . . . . . . . . .
4.2.3.2 Results . . . . . . . . . . . . . . . . . . . . . . .
4.2.3.3 Conclusion . . . . . . . . . . . . . . . . . . . . .
4.3 Discussion and Conclusion . . . . . . . . . . . . . . . . . . . . .
5 Dose delivery to moving tumors with TULIP
5.1 Introduction . . . . . . . . . . . . . . . . .
5.2 Materials and Methods . . . . . . . . . . .
5.2.1 4D dose delivery simulation algorithm
5.2.2 Input data . . . . . . . . . . . . . .
5.2.3 Magnitude of motion induced effects .
5.2.4 Rescanning . . . . . . . . . . . . .
5.3 Results . . . . . . . . . . . . . . . . . . .
5.3.1 Magnitude of motion induced effects .
5.3.2 Rescanning . . . . . . . . . . . . .
5.4 Discussion . . . . . . . . . . . . . . . . . .
iii
.
.
.
.
.
.
.
.
.
.
.
.
.
.
.
.
.
.
.
.
.
.
.
.
.
.
.
.
.
.
.
.
.
.
.
.
.
.
.
.
.
.
.
.
.
.
.
.
.
.
.
.
.
.
.
.
.
.
.
.
.
.
.
.
.
.
.
.
.
.
.
.
.
.
.
.
.
.
.
.
.
.
.
.
.
.
.
.
.
.
.
.
.
.
.
.
.
.
.
.
.
.
.
.
.
.
.
.
.
.
.
.
.
.
.
.
.
.
.
.
.
.
.
.
.
.
.
.
.
.
.
.
.
.
.
.
.
.
.
.
.
.
.
.
.
.
.
.
.
.
.
.
.
.
.
38
.
.
.
.
.
.
.
.
.
.
.
.
.
.
.
.
.
.
.
.
.
.
.
.
.
41
41
42
45
45
47
50
51
51
57
57
59
60
61
62
63
70
72
72
73
79
79
80
80
81
83
.
.
.
.
.
.
.
.
.
.
85
85
86
86
89
93
94
95
95
96
102
6 Summary and outlook
107
Bibliography
113
List of Figures
I
List of Tables
III
iv
Chapter 1
Introduction
1.1
Objectives of this work
In the treatment of cancer proton therapy has been used for almost 60 years. By the
end of march 2013 more than 90000 patients have been treated with protons worldwide
since 1955 when the first patient was treated at the Lawrence Berkeley Laboratory in
California [PTCOG]. Over the last six years this number has almost doubled. Even
though the potential and physical advantages of proton beam therapy have been discovered long ago, the availability of proton therapy is still limited. Based on data from
2010, for each 10 million people 54 photon therapy rooms but only 7 proton therapy
treatment rooms are available in developed countries [Amaldi et al., 2010]. A controversial discussion is going on about the rational for proton therapy. The increased costs
compared to photon therapy together with the limited availability thereby counteract the
potential clinical benefit. The underlying question is:
"If the availability of proton therapy would be increased, would more patients profit
from proton therapy?"
We do not intend to answer this question in terms of clinical advantages in comparison to photon therapy. There are many publications dealing with that question and a
controversial debate is sparked ([Smith, 2009], [Hoppe et al., 2011], [Alonso-Basanta
et al., 2011], [Mohan and Bortfeld, 2011], [DeLaney, 2011], [Hill-Kayser et al., 2011],
[Merchant, 2013], [Combs et al., 2013]). However, we intend to answer the question of
how the availability of proton therapy could be increased and leave the more general
debate on the evidence of the superiority of proton therapy over photon therapy aside.
For some disease sites, patients do not receive and potentially benefit from proton
therapy because of the lack of availability, high costs and missing evidence of the superiority compared to photon therapy [Combs et al., 2013]. The increased costs and
dimensions of proton therapy devices are regarded as a main obstruction to the spread
of this therapy method ([DeLaney, 2011], [Hill-Kayser et al., 2011]).
1
Also, in the field of dose delivery techniques, efficient 3D spot scanning has been
proposed long ago [Lomax, 1999], however, only very few operating facilities worldwide
offer this - from a physical point of view - beneficial dose delivery method. Most proton
therapy offering sites employ passive beam delivery - meaning that the dose is delivered
by a broad proton beam whose energy and shape is modulated by absorbing material
within the beam’s path [Mohan and Bortfeld, 2011]. For active spot scanning, the field is
shaped by multiple pristine proton spots, that can be influenced in their energy, position
and weight on an individual basis. Therefore, this technique offers increased flexibility
and thus better dose conformation to the target. However, still technical challenges as
well as high sensitivity that comes along with the precise dose shaping hamper this
sophisticated delivery method on its way into clinical routine.
Researchers worldwide pursue different approaches to overcome these problems.
One trend is the development of relatively small and more cost-effective proton therapy
accelerators. Part of this development is to reduce the size and costs of common accelerators used for proton therapy, as they are cyclotrons and synchrotrons ([MEVION],
[Schippers and Lomax, 2011], [Schillo et al., 2001], [Klein et al., 2005], [IBA], [Picardi
et al., 1994], [Protom International]). For synchrotrons, also the improvement of beam
acceleration and extraction time scales with respect to dose delivery is studied to make
treatment more efficient ([Peggs, S and Barton, D, 2002], [Iwata et al., 2010]).
Beside the improvement of existing technologies, also new acceleration concepts
are studied. One interesting approach is based on laser induced charged particle acceleration ([Wilks et al., 2001], [Schippers and Lomax, 2011], [Robinson et al., 2008]).
A high power laser induces the formation of a strong electric field capable to accelerate
protons. To date, laser acceleration of protons is still subject to research. Many challenges have to be overcome and the costs for the required high-power lasers must be
reduced to make this accelerator type usable for therapeutic application.
Another emerging accelerator type is the "Dielectric Wall Accelerator" (DWA) [Sampayan et al., 1998]. An electromagnetic wave travels through a tube surrounded by
alternating conducting and insulating wall material. While the electromagnetic wave
moves along the tube an electric field is induced, which can accelerate protons. These
accelerators offer high gradients and reduction of size. However, still technical challenges with regard to the required energy for therapeutic use has still to be overcome.
All of these new accelerating techniques, that are described in more detail in section
2.2, are fascinating and might be of relevance for clinical proton therapy. However,
they are still subject to research and may need a longer time until all obstructions are
diminished and the way into clinical practice is cleared.
In this work we try to answer the question how the availability of proton therapy
can be increased in a time scale less than ten years. We present a novel compact
linear accelerator for protons with a footprint of about two photon linac vaults - named
"TULIP" - TUrning LInac for Proton therapy [Amaldi et al., 2008]. It can be installed as a
single room proton therapy facility in already existing medical centers. Furthermore, this
2
unique device offers an improved time scale for radiation treatments with protons with
active 3D spot scanning. Due to the beneficial pulse structure and linac design energy
and weight modulation are feasible on a pulse-by-pulse basis. With that, this accelerator
offers advantageous characteristics for treatment of moving tumors with rescanning
and beam tracking. This work, however, is not dedicated to a detailed description of
the accelerator design, but rather to the dose delivery achievable with this new device.
We have developed a dose delivery and calculation algorithm for TULIP specific dose
calculation (TuDoCa). Since software development was one major part of this thesis,
one section is dedicated to the evaluation of TuDoCa (4.1). Using this software tool, we
have simulated time dependent and static dose delivery with TULIP for static tumors to
investigate whether active proton dose delivery with TULIP for common tumor sites is
feasible. This is described in section 4.2.
In chapter 5 dose delivery to moving tumors with TULIP is described. To exploit the
effects of TULIP beam characteristics for irradiation of moving targets, dose delivery
simulation was performed for lung and liver tumors. Rescanning of the moving tumor
volume represents one promising motion mitigation technique for active spot scanning
dose delivery. However, the time structure achievable with common accelerators is often
an obstruction to this method. With TULIP and its fast flexibility of beam modulation
we envisage to improve the dose delivery for rescanning in terms of irradiation time.
Moreover, for further investigations we can also think of beam tracking of the moving
tumor combined with rescanning to average out residual dose disturbances. The effect
of TULIP specific characteristics on rescanning dose delivery is also studied in chapter
5.
3
Chapter 2
Proton Therapy
Proton therapy has its origin in the discovery of the Bragg Peak in 1904 [Bragg, 1904].
Wilson then discovered that protons loose the majority of their incidental energy at the
end of their range when traveling through matter. Based on these findings protons
where first used for patient treatment in 1954 [Tobias et al., 1958]. Until the end of
march 2013 93895 patients have been treated with protons since then [PTCOG]. 42
operating treatment sites exist to date all over the world. The physical properties of protons when penetrating matter make proton therapy an appealing way to treat cancer.
Emerging state-of-the-art techniques such as spot scanning give raise to further improvement. New concepts of proton acceleration and beam line designs propagate the
spreading of proton therapy. In this chapter the fundamentals of proton therapy physics
are explained.
2.1
Basic physical properties of protons
In contrast to photons, particles such as protons and heavier ions are not absorbed
when they travel through matter. They are slowed down and stopped. The unique energy loss at the end of their path in matter is commonly known as the Bragg Peak,
visualized in figure 2.1.1. While protons traverse matter they can either interact with
atomic electrons or the nuclei. Most relevant for the energy loss of the protons is electromagnetic interaction with electrons while scattering of the protons is mainly due to
elastic scattering off the atomic nuclei. Other effects, such as inelastic nuclear reactions
or inelastic scattering off the atomic electrons are of minor importance for energies used
for proton therapy (70 MeV - 250 MeV).
also referred to as stopping power
The predominant energy loss of protons dE
dx
5
Figure 2.1.1: Schematic drawing of depth dose curves for protons and
Carbon ions. The characteristic low entrance dose and a steep dose
fall-off at the end of their path for protons and Carbon ions can be seen.
(taken from [Multimedia DVD, 2007])
S(E) in a medium can be described by the Bethe-Bloch-formula
dE
δ
Z z2
2me c2 β 2
C
2 2
2
S(E) = −
= 4πre c NA
ρe ln
−β − −
dx
A β2
Iexc (1 − β 2 )
Z
2
(2.1.1)
with re the classical radius of the electron, me the mass of an electron, c the velocity of light, NA the Avogadro constant, Z the charge of the target atom, A the mass
of the target atom, z the projectile charge, β the particle velocity, I the mean excitais the shell correction taking
tion energy. The last two terms are correction terms. C
Z
into account that the atomic electrons are not stationary and gets relevant at particle
energies smaller than the orbital electron velocity. The density correction 2δ refers to
the dielectric polarization of media which changes the electric field interacting with the
projectile. This effect becomes important for kinetic energies higher than me c2 which
is out of range for therapeutic applications. Given the stopping power of the transversing particles their range in matter R(E) is also a function of the initial energy E . The
average path length can be derived by the Continuous Slowing Down Approximation
(CSDA). There the range of a particle is defined as the path length where the mean
particle energy is zero.
Z
RCSDA (E) =
0
6
E
dE 0
1
S(E 0 )
(2.1.2)
A simplified version is known as the Bragg-Kleeman rule:
RCSDA (E) = AE p
(2.1.3)
where p has been determined to p ≈ 1.7 - 1.8 and A = 0.0022 cm/MeVp . However, the
scattering of a bunch of particles underlies statistical fluctuations resulting in variance of
energies and ranges. The so called range straggling increases with increasing particle
energy. Thus, the Bragg Peak gets broader with increasing energy of the incoming
particles. For a large number of interactions a Gaussian shaped probability distribution
¯ the mean energy loss and σ the standard deviation can be
of energy loss ∆ with ∆
assumed [Leo, 1994]
f (∆) ∝ exp
¯ 2
−(∆ − ∆)
2σ 2
,
(2.1.4)
Z
where σ depends on the path length, the density and the fraction A
of the material with
atomic number Z and mass A.
The lateral distribution of a bunch of particles traveling through matter is mainly
influenced by multiple elastic Coulomb scattering. The particles are scattered by the
electric field of the target nuclei causing a deflection of the particles off their path. Neglecting spin effects and screening, this deflection can be described by the Rutherford
cross section for target nuclei with charge Z , projectiles with charge z and initial energy
E and is peaked towards small angles θ.
dσ
=
dΩ
zZe2
E
2
1
4 sin (θ/2)
4
(2.1.5)
The effect of many small angle deflections is called multi Coulomb scattering (MCS)
and was described by Moliere’s Theory formalism ([Molière, 1948], [Bethe, 1953]). The
deflection, thus the width, scales with the penetration depth in matter. Hence, particles
with small initial energies and shorter ranges will result in sharper Bragg peaks than
particles with higher initial energies. In practice Moliere’s theory can be approached by
a Gaussian function for the lateral distribution of the fluence
1
r2
1
exp − 2
,
L(z, r, E0 ) =
2πσ 2 (z, E0 )
2 σ (z, E0 )
(2.1.6)
where E0 is the initial energy of the particles and r the lateral distance. σ(z, E0 ) is the
width, that increases with increasing depth z and consists of two components
2
σ 2 (z, E0 ) = σ02 (E0 ) + σM
CS (z, E0 )
(2.1.7)
where the first term describes the machine dependent lateral width of the beam caused
by deflections within the treatment machine’s nozzle and the second component refers
to the multi Coulomb scattering (MCS) in the traversed matter [Schlegel, 2001].
7
For treatment of tumors in radiation therapy the most relevant quantity is the absorbed dose inducing cell death. Dose in tissue is defined as the absorbed energy per
unit mass measured in Gy.
D=
dE J
= Gy
dm kg
(2.1.8)
According to Hong et al. [1996] the three dimensional distribution of dose D(r) can be
calculated by the product of the depth dose curve along the central ray Dcax (z, E0 )
and the lateral dose fall-off L(z, r, E0 ) due to spreading of the beam
D(z, r, E0 ) = Dcax (z, E0 ) · L(z, r, E0 )
(2.1.9)
Besides their physical characteristics protons and heavier ions show also biological
properties different from photons. To account for the biological effects of different particles the Relative Biological Effectiveness (RBE) is defined as
RBE =
Dref
|isoef f ect ,
Dp
(2.1.10)
with the biologically isoeffective doses Dref and Dp for a reference photon source such
as 60 Co and for a particle species p, respectively. The biologically equivalent dose thus
is defined as
ED = Dp · RBE.
(2.1.11)
The RBE depends on the dose, the particle type, the biological system and the Linear
Energy Transfer (LET), which characterizes the energy transferred per unit path length.
Even though it is known nowadays that the RBE is not a constant quantity, in stateof-the-art radiation therapy the RBE for protons is assumed to have a constant value
of 1.1. For heavier particles such as carbon ions, the RBE shows a large variation.
Therefore, biological models such as the Local Effect Model (LEM) have already been
developed at Gesellschaft für Schwerionenforschung (GSI) [Scholz and Kraft, 1996],
[Scholz and Kraft, 1994] and a semi-empirical model at the National Institute of Radioloigical Sciences (NIRS) ([Kanai et al., 1999], [Kanai et al., 2006]).
2.2
Proton acceleration
This section summarizes proton accelerator techniques currently applied in hadrontherapy such as cyclotrons (2.2.1) and synchrotrons (2.2.2) as well as recent developments
for these techniques. Novel accelerator techniques that are still subject to research and
not used in clinical application are introduced in 2.3. An overview on rather new accelerating methods such as laser induced particle acceleration (2.3.1) and dielectric wall
accelerators (2.3.2) is given. Although linear acceleration of charged particles is a well
known acceleration concept, it is still subject to further developments and applications
8
in radiation therapy. Along the historical chain of developments of compact linear proton
accelerators the reader is introduced to the field of linear particle accelerators (2.3.3).
2.2.1
Cyclotrons
A cyclotron as illustrated in figure 2.2.1, consists of two dipole magnets and two Dshaped electrodes with a radiofrequency (RF) generator generating an alternating electrical field between the D electrodes and a particle source in the middle. The dipole
induced constant magnet field perpendicular to the electric field deflects the particles
onto a spiral path. While the particles pass the electric field between the D-electrodes
they are accelerated. With increasing energy the radius of their path increases.
For a circular orbit caused by the deflecting magnetic field B the magnetic force
(also called Lorentz force) for a particle with mass m is equal to the centripetal force
mv 2
= Bqv
r
(2.2.1)
with r the radius and particle charge q and its velocity v . Thus the time required for
one circle (2πr ) is independent of the radius
Tcirc =
2πm
.
BQ
(2.2.2)
However, when particles approach the speed of light c the mass increases as a function
of their speed v
m0
m= p
,
1 − ( vc )2
(2.2.3)
with the rest mass m0 of the particle.
Since the circular velocity is given by v = ωr with ω being the angular frequency,
the circulation time increases with increasing radius. Additionally, for very strong magnetic fields a decrease of the magnetic field with increasing radius can be observed.
This also leads to an increase of the circulation time with the radius. In oder to compensate for these effects one can either vary the alteration frequency of the electric field
or the magnetic field. Decrease of the frequency of the RF field with increasing radius
is realized in a synchro-cyclotron allowing for strong magnetic fields and a reduction of
the cyclotron in size. However, a synchro-cyclotron does no longer deliver a continuous
particle beam.
The alternative method of increasing B with increasing radius is called isochronous
cyclotron. This can be realized by an azimuthally varying magnetic field keeping the
particles on their path. Cyclotrons with a diameter of 3.5 m to 5 m are commonly
used for lighter particles such as protons in radiation therapy up to now [Paganetti,
2012]. For heavier particles more sophisticated solutions must be developed to match
the requirements with regard to space and weight.
9
Figure 2.2.1: Schematic drawing of a cyclotron. A proton source is
positioned in the middle between two D-shaped electrodes. Due to a
magnetic field perpendicular to the electric fields, protons travel on a
spiral path and are accelerated each time they pass the gap between
the electrodes.
For all types of cyclotrons energy variation, which is crucial in particle therapy, can
only be realized by the use of degraders which comes along with an activation of the
degrader material and the necessity of shielding. One advantage of cyclotrons is the
continuous available beam and the energy variation within 50 - 100 ms by moving absorbers in the beam’s path [Amaldi et al., 2010].
Newer developments focus on the reduction of size by using superconducting magnets. A 30 MeV cyclotron mounted on a gantry for neutron therapy has been built first by
[Maughan et al., 1994]. Varian (former ACCEL) [Varian Medical Systems] together with
Paul Scherrer Institute (PSI) have designed and constructed the first superconducting
cyclotron reaching energies up to 250 MeV for proton therapy. It employs a 3.8 T magnet which leads to an overall diameter of 3.5 m and a weight of approximately 100 tons
[Schippers and Lomax, 2011], [Schillo et al., 2001], [Klein et al., 2005]. MEVION medical systems (former Still Rivers) [MEVION] has built a superconducting synchrotron of
1.8 m diameter as shown in figure 2.2.2 operating at a 10 T magnetic field [Mevion Medical Systems, 2012]. Energy variation and beam shaping is realized through degraders,
modulators and collimators that are potential source of additional dose due to activation
processes. IBA has also developed a single room proton therapy solution called "ProteusOne" [IBA]. Here the synchro-cyclotron is positioned on the ground while the beam
is bent on a gantry around the patient. Even though up to date all operating sites using
carbon ions are synchrotron based, a compact superconducting cyclotron for carbon,
helium ions and protons has been proposed [Jongen et al., 2010].
10
Figure 2.2.2: Design of a single room proton therapy system by Mevion
[MEVION]: MEVION S250. The superconducting cyclotron is mounted
on a gantry.
2.2.2
Synchrotrons
In synchrotrons particles are kept on a constant circular radius by increasing the electric
and magnetic fields as the particles gain energy. Similar to a cyclotron, in synchrotrons
particles are accelerated by passing the accelerating sections multiple times on a circular path as visualized in figure 2.2.3. A bunch of particles that originates from a source
is pre-accelerated and then injected into the accelerator ring where the particles are accelerated and deflected on a circular orbit. Dipole magnets keep the particles on their
path while quadrupole magnets are required for focusing of the beam. The Coulomb
force of an alternating electric field accelerates the particles in multiple accelerating
sections in about one million of cycles. With synchrotrons, higher energies are achievable than with cyclotrons. The energy of the particles can be varied without the use
of degraders just by extracting the particles after the required number of turns. This
avoids the harmful effect of activation of a degrader that can occur in cyclotrons. Once
the bunch of particles with the required energy is extracted, the synchrotron has to be
refilled to accelerate another bunch of particles. The time consuming energy variation
(several seconds) is one major drawback for application of synchrotrons in radiation
therapy especially for moving tumors. The overall irradiation time is increased which
is crucial for radiation therapy for moving organs with motion management techniques
such as rescanning and gating (2.5.3.2). These techniques elongate the treatment time
on principle. Unfavorable beam time structures as for non-continuous beams produced
11
by synchrotrons with long energy variation time compromise the treatment time even
more.
While synchrotrons for protons are about 6 m in diameter, for carbon ions they are
even larger (25 m). The size and costs of conventional synchrotrons are major limitations to the widespread use of synchrotrons for large proton therapy centers compared
to photon therapy. For carbon ions, synchrotrons are the only accelerator type in use
for medical purposes up to day while for protons other accelerating techniques, such as
the cyclotron and the techniques described in the following sections, are employed, too.
bending
magnet
focusing
magnet
extraction magnet
injection magnet
accelerating
section
proton
-
+
~
Figure 2.2.3: Schematic drawing of a synchrotron. Charged particles
are injected into a ring structure with several accelerating units and magnets for bending and focusing of the beam. While the particles travel on
an circular orbit, the accelerating units are passed multiple times before
the particles are extracted.
More recent developments focus on the design of smaller synchrotrons or improved
time scales of the beam acceleration and extraction. A rapid cycling synchrotron with
an increased repetition rate of 30 Hz has been proposed in 2002 [Peggs, S and Barton,
D, 2002]. There, all protons accelerated to the required energy are extracted at once.
Alternative and more efficient energy selection patterns are investigated [Iwata et al.,
12
2010], where the beam is accelerated to its maximum energy and then stepwise decelerated. Extended flattops provide the possibility to extract particles at various energies
at a single synchrotron cycle. Also, smaller synchrotrons for protons of a diameter of
2.1 m and energies up to 200 MeV have been studied by TERA [Picardi et al., 1994].
ProTom together with MIT-Bates Linear Accelerator Center has proposed a compact
synchrotron accelerating protons up to 330 MeV for 3D beam scanning [Protom International]. According to Protom, this device should fit into two conventional linac rooms.
2.2.3
Fixed Field Alternating Gradient accelerators (FFAGs)
For several years the use of FFAGs in particle therapy has been studied. FFAGs combine a fixed magnetic field with varying frequency of a synchro-cyclotron with alternating
gradients along the beam line as used in synchrotrons. Thus, the accelerator provides
a continuous beam with strong focusing. The bending magnet is split up into sector
magnets that are arranged in triplets with opposed alternating bending directions. Two
different basic designs are studied: in scaling FFAGs the magnetic field of the bending
magnets increases with the radius of the orbits of the accelerated particles. Thus, with
increasing particle energy the orbit moves outwards while keeping the same shape. In
non-scaling FFAGs orbits do not keep the same shape with increasing radius. That
makes the extraction at different energies even more complex because all beams have
to be guided through the same transport system with limited momentum acceptance
[Amaldi et al., 2010], [Fourrier et al., 2008]. The non-scaling FFAGs are smaller in
size, however, the magnet design and the alternating high magnetic fields make the
construction and operation challenging [Paganetti, 2012]. Of interest in application in
radiation therapy is the possibility for fast energy and intensity variation due to higher
repetition rates as used in synchrotrons. However, scaling FFAGs with a radius of 7-8
m are nor small nor light (weight of 150-200 tons)- moreover, both types need an injector accelerating particles to several MeVs before entering the FFAGs [Paganetti, 2012],
which enlarges the accelerating system further.
2.3
2.3.1
Novel accelerator techniques
Laser induced acceleration of protons
A promising compact and cost-effective alternative to synchroton and cyclotron based
methods is the laser-driven acceleration of charged particles. A compact laser accelerator could, in principle, be installed in normal rooms and possibly, require less shielding
than cyclotrons and synchrotrons.
Up to now, the most commonly studied technique is the Target Normal Sheath Acceleration (TNSA) [Wilks et al., 2001], [Schippers and Lomax, 2011]. A high-intensity
13
W
laser (Ilaser ≥ 1018 cm
2 ) is focused on a thin solid target with its front side saturated
with hydrogen. Within the focal spot of the laser on the target material a plasma is generated. The interaction of the laser with the plasma results in heating of the electrons
traveling to the rear side of the target and build up a strong electric field in the order
of TmV . The atoms of the target foil are ionized and protons from the front side of the
target are then accelerated out of the rear end due to the strong electric field as shown
in figure 2.3.1. With this method, protons as well as ions can be accelerated to high
energies. However, the accelerated particles are not monoenergetic and cannot be directly used for radiotherapy. Therefore, energy selection systems have to be installed
to select the particles with the required energy. In order to avoid the inefficient effect
of particle loss the use of broader beams within certain parts of the target volume is
investigated [Schell and Wilkens, 2012].
Another method of laser-driven particle acceleration is Radiation Pressure Acceleration (RPA) [Robinson et al., 2008]. The laser is focused on a very thin target foil (≤
100 nm) which is then accelerated as a plasma slab. Advantages of this method are
higher resulting energies of the particles and less energy spread [Paganetti, 2012].
Figure 2.3.1: The laser light induces a plasma within the target foil.
Electrons (blue) penetrate to the rear end. The resulting electric field
ionizes the atoms within the foil and protons are accelerated out of the
foil. Adapted from [Schippers and Lomax, 2011].
Today, high-power lasers as required for radiation therapy use with protons are very
bulky and costly. This is one of the reasons for which laser induced proton acceleration
for proton therapy, as actively pursued by many research groups, has still to face these
and other challenges. Therefore, one cannot expect to have a clinically applicable and
competitive solution in less then ten years.
14
2.3.2
Dielectric wall accelerator
In 1998 a new technique of proton acceleration has been patented by a developer
group at Lawrence Livermore National Laboratory (LLNL) [Sampayan et al., 1998]. In
Dielectric Wall Accelerators (DWAs) an electromagnetic wave travels through a tube
surrounded by dielectric material as shown in figure 2.3.2. The electromagnetic wave
is generated by an external source switched on and off rapidly inducing very short (ns)
current pulses. While the electromagnetic wave travels through the tube, an electric
field is generated which accelerates the protons. In order to reduce the size very high
gradients are required. In High Gradient Insulators (HGIs) layers of alternating insulating and conductive material are stacked and form the inner wall of the accelerator tube.
The so called Blumeline transmission lines - which are very rapidly switched by the laser
pulses illuminating the photoconductive switches shown in figure 2.3.2 - produce very
intense electric fields between two successive metal electrodes of the HGI. By that an
electromagnetic wave is propagated through the transmission lines. [Caporaso, 2011].
The interruption of insulators by conductive material prevents the generation of electron avalanches and breakdowns since the electrons are repelled from the insulators
[Caporaso et al., 2009]. The major advantage of HGIs is that the achievable accelerating electric field can be increased while keeping the size of the accelerator small.
Compared to normal induction cavities where the field is limited to 20 MV/m, the accelerating field achieved with HGIs is up to 100 MV/m for a nanoseconds-pulse [Caporaso
et al., 2008]. According to Alonso [2011] an accelerating field of 100 MV/m would result
in a proton DWA of about 2 m length.
After cooperation of LLNL with Tomo Therapy in 2007, CPAC (Compact Particle
Accelerator Corporation) [CPAC, 2013] as a Tomo Therapy spin-off took over responsibility for the commercialization of the DWA. There are still many technical challenges to
overcome on the way to development of the DWA for clinical application. In 2012 CPAC
reported successful operation of the DWA prototype with a 20 MeV/m gradient. For
2013 an upgrade to 35 MeV/m was claimed. CPAC announces the first clinical system,
which should fit into two conventional electron linac rooms and is supposed to reach
energies from 50 MeV to 150 MeV. In contrast to the very early concepts for clinical
use, in this concept no gantry mounting of the DWA is foreseen. However, 3D beam
scanning with a fixed beam will be feasible and an upgrade of the maximum energy to
215 MeV is forecasted [CPAC, 2013].
2.3.3
Linear particle accelerator
The principle of radiofrequency linear acceleration of particles is far away of being new.
However, the acceleration of charged particles heavier than electrons for radiation therapy treatment is challenging, since the accelerator size increases for heavier particles,
where larger electric gradients are required, resulting in much longer accelerators than
15
Figure 2.3.2: Schematic drawing of a dielectric wall accelerator (DWA)
taken from [S&T Review, 2011], Lawrence Livermore National Laboratory (LLNL). Protons are injected into a tube lined with high gradient
insulators (HGIs) and are accelerated by an electric field generated by
rapidly alternating voltage. A laser delivers power to the switches in the
Blumleins
16
the ones used in X-ray therapy. With the idea of reducing the size of particle linacs
for radiation therapy applications, these accelerators came also into the focus of research again. In principle, linear accelerators (linacs) accelerate particles through a RF
controlled alternating electric field between subsequent cylindrical electrodes (cavities).
Due to the increasing velocity of the particles the electrodes must be increased in length
to ensure particle acceleration within the next gap. A long time ago, linear accelerators
for protons were investigated for treatment of eyes [Lennox, 1989], where the required
energy is below 70 MeV. In following approaches linear accelerators aimed to accelerate particles to higher energies required for radiation therapy treatment. In 1991, Hamm
et al. [Hamm et al., 1991] proposed the first side coupled linac (SCL) operating at 3 GHz
which accelerates protons from 70 MeV to 250 MeV. In later approaches proton linacs
were also designed to boost particles pre-accelerated by a cyclotron to radiation therapy relevant energies [Amaldi et al., 2009]. In 1993, TERA foundation (Fondazione per
Adroterapia Oncologica) proposed a cyclinac - a novel concept of compact proton accelerators [Amaldi, U. and Grandolfo, M. and Picardi, L., 1996]. A cyclinac as shown in
figure 2.3.3 consists of a high frequency linear accelerator working at a high repetition
rate and serving as a booster of a cyclotron. The high frequency ensures compactness
of the accelerator even if today one knows that the old Kilpatrick scaling law, which
stated that the accelerating electric field scales with the square root of the frequency
1
(E ∝ f 2 ) [Kilpatrick, 1957] is not applicable any more. The many experiments performed in connection with the development of future electron-positron colliders have
brought to better models, in particular the "power flow model" [Grudiev et al., 2009] and
the "defect model" [Nordlund and Djurabekova, 2012]. However, it is certainly true, that
with increasing electric fields, the length of the accelerator can be decreased to reach
the same output energy. The first design was introduced in 1998 and named LIBO
(LInac BOoster ). A prototype of LIBO which is one module of the full linac consisting of
nine modules has been constructed and tested. One module comprises 4 tanks with a
number of cavities. Operating at 3 GHz a gradient of 28.5 MV/m per tank was reached
[Amaldi et al., 2004]. The first TERA linac was designed to accelerate protons from
60 MeV to 200 MeV and would consist of nine of such modules on a total length of 15
m. The modules of the accelerator are powered by individual klystrons that make the
energy variation of the beam flexible and fast.
2.4
2.4.1
Dose delivery and treatment planning with proton
beams
Introduction
The goal of radiation therapy is to destroy malignant tumour cells by radiation induced
damage while sparing healthy surrounding tissue. In order to precisely shape the pro17
Figure 2.3.3: Schematic drawing of the 1993 cyclinac proposal (taken
from [Amaldi et al., 2009]). A commercial 30 MeV cyclotron is used as
an injector to a high frequency linac.
ton beam to match the tumour contours, different delivery and treatment planning techniques are used.
Depending on the applied accelerating method basically two different methods for
proton beam delivery are available - passive and active proton beam delivery. In passive proton beam delivery the beam is modulated in lateral and longitudinal direction
by the use of scattering and range-shifting material positioned in the beam path. Active scanning uses a magnetic deflection system to move the beam laterally across the
target volume while the energy is varied actively by the accelerator. Both methods are
applied in currently operating proton therapy facilities, however, the majority of them is
using passive beam delivery even though the physical advantages of active beam scanning are predominate. In the following both methods are described and compared. In
section 2.4.2 different delivery strategies for proton therapy are summarized. Sections
2.4.3 and 2.4.4 introduce the reader into the fundamentals of treatment planning.
2.4.2
Dose delivery methods for proton beams
Currently, two different methods are applied in proton therapy - active and passive beam
delivery.
In passive beam delivery as visualized in figure 2.4.1, the beam is modulated
through the use of absorbers, degraders and compensators put into the beam’s path
[Chu et al., 1993]. Particles are accelerated to their maximum energy and decelerated
by the loss of energy in a degrader material. Since the entire target volume has to be
covered with dose the beam is spread out by overlaying narrow Bragg peaks of different energies. The beam first passes through scattering foils where multiple Coulomb
scattering spreads the beam in the transversal plane. Subsequently, a rotating wheel
18
of variable thickness along its circumference within the beam’s paths decelerates the
beam depending on the absorber thickness at the point of interaction. The resulting
Spread Out Bragg Peak (SOBP) is laterally conformed to the target’s shape by patient
specific compensators ("boluses") and collimators; in modern radiation therapy also
movable collimators (called "multileaf collimators") are used. Obviously, the amount of
material provides a potential source of secondary radiation due to interaction processes
within the materials. The proton field shaped by the compensators and degrader is uniform [Goitein et al., 2002]. By the use of compensators energy modulation can only
be performed on the beam’s cross section which is supposed to match the projection
of the tumor cross section in the beam direction. Therefore, density changes, i.e. due
to tumor movement, that cannot be taken into account by the compensator, can lead
to additional dose to healthy tissue. [Schippers and Lomax, 2011]. Also, the energy
variation and lateral shaping of the beam through scattering comes along with a significant particle loss [van Goethem et al., 2009]. However, there are reasons why up
to now passive beam delivery is the most widely spread delivery technique. Since the
entire target is treated with one modulated spread out bragg peak at the same time the
method is less sensitive to organ movement. Since passive beam delivery does not
depend on a continuous beam, another advantage is that it can be used for all currently
used accelerator systems in radiation therapy [Schippers, 2009].
Figure 2.4.1: Passive beam delivery. Scattering foils spread the beam
which is shaped by collimators and a compensator to match the target.
A range shifter modifies the energy (range) of the particles.
In active beam scanning, the beam is laterally scanned across the target by a
magnetic deflection system as shown in figure 2.4.2. For active energy variation the target is divided in isoenergy slices. The particles are accelerated to the required energy
by the accelerator and the scanning system moves the beam through one isoenergy
19
slice. Once it is covered with spots the energy is changed to match the next isoenergy
slice and the lateral scanning starts again. This procedure is repeated until all isoenergy slices are supplied with dose. This method can be applied for synchrotrons where
the energy can be varied for every spill or also for cyclotrons using range shifter plates
positioned upstream the patient surface within the beam’s path. Using active beam
scanning, two methods are applied nowadays: spot-scanning which has been developed at Paul-Scherrer-Institute (PSI) [Pedroni et al., 1995] where the beam is switched
off while it moves to the next spot and raster-scanning developed at Gesellschaft für
Schwerionenforschung (GSI) [Haberer et al., 1993] where the beam is on while continuously moving to the next spot. Newer methods such as continuous scanning where
the beam is swept along a trajectory through a transversal plane while the intensity is
varied, are currently investigated at PSI [Pedroni et al., 2004]. With 3D spot-scanning,
full intensity modulated proton therapy (IMPT) is feasible [Lomax, 1999] meaning that
the intensity of each single spot can be optimized so that the highest flexibility is achievable. The individual modulation of each spot allows for sophisticated delivery methods
such as Distal Edge Tracking (DET). In DET, only one or several rows of spots along the
lateral width of each slice are positioned at the rear end of the target. This reduces the
number of spots and irradiation time while delivering a highly conformal dose to the target as proven by Nill et al. [2004]. In all active scanning methods, since pristine Bragg
peaks with individual weights are delivered, the target can be shaped more precisely
than by passive shaping with compensators resulting in a better sparing of healthy tissue and a high target dose coverage [Oelfke and Bortfeld, 2003]. Since the amount of
material within the beam path can be drastically reduced compared to passive beam
delivery dose losses are small and activation of material reduced.
Since active beam delivery cannot provide a continuous beam with variable energy
on a timescale fast enough to avoid interference of beam and target motion, treatment of
moving tumors with active scanning is more challenging. Even though the very precise
shaping of the dose to a static target is one of the major advantages of active beam
scanning, it is one of the greatest challenges for treatment of moving tumors since the
sensitivity to organ motion is increased with active spot scanning. The problem of proton
beam irradiation in the presence of tumor motion is discussed in section 2.5.
2.4.3
Treatment planning
Treatment planning is usually based on a CT (Computed Tomography ) whose electron
densities, represented by hounsfield units (HUs), can be converted into stopping power.
In the planning process, the relevant target volumes are delineated in the CT. A physician prescribes the doses to the volumes of interest that, due to biological effects, most
commonly are delivered in several fractions. Following the guidelines given by the International Commission on Radiation Units and Measurements (ICRU) ([ ICRU report 50],
[ICRU report 62], [ ICRU report 78], [ICRU report 83]), the Gross Tumor Volume (GTV)
20
Figure 2.4.2: Active beam scanning. The beam is deflected by scanning
magnets. For each energy the beam scans through one isoenergy slice.
comprising the visible tumor volume is defined. The GTV is expanded to a Clinical Target Volume (CTV) including suspected microscopic spread of the cancer. Additionally,
setup-errors or motion induced geometric displacements are considered by the Planning Target Volume (PTV). In case of physiological motion and expected deformations
as for lung or liver tumors the Internal Target Volume (ITV) must be added to the CTV.
In addition to contouring of target volumes healthy tissue that might by affected by the
radiation is delineated as Organs At Risk (OARs). According to [ ICRU report 50], 100
% of the PTV volume should receive between 95 % and 107 % of the prescribed dose.
In order to reach that goal the most crucial step is the optimization of beam weights.
The degree of freedom differs depending on the delivery method applied. For passive
beam delivery, where a uniform dose is applied to the target, the particle fluence can
only be modulated by material in the beam’s path. However, for active beam delivery
methods such as spot-scanning each proton spot can be weighted by inverse planning
techniques. Since the Bragg peaks can be modulated in three dimensions, IMPT provides the highest flexibility of beam shaping. In the following, this work will concentrate
on active beam delivery. Hence, only the process of IMPT is described in detail in the
following section 2.4.4.
2.4.4
Treatment planning for proton beams
In treatment planning for proton therapy, the energy, position and the number of protons
delivered by each individual spot have to be determined. First, the spot positions for
each individual Bragg peak are defined. This is usually performed by raytracing [Siddon,
21
1985] of the treated volume where the radiological depths are determined from the
conversion of the HUs of the planning CTs into stopping power values. According to
equation 2.1.2 the radiological path length for a given geometrical depth can be derived
from the stopping power S(E).
E
Z
dE 0
rrad (E) =
0
1
S(E 0 )
(2.4.1)
In this work, the optimization of all treatment plans is based on the inhouse treatment planning system ’KonRad’ [Nill et al., 2004]. Dose calculations presented here
were either performed with KonRad or the dose calculation algorithm developed within
the scope of this work and described in 4.2. Both employ a pencil-beam algorithm in
which the dose is divided into a central axis contribution of the dose and a lateral part
according to equation 2.1.9. The central axis dose was measured for a broad proton
beam. The resolution of data points around the Bragg Peak is 1 mm from which the
dose value at the actual depth can be interpolated during dose calculation. The lateral
distribution L(z, lx,ij , ly,ij ) accounts for the lateral spread of the beam due to scattering within the accelerator head and Multiple Coulomb Scattering (MCS) within the
patient. For lateral distances of the central beam lx,ij and ly,ij for voxel i and spot j, and
radiological depth drad the lateral distribution is given by
1
e
L(drad , lx,ij , ly,ij ) = p
2πσx0 2 (drad )
l2
x,ij
02
2σx (drad )
1
q
e
2πσy0 2 (drad )
l2
y,ij
02
2σy (drad )
.
(2.4.2)
The σ is split into two parts:
0
σx (drad ) =
q
2
2
σx,0
+ σM
CS (x)
0
σy (drad ) =
q
2
2
σy,0
+ σM
CS (y),
(2.4.3)
where σx,0 accounts for lateral spread of the beam before entering the patient,
caused by scattering within the accelerator nozzle. σM CS (drad ) comprises the MCS
within the patient and is pre-calculated according to [Gottschalk et al., 1993].
The conversion of mass stopping power Sρ into radiological depth drad takes into
account density inhomogeneities according to equation 2.4.4.
Z
E
drad (E) =
dE
0
0
1
S(E 0 )
ρ
−1
(2.4.4)
To calculate the dose for a given voxel i di , the dose is stored in a dose influence
matrix Dij . Each element of the Dij -matrix stores the dose contribution for a given spot
j to a voxel j. The dose of all spots N is superimposed and weighted by the individual
spot weight wj .
di (d) =
N
X
j=1
22
Dij wj .
(2.4.5)
In IMPT, where inverse planning is applied, the optimal number of protons for each
beam spot is determined through an iterative optimization of a cost function characterizing the difference between the desired dose and the dose calculated at the current
step of the optimization. The performance of the dose optimization and dose calculation
steps of KonRad can be studied in more detail in the publication by Nill et al. [2004].
2.5
Treatment of moving organs with protons
With modern proton beam delivery techniques such as active beam scanning and IMPT
the physical advantages of proton beams could be fully exploited for the treatment of
static tumors [Lomax, 1999]. The increased accuracy of the delivery combined with the
physical behavior of protons when transversing through matter allows for improved target coverage of tumors while sparing surrounding healthy tissue. While active scanning
methods have the potential to better conform the dose to the target volume than passive
beam delivery for static targets, this holds no longer true in the presence of target motion. Due to the motion of the target and the beam it might occur that the tumor moves
partwise or completely out of the beam. Thus, the interfering beam and target motion
can lead to severe miss-dosage. Therefore, the application of active spot-scanning and
its increased accuracy are mainly applied for static targets up to now. However, many
organs are affected by organ motion. So far, only passive beam delivery where the
problem of motion can be handled by the use of margins covering the tumor in all motion states is used for treatment of moving tumors with particles. However, margins are
not fully exploiting the beneficial physical behavior of protons in matter. Margins are a
treatment planning concept commonly used in photon therapy that show an exponentially decreasing dose fall off with increasing depth in tissue. For protons and heavier
ions that loose their energy through direct ionization when traversing matter, margins
are used to account for setup errors and also in case of organ motion for passively
scattered particles. Also, misregistration of the range compensator and the patient, in
organs where density variations are particularly high as in the lung, are taken care of by
smearing through modifying the thickness of the compensator [Engelsman and Kooy,
2005].
In order to exploit the advantages of active beam delivery to moving tumors the
investigation of motion mitigation techniques as well as accelerator developments are
subjects of particular interest in particle therapy. In the following sections motion in
radiation therapy (2.5.1) and it’s consequences (2.5.2) to the dose distribution are described. Motion management strategies are introduced in 2.5.3.
23
2.5.1
Organ motion in radiation therapy
Organ motion within the patient’s body appears on various time scales and extents.
The motion and thus the tumor position can vary during the course of irradiation, between individual fractions (interfraction motion) and within the delivery of one fraction
(intrafraction motion) [Paganetti, 2012].
Motion appearing during the course of treatment is related to shrinkage or growth
of the tumor [Britton et al., 2007], weight loss or gain of the patient as well as bowel or
rectum filling. Also, different patient positions in different treatment sessions can cause
different organ positions. However, patient position related motion can be handled by
careful patient positioning and verification of the position in relation to the planning CT,
and thus will not be further discussed in this work.
Interfractional motion typically happens on a day-to-day level but can also appear
between hours or minutes. It often affects organs of the digestive tract or those close to
[Langen and Jones, 2001]. Different fillings of the bowel and rectum (or bladder) cause
the affected organs to change their shape and neighboring organs such as the prostate
to move [Fokdal et al., 2004]. Also shrinkage of the lung and variations in the breathing
amplitude or baseline drifts can occur from fraction to fraction [Sonke et al., 2008].
Intrafractional motion happens on a timescale smaller than the delivery time of
one fraction of the prescribed dose. Typical organs subject to intrafractional motion are
respiratory organs and organs close to the diaphragm such as the liver and the heart. A
large contribution to the movement of the abdomen is given by respiration. The largest
extent of motion due to respiration is observed in the superior-inferior (SI) direction
[Langen and Jones, 2001], [Seppenwoolde et al., 2002]. Due to the motion pattern of
the lung, organs attached to the diaphragm or close by experience the largest extent of
motion. Maximum peak-to-peak values up to 3 cm for lung motion in SI direction have
been found. However, the average amount of motion is below 1 cm [Paganetti, 2012].
In left-right (LR) and anterior-posterior (AP) direction motion is often less than a few
millimeters [Seppenwoolde et al., 2002]. Due to being positioned in the direct neighborhood of the diaphragm, the liver is also affected by breathing motion. The extent
of lung and liver motion has been summarized in detail by [Shirato et al., 2004]. They
reported peak to peak values of 19 mm in SI direction. Also the prostate underlays
variation of position due to spontaneous gas movements within the rectum. However,
intrafractional changes in the position of the prostate are typically below a few millimeters ([Stroom et al., 1999], [Kupelian et al., 2007]).
2.5.2
Consequences of organ motion for proton beam therapy
Even though protons and other particles allow to shape the dose precisely to the tumor, organ motion can seriously confine the advantages of this technique. Physiological organ motion can cause movement of the tumor and the surrounding tissue,
24
which can have debilitating effects on the dose distribution because the tumor might be
shifted partwise or completely outside the planned treatment field. The motion induced
anatomical changes lead to blurring and spatial deformation of the dose and are independent of the delivery method [Bortfeld et al., 2004]. This effect is not specific to proton
beams and can be dealt with by fractionated delivery of the dose and the application of
multiple fields [Bortfeld et al., 2004]. Additionally, the dose distribution can be harmed
by motion induced density changes and, in case of active scanning methods, the beam
motion can interfere with the target motion. Both effects are described in the following
sections 2.5.2.1 and 2.5.2.2.
2.5.2.1
Density changes
One of the reasons for the detrimental effects on the dose distribution are density
changes in the beam path due to organ movement. As explained in detail in section
2.1, the changes in the density influence the particles path length. While the impact of
density changes on the dose in photon therapy is rather small, in proton beam therapy it
gets more pronounced due to the Bragg peak and the finite range of particles in tissue.
For a single uniform field (SFUD) this effect is concentrated to the edges of the tumor
where the dose gradients are steepest. In IMPT where the individual fields might be
very different, density changes can also affect the dose in the middle of the tumor. In
a study by Mori et al. [2009] average range fluctuations up to 21.8 mm-WEPL (water
equivalent path length) in lung over an entire breathing cycle were reported. Severe
changes of path length in lung due to motion were also reported by Bert and Durante
[2011]. The consequences of range uncertainties with respect to dose for a lung tumor
were studied by Hui et al. [2008]. For the majority of cases studied they found a rather
minor reduction of target coverage while organs at risk were found to suffer from a 4 %
increase of the dose. Signifanct reduction of CTV dose as an effect of a combination
of a setup-error of 5 mm and a breathing amplitude of 10 mm was found by Engelsman
and Kooy [2005].
Currently, density effects are taken care of by the use of safety margins and by
smart treatment planning on 3DCTs. Furthermore, in 4D treatment planning, which
is based on a 4DCT and adaptation of planning parameters to the changes, motion
induced anatomical and resulting dose variation can be partially incorporated in the
treatment plan [Bert and Rietzel, 2007].
2.5.2.2
Interplay effects
Modern delivery techniques employing a moving proton beam such as active spotscanning can deliver a highly conformal dose distribution to a target volume. However,
this advantage is currently limited to static targets. For moving targets the motion of
the beam might interfere with the target motion and can cause unintended distortions of
25
the dose distribution. Active spot-scanning has been applied only in very few cases for
moving targets. Rinecker Proton Therapy Center (RPTC) treats thoracical and adominal
tumors using apneic oxygenation to mitigate breathing induced motion during treatment
with a scanning proton beam [Bert and Durante, 2011]. The Heidelberg Ion Therapy
center (HIT) recently reported treatment of patients suffering from hepatocellular carcinoma (HCC) using a vacuum pillow as patient immobilization and abdominal pressure.
One patient was treated with beam gating (2.5.3.2) [Habermehl et al., 2013]. Patients
for treatment of prostate cancer with protons and Carbon Ions are currently being recruited [Combs and Debus, 2013]. Interplay effects due to their nature can only occur
for non-static beam delivery where the time scale of beam and target motion can interfere. In active beam delivery systems one isoenergy slice can typically be scanned
within 100 - 300 ms, while the time to change the energy and fill the synchrotron with
particles is in the range of seconds (1 - 5 s). Since breathing with typical breathing
periods of 3 - 6 s happens on the same time scale, organs affected by breathing motion
can suffer from interplay effects.
The distortion of the dose resulting in an increased inhomogeneity of the dose is
caused by more or less overlapping adjacent spots due to the motion of the beam and
the target. This process is visualized in figure 2.5.1. Of course, this can result in severe
over- and underdosage of the target and organs at risk. While in the target cell-damage
can be insufficient, surrounding healthy tissue might suffer from an increased dose, thus
leading to increased risk of side effects of radiation therapy.
Phase 1
Phase 2
Phase 3
Phase 4
Phase 5
Figure 2.5.1: Schematic drawing of interplay effects. The target moves
while the beam is scanning through one isoenergy slice. While the tumor is in motion phase 1 the spots are correctly positioned as planned
(on phase 1) (grey). In a different phase the tumor might have moved
partwise out of the irradiation field resulting in hot (black) and cold
(white) spots. (adapted fromBert et al. [2008])
Interplay effects have now been studied for quite a long time [Bortfeld et al., 2004],
[Blattmann and Coray, 1990], [Lambert et al., 2005], [Bert et al., 2008], [Furukawa
et al., 2010], [Kraus et al., 2011], [Zenklusen et al., 2010], [Knopf et al., 2011]. Motion
parameters and their influence on the quality and magnitude of interplay effects have
also been investigated by several researchers. The majority of results showed a strong
26
impact of motion amplitude and/or baseline drifts on the dose homogeneity and target
coverage [Phillips et al., 1992], [Bert et al., 2008], [Kraus et al., 2011]. The study of
Bert et al. [2008] revealed also a strong correlation of the periodicity of motion and
initial phase of irradiation with the effects on the dose distribution. In this work, machine
specific parameters were also investigated. The lateral scan time was found to be a
relevant factor for interplay effects [Bert et al., 2008]. Furukawa et al. [2010] investigated
a fast scanning system for phase-controlled rescanning and gating and found dose
differences less than 2 % compared to a static delivery.
Interplay effects cannot be completely compensated by the use of margins [Lambert
et al., 2005]. In newer studies margins accounting for target motion and changes in the
radiological path length were found to generally improve the dose distribution compared
to the use of CTVs, though [Knopf et al., 2013]. Including the variations of radiological
path lengths only resulted in slight improvements of the target dose but increased dose
to healthy tissue. Therefore, other motion mitigation and management strategies to be
applied in addition to an adequate safety margin have to be further investigated. Details
on motion management are described in the following section 2.5.3.
2.5.3
Motion management
The accuracy of proton therapy is hampered by the inability to track the tumor during
dose delivery. Therefore, various methods have been developed to assess the tumor
motion. In section 2.5.3.1 a brief summary on existing motion monitoring methods is
given. For radiation therapy of moving tumors different methods to mitigate the motion
and strategies to deliver the dose have been developed. These are described in section
2.5.3.2.
2.5.3.1
Motion monitoring
Motion monitoring can be divided into direct measuring of the tumor position and measuring of a tumor motion surrogate. Direct motion monitoring systems include fluoroscopy, ultrasound and radiofrequency transponders implanted inside the tumor.
In fluoroscopy, which is basically a 2D x-ray image, the photon beam is attenuated
on its path through the patient’s body and detected by a fluoroscopic screen often available in a conventional treatment room. The position of a fiducial marker implanted in
or close to the tumor is detected [Shirato et al., 2003]. This method provides time resolved 2D position information and is often used in x-ray guided surgery. However, it
gives additional radiation to the patient and for 3D image acquisition even more than
one projection is required. Also the dose in the target can suffer from the implanted
makers in particle therapy [Jäkel, 2006]. This holds true for motion monitoring through
implanted sensor coils within an electromagnetic field studied by Seiler et al. [2000].
Electromagnetic transponders commercialized by Varian Medical Systems have been
27
proven for motion monitoring of the prostate ([Willoughby et al., 2006]) and are currently studied for their application in lung tumor motion detection [Shah et al., 2013].
Recently, the Calypso System is used at Roberts Proton Therapy Center (University of
Pennsylvania, USA) for pre-clinical studies [C ALYPSO M EDICAL , P RESS RELEASE]. For
lung tumors, however, the signal of the transponders does not measure the real tumor
position because the beacons are not directly implanted within the tumor tissue. Electromagnetic transponders can effectively measure the tumor or internal organ motion
without delivering of additional dose.
In the interest of sparing the patient from overdosage, also other non-ionizing imaging methods for motion detection are emerging. Magnetic Resonance Imaging (MRI)
within the treatment room has been proposed by Lagendijk et al. [2008] for photon irradiation. This is a promising, though challenging approach even for photon beams. For
proton beams the problem of beam deflection is not resolved yet. However, there are
endeavors to exploit the behavior of protons in matter in combination with a magnetic
field on a theoretical basis up to now. Whereas Raaymakers et al. [2008] found the
influence of a 0.5 T magnetic field on a proton beam to be minor, [Wolf and Bortfeld,
2012] calculated beam deflections greater than 1 cm depending on the initial energy.
Lattanzi et al. [1999] studied ultrasound for position acquisition of the prostate. In later
studies the accuracy of ultrasound for thoracical and abdominal motion detection was
assessed and found to be comparable to fluoroscopic accuracy [Harris et al., 2010].
Of course, time resolved Computed Tomography (4DCT) is also an option to acquire spatio-temporal information. However, similar to fluoroscopy, continuous motion
monitoring throughout the entire irradiation is not applied due to the additional dose
delivered to the patient. However, 4DCTs can provide important motion information for
treatment planning in case of periodic motion. In order to acquire a 4DCT the motion
cycle (i.e. breathing cycle) is divided into motion states. A surrogate motion detection
system triggers the acquisition of a CT scan over the motion cycle resulting in several
3DCTs correlated with the motion information along the motion trajectory. A 4DCT can
be used for delineation of the volumes of interest and margin assessment as indicated
in section 2.4.3.
Besides direct imaging methods, there is also the possibility to measure a surrogate
motion signal such as lung volume filling or motion of the chest wall instead. The main
drawback of this method is its dependency on the correlation of the surrogate motion
signal and the tumor motion. Due to its relatively easy applicability, this is currently used
in clinical practice. One method is putting a pressure belt around the patient’s torso to
measure the expansion of the thorax due to breathing. As described above this method
can be used for the acquisition of 4DCTs but also potentially for gated irradiation. The
commercialized version by Anzai Medical Co. LTD ’AZ-733V’ has been used for motion
acquisition for the cases reported within this work.
Surrogate motion monitoring based on an infrared signal for gated heavy ion therapy has also been investigated by [Minohara et al., 2000]. An infrared light emitting
28
diode is put onto the patient’s chest wall and its signal detected by a position resolved
detector. The signal is fed back to request beam from the accelerator as required for
gated irradiation. Another optical motion monitoring system was investigated by Baroni
et al. [2000]. Charged coupled device (CCD) cameras equipped with infrared light emitting diodes (LED) are positioned at the ceiling of the treatment room and send infrared
light flashes. These are detected by small electronic circuitries positioned on the patient’s surface to measure surface motion in real time. Furthermore, this method was
used for motion detection in combination with deep inspiration breath-hold technique
for stereotactic treatment of lung and liver tumors. Position reproducibility was below a
few millimeters for inter- and intra-breath-hold motion detection.
These, and other optical motion measurement systems are also often used in combination with ultrasound imaging to register the position in the treatment room [Yan et al.,
2002]. Other systems measure the contour with the laser in the treatment room on the
patient surface [Wilks and Bliss, 2002].
Furthermore, both - direct and indirect motion acquisition methods can be combined
to avoid their main disadvantages. Prediction models are used to determine the internal
target motion based on data acquired via training of the algorithm and triggered by external motion information. The Cyberknife Synchrony (Accuray, Sunnyvale, CA) already
uses such a model based approach of motion monitoring [Nioutsikou et al., 2008].
2.5.3.2
Motion mitigation and dose delivery strategies
One approach to overcome the motion induced detrimental effect on the dose distribution is to reduce the extent of motion. There are various methods to decrease the
magnitude of motion. In the following a brief overview on existing techniques is given.
Motion immobilization strategies
One way to reduce the abdominal motion amplitude is by putting a pressure plate onto
the patient’s abdomen during treatment. Due to the strong pressure the residual motion of the diaphragm is reduced. Negoro et al. [2001] studied the effectiveness of a
stereotactic body frame with an abdominal pressure plate applying pressure if the tumor motion exceeded 5 mm measured via fluoroscopy. The maximum motion amplitude
thereby reduced to almost half of its original extent. Even though the residual motion is
significantly reduced, one has to bear in mind that due to the device mounted around
and onto the patient, treatment planning can be harmed due to less available beam
directions. For organs affected by the motion of the digestive tract the magnitude of
motion can be limited by using gas or water filled rectum ballons [Smeenk et al., 2010].
This method is used for treatment of prostate cancer with photons as well as protons
[Bert and Durante, 2011]. Furthermore the position of organs close to the bladder or
29
rectum can be influenced by dietary protocols and controlled filling status of rectum and
bladder at the time point of treatment ([Mayahara et al., 2007], [Nihei et al., 2005]).
Breath-hold techniques
Another possibility to control breathing induced displacement of the tumor is by active breathing control and deep-inspiration breath hold (DIBH) [Hanley et al., 1999].
The patient breathes through a mouthpiece while the volume of air is measured. In
the latter approach the patient is triggered to hold breath while radiation is delivered.
The breath-hold elongates the time the tumor is in an almost stationary position and
radiation delivered. Of course, one can imagine, that especially pulmonary comprised
patients have difficulties to hold their breath. Hanley et al. [1999] reported that patients
were able to comfortably hold breath for up to 16 s. In active breathing control [Wong
et al., 1999] irradiation is triggered by preselected respiration levels measured through
controlled air volume during breathing. In addition, immobilization of the tumor through
jet-ventilation or even apnea is used. For proton therapy the later approach has already
been applied at RPTC.
Gating
In gating, which has already been installed in several particle therapy centers, the beam
is paused as long as the motion is outside a pre-defined motion window [Ohara et al.,
1989]. The gating can be phase or amplitude controlled, meaning that the tumor is either irradiated within a certain motion phase or if its displacement is within pre-defined
borders. For beam-on-time often the maximum exhale phase is chosen since it is considered to be best reproducible due to relatively small residual motion. Obviously, the
duty cycle of the beam is significantly reduced, thus the irradiation time increases.
Dose delivery with a scanning beam to a moving tumor still remains challenging
due to the interference of the scanning beam with the residual motion within the gating
window. However, HIT recently published data on the treatment of hepatocellular carcinoma (HCC) with respiratory gating combined with an ITV margin comprising the tumor
during the whole respiratory cycle [Habermehl et al., 2013]. To overcome the problem
of interfering beam and target motion, gating can be combined with other motion mitigation techniques such as margins, as in the referred patient case at HIT or rescanning
[Furukawa et al., 2010].
Rescanning
A different approach to handle intrafractional tumor motion during treatment with scanned
particles is rescanning, also referred to as repainting [Phillips et al., 1992]. Whereas
30
gating confines the motion to a pre-defined gating window and thereby reduces the
extent of motion, rescanning averages out local missdosages on the costs of small
dose deviations to a larger volume. Delivery of the entire prescribed dose in multiple
fractions has already an averaging effect on local dose discrepancies [Bortfeld et al.,
2002]. Also, delivering from multiple field directions was found to average out local
deviations of the dose [Knopf et al., 2011]. Since the statistical error of the dose in a
point decreases with the square root of fractions (rescans), additional fractionation of
the dose within one treatment session further reduces dose distortions and is referred
to as rescanning. However, since the dose averaging is a statistical process, an increased number of fractions does not necessarily lead to improved dose distributions.
Unfortunate combination of the beam delivery and target motion can harm the effectiveness of rescanning. Therefore, careful consideration of the scan speed and direction
with respect to the motion pattern is required. Rescanning can only average out local
misdosages if the motion and delivery patterns do not coincide for the different rescans.
Even though, in principle rescanning is independent from patient motion information,
for some delivery strategies motion acquisition might be required. In order to avoid the
effect of matching motion patterns from rescan to rescan Furukawa et al. [2007] proposed a method which aims at spreading of rescans to an entire breathing cycle. In a
later approach this so called phase-controlled rescanning was used in combination with
gating [Furukawa et al., 2010]. Thereby, the extraction rate of the synchrotron must be
adjusted to ensure delivery of one isoenergy slice within the duration of one gating window. The results of Furukawa et al. [2010] revealed that phase-controlled rescanning
in combination with gating has the potential to deliver a homogeneous dose distribution
with 2 % deviation from a statically delivered dose distribution. An alternative approach
to deal with detrimental timing patterns of subsequent rescans are random time delays between the individual rescans or random choice of energy slices for volumetric
rescanning as proposed by Seco et al. [2009].
There are various rescanning strategies that can be divided into volumetric and
non-volumetric methods. In non-volumetric rescanning each slice is rescanned until
the preselected number of rescans is reached, than the energy is changed and the procedure is repeated for the next isoenergy slice. In contrast to this, the entire volume is
scanned at each rescan in volumetric rescanning. Which method is used, depends on
the time structure of the applied delivery and thus on the accelerator technique used.
One can imagine that synchrotrons are not suited for volumetric rescanning due to large
energy change times within the range of a few seconds. However, researchers from HIMAC (Heavy Ion Medical Accelerator, Japan) investigate a single cycle synchrotron able
to change the energy within one acceleration cycle, thus avoiding long energy change
times. Also, along with the development of novel accelerator techniques, as described
in section 2.3 more favorable timing structures for rescanning can be achieved.
Zenklusen et al. [2010] studied also different delivery strategies for rescanning that
are referred to as scaled repainting and isolayered repainting. In scaled repainting the
31
dose per fraction scales with the number of rescans, whereas in isolayered rescanning
the number of rescans is proportional to the number of protons for each spot. The latter
approach is characterized by inhomogeneous spot patterns that can result in different
beam paths for each rescan. However, this method comprises the possibility to control the number of spots delivered with each spot avoiding the problem of low particle
numbers that can be a technical limitation [Bert and Durante, 2011]. The study of Zenklusen et al. [2010] revealed that isolayered rescanning might be preferred for treatment
of tumors moving less than 5 mm with spot scanning. For treatment of tumors exceeding an amplitude of 5 mm they proposed to combine rescanning with another motion
encompassing method such as gating or breath-hold techniques.
It has been proven that rescanning is technically feasible in various studies. However, there are also some drawbacks to this method. Rescanning does not suppress
the motion and consequently all peculiarities coming along with motion have still to be
dealt with during imaging and treatment planning [Paganetti, 2012]. As a matter of fact,
rescanning increases the treatment time, combined with gating the method might even
experience the limitations of applicability with regard to time during daily clinical routine.
Beam tracking
In contrast to rescanning, beam tracking tackles the problem of motion directly by synchronous correction of the beam position for the displacement of the tumor in real-time.
It possibly is the most sophisticated motion management technique but also technically
most challenging. Originally, beam tracking was proposed for photon beam irradiation
[Keall et al., 2001] and has already been applied in the Cyberknife Synchrony system
(Accuray Inc, Sunnyvalke, CA) for x-ray radiosurgery [Nioutsikou et al., 2008]. At GSI
comprehensive studies have been examined to investigate beam tracking for scanned
Carbon ion beams from a technical as well as dosimetric point of view ([Grözinger et al.,
2004], [Bert et al., 2007], [Bert et al., 2010], [Saito et al., 2009], [Chaudhri et al., 2010]).
A full tracking system has been integrated and tested. Lateral adjustment is performed
by the scanning magnets, whereas a motor-driven wedge system is used for longitudinal range adaptation [Weber et al., 2000]. Comparison of dose distributions achieved
for a moving tumor and beam tracking with a stationary tumor showed good agreement
with deviations less than 1 % [Bert et al., 2010]. Though, beam tracking is technically
feasible, it has not been applied for radiation therapy with scanned particles, yet [Riboldi
et al., 2012]. It relies on real-time position information during treatment, however, the
4D imaging data in clinical routine is acquired hours or even days before the treatment.
Therefore, real-time 4D imaging and fast plan adaptation is needed for it’s clinical use.
Furthermore, in order to correct for changes of the particle ranges, a pre-calculated
range correction has to be performed on each motion phase prior to treatment. This is
based on 4D CTs using image registration which is still an element of uncertainty.
32
In conclusion, beam tracking is - from a physical point of view - the best method
to deal with the problem of organ motion. A further improvement can be obtained by
combining it with rescanning, since statistical fluctuations can be averaged out when
the tumor is rescanned about 10 times and, moreover, any error made in one scan can
potentially be compensated in a next one.
33
Chapter 3
TULIP - TUrning LInac for Proton
therapy
3.1
Introduction
In section 2.2 the various proton accelerator techniques and machines currently used
or investigated for hadron therapy are described. This section describes a novel accelerator system for proton therapy called "TULIP" (TUrning LInac for Proton therapy )
designed and patented by TERA [Amaldi et al., 2008] and introduces the reader into
the scope of this work.
3.1.1
Motivation
About 10000 patients are treated with protons per year summing up to total number of
about 100 000 patients who will have been treated with protons by the end of 2013.
However, the number of available proton therapy facilities is restricted. Currently, there
are about 40 operating centers worldwide offering proton therapy. For Carbon ions
the situation with respect to availability is even worse. All proton facilities in operation
nowadays are based on cyclotrons and synchrotrons. For carbon ions or even heavier
particles synchrotons are the only available option up to now. Besides the technological
advantages and disadvantages listed also in section 2.2 there are major restrictions for
these types of accelerators preventing widespread application in medicine as they are:
they require large space and come along with high costs up to 130 Mio Euros. Therefore, most of todays hadron therapy facilities are so called multi-room centers employing one particle accelerator whose beam is used in several treatment rooms allowing
for radiation therapy of about 400-500 patients per year in each room [Amaldi et al.,
2008]. To spread hadron therapy and increase the availability of particles for radiation
therapy throughout the world apart from large and cost intensive multi-room centers, researchers in research centers as well as in commercial industry have started to design
35
and construct so called ’single room facilities’ [Amaldi et al., 2010]. Part of these efforts
is the development of compact accelerators with reduced costs that can be integrated
into smaller or even existing rooms for electron linacs at hospitals without the extensive
and elaborate installation of an entire new hadron therapy center. TERA foundation has
patented a novel proton acceleration system for medical application [Amaldi et al., 2008]
which will be described in the following since it is the basis of this work. TULIP has the
potential to fulfill the requirements for single room facilities as they are the cost of the
high-tech part of such a single room facility will be approximately 30 Million Euros with a
400 m2 area (shielding included) and this without making compromises on the physical
and/or clinical benefits of proton therapy. The system involves a pre-accelerator (cyclotron) and a linear accelerator mounted on a gantry rotating around a patient capable
of active proton scanning. Details on the accelerator, the design and output of this machine are described in the following sections 3.1.2 and 3.1.3. Due to highly innovative
accelerator technique and sophisticated design the system will be massively reduced
in size and costs compared to large cyclotron or synchrotron facilities.
In this work, the dose delivery of TULIP is investigated. In this chapter, first dose
delivery to static targets with TULIP is analyzed. Details on the hardware conditions
concerning dose delivery are described in chapter 4.
3.1.2
TULIP - Design
TULIP is a high frequency linear accelerator mounted on a gantry capable to rotate
around the patient and deliver protons via active beam scanning.
There are many relevant parameters to be considered when designing a particle
accelerator. The TULIP specific paramters are summarized in table 3.1.1.
For high gradient operation one of the most crucial choice is the RF frequency (SBand (2998.5 MHz) or C-Band (5712.0 MHz)) which has been carefully investigated
by Degiovanni et al. [2011], Andres et al. [2012] and Amaldi et al. [2012]. For TULIP
S-band showed to be superior compared to the C-band design in terms of total length
and beam performance. Also, the commercially available power sources operating at
the desired frequency play an important role for the design. The maximum energy of
230 MeV has been chosen to meet the required therapeutic goals for most of the occurring tumors. In order to reduce the costs a 24 MeV cyclotron, equipped with an
external proton source, has been chosen as injector, even though in previous designs
other cyclotrons with maximum energies above 30 to 35 MeV have been considered.
Also the number of modules, tanks per module and cells per tank is subject of development since they affect the length and energy gain of the accelerating section. To suffice
and realize the changes in the hardware parts, the support system and overall structure
has been adapted several times. In figure 3.1.1 different versions of Tulip in the time
line of development are shown. The most recent design is shown in figure 3.1.2. While
in the previous versions of TULIP the linear accelerator was divided into several sec36
General Parameters
RF frequency [MHz]
Number of units
Number of tanks
Number of cells
Maximum peak surface electric field [MV/m]
Maximum peak magnetic field [kA/m]
Average axial gradient in the cells [MV/m]
Iris diameter [mm]
Total linac length [m]
Input Energy [MeV]
Output Energy [MeV]
Energy steps per unit
2998.5 (S-Band)
11
28
396
159
81
22.3-32.2
6.0
11.1
24.0
230.0
11-25
Energy Consumption
Peak power needed per RF unit [MW]
Total peak power needed [MW]
6.3 - 8.0
92
Transverse Focusing System
Number of Permanent Magnetic Quadrupoles (PMQs)
Magnetic field gradient of PMQs [T/m]
Length of PMQs [mm]
Diameter of PMQs [mm]
29
176-120
33.0
7.0
Beam Performance
Repetition rate [Hz]
Duration of the RF pulse at the flat-top [µs]
Transversal magnet scan speed [m/s]
Lateral field size [cm2 ]
Normalized transverse acceptance [π mm mrad]
Normalized longitudinal acceptance [π deg MeV]
Total transmittance [%]
Average beam current [nA]
120
1.6
5-10
20x20
1.9
8.7
6.3
1.0
Table 3.1.1: TULIP specific design parameters.
37
tions with different directions, the most recent design holds only two subsequent linear
accelerating sections directly attached to each other. After preacceleration, the beam
is focused by quadrupole magnets in the High Energy Beam Transfer line (HEBT) and
directed into the accelerating section. Two bending magnets bend the beam towards
the patient while two scanning magnets move the beam across the tumour covering a
treatment field of 20 x 20 cm2 .
(a)
(b)
(c)
(d)
Figure 3.1.1: Schematic drawing of previous versions of TULIP designs.
Picture (a) shows the first proposal for the TULIP design of 2006. The
entire accelerator is mounted in a gantry. (b) shows an idea where the
linear accelerating part is divided into two sections and the final linac
points to the patient. In (c) a trapezoidal layout of the supporting structure has been chosen. The gantry rotates around the patient from 0
to 330◦ , no lateral beam scanning is applied. In picture (d) a simplistic
sketch of the most recent design is presented. Both accelerating units
are put subsequently on the gantry transporting the beam in the same
direction. To save space the cyclotron is positioned below the gantry.
The gantry rotation is limited to 220◦ and the beam can be laterally
scanned.
3.1.3
TULIP - accelerator and beam line
The cell coupled linac is based on the cyclinac concept described in section 2.3.3. The
protons are pre-accelerated by a 24 MeV cyclotron and then are guided by the Low Energy Beam Transport channel (LEBT), where the beam is shaped to match the required
transverse acceptance. Since no energy variation is envisioned within the LEBT it can
38
Figure 3.1.2: Drawing of the most recent TULIP design. The accelerating parts of the linac are mounted on a gantry which can rotate ±110◦
around the patient. A 24 MeV cyclotron serves as injector to the linac.
The patient is positioned on a robotic couch which can be rotated in all
directions around a vertical axis. 11 accelerating units are fed by individual klystrons that are connected via rotating joints to the RF accelerating
structures.
be made of permanent quadrupole magnets. After the LEBT protons with an energy of
70 MeV are accelerated up to 230 MeV in the linac, before they enter the High Energy
Beam Transport section (HEBT). Within the HEBT the particles are focused and bent
by 4 quadrupoles, 2 bending magnets and 2 scanning magnets and accelerated to their
final energy up to 230 MeV. The accelerator itself consists of 11 RF units with 28 tanks
for a total of 296 accelerating cells giving the linac an overall length of 11 m. Each unit
is independently powered by an individual klystron with a repetition rate of 120 Hz that
produces 3 GHz power pulses [Degiovanni et al., 2011]. Each pulse is about 1.5-2.5
µs long which corresponds to a duty cycle of 0.04%. In high gradient tests of a prototype at 3 GHz, gradients of 35 MV/m with a surface field of 170 MV/m to accelerate the
protons could be reached [Amaldi et al., 2012]. At these high gradients a breakdown
rate of about 2·10−6 bpp/m was measured, which corresponds to a breakdown every
400 seconds for a repetition rate of 120 Hz and a length of approximately 10 m. The
high repetition rate holds the potential of very fast active energy variation on a pulseby-pulse basis by modulation of the klystron input power. The beam intensity can also
be changed every pulse by a computer controlled source. These characteristics make
TULIP suitable for fast dose application with protons to tumours. Furthermore, energy
and intensity variation within milliseconds hold the potential to treat moving tumors with
protons. A waveguide system transports the power from the 11 klystrons to the linac
modules. Since the linac is rotating while the klystrons are statically mounted on the
ground, rotating joints proposed by I. Syratchev (CERN) are required. The first three
39
modules, that are responsible for acceleration of protons to a fixed energy of 70 MeV,
consist of 4 tanks with a number of cavities (13-17). The rest of the modules comprise 2
tanks each to allow for energy variation by amplitude and phase variation of the klystron
power. The linac (both subsequent sections) mounted on the gantry is about 11 m long.
It can rotate around the patient covering an angle segment of ±110◦ like competitive
systems (ProteusOne (IBA), MEVION S250) mentioned in section 2.3.3. To increase
the degrees of freedom for radiation therapy treatment the patient couch is mounted on
a robotic arm which allows rotation around a vertical axis in any direction. The beam is
delivered throughout the tumor by 2 scanning magnets allowing for a 20x20 cm2 field to
be covered by the magnetic scanning. For the most recent design we assume a lateral
magnet scan speed of 5 to 10 m/s. For the previous designs, no lateral scanning was
envisaged, since the beam was supposed to rotate around the patient for a total angle
equal to 330◦ .
40
Chapter 4
Static proton dose delivery with TULIP
Throughout the time of development of TULIP there have been different design proposals that led to two conceptional different dose delivery techniques. Both systems were
investigated and will be described in the following.
Since TULIP is a modular linear accelerator it is predestinated for active energy
variation on a milliseconds scale by variation of the power levels and the phases of the
klystrons. A repetition rate of maximum 120 Hz allows for energy variation within 8.3 ms.
A momentum acceptance of the bending magnets allows for fast energy variation within
a proton range in matter of roughly 7 %. Larger energy steps require the adjustment
of the magnet current within the HEBT section which can happen within 100 ms. The
energy range is limited by the LEBT output energy (70 MeV) and maximum energy
of the HEBT (230 MeV). Two scanning magnets move the beam across a field of 20
x 20 cm2 with a scanning speed of 5 to 10 m/s. The intensity (number of protons)
can also be varied on a pulse-by-pulse basis with a precision of 3 %. However, due
limitations of the proton source, the maximum number of protons per pulse is limited to
5·107 . These machine specific physical parameters allow for fast intensity modulated
beam delivery. Two conceptionally different beam delivery methods could be thought
of: rotational proton therapy and 3D spot scanning. These dose delivery methods have
been studied with regard to resulting dose dostributions and performance (irradiation
time). For this purpose a C++ based simulation software has been developed. The
first part of this work describes the development and mode of operation of this software
(4.1) as well as dosimetric results for the delivery to a stationary tumor with rotational
proton therapy and 3D spot scanning (4.2).
4.1
Dose Delivery Simulation Software
In order to study proton dose delivery based on a novel accelerator design, a C++ based
algorithm has been developed to simulate this process. The software was supposed to
41
fulfill three main criteria listed below:
• simulate static dose delivery to static tumors
• TULIP specific parameters should be easily alterable by user input
• should be extendible to dose delivery simulation to moving tumors
4.1.0.1
Input Data
Patient specific input data
In order to meet these demands, we implemented a C++ algorithm performing dose
calculation on a patient specific CT using spot weight and position data determined by
an external IMRT optimization treatment planning system. Therefore, prior to application of the dose calculation algorithm, referred to as TuDoCa (TUlip DOse CAlculation)
in the following, a static treatment plan has to be calculated by a treatment planning system (TPS). For this purpose the DKFZ (Deutsches Krebsforschungszentrum) inhouse
TPS ’KonRad’ was used [Nill et al., 2004]. This step is unavoidable, because for dose
calculation with TuDoCa, the number of protons delivered by each spot is required as
input parameter. These are determined by an iterative optimization process by KonRad (see also 2.4.4). There was no point to include the entire optimization process
into TuDoCa, since it is mostly independent of the accelerator type, thus not crucial for
TULIP specific dose calculation. Machine specific parameters independent from machine movement, that were taken into account, concern the source to axis distance
(SAD), energy range and field sizes. These could be modified in KonRad prior to optimization. Since TuDoCa performs a dose calculation, the radiological depth of each
spot must be determined through a ray-tracing [Siddon, 1985]. For conversion of density
values into proton stopping ranges the patient planning CT is needed as input. Additionally, information on tumor and body contours is required to restrict the dose calculation
to the relevant regions. Of course, these data are needed also for the optimization by
the TPS. Therefore, the volumes of interest (VOIs) were delineated by a clinician prior
to dose calculation.
Beam specific input data and parameters
Besides the patient specific data, measured or simulated pristine depth dose curves
are required to calculate dose. The data used here is equivalent to the data used in
KonRad. A measured water depth dose curve for a broad proton beam was used.
The values of the initial σ0 , describing the lateral width of the beam when exiting the
accelerator nozzle, have been modified to match the expected TULIP specific nozzle
42
beam output. Figure 4.1.1 shows the used values for σ0 with increasing energy. Additionally, the corresponding Full Width Half Maximum (FWHM) values are shown. These
can be calculated from initial values σ0 using the following formula:
p
F W HM = 2 2 ln(2)σ0 .
(4.1.1)
For TULIP specific modeling of the beam penumbra a Source-to-Axis-Distance
(SAD) of 2.275 m has been implemented within the dose calculation algorithm.
8
sigma
18
FWHM
FWHM*1.2
0
sigma *1.2
0
16
7
14
FWHM [mm]
sigma 0 [mm]
6
5
12
10
4
8
3
2
0
6
100
200
Energy [MeV]
300
4
0
100
200
Energy [MeV]
300
Figure 4.1.1: Left: initial σ0 for increasing proton energies are shown.
The blue circles show the original initial σ0 , the red triangles show the
same values multiplied with a constant factor of 1.2 which matches better the realistic requirements for TULIP. Right: corresponding FWHMs.
The number of protons that can be delivered within one pulse depends on the cyclotron and its external proton source. For TULIP a 24 MeV Cyclotron by ACSI (Advanced Cyclotron Systems Inc., Canada) with an external proton source is considered
and investigated. In this study a maximum number of protons per pulse of 5 · 107 is assumed. If more particles are needed the original spot is delivered in multiple pulses. Another parameter important for linac design is the breakdown rate (BDR). The very high
electric fields on the surface of the accelerating cavities can lead to a so-called breakdown - a localized dissipation of the stored energy in the accelerating structure. This
effect has been experimentally studied for TULIP by Degiovanni et al. [2011], Amaldi
et al. [2012] and Andres et al. [2012]. For a single-cell cavity operated at 3 GHz the
maximum BDR for a maximum electric field of 170 MV/m and RF pulses of 2.5 µs was
3·10−6 bpp/m. According to these results the effect of a broad range of BDRs has been
investigated within the dose delivery study presented in this work. For further reading
43
on breakdown tests for TULIP, the reader is referred to the literature indicated above. In
addition to the fixed beam parameters, also beam parameters whose values were to be
studied within the scope of this work have been included and can be easily modified by
user input. These are the lateral magnet scan speed vscan,lat and the gantry rotation
speed vg . Depending on the length of the irradiated volume the TULIP field size of 20 x
20 cm2 might not be sufficient. In these cases the couch must be shifted with a couch
motion velocity vc which is assumed to be 1 mm/s. For initial studies also the pulse rate
was subject of investigation and has been fixed at a later time point to 120 Hz. Table
4.1.1 summarizes the required patient and beam specific input data.
TuDoCa Input Parameters
Patient Specific Input
(4D)CT
VOIs
Spots
Energy
Position
Weight (number of protons)
(ANZAI motion data)
Beam Specific Input -fixed
Depth dose curve (water)
HU -rel. stopping power conversion table
Bragg Peak position
lateral beam broadening σ
Source-to-axis distance SAD
Beam Specific Input - variable
5·107
10−6 - 10−3 bpp
5 - 10 m/s
1 - 6 ◦ /s
1 mm/s
<=120 Hz
Number of protons per pulse
BDR
Lateral scan speed vscan,lat
Gantry rotation speed vg
Couch motion speed vc
Pulse rate f
Table 4.1.1: Patient and beam specific data and parameters for TuDoCa.
Values in brackets are only used for dose delivery simulation to moving
targets.
44
4.1.1
TUlip DOse CAlculation software -TuDoCa
The process flow is illustrated in a flow chart in figure 4.1.2. For each fraction the dose
delivered by all beams is summed. The basic part of the algorithm, where most of the
TULIP specific features are implemented, is the organization of a spot list. Before the
spot list is filled with the individual spot characteristics, the time to move the gantry and
the couch to the required position is added. Since the important TULIP parameters are
the pulse rate and the couch and gantry rotation, the time must be updated throughout
the entire delivery process. For filling of the spot list all spots are addressed subsequently and the delivery time (tdelivery = f1 ) is added. There is the option either to
rotate the gantry during dose delivery or to use common 3D spot scanning. For rotational delivery, the gantry moves with the user defined gantry speed vg during the
delivery of the current spot. This simulates a ’semi-continuous’ beam delivery during
gantry motion. For normal 3D spot scanning the spots are sorted in isoenergy slices
(IES). The delivery time is added for each spot. Also, the additional time it takes to
move the beam to the next spot position, denoted as tscan,lat , is added. The lateral
scanning time is calculated based on the distance between subsequent spots and the
d
scan speed: tscan,lat = v spot .
scan,lat
Once all spots of all beams are added to the spot list, the dose calculation for the
dose of one fraction is performed. The dose distributions for all fractions are summed
and stored to a final dose distribution.
The dose calculation performed within the algorithm is a pencil beam dose algorithm as described in section 2.4.4 and also used in KonRad. A major difference from
the KonRad intrinsic algorithm is the cube on which the dose calculation is performed.
Whereas KonRad builds up a new dose calculation grid around the isocenter voxel,
which is assumed to be the middle of a voxel, TuDoCa directly uses the CT cube with
its original resolution. For validation of TuDoCa, KonRad dose distributions were used.
Therefore, it should be emphasized here already, that both dose calculation algorithms
are not identical. The different dose calculation cubes used may induce differences in
the dose calculation when comparing both dose calculation algorithms.
The dose calculation algorithm described here has been extended to simulate dose
delivery to moving tumors. Chapter 5 is devoted to the required software modifications
and results for dose delivery to moving targets.
4.1.2
Evaluation of the dose calculation software
In order to use the dose algorithm to study TULIP specific dose delivery it must be
verified that the dose is calculated correctly. It is obvious that software development
and testing involves many steps that cannot be described here entirely. The results
presented in the following include a lot of simple dose calculation verification steps
such as dose validation for single spots and range checks by direct comparison to
45
Start:
Read in
input data
Fraction
Beam
Move to couch
position
t = t + dcouch/vcouch
Move to gantry
position
Spot
t = t + δg/vg
yes
Rotational
delivery
αg =αg + v g∙ tdelivery
no
Sort spots in IES
t = t + tdelivery+ (tscan,lat)
Add spot to spotlist
no
yes
All spots in
list?
All
beams?
Dose
yes calculation
add fraction
dose
All
fractions?
no
no
Figure 4.1.2: TuDoCa flow chart. The time dependent dose calculation
is shown. δg indicates the difference between gantry angles for two subsequent beam gantry positions. αg indicates the gantry angle difference
between two subsequent spots for rotational dose delivery.
46
yes
End
analytically calculated dose distributions. After successful performance of these basic
evaluation steps, first, the general functionality of the algorithm and the calculated dose
for a 3D spot scanning and for rotational dose delivery were evaluated (4.1.2). During
code evaluation the relative position of the isocenter within the voxel grid has been
exposed as an essential parameter when comparing dose calculations performed by
the algorithm presented here and KonRad. Therefore, section 4.1.3 is dedicated to
show the influence of the isocenter position relative to the voxel grid on the resulting
dose distribution.
4.1.2.1
Methods and Materials
The implementation of the dose calculation algorithm as described in section 4.1.1 has
been tested for two principally different dose delivery techniques: 3D spot scanning,
which is described in section 2.4.2, and rotational dose delivery. Dynamic rotational
dose delivery is not applied in proton therapy up to now. It delivers the dose while the
gantry is continuously moving around the patient. The technique has been thought to
be applicable for TULIP due to the feasibility of combination of fast dose delivery with a
rotating gantry.
In this section, only the translation of the method into software code is evaluated.
Influences of this delivery technique on the dose are evaluated in section 4.2.1.
For evaluation, a cylindrical water phantom with a diameter of 17 cm and a length
of 9.9 cm was used. The CT grid resolution in x-, y-direction and z-direction was
∆x = ∆y = ∆z =1 mm, where x gives the extension from right to left of the patient,
y points from anterior to posterior of the patient and z gives the longitudinal extension
from bottom to top. For dose calculation three volumes of interest (VOIs) have been
delineated: a circular target volume which exceeds only over one z-slice, a contour outlining the circumference of the water phantom and the outline contour with an additional
4 mm margins added in all directions. Figure 4.1.3 shows the phantom and the relevant
contours. Table 4.1.2 summarizes the parameters for the cylindrical phantom which will
be denoted as Phantom1 in the following.
The dosimetric outcome for 3D spot scanning and rotational dose delivery for a
static and a moving gantry was calculated. For 3D spot scanning (3DSS) 3 beam directions and, in accordance to the lateral spot size, a lateral spot grid of 3 mm was chosen
and spots were set with a 1 mm range difference. The dose prescribed to the target
was 60 Gy. First, a static treatment plan was calculated using the treatment planning
system (TPS) ’KonRad’. The calculated spot energies, positions and weights were then
used as input to the dose calculation algorithm. In case of 3DSS TuDoCa subsequently
performed a new dose calculation with static gantry and beam positions as given by
the static treatment plan. In case of rotational dose delivery, first a comparison for
static gantry positions between KonRad and TuDoCa was performed, since KonRad is
not capable to perform dynamic dose calculation. In case of static rotational delivery, a
47
y
x
Figure 4.1.3: Transversal view of the CT of the cylindrical water phantom
’Phantom1’. The target is delineated in pink, the outline of the phantom
in cyan and the outline with a margin of 4 mm in yellow.
Phantom1
length [cm]
diameter (phantom) [cm]
diameter (target) [cm]
slice distance [mm]
CT voxel grid x(y) [mm]
# of target slices
total volume [voxels]
target volume [voxels]
9.9
17
5
1
1 (1)
1
9077000
7860
Table 4.1.2: Cylindrical phantom ’Phantom1’ CT data
48
static treatment plan with multiple (110) beam directions was calculated by KonRad and
compared to the same plan calculated by TuDoCa. After evaluation of the static dose
distribution, the TULIP specific dynamic rotational dose calculation was simulated. In
order to do so, the gantry angle position for each beam αstatic was used to be shifted
for each individual spot according to the current time of dose delivery depending on the
gantry rotation speed. The result is an individual gantry angle for each spot αdyn,spot :
αdyn,spot = αstatic + vg · tdelivery .
(4.1.2)
The process is visualized in figure 4.1.4.
3°
3°
3°
210°
210°
30°
180°
30°
180°
(a) Static rotational delivery
(b) Dynamic rotational delivery
Figure 4.1.4: Rotational dose delivery with TULIP. The static spot positions, shown in (a) are shifted during delivery for dynamic rotational
delivery as indicated in (b). The 3◦ angular step between the static
beam positions is marked.
For rotational dose delivery, it must be taken into account that TULIP in its first design version would only be capable to deliver beams from 0◦ to 330◦ since the residual
30◦ are required for static support of the gantry. For dose calculation, the 330◦ are
divided into 110 static beam directions. This was found to be reasonable, since for dynamic rotational delivery, the dynamic gantry positions for each spot could then differ by
a maximum of 3◦ from the statically calculated beam position. Since TuDoCa is using
the statically calculated beam energies and beam weights to perform dynamic rotational
dose delivery, the gantry positions for static and dynamic dose delivery should not differ
too much to avoid density changes and secure validity of the optimized beam weights.
Within 3◦ the differences in density, thus energy and optimized beam weight are small
and therefore, the method of shifted static beam positions for dynamic rotational beam
delivery is applicable.
49
The resulting static dose distributions are then compared to KonRad dose distributions using dose volume histograms (DVHs) and differences of dose distributions.
Differences to minimal doses received by 1 %, 50 % and 99 % of the target volume
and the maximum dose difference between the KonRad dose and the dose calculated
by TuDoCa allow for further quantification of the dosimetric differences. The results of
the dose algoritm evaluation are presented in section 4.1.2.2.
4.1.2.2
Results
For 3DSS the dose distributions calculated by KonRad and TuDoCa were compared.
All results are summarized in table 4.1.3. Apart from dynamic rotational delivery (DR),
for all other dose delivery scenarios, the minimum dose values for 99 %, 50 %, 1 % of
the target volume deviate less than 1 Gy (Dprescribed = 60 Gy) from the reference dose
values calculated by KonRad. However, the absolute value of the maximum difference
is greater than 14 Gy for all cases. Therefore, in figure 4.1.5 histograms showing the
number of voxels that deviate by a certain dose value are shown. For 3DSS the histogram clearly shows that the dose of only a small number of voxels deviates more than
0.5 Gy from the dose calculated by KonRad. The number of voxels increases for static
rotational delivery (SR). However, in relation to the total number of voxels of about 9·106
(see table 4.1.2), the fraction of voxels deviating more than 1 Gy is below 10−5 . For dynamic rotational delivery we are not expecting the resulting dose distribution to match
the static dose distribution calculated by KonRad since the gantry angles for each spot
are shifted in that case. The histogram is shown anyway, to illustrate the magnitude of
the effect on the dose distribution caused by the continuous gantry rotation.
The deviation of the statically calculated dose distributions are the result of non
equal dose calculation cubes used by the two algorithms and by different implementations of dose calculation start voxels. As described above, KonRad builds up a new
dose calculation cube around the isocenter. In this case the voxel resolution is the
same but the grids are shifted against each other. Additionally, the calculation of the
dose calculation start voxel differs. The contour defining the volume in which the dose
should be calculated is the same for both algorithms. Due to differing discretization and
translation of the data points into voxels, the dose calculation start point may differ by
one voxel. Also the allocation of Hounsfield values within a defined contour might differ
due to this discretization. Figure 4.1.6 illustrates this effect by means of depth dose
profiles for 3DSS. The corresponding dose distributions and the differences between
dose distributions are shown in figure 4.1.7. The effect of different start points becomes
more obvious if more beam angles are applied as can be observed for static rotational
delivery. Therefore, the depth dose curves are shown in figure 4.1.8 and the corresponding dose distributions in figure 4.1.9. For static rotational delivery a ring shaped
margin of one or two voxel rows around the contour remains, where the dose calculation
algorithms differ due to different discretization of the contours and different calculation
50
of dose calculation start voxels.
Phantom1
Delivery
method
#beams
(static)
∆x [mm]
vg
target dose [Gy]
(∆y ) [mm] [◦ /s] D99 D50 D1
|Ddif f,max |
3DSS,KonRad
(reference)
3DSS,TuDoCa
SR,stat,TuDoCa
DR,dyn,TuDoCa
3
3 (3)
0
59,3
60,1
60,6
0
3
110
110
3 (3)
-
0
0
6
58,6
58,6
56,4
59,8
60,0
59,9
60,3
60,8
63,7
14,8
18,5
17,7
Table 4.1.3: Results: evaluation of dose algorithm TuDoCa. SR refers
to static rotational delivery and DR refers to dynamic rotational delivery.
3DSS stands for 3D spot scanning.
4.1.2.3
Discussion
The results of the dose calculation evaluation show deviations of the dose distributions
calculated by the treatment planning system KonRad and the dose calculation algorithm TuDoCa in the order of less than 1% for static dose calculations. Considering
dicretization and numeric effects, agreement of dose values within 1% is an acceptable
result. However, a limited number of outliers showing increased dose deviations of up
to almost 19 Gy were observed. These can be explained by different dose calculation
cube grids and different implementations of the dose calculation start voxel and are
no result of wrong implementation of dose calculation in the dose calculation algorithm
presented in this work. None of the resulting doses can describe the real applied dose
perfectly since both algorithms discretize the volumes of interest for dose calculation
and can only represent an approach to what really happens during irradiation. For the
purpose of this work, TuDoCa has proven the ability to correctly calculate dose within
a predefined volume. The algorithm so far includes the required features as they are:
simulation of dose delivery to static tumors and flexible input of TULIP specific beam
parameters. Extension to dose delivery to moving tumors is discussed in chapter 5.
4.1.3
Influence of relative isocenter position on the dose distribution
During evaluation of the dose calculation software, we noticed that the resolution of the
dose calculation grid and the relative position of the isocenter (IC) within this grid can
play a crucial role in proton dose calculation. Due to small shifts of the isocenter even
51
6
10
5
number of voxels
10
4
10
3
10
2
10
1
10
0
10
0
2
4
6
8
10
dose difference [Gy]
12
14
(a) 3D spot scanning
6
10
5
number of voxels
10
4
10
3
10
2
10
1
10
0
10
−15
−10
−5
0
dose difference [Gy]
5
(b) Static rotational delivery
6
10
5
number of voxels
10
4
10
3
10
2
10
1
10
0
10
−10
−5
0
5
dose difference [Gy]
10
15
(c) Dynamic rotational delivery
Figure 4.1.5: TuDoCa evaluation: histograms showing the number of
voxels that deviate by a certain dose value for 3D spot scanning (a),
static rotational delivery (b) and dynamic rotational delivery (c) on a logarithmic scale.
52
70
70
y−profile TPS
y−profile, TuDoCa
60
60
50
50
40
40
Dose [Gy]
Dose [Gy]
x−profile TPS
x−profile, TuDoCa
30
30
20
20
10
10
0
0
100
200
x [voxels]
0
0
300
100
200
y [voxels]
300
(a) Depth dose profiles for 3DSS.
16.5
y−profile TPS
y−profile, TuDoCa
Dose [Gy]
16
15.5
15
14.5
14
180
185
190
195
y [voxels]
200
205
210
(b) Magnified detail of the y profile shown in (a). The
dose calculation start voxel is identical, but different HU
value allocations lead to slightly different dose values
for both algorithms.
Figure 4.1.6: Depth dose profiles for 3DSS. In (a) the depth dose profiles
along the center of the dose distributions through one slice is shown. (b)
shows a magnified detail of the y-profile in (a).
53
DoseTPS [Gy]
DoseTuDoCa [Gy]
60
60
50
50
40
100
40
100
150
150
20
20
200
200
250
50 100 150 200 250
Dose
−Dose
TPS
TuDoCa
250
0
0
50 100 150 200 250
[Gy]
(Dose
−Dose
TPS
)/D
TuDoCa
prescr
[%]
0.5
50
0.1
50
100
0.05
100
150
0
150
0
200
200
−0.05
250
250
50 100 150 200 250
50 100 150 200 250
−0.5
Figure 4.1.7: Transversal slice of the dose distributions for 3DSS and
dose differences between KonRad and TuDoCa. Scales in x and y directions are in voxels. Additionally, the contours are shown: target (red),
water phantom outline (cyan), water phantom outline plus 4 mm margin
(yellow). The lower plots show the differences of dose distributions. For
more detailed visualization of dose deviations within the dose calculation volume, values above 1 Gy occurring only at the very border of the
outer contour are cut off.
54
70
70
y−profile TPS
y−profile, TuDoCa
60
60
50
50
40
40
Dose [Gy]
Dose [Gy]
x−profile TPS
x−profile, TuDoCa
30
30
20
20
10
10
0
0
100
200
x [voxels]
0
0
300
100
200
y [voxels]
300
(a) Depth dose profiles for static rotational delivery.
20
y−profile TPS
y−profile, TuDoCa
Dose [Gy]
15
10
5
0
210
220
230
240
250
260
y [voxels]
(b) Magnified detail of the y profile shown in (a). The
dose calculation start voxel differs leading to slightly
different dose values and shift of the depth dose
curve.
Figure 4.1.8: Depth dose profiles for static rotational dose delivery. In
(a) the depth dose profiles along the center of the dose distributions
through one slice is shown. (b) shows a magnified detail of the y-profile
in (a).
55
DoseTPS [Gy]
DoseTuDoCa [Gy]
60
60
50
50
40
100
150
40
100
150
20
200
20
200
250
50 100 150 200 250
Dose −Dose
[Gy]
TPS
250
0
50 100 150 200 250
(Dose −Dose
)/D
[%]
TuDoCa
20
TPS
40
0
60
−5
80
100
−10
100
120
−15
120
150
0
60
80
140
100
prescr
20
5
40
TuDoCa
0
140
100
200
−20
150
200
−40
Figure 4.1.9: Transversal slice of the dose distributions for static rotational delivery and dose differences between KonRad and TuDoCa.
Scales in x and y directions are in voxels. Additionally, the contours
are shown: target (red), water phantom outline (cyan), water phantom
outline plus 4 mm margin (yellow). The lower plots show the difference
of dose distributions between KonRad and TuDoCa dose distributions.
Here, the values were not cut off to show the limited number of voxels
that differ by several Gy occurring at the very border of the dose calculation volume.
56
within one voxel, the dose deviates from the dose calculated with the isocenter at the
planning situation. Isocenter shifts, even greater than a few millimeters, are not a TULIP
specific problem, but may appear during the course of radiation therapy independent
from the delivery technology, i. e. through patient positioning errors between different
fractions or even through patient motion within one fraction. Therefore, we tried to gain
more insight into patient misalignment caused dose errors during proton therapy and
point out how TULIP dose calculation is affected by this effect.
4.1.3.1
Materials and Methods
When comparing TULIP dose distributions to dose distributions calculated by the treatment planning system KonRad, we noticed that different dose calculation grids have an
effect on the dose distributions. The dose calculation volume is subdivided into small
volume elements (voxels). Though KonRad uses the original CT as input for the dose
calculation, it internally builds up a new dose calculation cube with the isocenter in the
middle of the new voxel. The grid resolution remains at a pre-defined fixed value. TuDoCa, in contrast, uses the original CT as input, therefore, the isocenter positions may
not always be in the middle of a voxel. In radiotherapy, the CTs used for dose calculation show often the same resolution in x and y direction and a much bigger, thus
different resolution in z direction. A cylindrical water phantom of 3.3 cm length and 5
cm diameter with a cylindrical target in the middle is used for the following investigations. The CT grid used here is equidistant with a resolution of 1 mm. Three different
delivery methods applicable for TULIP are investigated. These are 3D spot scanning
(3DSS), rotational dynamic delivery delivery as described above as well as Distal Edge
Tracking (DET) as described in 2.4.2, where only a limited number of spots is placed
on the target borders. For all techniques, a treatment plan was calculated by KonRad
and re-calculated by TuDoCa. In case of dynamic rotational delivery, a dynamic dose
calculation was performed as described in section 4.1.2.1. The effect of different grid
resolutions between KonRad and TuDoCa resulting in different isocenter positions, was
modeled by shifting the isocenter and re-calculating the dose. Shifts of 0.4 mm, which
is below the voxel size, were simulated. The resulting dose distributions were analyzed
by comparison of minimal doses received by 1%, 50% and 99% of the target volume.
Additional dose distributions illustrate the effect.
4.1.3.2
Results
In table 4.1.4 the investigated cases for 3DSS, dynamic rotational delivery (DR) and
DET are listed.
The most significant results were observed for dynamic rotational delivery. Figure
4.1.10 shows the corresponding dose distributions. It clearly shows the shift in the dose
distribution caused by the isocenter shift.
57
Phantom1
Delivery method
3DSS
DR
DET
#beams rel target point
target dose [Gy]
(static)
3
3
110
110
9
9
D99
D50
D1
56.89
56.73
56.89
55.81
59.74
46.10
59.80
59.79
59.97
59.56
60.04
59.78
60.02
60.26
61.64
64.27
60.28
60.76
[mm]
(0|0|0)
(0.4|0.4|0.4)
(0|0|0)
(0.4|0.4|0.4)
(0|0|0)
(0.4|0.4|0.4)
Table 4.1.4: Results: Influence of relative isocenter shift on the dose
distribution for three different delivery techniques. The relative target
point positions differ by 0.4 mm in all directions.
Dose (0|0|0) [Gy]
Dose (0.4|0.4|0.4)[Gy]
60
60
50
50
40
100
150
40
100
150
20
200
20
200
250
50 100 150 200 250
250
0
Dose (0|0|0) −Dose(0.4|0.4|0.4)[Gy]
50 100 150 200 250
(Dose
(0|0|0)
0
−Dose (0.4|0.4|0.4))/D(prescr)[%]
10
5
50
50
100
0
100
0
150
150
200
−10
200
−5
250
250
50 100 150 200 250
50 100 150 200 250
−20
Figure 4.1.10: Transversal slice of the dose distributions for dynamic
rotational delivery and dose differences between the dose calculated
with the isocenter in the middle of the voxel and shifted by 0.4 mm. Xand y-axis are in voxels. Additionally, the contours are shown: target
(red), water phantom outline (cyan), water phantom outline plus 4 mm
margin (yellow). The difference of dose distributions clearly shows the
effect of the isocenter shift on the transversal slice.
58
DET has also been found to be very sensitive to isocenter shifts as visible in figure
4.1.11. Since with DET, all spots are placed at the target edges, the dose gradient is
the steepest in these regions. The influence of a submillimeter isocenter shift caused
dose deviations of up to 8 %.
Dose
(0|0|0)
[Gy]
Dose
[Gy]
(0.4|0.4|0.4)
60
50
40
100
150
20
200
250
50 100 150 200 250
Dose
60
50
(0|0|0)
−Dose
(0.4|0.4|0.4)
0
[Gy]
40
100
150
20
200
250
50 100 150 200 250
(Dose
(0|0|0)
−Dose
0
)/D(prescr)[%]
(0.4|0.4|0.4)
10
50
100
150
2
50
0
100
−2
200
−4
250
50 100 150 200 250
5
0
150
−5
200
250
50 100 150 200 250
−10
Figure 4.1.11: Transversal slice of the dose distributions for DET and
dose differences between the dose calculated with the isoncenter in the
middle of the voxel and shifted by 0.4 mm. Additionally, the contours
are shown: target (red), water phantom outline (cyan), water phantom
outline plus 4 mm margin (yellow). The difference of the dose distributions indicates that DET is the most sensitive to isocenter shifts within
the steep dose gradients on the target edges.
4.1.3.3
Discussion
The results presented in the previous section give an insight into the magnitude of the
dosimetric effect of submillimeter isocenter shifts on proton dose calculation. Whereas
the effect for 3D spot scanning is rather small, it gets more pronounced for DET and
dynamic rotational delivery. Dose differences of several Gy could be observed caused
by isocenter shifts of 0.4 mm. The dose differences for DET are mostly due to the steep
dose gradient at the target edges. In a real radiation therapy situation, these could
be taken into account by the use of safety margins. For dynamic rotational delivery
the dose differences can also be noticed within the target volume and could not be
59
significantly diminished by a margin. Dynamic rotational delivery is very sensitive to
small misalignments, since for each proton spot position the dosimetric effect is the
same because all spots are placed on one ray with no lateral spots. Also, for opposite
beam directions, the effect can be detrimentally enhanced. 3D spot scanning delivers
the dose by many spots placed next to each other on a transversal plane. The effect of
the isocenter shift might be different for the neighboring spots and therefore might not
necessarily be increased by the contribution of each spot.
The results presented here show that tissue misalignment during proton therapy is
a crucial issue for proton dose calculation. Therefore, careful patient positioning has to
be assured for each therapy session. Nevertheless, protons have the ability to precisely
conform the dose to a target, but only if the geometry of patient and beam positioning
matches the planning situation.
However, the main purpose of this investigation was not to manifest the potentially
harmful effects of setup errors for proton therapy. This has already been extensively
studied ([Park et al., 2012], [Park et al., 2013]) and different solutions as incorporation of setup uncertainties in the optimization process ([Fredriksson, 2012],[Casiraghi
et al., 2013]) and sophisticated margin concepts [Park et al., 2012] were proposed. Our
emphasis was rather put on the study of this effect with particular respect to the dose
delivery method and the dose delivery simulation algorithm used in this work and the
consequences for the design of TULIP. The dose deviations that were observed within
the target cannot be taken into account by safety margins and thus require special attention during planning and irradiation. Concerning the effects on the dose calculation
algorithm and its evaluation, we draw the conclusion, that in order to guarantee comparability between dose calculations performed by TuDoCa and the KonRad employed
here, the dose calculation grids must match exactly. Otherwise, one cannot distinguish
whether potential dose differences are due to mismatch or due to miscalculation within
one of the algorithms. Consequently, for further studies, CTs were re-sampled if required to impart matching grids.
4.2
Dose delivery to static targets
After successful evaluation of the dose calculation algorithm TuDoCa, TULIP specific
dose delivery was studied in order to find the most effective dose delivery procedure. In
this chapter the dose delivery to static tumors is studied. The subsequent chapter 5 is
dedicated to dose delivery to moving tumors. Part of this dose delivery studies was to
find the optimal dose delivery for a suitable design of TULIP. Therefore, in the following,
two different designs of TULIP are studied regarding dose delivery. First, the initial
design of TULIP, allowing for rotational dose delivery was studied (4.2.1). Subsequently,
3D spot scanning dose delivery with TULIP is investigated in section 4.2.2.
60
4.2.1
Dynamic rotational dose delivery
In rotational therapy the radiation source moves around the patient. For photon therapy,
this concept has already been put into practice through several techniques. In helical
tomotherapy [Mackie et al., 1993] a rotating fan beam delivers the dose to the patient
who is moved through the gantry bore. Also the idea to perform arc therapy with conventional photon linear accelerators was proposed long ago [Takahashi et al., 1983].
In Intensity Modulated Arc Therapy (IMAT) the dose is delivered from multiple superimposed arcs. The field shape is modulated through the Multi Leaf Collimator (MLC) of the
accelerator but the dose rate is constant. The first commercialized single arc therapy
system was RapidArcT M by Varian [Varian medical systems, 2008]. Other techniques
such as Volumetric Modulated Arc Therapy (VMAT) commercialized by Elekta AB allow also for variation of the dose rate with the purpose of reduction of irradiation time.
These techniques are commercialized by several vendors nowadays and are already
widely used for cancer treatment. These rotational delivery methods offer the possibility of fast and highly conformal dose delivery. There have been attempts to deliver
proton dose distributions from multiple static beam positions ([Flynn et al., 2007], [Rechner et al., 2012]), but so far, no dynamic rotational dose delivery system is applied in
clinical use. However, with the invention of new accelerator techniques for protons, proton rotational delivery came into the focus of research. Caporaso et al. [2008] proposed
rotational dose delivery performed with a dielectric wall accelerator as described in section 2.3. Physical requirements for proton arc therapy have further been investigated
by Sengbusch et al. [2009]. Also, for TULIP, rotational delivery represents one option
of dose delivery since the accelerator is mounted on a gantry providing a pulsed beam
on a milliseconds time scale. In this first section, we deal with rotational proton dose
delivery performed by TULIP as shown in picture 3.1(c). The accelerator is mounted
on a gantry which can rotate around the patient by 330◦ with a rotation speed in the
range of 1 rpm to 1.5 rpm. A sector of 30◦ cannot be used as incoming beam directions
since the gantry needs to be statically supported. Dose is delivered by a pulsed beam
with a repetition rate of maximum 120 Hz. With these parameters TULIP provides the
possibility to perform fast rotational dose delivery. Additionally, two scanning magnets
are installed in the accelerator nozzle that allow for transversal movement of the beam
covering an area of 20 x 20 cm2 , thus enabling 3D spot scanning. In the following we
investigate rotational proton therapy for TULIP with respect to feasibility, dosimetric outcome and irradiation time and compare the results to 3D spot scanning, also performed
with TULIP. The purpose is to find the optimal dose delivery procedure for TULIP and
to suggest potential modifications of the device according to these findings.
61
4.2.1.1
Materials and Methods
Rotational dynamic delivery was modeled within the dose calculation algorithm TuDoCa
as described in section 4.1.2.1. First, a static treatment plan had to be calculated by a
treatment planning system (KonRad) in order to get the spot weights and the static spot
positions and energies. A set of 110 initial beam directions covering 330◦ for calculation
of the static treatment plan has been found to be reasonable for the following dynamic
dose calculation with TuDoCa. As illustrated in figure 4.1.4 the static beam angles are
shifted for each spot due to the gantry motion during dose delivery. By dividing the total
of 330◦ into 110 subsections, each section covers an angle α = 3◦ . By assuming the
shape of a realistic tumor to be approached by a sphere of radius 10 cm the length of
α
the circle section is L = 2πr· 360
◦ ≈ 0.5 cm. Since the minimum CT pixel size used for
this study is 1 mm, density changes within this section are assumed to be minor. This
is important, since the original beam energies calculated for the static delivery based
on the CT are used for dynamic rotational dose delivery. For density changes within
the beam’s path, the energies would change to avoid over- or undershoot of the target.
Also, for dynamic rotational delivery (DR), the maximum angle to be covered by the
spots of one static beam is limited to the beam section of 3◦ . If the gantry moves faster,
so that not all of the spots planned for this section can be delivered within the time the
gantry would move along that angular step, the gantry is stopped for the delivery of the
residual spots of that beam. For comparison, also the dose delivery with a continuously
moving gantry - without stopping after a certain angle section - has been simulated and
is denoted as CDR.
Throughout the entire delivery process the time is updated. Additionally to the spot
1
delivery time of 120
s and the time to change the magnet current of 100 ms is taken
into account. The momentum acceptance of the scanning magnets is assumed to be
approximately ±2 % which converts to a range acceptance of ±7 % due to equation
2.1.3. This means that the magnet current has to be adjusted if the range difference
of neighboring spots exceeds ±7 %. The 100 ms needed to change the current are
added whenever the critical range difference is exceeded.
In order to cover targets exceeding the longitudinal size of the scanning field of 20
cm, multiple isocenter positions would be calculated and the couch would be moved
to the next isocenter position. In this case the spots for one isocenter position and for
all longitudinal positions and the same energy are delivered first, then the energy is
changed. Again all of these spots are delivered within 3◦ of gantry rotation.
For 3D spot scanning the static treatment plan is re-calculated while the time is
tracked throughout the delivery process to compare irradiation times for the two delivery
methods. The delivery time for each spot is the same as for rotational delivery based on
the pulse rate of the linac. For moving the gantry to the next beam positions the same
gantry rotation speed as for rotational dose delivery is assumed.
Dose delivery studies were based on a water phantom geometry and on a lung
62
patient case, considering the tumor to be static for the purpose of this investigation. The
phantom used is a cylindrical water phantom with a cylindrical target of 5 cm diameter
in the middle. The outline of the phantom is delineated as well as an additional 5 mm
margin in all directions around the outlined volume. All relevant parameters are given in
table 4.2.1. The patient case is a lung tumor patient which in this case is not a realistic
patient case since usually the lung and with it the tumor would move. For the purpose
of this study, tumor motion does not play a role, since we are only interested in realistic
organ and tumor volumes and densities. Therefore, we calculated a treatment plan for
the PTV which is assumed to be static. The patient specific parameters can be found
in table 4.2.1.
Cylindrical phantom
CT slice distance [mm]
CT voxel grid x(y) [mm]
# of target slices
total volume [voxels] ([cm3 ])
target volume [voxels] ([cm3 ])
1
1 (1)
32
9077000 (2269.25)
235260 (58.815)
Patient lung A
CT slice distance [mm]
CT voxel grid x(y) [mm]
total volume [voxels] ([cm3 ])
target volume [voxels] ([cm3 ])
0.98
0.98 (0.98)
30677263 (28553,8)
11860 (11.04)
Table 4.2.1: CT data for cylindrical phantom and lung patient A
For both, phantom and patient, a dose distribution is calculated for dynamic rotational delivery and for 3D spot scanning (3D), meaning that a field is scanned from a
fixed gantry position, and the results are compared. To illustrate the effect of a continuously moving gantry during dose delivery, first, the gantry speed and the repetition rate
was varied for dose calculation for the phantom. Within the machine limitations, the optimal set of parameters should be found. Therefore, several combinations of parameters
covering the realistic machine ranges have been chosen to perform dose calculations
and systematically evaluate the effect of each parameter. A summary of the parameter
combinations applied is given in table 4.2.2.
4.2.1.2
Results
Rotational dynamic delivery to a cylindrical water phantom was simulated by shifting
static gantry positions according to the corresponding gantry speed. In figure 4.2.1
63
Phantom/
Patient
delivery
method
Dprescr
# of static
vg
[Gy]
beam angles
[ /s]
[Hz]
PCyl
PCyl
PCyl
PCyl
PCyl
CDR
CDR
CDR
DR
3DSS
60
60
60
60
60
110
110
110
110
3
1
3
6
1
1
120
120
120
variable
120
Pat A
Pat A
Pat A
Pat A
CDR
DR
DR
3DSS
60
60
60
60
110
110
110
3
1
1
1
1
120
120
variable
120
◦
f
Table 4.2.2: Parameter combinations for dynamic and static dose delivery with TULIP. Two cases are studied: a cylindrical water phantom
PCyl and a lung patient Pat A. Continuous dynamic rotational delivery
is denoted as CDR. When the gantry is stopped after an angular step of
3◦ the delivery is denoted as DR. 3DSS refers to 3D spot scanning.
the gantry angles for individual spots are plotted with respect to time. The figure visualizes the difference between continuous rotational dose delivery and dose delivery
with gantry stops at the fixed beam positions. If the gantry motion would exceed the
user defined maximum 3◦ angle spacing between static beam positions the gantry is
stopped for the delivery of the residual spots. Also, the section between 180◦ and 210◦
is marked. This part cannot be reached by the gantry head since the static support is
located there.
In table 4.2.3 the dosimetric results for the water phantom as well as for the lung
patient case are summarized. To quantify the effects of the delivery method and parameters on the dose, minimal doses to 95, 50 and 5 % of the target volume are given.
Since the delivery time, the time to change the magnet current for larger energy variations and total irradiation time as well as lateral scan time for 3DSS are of interest for
comparison of the two delivery methods, these are also presented in table 4.2.4.
The table clearly shows the influence of continuous gantry motion during dose delivery. For all investigated combinations of dynamic parameters, the minimal dose to 50
% of the target volume deviates heavily from the prescribed dose of 60 Gy for the water
phantom. For a gantry rotation speed of 3 ◦ /s D50 deviates by over 82 % from the prescribed dose. Dose deviations of the minimal dose received by 5 % of the target volume
deviate enormously from the prescribed dose. Additionally, the gantry reaches its maximum position at 210◦ long before all spots are delivered. Therefore, the residual spots
are delivered from the same maximum gantry position. Both effects are consequences
64
400
350
]
300
]
°
250
200
150
100
50
0
0
50
100
150
200 250
time [s]
300
350
400
(a)
400
350
]
300
°
250
200
150
100
50
0
0
100
200
300
400 500
time [s]
600
700
800
900
(b)
Figure 4.2.1: Gantry positions for dynamic rotational dose delivery with
TULIP. In (a) gantry positions in the course of continuous rotational dose
delivery are shown in red. (b) shows the gantry positions if the gantry
is stopped if the range of 3◦ is exceeded. Small angular steps can
be noticed in (b). Additionally, the blue lines the angle segment which
cannot be reached by the gantry. The green lines indicate an arbitrary
3◦ segment.
65
DM
Dynamic parameters
Dosetarget
vg
f
tmag
D95
D50
D5
◦
[ /s]
[Hz]
[s]
[Gy]
[Gy]
[Gy]
PCyl
PCyl
PCyl
PCyl
PCyl
PCyl
CDR
CDR
CDR
DR
DR
3DSS
1
3
6
1
1
1
120
120
120
120
var
120
0.1
0.1
0.1
0.1
0.1
0.1
22.7
1.4
6.8
57.9
58.6
58.5
28.1
10.5
14.0
60.0
59.8
59.9
230.8
331.7
309.8
61.7
60.9
60.1
Pat A
Pat A
Pat A
Pat A
CDR
DR
DR
3DSS
1
1
1
1
120
120
var
120
0.1
0.1
0.1
0.1
21.0
42.9
32.1
58.8
58.0
53.3
53.2
59.8
115.9
60.3
74.2
60.5
Table 4.2.3: Dosimetric results for rotational dynamic and 3D spot scanning dose delivery with TULIP. For different delivery methods (DM) and
dynamic parameters, dose values for a cylindrical water phantom PCyl
and a lung patient Pat A are given.
DM
Dynamic parameters
Time
vg
f
tmag
ttotal
tdelivery
tmag
tscan
◦
[ /s]
[Hz]
[s]
[s]
[s]
[s]
[s]
PCyl
PCyl
PCyl
PCyl
PCyl
PCyl
CDR
CDR
CDR
DR
DR
3DSS
1
3
6
1
1
1
120
120
120
120
var
120
0.1
0.1
0.1
0.1
0.1
0.1
814.6
814.6
814.6
1638.2
427.6
555.7
716.1
716.1
716.1
716.1
330
308.5
97.6
97.6
97.6
97.6
97.6
0.9
0
0
0
0
0
4.4
Pat A
Pat A
Pat A
Pat A
CDR
DR
DR
3DSS
1
1
1
1
120
120
var
120
0.1
0.1
0.1
0.1
312.3
2100
1219.6
349.7
179.8
179.8
990
57.3
112.6
112.6
112.6
0.9
0
0
0
0.02
Table 4.2.4: Results with regard to time for rotational dynamic and 3D
spot scanning dose delivery with TULIP. For different delivery methods
(DM) and dynamic parameters, dose values for a cylindrical water phantom PCyl and a lung patient Pat A are given.
66
of a too fast gantry rotation so that too many spots cannot be delivered close to their
static position. An example of dynamic rotational delivery for the three gantry speeds
without stopping the gantry during delivery is shown in figure 4.2.2. For comparison,
dvhs for dose delivery with gantry stops after each 3◦ if required are shown in 4.2.2. Of
course, for real application, this must be avoided by a beam control system. However,
this would only avoid the huge overdosage at the final beam angle. For demonstration
of all effects happening during dynamic rotational irradiation without modifications this
data is shown.
As stated above, for continuous gantry rotation, the number of spots to be delivered exceeds the number of spots that can be delivered during the time the gantry
moves along the 3◦ segment. Thus three possibilities to avoid spots being delivered
far away from their statically calculated position can be thought of. First, a reduction of
the number of spots, second, a decrease of the gantry speed, and third, an increase
of the repetition rate. Theoretically, the number spots n∆α that can be delivered for a
given gantry speed vg and a fixed repetition rate f within an angle segment ∆α can be
derived as follows:
n∆α =
∆α
vg
tdelivery
1
with tdelivery = .
f
(4.2.1)
For ∆α = 3◦ , f = 120 Hz and vg = 1 ◦ /s, the maximum number of spots that can be
delivered during this section is 360. For the investigated phantom and treatment plan,
the mean number of spots per beam is 781 and the maximum number is 969 for each
static beam direction. These numbers ca be reduced by decreasing the longitudinal
spot grid. However, the dose would loose its uniformity. Alternatively, the gantry speed
must be decreased to 0.37 ◦ /s to ensure delivery of all spots with the given angular step
of 3◦ . For a full rotation (330◦ ) this corresponds to a very slow gantry motion of 0.06
rpm (rounds per minute), which would lengthen the irradiation time and could approach
the technically feasible limitations of continuous gantry motion. The last possibility to
decrease the delivery time can be realized by increasing the pulse rate. Dose delivery
without a fixed limitation for the pulse rate has been simulated. In this case, the pulse
rate is varied for each beam according to the number of spots within a certain angular
step. The spots should be optimally spread within the angular step, defined by the
original static treatment plan. This segment should be covered by the gantry moving
with a dedicated gantry speed until the next original gantry position is met. The pulse
rate f for a number of beams for one static gantry position nbeam to be delivered while
the gantry moves with vg along the angle segment ∆α can be determined as follows:
67
100
o
GTV, vgantry=0 /s f=120 Hz
90
o
GTV, vgantry=1 /s f=120 Hz
80
GTV, v
gantry
o
70
Volume [%]
=3o/s f=120 Hz
GTV, vgantry=6 /s f=120 Hz
60
50
40
30
20
10
0
0
100
200
300
400
Dose [Gy]
500
600
700
(a) Dvhs for rotational dynamic dose delivery without a fixed angular step
100
GTV, v
=0o/s f=120 Hz
GTV, v
=1o/s f=120 Hz
gantry
80
gantry
GTV, vgantry=3o/s f=120 Hz
GTV, v
Volume [%]
gantry
=6o/s f=120 Hz
60
40
20
0
0
10
20
30
40
50
60
70
Dose [Gy]
(b) Dvhs for rotational dynamic dose delivery with a fixed angular
step
Figure 4.2.2: Dvhs for rotational dynamic dose delivery with (a) and
without (b) a fixed angular step. The unwanted distortion of the dose
due to rotation of the gantry becomes obvious in (a).
68
f = nbeam ·
vg
∆α
(4.2.2)
Comparing the results for continuous rotation (CDR) to rotation with potential gantry
stops during dose delivery (DR) with a variable pulse rate, clearly improved dose values
are observed for the phantom. This is not the case for the patient. This confirms that the
pulse rate is only optimized to spread the number of spots of one original beam direction
within a dedicated angle segment covered by the gantry within the corresponding time.
The striking difference between the phantom and patient case is, that for the patient, the
mean repetition rate per beam is smaller than 120 Hz used for simulating dose delivery
with a fixed pulse rate, while for the phantom case it is the other way around. Always
the dose delivery with a fixed pulse rate results in a higher homogeneity of dose. Figure
4.2.3 visualizes the pulse rates for static and variable pulse rate for the patient case and
for comparison also for the water phantom.
For the patient case three isocenter positions are used to cover the entire target
volume in cranio-caudal direction. Therefore, the number of beams is 330 in total,
since 3 rotations with 110 static static beam positions per rotation are performed. The
dosimetric results also manifest in the total irradiation time. When the gantry is stopped
until all spots for one static beam position are delivered, this time is added and results
in an increased overall irradiation time compared to continuous rotational delivery. For
variable pulse rate delivery the total time is minimal since the delivery time depends
only on the time the gantry needs to rotate along the 3◦ angle and no gantry motion
pauses must be added.
300
120
pulse rate [Hz]
pulse rate [Hz]
250
200
150
100
50
100
80
60
40
20
0
0
0
20
40
60
beam
80
100
120
0
(a)
50 100 150 200 250 300 350
beam
(b)
Figure 4.2.3: Pulse rate for each beam for fixed (120 Hz) (red line) and
variable pulse rate (green points) for the cylindrical phantom (a) and
lung patient Pat A (b).
The results for 3D spot scanning (3DSS) are stinkingly better than the ones obtained
with rotational dose delivery (DR) for a fixed pulse rate: the minimal doses to 95, 50 and
69
5 % deviate less than 2.5 % from the prescribed dose for the water phantom. For Pat A
even the optimized repetition rate does not improve the dose distribution compared to
CDR. This is due to the fact, that in this case, the repetition rate is generally decreased
to optimally spread the spots within the static angle segment (see figure 4.2.3). In this
case the spots therefore deviate more from their original position than for using a fixed
but higher (120 Hz) pulse rate. The total irradiation time is less than 6 minutes for the
lung patient.
Even though it is feasible with an optimized set of dynamic parameters to achieve an
acceptable dose distribution with dynamic rotational dose delivery, the dose distribution
for 3D spot scanning is favorable with respect to dose to normal tissue. Figure 4.2.4
clearly shows the difference in dose for a transversal slice of Pat A for rotational and
3D spot scanning delivery. Corresponding dose profiles are shown in figure 4.2.5. Due
to multiple spread beam directions, the dose to normal tissue is increased for rotational
dose delivery.
Dose3DSS [Gy]
DoseDR [Gy]
60
60
50
50
40
40
30
30
20
20
10
10
Figure 4.2.4: Comparison of dose distributions for 3D spot scanning and
dynamic rotational delivery. Rotational delivery results in a detrimental
dose bath to normal tissue.
4.2.1.3
Discussion
The results presented in the previous section illustrate the challenges of dynamic rotational dose delivery for protons with TULIP. For a cylindrical water phantom and a
lung patient it has been shown that rotational dose delivery with a continuously rotating
gantry leads to severe dose distortions when the time influencing parameters are not
carefully adjusted. We have depicted the optimal timing parameters that would result in
acceptable dose distributions. To minimize the time to be spent for spot delivery during
gantry rotation, the number of spots could be reduced. However, this was not pursued
within this work, since it is only a feasible approach for limited cases and could harm the
steepness of dose gradients. The second approach investigated here, is the decrease
of gantry speed. The suitable gantry speed to deliver the spots without large deviations
70
60
40
x−profile 3DSS
x−profile DR
y−profile 3DSS
y−profile DR
35
50
30
40
Dose [Gy]
Dose [Gy]
25
30
20
15
20
10
10
5
0
0
200
400
x [voxels]
600
0
0
200
400
y [voxels]
600
Figure 4.2.5: Dose profiles for 3D spot scanning (blue, dashed dotted
line) and rotational delivery (red, dashed). The profiles are drawn along
the yellow lines indicated in figure 4.2.4. In the entrance channels both
methods apply dose to normal tissue. Dynamic rotational delivery (DR)
delivers an increased dose to surrounding tissue due to multiple incoming beams.
from their static positions has been calculated for the water phantom. However, the
resulting value of 0.06 rpm is below the limit of what is technically feasible for TULIP,
since the TULIP gantry is supposed to rotate with a minimum speed of 1 rpm due to
statics. Thirdly, the pulse rate was adjusted to match the number of spots to be delivered within the time the gantry moves along a small angular step. This also was shown
to be strongly dependent on the individual number of spots per static beam direction.
In the investigated cases, a repetition rate of 120 Hz which is technically feasible would
suffice for rotational delivery to a lung tumor. For the water phantom, the required repetition rate was far beyond that limit. Consequently, a method was developed with gantry
stops for each angular step defined by the original incoming beam directions until all
spots belonging to that beam are delivered. This leads to acceptable dose distributions, however, this would mean that the gantry has to be decelerated and accelerated
multiple times during one rotation, which is technically challenging due to the size and
weight of the gantry which has to be moved and could harm the gantry joints.
Of course, some of the challenges and drawbacks listed above are somehow consequences of the dose delivery simulation method. Certainly, an adequate composition
of dynamic parameters must be found to assure the delivery of a sufficient number of
spots to the target volume while simultaneously avoiding overlaps. While this is still a
challenging task, the problem of too large deviations of spots from their static positions
71
leading to dose deviations is related to the delivery method, which uses the same spots
and their weights as calculated for the static delivery. Thus, a time dependent optimization, taking the current spot positions into account, could reduce the dose distortions.
The more generally valid criterion against dynamic rotational dose delivery is the
increased dose outside the target. Comparing the results for dynamic rotational dose
delivery and 3D spot scanning with regard to dose and time, there seems to be no
reason for application of rotational dose delivery for protons with TULIP. Gantry rotation
during dose delivery resulted in an unwanted and unnecessary dose bath to normal
tissue around the target. The physical advantages of protons thereby are impaired and
could be better exploited with 3D spot scanning. The dose delivered to normal tissue
is small, but it is spread almost over the entire target surrounding tissue. Even though
the dose within each entrance channel for dose delivery with 3DSS using 1 - 5 beams
is increased compared to the dose bath for rotational dose delivery, it can be precisely
controlled where this dose is deposited. Thereby, critical organs can be spared better by
clever patient and beam positioning. Altogether, 3D spot scanning resulted in beneficial
dose distributions and reduced delivery times for almost all cases. Dose delivery with
TULIP for a realistic tumor was shown to be feasible within less than 6 minutes for a
repetition rate of 120 Hz. With higher gantry speeds this time would further decrease.
Altogether, this study led to the decision to not pursue rotational delivery with this
design of TULIP any further. If no rotational dose delivery is required, the maximum
rotation angle could be reduced to ±110◦ for the new design leading to a smaller footprint of TULIP while, in combination with the robotic couch, still allowing for all incoming
beam angles (0-360◦ ). In the following section the results for 3D spot scanning with
TULIP are presented for several patient cases with different tumor indications.
4.2.2
3D spot scanning dose delivery with TULIP
In this section, 3D spot scanning dose delivery is studied with respect to dose and time
for technically feasible and TULIP specific parameters. The purpose is to ascertain
whether TULIP dose delivery can be applied to and is suited for diverse realistic tumor
cases.
4.2.2.1
Materials and Methods
For three different patient cases, 3D spot scanning delivery with TULIP was simulated
using the dose delivery simulation software ’TuDoCa’ described in section 4.1.1. Patient
cases were chosen to be different from each other with respect to tumor position and
size as well as organs at risks (OARs) to cover the large spectrum of potential tumors
to be irradiated with TULIP. We investigated a patient with a spine sarcoma, where the
spinal cord is within the target volume and other organs as the esophagus and trachea
are in direct vicinity. The patient received primary radiation therapy since tumor resec-
72
tion was impossible. Secondly, a patient with a medulloblastoma was treated, where
diffuse spread in many organs through the cerebrospinal fluid is a major concern. This
patient was chosen since the target volume is extremely large and a time consuming craniospinal irradiation (CSI) is performed. Therefore, several couch positions are
mandatory to shift the patient longitudinally within the treatment field. Within the dose
calculation algorithm this was modeled by several isocenter positions and TULIP specific lateral field extensions of 20 cm. Thirdly, a prostate tumor patient was chosen since
this is a very common and frequently occurring tumor in men. Organs that are prone to
suffer from radiotherapy treatment of the prostate are the rectum and the bladder. Table
4.2.5 summarizes the input data for the investigated patients. Beam angles are given in
the coordinate system defined by the International Electrotechnical Commission (IEC)
standard 61217 [IEC standard]. These can be converted to TULIP specific beam angles
and can be realized in practice by couch rotation.
For a better view, transversal, frontal or sagittal views of the CT scans with the most
important organ structures delineated are shown in figure 4.2.6
For 3D spot scanning (3DSS), again, the same simulation approach was used as
in the previous section 4.2.1. Basically, for 3DSS the algorithm re-calculates the dose
derived by KonRad with TULIP specific parameters since no beam motion during dose
delivery takes place. However, for calculation of irradiation time, the TULIP time influencing parameters are considered. These are listed in table 4.2.6. The static dose was
planned to match or improve the dosimetric planning results for a photon tomotherapy
treatment.
For each of the patients listed in table 4.2.5 a 3DSS dose calculation with the parameters indicated in table 4.2.6 was performed using the dose delivery and calculation
software TuDoCa.
4.2.2.2
Results
In consideration of the rather complicated cases with respect to positions of organs at
risk (OARs) in very close vicinity of the target, 3DSS resulted in clinically acceptable
dose distributions for the target volumes as well as in relatively low doses to the organs
at risk. The dosimetric outcome as well as the irradiation times are given in table 4.2.7.
Dose volume histograms visualize the results for the target volumes and selected oars.
For irradiation of the spine sarcoma, which is clinically required to receive a dose
above 66 Gy, the prescribed dose of 70 Gy to the PTV is compromised due to the spinal
cord as an organ at risk included within the target volume. The volume of the spinal cord
receiving 40 Gy, which in total should not receive more than 50 Gy, however, is only 15
%. The dvh 4.2.7 confirms the successful sparing of the spinal cord. The minimum
dose of the spinal cord and the esophagus received by 1 % of the volume - which can
also be thought as a measure of total maximum dose to an organ - is almost zero.
Figure 4.2.8 impressively shows the extension of the irradiated volume for CSI. The
73
Patient spine sarcoma
CT slice distance [mm]
CT voxel grid x(y) [mm]
target volume [voxels] ([cm3 ])
selected OARs
# of beam directions
beam angles [◦ ]
1.95
1.95
62501 (465.6)
spinal cord
3
115, 140, 220
esophagus
Patient CSI
CT slice distance [mm]
CT voxel grid x(y) [mm]
target volume [voxels] ([cm3 ]) Cranial
target volume [voxels] ([cm3 ]) Frontal
target volume [voxels] ([cm3 ]) Spinal
selected OARs
# of beam directions
beam angles [◦ ]
1.95
1.95
207687 (1547.3)
185880 (1384.8)
27038 (201.4)
spine
1
180
optical nerve
Patient prostate
CT slice distance [mm]
CT voxel grid x(y) [mm]
target volume [voxels] ([cm3 ])
selected OARs
# of beam directions
beam angles [◦ ]
2
1.95
9674 (73.8)
rectum
1
120, 180, 230
bladder
Table 4.2.5: Patient Data for 3D spot scanning dose delivery simulation
study.
TULIP beam delivery parameters
pulse rate f
delivery time per spot tdelivery
gantry speed vg
couch speed vc
lateral scan speed vscan,lat
magnet field change time tmag
120 Hz
1/f =8.3 ms
5.5◦ /s
1 mm
s
5m
s
100 ms
Table 4.2.6: TULIP specific beam delivery parameters.
74
(a) CT Patient spine sarcoma: transversal view. Target: red; spinal cord: green,
esophagus: blue.
(b) CT Patient spine sarcoma:
frontal view. Target: red; spinal cord:
green, esophagus: blue.
(c) CT Patient CSI: transversal view. Target: red, (yellow, orange); spine: green,
(optical nerve: purple).
(d) CT Patient CSI: sagittal view.
Target: red, yellow, orange; spine:
green, optical nerve: purple.
(e) CT Patient prostate: transversal view.
Target: red; prostate: yellow, rectum:
green, bladder: blue.
(f) CT Patient prostate: sagittal view.
Target: red; prostate: yellow, rectum:
green, bladder: blue.
Figure 4.2.6: Different CT views for the three patients. The target volume and the selected critical organs are delineated.
75
Patient
PTV dose
Pat spine sarcoma
OAR1
Dpresc
D95
D50
D5
[Gy]
[Gy]
[Gy]
[Gy]
70
63.4
69.7
V40
[%]
72.1
OAR2
V20
[%]
36
Pat prostate
35.5
80
75.3
35.9
79.9
36.3
esophagus
15.1
0.2
24.3
81.8
V20
[%]
spinal cord
16.5
spine
Pat CSI
V40
[%]
4.4
left optical nerv
32.4
-
bladder
rectum
24.3
12.0
32.4
45.8
25.1
Table 4.2.7: Results for 3D spot scanning dose delivery with TULIP.
100
90
PTV
Spinal cord
Esophagus
80
Volume [%]
70
60
50
40
30
20
10
0
0
10
20
30
40
50
Dose [Gy]
60
70
80
90
Figure 4.2.7: Inclusive dvhs for 3D spot scanning irradiation of the spine
sarcoma. Dose losses to the PTV result from the spinal cord as an OAR
lying directly within the PTV.
76
dose distribution reveals the good dose coverage of the target organs indicated by the
dosimetric values given in table 4.2.7, that clearly show very good dose coverage of the
spinal PTV.
Figure 4.2.8: Dose distribution for craniospinal irradiation with TULIP.
The dose values are given in % where D50 corresponds to 100%.
The dose distribution of the prostate PTV is compromised due to the vicinity of the
rectum and the bladder. Both organs are very close to the PTV and need to be spared.
In this case part of the rectum is included in the PTV leading to high local doses within
the rectum. 12 % of the rectum volume receive a dose up to 40 Gy. However, a volume
of 25 % receives up to 20 Gy and the dose to 1 % of the volume is 76.3 Gy as can be
noticed by the dvhs in figure 4.2.9.
These results confirm what has been calculated with the treatment planning system and proves that by 3DSS with TULIP clinically acceptable dose distributions can
be achieved. The more interesting and TULIP specific factor is the irradiation time. Results concerning the time are summarized in table 4.2.8. With TULIP, irradiation of the
prostate with protons is feasible within 8.1 minutes assuming single fraction delivery
which reduces to roughly 6 minutes for delivery in 40 fractions. Larger volumes as the
spine sarcoma require more time mostly due to increased number of pulses. Table 4.2.8
gives the number of pulses that is not necessarily equal to the number of spots calculated by KonRad. TULIP has a limited number of protons that can be delivered within
one pulse of the accelerator of 5·10 7 due to limitations of the proton source. Whenever
this maximum is exceeded, the spot is delivered by multiple beam pulses. The delivery
time is calculated simply by multiplying the number of pulses with the inverse of the
repetition rate. Here, it is important to mention that part of the results in table 4.2.8 assume a single fraction delivery which is not carried out in reality. Therefore, additionally,
77
100
PTV
Bladder
Rectum
90
80
Volume [%]
70
60
50
40
30
20
10
0
0
10
20
30
40
50
Dose [Gy]
60
70
80
90
Figure 4.2.9: Inclusive dvhs for 3D spot scanning irradiation of the
prostate.
the irradiation time for one fraction in a common fractionation scheme is indicated. For
calculation of the irradiation time, the number of pulses is crucial and therefore specified in the table. The total irradiation time is calculated by summation of the different
contributions as they are delivery time, lateral scan time to move the beam between the
spots of one slice, the time to change the magnet field strength if the range variation
is exceeded and the time to move the couch to the next isocenter position, if the field
size exceeds 20 cm in one or both transversal directions. The residual time is needed
to move the gantry between the different gantry positions. Therefore, it is emphasized
here, that what is given here as the total irradiation time comprises the gantry motion
time. During that time, the beam is switched off.
Patient
Patspine
PatCSI
Patprost
#b #f
3
3
4
4
3
3
1
(35)
1
(20)
1
(40)
# pulses ttotal
tdelivery
tscan
tmag
tcouch
[min]
[min]
[s]
[s]
[s]
[s]
212241
33.6
(20.5)
60.4
(25.5)
8.1
(6.3)
29.5
219.0
9.3
0
44.4
391.9
1.6
570
6.8
49.3
3.3
0
319798
49587
Table 4.2.8: Irradiation time for 3D spot scanning with TULIP for single
fraction delivery and multiple fractions indicated in round brackets. The
number of beams and fractions are denoted as #b and #f, respectively.
78
4.2.2.3
Discussion
The results presented in the previous section show that 3D spot scanning is feasible
with TULIP for various tumors. The dose was planned to match or outmatch the dosimetric planning results for photon tomotherapy treatment plans and fulfilled the clinical
goals on an individual basis. Regarding the irradiation time, delivery of the dose of one
fraction in 6 minutes for the prostate is feasible. Irradiation of the prostate with photons
usually requires more than 5 minutes depending on the specific treatment plan and
irradiation technique [Steiner et al., 2013]. Delivery of one fraction dose to the spine
sarcoma took 20 minutes due to the high number of pulses needed even for fractionated dose delivery. For craniospinal treatment with helical tomotherapy, Sterzing et al.
[2008] observed radiation times of 9.5 minutes. With dynamic jaws, treatment times for
helical tomotherapy might be improved further [Krause et al., 2012]. For proton therapy with pencil beam scanning, Timmermann et al. [2007] found irradiation times of
21 minutes for craniospinal irradiation. 25 minutes achieved for craniospinal irradiation
with TULIP is comparable to what was reported by Timmermann et al.. Treatment times
comparable to those reported for tomotherapy could not be reached.
It should be emphasized here, that for TULIP the irradiation time strongly correlates
to the number of spots and the number of protons per spot. With a technical limit of
5·107 protons per spot imposed by the source, it might occur that one spot exceeding
the maximum number of protons per spot is delivered in several pulses which increases
the delivery time. Therefore, an increase of the number of protons per pulse should be
considered. This could be realized by another proton source capable of delivering more
protons per pulse or by using multiple sources.
Another solution to decrease the irradiation time could be to increase the spot grid,
thus a reduction of the number of spots. A reduction of spots might come along with
reduced steepness of dose gradients. Whether this is still an applicable solution without too much harm to the dose distribution strongly depends on the individual patient
case with its specific positions of target volumes and OARs. The number of spots could
also be decreased for different dose delivery techniques. With Distal Edge Tracking
(DET), which might be applicable in many cases, the number of spots could be massively reduced. In summary, on an individual basis, both methods could be a promising
approach to decrease the irradiation time.
4.2.3
Influence of breakdown rate on the dose distribution
As described in section 3.1.3 and 4.2 for very high field gradients, a breakdown of
the electric field might occur. According to the experimental data found by Degiovanni
et al. [2011], Andres et al. [2012] and Amaldi et al. [2012] breakdowns might happen
with a breakdown rate (BDR) in the order of 3·10−6 bpp/m (breakdowns per pulse per
meter) which corresponds to 3.3·10−5 bpp for an accelerator length of 11 m, thus one
79
breakdown every 400 s. Assuming one fraction to be 5 minutes, this roughly results
in one breakdown for each fraction. In the following, the influence of breakdowns at
several breakdown rates is studied for two patient cases.
4.2.3.1
Materials and Methods
Two patient cases were investigated - one receiving a craniospinal irradiation and one
with a lung tumor, which, for the purpose of this study is assumed to be static. The first
patient is the same patient as described in section 4.2.2.1, the parameters for the lung
patient are summarized in table 4.2.9.
Patient lung
CT slice distance [mm]
CT voxel grid x(y) [mm]
target volume [voxels] ([cm3 ])
2.5
0.98
77125 (183.9)
Table 4.2.9: Patient Data for studying the influence of BDRs on the dose.
For the two patient cases, static treatment plans were calculated to be used as
input for the dose calculation algorithm TuDoCa. The prescribed dose to the PTV for
the CSI patient is 36 Gy and 60 Gy for the lung patient. To model breakdowns with a
BDR r within the dose delivery, every rth spot is deleted and not delivered. Thereby,
the number of spots is reduced according to the BDR. For the CSI patient breakdowns
every 10−4 - 10−5 pulse have been modeled for a single fraction delivery. For the lung
patient, breakdowns every 10−3 - 10−6 pulse for single fraction delivery were simulated,
and 10−3 - 10−4 bpp for dose delivery in 10 fractions.
The results are indicated in terms of maximum dose differences occurring for delivery with and without breakdowns and corresponding dose distributions are shown for
selected cases.
4.2.3.2
Results
Dose distributions were calculated assuming different BDRs. Maximum dose differences between the dose distribution calculated for a certain BDR and dose distributions
assuming no breakdowns are summarized in table 4.2.10. As one might notice, the
number of pulses deleted does not exactly correlate with the fraction of pulses that can
be derived by the original number of pulses, denoted as # pulsesorig and the BDR. This
is due to the different subdivision of spots according to the maximum number of protons
in a spot and due to numerical reasons during calculation. Altogether, the dosimetric
effect due to breakdowns is rather minor in almost all investigated cases. For all BDR
smaller than 10−3 bpp the maximum local dose differences are below 1 Gy which does
80
not massively influence the resulting dose distribution. Only if every 1000th or more of
the planned spots are not delivered, we noticed maximum local dose differences of 5.2
Gy. For the same patient and BDR with fractionated delivery the maximum observed
dose difference is 1.3 Gy. Figure 4.2.10 shows the difference between the dose distributions for the lung patient between dose calculations assuming no breakdowns and
assuming a BDR of 10−3 bpp. Looking at the difference of the dose distributions on the
bottom, one can notice that on the shown slice indeed one spot is missing.
Patient
#f BDR [bpp]
Patient CSI
Patient CSI
Patient Lung
Patient Lung
Patient Lung
Patient Lung
Patient Lung
Patient Lung
1
1
1
1
1
1
10
10
10−4
10−5
10−3
10−4
10−5
10−6
10−3
10−4
# pulsesorig
# pulsesused
|Ddif f,max | [Gy]
9147828
9147828
92215
92215
92215
92215
69804
69804
9147628
9147810
92081
92207
92215
92215
69750
69799
0.35
0.35
5.2
0.31
0
0
1.3
0.22
Table 4.2.10: Influence of breakdowns on the dose for single fraction
(#f=1) and fractionated delivery (#f=10). Maximum dose differences
between dose distributions without breakdowns and those taking into
account a specific breakdown rate.
4.2.3.3
Conclusion
Since breakdown of the electric field might occur during patient treatment with TULIP it
is important to be aware of the potential influences on the dose in the patient. Therefore,
we have investigated the effect of breakdowns during dose delivery with TULIP by simulation of this dose delivery process. Within a wide range of potentially occurring breakdown rates, we have observed almost no effect on the resulting dose distributions. Only
for unrealistic breakdown rates greater than 10−3 bpp, we noticed influences slightly
greater than 1 Gy for fractionated delivery within 10 fractions and over 5 Gy for single
fraction dose delivery. Since single fraction dose delivery is not a realistic scenario but
was rather studied as a worst case example, we found the influence of breakdowns
within the investigated ranges to be minor. For TULIP former experimental studies revealed realistic BDRs of 3.3 · 10−5 bpp which is far away of the BDR which has been
found to be a critical limit for the investigated cases here of 10−3 bpp. Of course, the
influence of breakdowns changes with the number of spots and thereby with the fraction dose delivered by one spot. If the same dose is delivered by more spots than in the
original plan, the fraction dose of one spot decreases and with its influence in case it is
81
DoseBDR=0 [Gy]
DoseBDR=10−3 [Gy]
150
60
200
250
60
200
250
40
300
40
300
20
350
400
100
200
300
400
0
DoseBDR=0−DoseBDR=10−3 [Gy]
20
350
100
200
300
0
(DoseBDR=0−DoseBDR=10−3)/Dprescr [%]
150
150
1.5
200
1
0.8
200
0.6
250
250
0.4
0.5
300
300
0.2
350
400
100
200
0
350
0
400
300
100
200
300
−0.5
Figure 4.2.10: Dose distributions for a lung patient for different BDRs.
The target volume is delineated in green. On the top left picture,
the dose distribution without breakdowns is shown on a representative
transversal slice. On the right top the same slice but with a BDR of 10−3
bpp. On the bottom the differences between the dose distributions are
shown. One can notice that on the shown slice one spot is missing.
82
not delivered due to breakdown. Therefore, plans with spots set more closely and thus
an increased number of spots are considered to be less sensitive than plans with broad
spot grids. However, the evaluated cases here represent two realistic examples where
the spots are placed on a 3 mm lateral spot grid. Therefore, our results manifest, that
for most treatment plans and realistically occurring breakdowns, their influence on the
dose distribution is negligible.
4.3
Discussion and Conclusion
Within this chapter, first, the TULIP specific dose delivery simulation software ’TuDoCa’
has been introduced in section 4.1, followed by the results achieved for dose delivery to static tumors in section 4.2. Major part of this work was the development of a
dose delivery simulation algorithm that includes the essential TULIP beam delivery parameters and calculates time dependent dose distributions. We have introduced and
successfully evaluated that algorithm (4.1.1, 4.1.2). The algorithm showed to match the
required features, machine specific beam parameters can be varied for individual dose
calculations. For further research the algorithm will be used for dose delivery simulation to moving targets as described in chapter 5. During the evaluation of TuDoCa, we
noticed the sensitivity of proton dose calculation to even small setup errors. Therefore,
additional effort was put into investigation of the dosimetric influence caused by small
misalignment for different proton dose delivery methods. We noticed crucial influence
on the resulting dose distributions for submillimeter position shifts during radiation therapy treatment with protons. The dynamic rotational dose delivery method seems to
be particularly sensitive to misalignments that can occur during radiation therapy. We
observed dose deviations that cannot be easily handled by the use of margins. This
is one aspect why dynamic rotational dose delivery is not particularly favored by us for
application with TULIP.
This conclusion has been confirmed by the results achieved for dose delivery simulation with TULIP to static targets (4.2). Dynamic rotational dose delivery includes
technical as well as dosimetric challenges. From the technical aspect an optimized
composition of gantry speed and pulse rate is required to achieve dose distributions
comparable to static ones. However, the technical limit for the pulse rate is 120 Hz, the
gantry rotation speed should be within the range of 1 to 3 rpm to assure smooth gantry
motion and minimized harm to the material. Regarding the dose distributions the unwanted dose outside the target is a major critical aspect of rotational dose delivery. For
3D spot scanning with a fixed and limited number of incoming beam directions, critical
organs can be spared better by considerate patient and beam alignment. Between incoming fields, there are regions where the dose is zero. This cannot be easily achieved
by rotational dose delivery.
Rotational proton therapy has not yet been studied or even used in clinical routine,
83
but there are investigations concerning proton arc therapy where multiple static beam
directions are used. Rechner et al. [2012] found a decreased risk of radiogenic second cancer of organs at risk for arc therapy of the prostate with protons compared to
volumetric arc therapy in certain cases. They used 16 static proton beams to deliver
the dose. Sandison et al. [1997] studied proton arc therapy for treatment of the chest
wall. In comparison to electron arc therapy the dose to the lung was reduced. Sengbusch et al. [2009] studied proton arc therapy with regard to maximum energies needed
for new compact accelerator designs. They concluded that the maximum accelerator
energy needed could be reduced if having the ability of treating patients also with arc
therapy which could decrease the path length, thus the energy. Arc therapy, and potentially also dynamic rotational therapy with protons can deliver homogeneous dose
distributions with low dose to organs in direct vicinity. However, due to multiple beam
directions, the dose is spread all around the treated volume. In the cases we have
studied, we could hardly observe dosimetric benefit due to rotational therapy. Additionally, we found irradiation times to be increased for rotational dose delivery with TULIP.
Altogether, our studies gave no convincing reason to use rotational dose delivery with
TULIP.
Therefore, we studied dose delivery with two lateral scanning magnets and found
good clinical results from a dosimetric point of view. Concerning the irradiation times,
we found that TULIP has the ability to deliver one fraction of the prescribed dose to a
prostate tumor in less than 6 minutes. Compared to photon therapy treatment which
would require 5 or more minutes this is an encouraging result. Also, for very time elaborate craniospinal irradiation we calculated irradiation times of 25 minutes for delivery
of one fraction of dose.
For further investigation of the features of TULIP, we studied the dosimetric influence
of breakdowns of the electric field. For the experimentally found value of 3.3·10−6
bpp/m ([Amaldi et al., 2012]), the results of the simulation study do not reveal a harmful
effect of these breakdowns.
In summary, TULIP is able to deliver proton plans by 3D spot scanning for most
realistically occurring tumors on a short time scale. Based on our studies, the irradiation
time could be decreased simply by using a more powerful proton source, that would
allow for delivery of more protons per pulse.
In conclusion, with TULIP 3D active spot scanning without the use of degraders and
modulators is feasible that are required in other single room facilities as proposed by
Mevion Medical Systems [2012] (MEVION S250) and IBA (ProteusOne) [IBA, Proton
Therapy, 2012]. This clear advantage is further enhanced, with respect to MEVION
250, by the fact that the dose distribution is active and not passive.
84
Chapter 5
Dose delivery to moving tumors with
TULIP
5.1
Introduction
TULIP provides excellent characteristics for the treatment of moving tumors with protons. With pulses of maximal 5·107 protons that can be delivered on a millisecond
time base, it is superbly suited for motion mitigation techniques such as rescanning,
tracking, or even better, a combination of both. As described in section 2.5, rescanning attempts to average out motion induced local misdosages by delivering the dose
in multiple rescans. Naturally, this increases the irradiation time. As reported in the
literature, rescanning is also studied in combination with gating, in which dose delivery is restricted to a predefined time or motion interval to further mitigate the effects
of motion ([Furukawa et al., 2010], [Mori et al., 2013b]). TULIP provides high flexibility by patient positioning on a movable and rotatable couch, a wide range of potential
gantry positions and very fast beam delivery. Therefore, with rescanning there is great
potential to save irradiation time by very fast dose delivery while still using active energy
variation compared to methods currently available with synchrotrons or cyclotrons. For
synchrotrons, the major challenge for treatment of moving organs is the energy variation time of several seconds. For a cyclotron based proton acceleration with the Gantry
2, PSI pursues the way towards fast spot scanning dose delivery which is thought to
open the way to treat also moving targets [Zenklusen et al., 2010]. However, since a
cyclotron is used, energy variation is performed within 80 ms using a degrader, while
lateral scanning requires only few milliseconds. With TULIP the energy variation time
can be reduced roughly by a factor of 10. Therefore, the time required for rescanning
is expected to be also severly reduced. Also, due to shortening of scanning times, the
motion happening within one rescan might be reduced which can beneficially affect the
resulting dose distributions.
85
We want to investigate well the TULIP concept is suited for treatment of moving
tumors with rescanning. Therefore, we have performed dose delivery simulation studies
based on the extended version of ’TuDoCa’ (see section 4.1) for dynamic targets. In the
following the modifications of the dose delivery simulation software are described (5.2),
followed by the results for dose delivery simulations to two lung and one liver tumor
(5.3).
5.2
5.2.1
Materials and Methods
4D dose delivery simulation algorithm
The dose delivery simulation algorithm described in section 4.1 has been modified and
used for dose delivery simulation to moving tumors. Changes to the patient input data
and modifications to the dose calculation and summation software code were necessary. An overview of the relevant changes is given by the flow chart in figures 5.2.1
and 5.2.2 indicating the main process flow. Of course, the patient CT data for all motion
phases and a measured motion signal has to be read in. Prior to dose calculation, the
CT phases are correlated to the motion signal, thus to time. The acquisition of 4DCT
data is described in the following section. Subsequently, a list containing all spots for
all fractions and all beams is built similar to the dose delivery simulation for static targets. Thereby, each spot i is correlated to the time of its delivery ti which comprises all
steps (scanning, gantry motion, couch motion, magnet change) that potentially might
be performed to reach the current spot position. Through the time, the current spot is
assigned to the corresponding CT phase. In the end of this simulation step, for each
phase a list of appendant spots is built. Once all spots are correlated to their motion
phases, the dose calculation for each fraction f is performed. For each CT phase j, the
dose for all dedicated spots i denoted as D(f,j,i) is calculated, remapped to a reference
phase D(f,ref) and summed for all phases. The remapping is performed with help of
the displacement vectors giving the displacement between each motion phase and a
reference phase, gained by image registration. As reference the maximum exhalation
phase has been chosen. It is the same phase as used for treatment planning. After the
dose of all spots of all phases for one fraction is accumulated, the next fraction of dose
is calculated the same way and summed. Between each fraction a random time step
is inserted to avoid matching time patterns for subsequent fractions. The result is the
accumulated dose distribution over all motion phases and fractions.
The algorithm accounts for anatomic changes by using CTs from different motion
phases. The amount of motion over time is accounted for by the measured motion
signal. The motion signal was not measured during radiation therapy but during CT
acquisition. This means that the CTs used for the simulation can only represent the
anatomic changes induced by the motion during the time of CT acquisition. In a realistic
86
situation the motion during treatment might differ from the motion during acquisition of
planning CTs. For the simulation approach used here, we are assuming identical motion
at the time of CT acquisition and during irradiation. The reader should be aware of this,
when evaluating the results.
Another intrinsic drawback of the method used here might be the motion measurement and the correlation to tumor motion. As reported in section 2.5.3.1, by using a
strain gauge for motion measuring, only movement of the abdomen mainly caused by
breathing can be measured. One cannot directly assume a correlation between motion
of the thorax or abdomen and the tumor located within the lung or liver. However, building a correct correlation model is beyond the scope of this work. And for the purpose
in the context of this work, namely to correlate the CT phases to the time by using the
measured motion signal, we consider that assumption to be valid and directly correlate
the measured motion signal with the tumor movement.
Start:
Fraction
Read 4D CT for CT
phases CT(Aj)
j=1 < #CT phases
Beam
Move to couch
position
t = t + dcouch/vcouch
Read patient motion
Data: A(t)
Move to gantry
position
Correlate A(t) with
CT(Aj) : CT(Aj (t))
t = t + δg/vg
Spot i
Sort spots in
IES
ti = t + tdelivery+ (tscan,lat)
Assign CT(Aj(ti))
Add spot to spotlist
for Phase CT(Aj)
no
All spots
in list?
yes
no
yes
All beams?
no
yes
All
fractions?
Spot list for Phase j
Spot i:
• ti
• (xi|yi|zi)
• bwi
…
Spot n: …
Figure 5.2.1: Process flow of 4D dose delivery simulation software. The
processes flow before the dose calculation and accumulation is shown.
In the described steps a list of spots for the subsequent dose calculation
is created.
87
Fraction f
CT phase j
Spot list for Phase j
Spot i:
• ti
• (xi|yi|zi)
• bwi
Spot i
Calc dose for CT
fraction f, phase j
and spot i: D(f,i,j)
D(f,ref) += D(i,j,f)
All spots?
no
yes
All phases ?
no
yes
D += D(f,ref)
no
t = t + trandom
yes
All fractions ?
yes
Accumulated dose
for all phases &
fractions
Figure 5.2.2: The dose calculation and accumulation steps based on
the spot list generated with the process shown in 5.2.1 is shown.
88
5.2.2
Input data
Similar as for dose delivery to a static tumor, patient specific CT data is required for
dose delivery simulation to moving targets. However, not only one static CT scan is
needed, but multiple CT scans describing the motion induced anatomic changes between different scans. Therefore, a 4DCT scan was acquired for each patient. The
motion of the patient’s thorax was measured by using a strain gauge around the thorax.
Here, only tumors within the patient’s thorax and abdomen (lung, liver) were examined.
Triggered by the amplitude of the motion signal, a CT scan was taken recording the current anatomic situation. The amplitude steps triggering the CT scans for the individual
patients are indicated in table 5.2.1. Each 4DCT consists of 7 or 10 CT scans for different motion states. As for static dose delivery, these CT scans were used as input to the
dose delivery simulation software TuDoCa to determine the correct stopping ranges for
the protons penetrating the tissues. The measured motion signal also serves as input
for the software tool. The CT scans for the different motion phases are correlated to
time by the motion curve for time dependent dose calculation. This correlation is based
on the motion amplitudes that originally triggered the CT scan. The motion signal only
provides arbitrary values of chest wall expansion that can be correlated to air filling of
the lung during breathing. Therefore, the percentage air filling of the lung, as indicated
in table 5.2.1, is used to correlate the CT phases to the motion signal again. The motion curves for the individual patients as well as correlated CT phases are visualized in
figure 5.2.3.
Patient
LU1/LU2
CT phase
Inhale [%]
CT phase
Inhale [%]
0
0-20
5
100-80*
Patient
LI
CT phase
Inhale [%]
CT phase
Inhale [%]
0
0-25
4
100-70*
1
20-40
6
80-60*
2
40-60
7
60-40*
3
60-80
8
40-20*
1
25-50
5
70-40*
2
50-75
6
40-0*
3
75-100
4
80-100
9
20-0*
Table 5.2.1: CT acquisition steps for the individual patients. The percentage of air filling of the lung measured with a strain gauge is given in
percent of maximum inhalation/exhalation. 100 % corresponds to maximum inhalation. Values labeled with ’*’ refer to exhalation. Again 100
% refers to full inhalation.
89
(a)
120
8
100
6
CT phase
Amplitude [arb units]
Amplitude [%]
10
Interpolated Anzai motion dataI
Anzai motion data scaled to %
CT phases
140
80
60
4
40
2
20
0
340
345
350
355
360
365
370
375
0
380
time [s]
(b)
10
Interpolated Anzai motion data
Anzai motion data scaled to %
CT phases
100
8
80
6
CT phase
Amplitude [arb units]
Amplitude [%]
120
60
4
40
2
20
0
100
110
120
130
140
0
150
time [s]
(c)
Figure 5.2.3: Measured motion data and correlated CT phases for the
lung patients LU1 and LU2 in picture (a) and (b) and for the liver patient
in (c).
90
The amount of mean tumor motion was assessed through the CT phases. Knowledge of the amount and direction of motion between the CT phases is gained through
deformable image registration using the registration software "OnQ rts" commercialized
by OSL Oncology Systems Limited. The software calculates the displacement vectors
for each voxel between the motion phases taking voxel deformations into account. From
this data the mean amount of voxel motion for the tumor is derived. Amplitudes refer to
peak-to-peak values and are presented for each direction of motion in table 5.2.2. This
data was used to scale the motion signal measured with the ANZAI belt which, in the
first place, gives only arbitrary motion values correlated with the patient’s breathing. In
figure 5.2.4 the resulting data is presented in terms of mean values and standard deviations for period, peak-to-peak amplitude and baseline shift. The data are also indicated
in table 5.2.2.
Parameter
LU1
LU2
LI
āx ± astd,x
āy ± astd,y
āz ± astd,z
āAnzai ± astd [mm]
¯ Anzai ± bsstd [mm]
bs
p̄Anzai ± pstd [mm]
0.21 ± 0.7
0.30 ± 0.8
8.80 ± 2.4
8.87 ± 2.4
-0.01 ± 0.9
5.4 ± 0.9
1.69 ± 0.5
-2.32 ± 0.7
3.39 ± 0.9
4.51 ± 1.0
-0.02 ± 1.79
2.5 ± 0.4
2.79 ± 1.5
-1.77 ± 0.8
9.05 ± 2.3
9.76 ± 2.4
0.0 ± 1.2
2.5 ± 0.4
Table 5.2.2: Patient motion parameter values as derived with deformable image registration. Mean and standard deviation are calculated for the tumor volume in all directions of motion separately. The
motion values marked with "Anzai" refer to the average motion over the
different directions and are used to scale the measured motion signal.
The amplitude is denoted as a, bs refers to baseline shift and p to period.
In total three different patient cases have been examined here. Two lung patients,
denoted as LU1 and LU2, as well as one liver patient LI [Data: HIT/GSI]. Both tumors
are mainly affected by respiratory motion. For each patient an Internal Target Volume
(ITV) as referred to in section 2.4.3 was delineated to encompass the tumor volume in
all motion states. All target contours as well as organs at risk were delineated on the
maximum exhalation phase which serves as a reference phase in the following. The
anatomic tumor position in full exhalation phases as well as the target and selected
contours of OARs are shown in figure 5.2.5. For each patient a static proton treatment
plan was calculated using the treatment planning system KonRad [Nill et al., 2004]. As
in the static case, spots were set on a 3 mm lateral between adjacent lateral spots and
with energy steps according to 1 mm range differences. For the investigation of rescanning with a reduced number of spots, additionally, a treatment plan was calculated for
91
10
8
amean,Anzai+/− astd,Anzai
6
amean,Anzai
4
aAnzai
0
0
−1
−2
50
breathing cycle
7
1
100
0
(a)
bsmean,Anzai+/− bsstd,Anzai
period [s]
12
baseline shift [mm]
amplitude [mm]
14
6
5
bsmean,Anzai
4
bsAnzai
3
50
breathing cycle
100
0
pmean,Anzai+/− pstd,Anzai
pmean,Anzai
pAnzai
50
breathing cycle
(b)
100
(c)
amean+/− astd
2
amean
a
0
1
3
0
−1
bsmean+/− bsstd
−2
bsmean
−3
0
100
200
breathing cycle
period [s]
4
baseline shift [mm]
amplitude [mm]
2
6
(d)
2
pmean+/− pstd
pmean
1
bs
p
100
200
breathing cycle
0
100
200
breathing cycle
(e)
(f)
amean,Anzai+/− astd,Anzai
5
amean,Anzai
aAnzai
0
200
400
600
breathing cycle
(g)
800
4
0
−5
bsmean,Anzai+/− bsstd,Anzai
bsmean,Anzai
−10
0
(h)
3
2
pmean,Anzai+/− pstd,Anzai
pmean,Anzai
1
bsAnzai
200
400
600
breathing cycle
period [s]
10
baseline shift [mm]
amplitude [mm]
15
800
0
pAnzai
200
400
600
breathing cycle
(i)
Figure 5.2.4: Motion parameter values for the individual patients: (a)-(c)
for lung patient LU1, (d)-(f) for lung patient Lu2 and (g)-(i) for liver patient
LI. a refers to amplitude (mean over all directions), bs refers to baseline
shift and p to period.
92
800
patient LU1 using a 6 mm spot grid in all directions. The dose was prescribed and optimized to the ITV in order to yield 100 % of the CTV to receive between 95 % and 107
% of the prescribed dose. Plan optimization has been performed on the full exhalation
phase. All patient specific input data are summarized in tables 5.2.3 and 5.2.4.
(a) Sagittal CT view of patient LU1
(b) Frontal CT view of patient
LU2
(c) Frontal CT view of patient
LI
Figure 5.2.5: CT views of lung patients LU1 (a) and LU2 (b) and liver
patient LI (c). The ITV (red), GTV/CTV (orange) and some selected critical organs are delineated: lung (green), heart (blue) in (b), liver (blue)
in (c).
Patient
LU1
LU2
LI
# CTs CT voxel grid
10
10
7
x=y=z[mm]
ITV volume
[voxels] ([cm3 ])
CTVexh volume
[voxels] ([cm3 ])
0.98
0.98
0.98
197133 (183.5)
76495 (71.2)
175456 (163.21)
109257 (101.69)
54973 (51.2)
85960 (80.01)
Table 5.2.3: CT data for lung (LU1, LU2) and liver (LI) patients.
5.2.3
Magnitude of motion induced effects
In oder to assess the amount of motion induced effects on the dose distribution, first,
the 4D dose delivery algorithm described above was used to simulate dose delivery to
a moving tumor. As machine parameters, TULIP specific values were used as summarized in table 5.2.5. For all dose delivery simulations 3D spot scanning was applied.
Therefore, the gantry is only rotating to move to the next fixed beam position.
For each of the three cases dose delivery to the static tumor was simulated by using
only the reference (maximum exhalation) phase for which the static treatment plan was
optimized to calculate the dose. In the following, this case is referred to as ’static’ and
93
Patient
Dpresc [Gy]
# beams beam angles [◦ ]
LU1
LU2
LI
60.0
63.8
32.4
1
2
1
180
270, 345
180
Table 5.2.4: Treatment planning data for lung (LU1, LU2) and liver (LI)
patients. Angles are reported according to IEC standard [IEC standard].
TULIP beam delivery parameters
pulse rate f
delivery time per spot tdelivery
gantry speed vg
couch speed vc
lateral scan speed vscan,lat
magnet field change time tmag
120 Hz
1/f=8.3 ms
6◦ /s
1 mm
s
5m
s
100 ms
Table 5.2.5: TULIP specific beam delivery parameters.
serves as a reference to which the other simulation results assuming tumor motion are
compared. For evaluation of the magnitude of motion induced effects on an individual
patient basis, dose delivery was simulated as described in section 5.2.1 for a single
fraction and for multiple fractions without employing any motion mitigation method.
The dosimetric results are again represented by minimum doses to 99 %, 50 %
and 1 % of the target volume and dose volume histograms. Additionally, a homogeneity
index is calculated:
HI =
D5 − D95
,
Dprescr
(5.2.1)
where Dprescr is the prescribed dose and D95 and D5 the minimum dose received by
95 % and 5 % of the target volume. According to this formula, the better the dose
distribution, the smaller the homogeneity index, implied D50 to be close to the prescribed
dose.
5.2.4
Rescanning
In order to simulate dose delivery by using rescanning as one motion mitigation technique as described in section 2.5, the basic dose calculation code remained the same,
but small changes were made. In a first approach we decided to model scaled volumetric rescanning as described by Zenklusen et al. [2010] to see the general effect of
94
rescanning on the dose distribution and to derive irradiation times for this rather simple
technique.
The modifications applied to the simulation software code, as described in section
5.2.1, affect the creation of the spot list as depicted in figure 5.2.1. The spot weights are
scaled by the number of rescans. The spot order for one scan remains the same but is
repeated subsequently for the number of rescans applied. Consequently, the spot list is
expanded and includes all spots for one volumetric scan after the other. All subsequent
steps remain as described above.
We simulated dose delivery in 10 rescans to the moving tumors of all three patients
in a single fraction. The dosimetric results were evaluated by minimal doses received
by 99 %, 50 % and 1 % of the GTV (LU2) or CTV (LU1, LI) as delineated on the
maximum exhale phase for which the treatment plan was optimized. Dvhs and dose
distributions serve to visualize these effects. Additionally, the effect on the homogeneity
was evaluated by calculating the homogeneity index as defined in formula 5.2.1.
In comparison to existing proton accelerators it is of particular interest to study irradiation times, since this is one drawback of rescanning (and also gating) and may be
one obstruction for the wide spread application of this method. Therefore, total irradiation times, the lateral scan times and spot delivery times are calculated. Furthermore,
the same quantities are calculated for irradiation using rescanning with a common synchrotron used as proton accelerator. For TULIP no additional energy change time is
needed. The irradiation time calculation for TULIP is based on the parameters given
in table 5.2.5. For the synchrotron, the same parameters were used and additional energy change time of 1.5 s was assumed. Due to the effect of dose averaging caused
by rescanning, the impact on the dose distribution is not supposed to change due to
the different time patterns of TULIP and synchrotrons. This is exemplarily investigated
for one patient case (LU2), for which also the dose distribution achieved by dose delivery with a synchrotron in 10 rescans was simulated and compared to the same dose
delivery with TULIP.
The patient cases used for the rescanning study and corresponding treatment plans
are the ones described in section 5.2.2.
5.3
5.3.1
Results
Magnitude of motion induced effects
Table 5.3.1 and figure 5.3.1 summarize the dosimetric results for dose delivery to a
moving target and for comparison to a static tumor. Dose values are given for the CTV
and for an organ at risk. For the lung tumor we indicate the volume of the lung receiving
20 Gy and for the liver tumor we present the same quantity for the liver. For the lung
cases, tumor motion during irradiation obviously leads to detrimental and significant
95
underdosage as visualized in figure 5.3.1. The effects also manifest in a decrease of
D99 by almost 10 Gy for LU1 and by 14 Gy for LU2 when the tumors moved. The
misdosage for patient LU2 is shown in the dose distribution and dose difference plots
in figure 5.3.2. For LU1 we also observed overdosage of 3 Gy to the CTV, which was
less pronounced for the other lung patient. These dose deviations are displayed by
the increased homogeneity index. For LU1 the HI increased from 2 % for static tumor
irradiation to 13 % when tumor motion was applied. Similar effects occured for LU2,
where the HI increased from 5 to 18 %.
In the studied lung cases, the averaging effect of fractionation on the dose distribution was more pronounced for LU1. For this tumor, dose delivery in 10 fractions reduced
the overdosage by almost 2 Gy. The dvh tended to approach more the course of the dvh
for dose delivery to a static tumor. For LU2 the effects of fractionation on the resulting
dose were minor.
Due to tumor motion the lung volume receiving 20 Gy was increased from 11.8 to
12.7 % which was not significantly reduced due to fractionation for lung patient LU1. For
patient LU2 V20 almost remained same, independent from tumor motion or fractionation.
Generally, the effect on V20 was small.
For the liver patient studied, the detrimental effects on the dose distribution were
less severe compared to the lung tumor irradiation. The dvh for static tumor irradiation
was the steepest and reveals an excellent dose distribution. The maximum dose deviations in terms of D1 , D50 and D99 were below 1 Gy for a moving tumor compared to
dose delivery to a static tumor. The homogeneity index changed from 1 % to 3% in
that case. However, figure 5.3.3 reveals impressively locally occuring dose deviations
induced by anatomical changes. For fractionated delivery the dosimetric changes were
subtle.
For all investigated patient cases irradiation times (including couch motion time)
were below 8 minutes per fraction (see table 5.3.2). For dose delivery in 10 fractions
for the lung patients and in 4 fractions for the liver patient, the total time per fraction
reduced compared to single fraction dose delivery. This is due to the reduced number
of protons per spot and less need to subdivide spots that exceed the source limitation of
5 · 107 protons per pulse. Irradiation times amounted to less than 5 minutes per fraction
for all studied cases.
5.3.2
Rescanning
Regarding the dosimetric results, rescanning improved the dose distribution compared
to single scan irradiation for all investigated cases as visualized in figure 5.3.4. The
results for moving tumor irradiation are summarized in table 5.3.3. For comparison
the static tumor irradiation results are depicted, too. The overdosage was reduced
and strongly approached the static tumor case for all patients. The maximum residual
deviation from the static tumor irradiation was found for patient LU1, represented by a
96
motion
state
#f CTV
LU1
static
moving
moving
LU2
LI
Patient
D99 [Gy]
D50 [Gy]
D1 [Gy]
HI [%]
OAR
V20 [%]
1
1
10
59.3
49.5
50.5
60.0
60.0
60.0
61.6
64.6
62.7
2
13
10
11.8
12.7
12.6
static
moving
moving
1
1
10
59.7
45.7
48.3
63.8
62.7
62.8
66.2
66.7
66.0
5
18
18
10.9
10.9
10.9
static
moving
moving
1
1
4
32.2
31.5
31.7
32.4
32.4
32.4
32.7
33.2
33.0
1
3
2
7.3
7.4
7.3
Table 5.3.1: Results for 4D spot scanning dose delivery in 1 or 10 fractions, denoted as (#f).
100
90
CTV, static, LU1
CTV, moving, LU1
CTV, moving, 10 f, LU1
GTV, static, LU2
GTV, moving, LU2
GTV, moving, 10 f, LU2
CTV, static, LI
CTV, moving, LI
CTV, moving, 4 f, LI
80
Volume [%]
70
60
50
40
30
20
10
0
0
10
20
30
40
Dose [Gy]
50
60
70
80
Figure 5.3.1: DVHs showing the magnitude of the effect of tumor motion
on the dose distribution during irradiation for the CTVs (GTV).
97
Dose
static
[Gy]
Dose
moving
60
100
[Gy]
60
100
40
40
150
150
20
200
150
200
20
200
0
250
150
Dosestatic−Dosemoving [Gy]
200
250
0
(Dosestatic−Dosemoving)/Dprescr [%]
100
60
100
40
30
150
40
150
20
20
10
200
200
0
150
200
250
0
150
200
250
Figure 5.3.2: Dose distribution on a transversal slice for the moving
lung tumor of patient LU2. The motion induced misdosage (top, right)
compared to the dose distribution for a static tumor (top, left) is visible.
The dashed white lines indicate the CTV and the cyan solid line the ITV.
The bottom row shows the dose differences between dose delivered to
a static and to a moving tumor in [Gy] (left) and [%] right.
Dose
static
[Gy]
Dose
moving
[Gy]
30
30
15
15
10
10
Figure 5.3.3: Dose distribution for the static (left) and moving (right) liver
tumor of patient LI. The overshoot caused by motion induced anatomical
changes can be seen.
98
Patient
#f # pulses per fraction ttotal per fraction
[min]
LU1
LU1
LU2
LU2
LI
LI
1
10
1
10
1
4
55408
22616
26317
15828
37259
27765
7.8
3.2
4.3
2.6
5.3
4.5
Table 5.3.2: Irradiation times for 3D spot scanning with TULIP for moving
tumors for single fraction dose delivery (#f =1) or dose delivery in 10
fractions (#f =10)
difference in D1 of 1.3 Gy. For the other patients, values for D1 deviated even less from
the results achieved by static tumor irradiation. Less improvement was achieved for the
underdosage. For LU1 the minimum dose received by 99 % of the target volume was
improved by 2.9 Gy, but an underdosage of 6.9 Gy from the dose to the static tumor
remained for the small spot grid size of (∆ x,∆ y,∆ z) = (3,3,1) mm. The increase
of the spot size for patient LU1 reveals in an decreased homogeneity, which is also
visualized in figure 5.3.6. The homogeneity index increased from 6 % for static tumor
irradiaiton to 16 % with tumor motion. However, 10 rescans decreased the homogeneity
again to 8 %. For the other lung patient (LU2) D99 increased by 3.7 Gy for irradiation
to the moving tumor, when rescanning was applied, however, 10.3 Gy were lacking
to approach the static tumor irradiation results. This is visualized in the dvhs shown in
figure 5.3.4. For the liver patient LI the absolute dosimetric effects were smaller and also
the impact of tumor motion was less compared to the lung tumors. However, rescanning
improved the dose distribution already for 5 rescans. The course of the corresponding
dvh almost matched the one of the static tumor irradiation when the dose was delivered
in 10 rescans (see figure 5.3.5).
As expected, the dose averaging effect did not significantly change using the synchrotron time parameters compared to irradiation with TULIP for LU2. However, when
comparing irradiation times, there is a striking increase for synchrotron dose delivery
with rescanning. Dose delivery in 5 rescans with TULIP was feasible within 20 minutes per fraction for liver patient LI. For a synchrotron here additional time for changing
the energy is required. Therefore, even for higher scan speeds and smaller delivery
times, 11.6 minutes for energy change are needed for volumetric spot scanning in this
case. Impressively, the influence of the spot grid, thus the decreased number of spots
is shown for LU1 and a spot grid of 6 mm in all directions. One fraction with 10 fold
rescanning could be delivered within 3.5 minutes.
99
spot grid
(∆ x,∆ y,∆ z)
[mm]
motion
state
#s
(3,3,1)
(3,3,1)
(3,3,1)
(6,6,6)
(6,6,6)
(6,6,6)
static
moving
moving
static
moving
moving
LU2
(3,3,1)
(3,3,1)
(3,3,1)
(3,3,1)
LI
(3,3,1)
(3,3,1)
(3,3,1)
(3,3,1)
Pat
LU1
LU1
GTV/CTV
D99
D50
[Gy] Gy]
D1
Gy]
HI
[%]
1
1
10
1
1
10
59.3
49.5
52.4
58.2
52.5
54.8
60.0
60.0
60.2
60.5
60.1
60.0
61.6
64.6
62.9
63.8
68.0
63.4
2
13
8
6
16
8
static
moving
moving
moving
1
1
10
10 (syn.)
59.7
45.7
49.4
50.1
63.8
62.7
62.8
62.8
66.2
66.7
65.7
65.7
5
18
14
14
static
moving
moving
moving
1
1
5
10
32.2
31.5
31.8
32.0
32.4
32.4
32.4
32.4
32.7
33.2
32.9
32.8
1
3
2
2
Table 5.3.3: Results for 4D rescanning dose delivery with TULIP. The
number of scans is denoted as #s. Results for dose delivery with 1
scan and 10 rescans to a moving tumor are presented. For patient LU2
dose values for rescanning achieved with a synchrotron, denoted as
(syn.) are declared.
Pat
LU1
LU1
LU1
LU2
LU2
LI
LI
machine
TULIP
synchr.
TULIP
TULIP
synchr.
TULIP
synchr.
spot grid
(∆ x,∆ y,∆ z)
[mm]
ttotal (10f)
tdelivery
tscan
tmag
tenergy
[min]
[min]
[min]
[s]
[min]
(3,3,1)
(3,3,1)
(6,6,6)
(3,3,1)
(3,3,1)
(3,3,1)
(3,3,1)
36.2 (34.0)
55.0 (55.0)
8.2 (3.5)
26.0 (25.8)
60.9 (60.9)
20.3 (20.0)
31.4 (31.4)
31.4
29.2
7.6
22.2
21.9
18.9
18.6
4.5
4.5
0.5
3.5
3.5
1.2
1.2
21
2.1
17
11.0
-
21.3
35.5
11.6
Table 5.3.4: Irradiation times for 4D rescanning with TULIP and with
a common synchrotron (synchr.). Times are given for a single fraction
dose delivery and the total irradiation time is given for one fraction of
dose delivery in 10 fractions (10f).
100
100
90
80
CTV, static, LU1
CTV, moving, LU1
CTV, moving, 10 rescans, LU1
GTV, static, LU2
GTV, moving, LU2
GTV, moving, 10 rescans, LU2
CTV, static, LI
CTV, moving, LI
CTV, moving, 5 rescans, LI
Volume [%]
70
60
50
40
30
20
10
0
0
10
20
30
40
Dose [Gy]
50
60
70
80
Figure 5.3.4: DVHs for rescanning with TULIP for treatment plans using
a small spot grid size (∆ x,∆ y,∆ z)=(3,3,1) mm. 10 rescans for lung
patients LU1 and LU2 showed to average out dose distortions caused
by organ motion. For the liver patient, the dvh achieved with 5 rescans
almost approaches the dvh achieved by static tumor irradiation.
101
100
CTV, static
CTV, 1 scan, moving
CTV, 5 rescans, moving
CTV, 10 rescans, moving
90
80
Volume [%]
70
60
50
40
30
20
10
0
90
95
100
105
110
115
Dose [%]
Figure 5.3.5: DVHs for rescanning with TULIP for liver patient LI. The
difference in the dose can be seen for 5 and 10 rescans. The dose is
normalized, so that 100% correspond to D50 for the irradiation of the
static tumor.
5.4
Discussion
The results presented in section 5.3.1 reveal the harmful effects of organ and tumor
motion during proton irradiation. The difference between lung and liver tumor irradiation
in the presence of organ motion is large for the studied cases. While the motion induced
effects on the dose distribution were minor for the liver tumor, massive deviations from
static tumor irradiation occurred for the lung tumors. The effect of liver motion has also
been studied by Zhang et al. [2012] who found dose deviations of up to a maximum of
44.6 % between static liver tumor irradiation and dose delivery to a moving tumor for a
single field plan. Mean dose deviations of 2.9 % were observed averaged over different
patient cases. In our studied liver case, the motion induced interplay effects were a little
smaller. Maximum dose deviations of 22 % could be found. Interstingly, the study of
Zhang et al. [2012] reveals the significant impact of the motion registration algorithm
used for motion simulation on the dose deviations when comparing static and moving
tumors. This agrees with our results. Compared to studies performed prior to this work
(data not presented) for the same underlaying patient data, but a different algorithm
used for CT image registration, we also observed differences, that might also be due to
different registration data.
The strong impact of interplay effects on lung tumors has been revealed before.
102
100
90
CTV, static
CTV, 1 scan, moving
CTV,10 rescans, moving
80
Volume [%]
70
60
50
40
30
20
10
0
0
20
40
60
80
Dose [%]
100
120
140
160
Figure 5.3.6: DVHs for rescanning with TULIP for LU1 using a larger
spot grid size (∆ x,∆ y,∆ z) = (6,6,6) mm. 10 rescans improved the
dose distribution. However, due to the large spot grid, the clinical requirements, that 100 % of the volume should receive between 95 % and
107 % of the prescribed dose (indicated by black dotted lines), could not
be entirely met by rescanning.
103
Dowdell et al. [2013]) also showed the large influence of tumor motion in the lung on
the dose distribution by using 4D Monte Carlo dose calculation. Even though they
found a beneficial averaging effect of fractionation on the dose, they also pointed out,
that this effect can also be compromised caused by treatment plan settings or specific
patient anatomy. Our approach definitely suffers from the use of a pencil beam dose
calculation algorithm, which cannot correctly model lateral spread of the dose. This is
more evident in very heterogeneous tissues as occur for lung tumors. Particularly at
the edges of tumors in very heterogeneous tissues, as is the case for lung tumors, the
algorithm might over- or underestimate the dose.
Our results show the severe influence of the extent of tumor motion and the individual patient anatomy on the dose distribution, but also reveal the unpredictability of
interplay effects once more ([Kraus et al., 2011], [Dowdell et al., 2013]). Therefore,
motion mitigation techniques are mandatory for irradiation of mobile tumors with 3D
spot scanning using active energy variation. TULIP offers an improved time structure
compared to synchrotrons, that require large time intervals for energy variation.
The results gained for volumetric rescanning of the two lung tumors and the liver
tumor indicate the averaging effect of rescanning with respect to dose. Especially, for
the liver tumor, where the motion induced dosimetric effects were less pronounced,
rescanning improved the dose distribution even further. The resulting dose distribution
for 5 rescans almost matched the static tumor irradiation result.
For the lung, rescanning also improved the dose homogeneity. However, the effect
of rescanning strongly depends on the spread of the tumor position in the range of
motion states during irradiation. Residual detrimental effects on the dose distribution
might remain, if the range of motion states covered by the tumor is not sufficient to fully
exploit the averaging effect of rescanning. Mori et al. [2013a] also studied rescanning
for lung tumors and found volumetric rescanning to have a reliable averaging effect
only for more than four rescans. However, this strongly correlates to the specific time
structure of the beam delivering devices. Better results even for smaller numbers of
rescans were conducted by phase-controlled rescanning [Furukawa et al., 2010], for
which the extraction rate of the accelerator is adjusted and often an additional gating
window is defined to ensure dose delivery to a scan volume or layer within a certain
time. Using additional gating, however, comes along with an increase of irradiation
time. For a conventional synchrotron energy variation requires several seconds and is
therefore not preferably suited for volumetric rescanning. This was confirmed by the
calculation of energy change time to 11.6 minutes for 93 isoenergy slices and 1.5 s
for each energy change. For slow energy changing systems alternative approaches
are studied. There are developments described by Inaniwa et al. [2012] to implement
a hybrid depth scanning system for carbon ions where the beam of a certain energy
produced by a synchrotron is degraded with additional range shifter plates.
However, TULIP offers a real active energy variation together with 3D spot scanning
for tumor irradiation on an beneficial time scale. Within several minutes, depending on
104
the specific treatment plan and tumor size, rescanning with TULIP showed to be feasible. It should be emphasized here, that more sophisticated rescanning techniques such
as iso-layered or proportional rescanning [Zenklusen et al., 2010] have the potential to
further reduce the irradiation time massively. For example, a reduction of the number
of spots by a factor of 2 would almost result in half of the treatment time. Recently, isolayered rescanning was found to result in improved dose homogeneities and reduced
treatment times [Bernatowicz et al., 2013]. Moreover, the influence of the reduced number of proton spots using a wider spot grid was shown. As expected, the homogeneity
is harmed by a larger spot distance, however, a huge improvement in irradiation was
noticed. For the lung patient, using 6 mm spot distance, dose delivery of one fraction
dose with 10 rescans was feasible within 3.5 minutes. Of course, one should mention
here, that an increased spot grid size can only lead to acceptable dose distributions, if
the spot grid is appropriate for the lateral spot sizes. Therefore, careful adjustment of
the grid size to the lateral spot size is required.
For TULIP, the next step will be a combination of beam tracking using a fast 4D
feedback system and rescanning, which could average out residual motion induced
effects, caused by the delay time of the feedback system. This "rescanning with 4D
feedback" will make use of the unique properties of TULIP, which can vary the energy
of subsequent spots within milliseconds and thus adjust not only its transverse but also
its longitudinal position.
105
Chapter 6
Summary and outlook
Before a general conclusion will be drawn and an outlook presented, the major aspects
of this work are summarized here. This thesis is divided into three main parts. The
first part contains the technical aspects of the novel accelerator design - TULIP - which
constitutes this work (chapter 3). This part is followed by the description of the dose
delivery study for static targets with TULIP in chapter 4. The last chapter (5) deals with
dose delivery to moving targets.
TUrning LInac for Proton therapy - TULIP
This work has been carried out as part of the ambitious efforts of the TERA foundation to develop a novel relatively compact proton accelerator for treatment of cancer
with proton therapy. In chapter 3 the rational, the technical advances during the development and the current status of the machine design are described. In oder to increase
the availability of proton therapy, the size and costs of proton accelerators have to be
reduced. Therefore, a concept based on a linear accelerator for protons was patented
[Amaldi et al., 2008]. It involves a high-frequency linear accelerator for protons mounted
on a gantry named TULIP (TUrning LInac for Proton therapy). Protons are preaccelerated to 24 MeV by a cyclotron and then are directed to two subsequent linear accelerator sections. The total length of the accelerator amounts to 11 m. The accelerating
sections consist of radio frequency modules that are powered by individual klystrons.
The first three modules accelerate the particles to a fixed energy of 70 MeV. Within
the remaining modules, the energy can be varied on a milliseconds time scale within a
range of 70 to 230 MeV by acting on the klystron input powers. TULIP runs at 3 GHz
and provides pulses with a pulse rate of 120 Hz and a maximum number of protons
of 5 · 107 per pulse. In high gradient tests of a prototype gradients of 35 MV/m could
be reached. Breakdown rates of 3 · 10−6 bpp/m were measured, that correspond to
a breakdown every 400 s assuming a length of 10 m. Lateral scanning magnets are
included allowing for 3D spot scanning beam delivery.
107
With the capability to deliver proton spots on a milliseconds time scale, active energy variation and 3D spot scanning, TULIP has the potential of delivering highly conformal dose distributions to static tumors. Furthermore, due to the energy variation on
a very short time scale, it might open perspectives for treatment of moving targets. The
relatively small size of the accelerator and reduced costs compared to large proton therapy facilities make TULIP a highly competitive single room facility for cancer treatment
with protons.
Dose delivery to static tumors
In order to study dose delivery with TULIP, the major part of this work was the development of a software tool, named TuDoCa (TUlip DOse CAlculation software) to simulate
this process. The software development is described in section 4.1. For dose calculation a pencil-beam algorithm was used and beam specific parameters were included.
These comprise the anticipated beam spot sizes and depth dose profiles as well as
timing parameters. In a first instance, the gantry was used for proton rotational therapy.
Therefore, a dynamic dose delivery process was implemented in the software tool to
simulate time dependent rotational dose delivery for various dynamic parameters such
as gantry speed, couch motion speed and pulse rate.
After successful validation of the dose calculation algorithm, dose delivery to static
tumors by a rotating gantry was simulated (4.2). Two methods were studied. In one
approach the gantry stops after predefined angular steps to avoid spots to be delivered
too far away from their planned position for a given pulse rate and gantry speed. The
second method studied was dose delivery during continuous gantry motion. It has
been found that in order to achieve acceptable dose distributions, careful adjustment of
dynamic parameters is required. The first approach resulted in good dose distributions,
however, from a technical point of view, numerous gantry stops during rotational dose
delivery are technically difficult to realize with the required accuracy and might also
harm the supporting gantry material. For continuous gantry rotation the parameters
for gantry speed and repetition rate found for a realistic patient case were out of the
technically feasible range for TULIP. Moreover, when comparing the dosimetric output to
results achieved with 3D spot scanning, the dose homogeneity and treatment time was
preferable for 3D spot scanning. Altogether, we could not see an advantage of rotational
dose delivery with TULIP with regard to time or dose. These findings contributed to the
decision to not further pursue rotational dose delivery with TULIP.
After this decision the feasibility of 3D spot scanning dose delivery with TULIP was
studied. In the context of this investigation the TULIP specific constraints were put into
focus rather than the dosimetric results achieved with this already established delivery
method. Therefore, three different patients were selected with a rather complex configuration of tumor and organs at risk. As expected, for all tumors we achieved good target
108
coverage with 3D spot scanning. Also, for craniospinal irradiation with an extensive target volume, dose calculations using the TULIP treatment field of 20 x 20 cm2 resulted
in high quality dose distributions.
Regarding the treatment time, as expected, we found a strong dependence of the
irradiation time on the required number of pulses since each pulse requires a delivery time of the inverse of the pulse rate produced by the linear accelerator. However,
treatment times were comparable to what is commonly achieved with conventional radiotherapy using either photons or protons. We found irradiation times of 6 minutes for
the prostate and 25 minutes for craniospinal irradiation. Moreover, due to the strong
dependence of the treatment on the number of pulses and spots, we proposed several
methods to reduce the number of proton pulses leading to shorter irradiation times.
Concerning the treatment device, the proton source could be modified to allow for more
protons per spot or we could even think of using multiple sources. With respect to treatment planning, the spot grid size could be increased to use less spots for the dose
delivery, whenever this does not compromise the dose distribution unacceptably. Moreover, Distal Edge Tracking (DET) could be applied, which would certainly reduce the
number of proton spots.
Another performance measure is the breakdown rate of the accelerator. For TULIP,
measurements of a prototype resulted in a breakdown rate of 3 · 10−5 bpp. This would
roughly convert to one breakdown within each fraction of dose delivery. This means
that, depending on the actual breakdown rate, spots that were planned to be delivered,
are left out during irradiation. Therefore, we simulated 3D spot scanning dose delivery
assuming various breakdown rates (4.2.3). For almost all breakdown rates and cases
no significant influence on the delivered dose was observed. Only for breakdown rates
greater than 10−3 bpp dose deviations were unacceptable.
In summary, we found that 3D spot scanning with TULIP is feasible and, due to our
investigations, superior to rotational dose delivery. Dose can be delivered on a time
scale comparable to or shorter than radiation therapy carried out with common existing
treatment devices. Further reduction of treatment time could be obtained quite easily
either by modifying the proton source or by adaptations of the treatment plan.
Dose delivery to moving tumors with TULIP
Organ motion during radiation therapy, especially with protons and Carbon ions, is still
very challenging. Motion mitigation techniques such as rescanning or gating lead to
an increase of the treatment times on principle. We consider TULIP to be preferably
suited for dose delivery to moving organs due to the very short time scale (milliseconds) at which proton pulses can be delivered. Therefore, we studied TULIP specific
dose delivery to moving organs with and without rescanning in chapter 5. As expected
and reported also by others, dose delivery with active spot scanning to moving targets
109
resulted in large dose distortions due to interplay effects between beam and tumor motion. The motion induced dose deviations were larger for the studied lung tumors than
for the liver tumor. When rescanning was applied dose deviations were reduced in all
cases and confirmed a general beneficial effect of rescanning for irradiation of moving
tumors. For the studied liver case, the dose achieved when a static tumor is assumed,
could almost be reached. However, reliable conclusions can only be drawn, if more patient cases are studied. With regard to irradiation time, TULIP showed improvement for
volumetric rescanning in comparison to dose delivery using a synchrotron, which needs
several seconds for each energy change. Dose delivery of a fraction dose in 5 rescans
was possible in 20 minutes. As described in the previous paragraph, the irradiation time
could possibly be further decreased by modifications to the proton source and more
easily by modifications to the treatment plans. The latter case has also been studied in
this work. For an increased spot grid of 6 mm we could reduce the total irradiation time
of one fraction to 3.5 minutes.
This study has revealed that TULIP is suitable for 3D spot scanning dose delivery
for static and moving targets. The combination of active spot scanning on a very short
time scale showed to be advantageous compared to other proton accelerator designs.
To our knowledge, none of the commercial systems considered in this work can provide
active energy variation on such short time scales.
In conclusion, coming back to the initial question of how more patients could profit
from proton therapy, our answer is that TULIP can contribute, on a short time scale, to
the increase of availability and it opens new perspectives on the treatment of moving
tumors with protons.
Outlook
The number of spots and pulses showed to have a significant impact on the dose
delivery time. Therefore, more sophisticated rescanning methods, that allow for reduction of the number of spots, should be considered for future investigations. For further
investigation, we consider combination of rescanning with an appropriate 4D feedback
system and beam tracking. Ten fold rescanning would reduce even more the residual
motion induced effects on the dose. Indeed a suitable position detector could provide
information of the current motion state during irradiation and thus can be used to pause
the beam, whenever the tumor moves outside of a predefined gating window, or send a
signal to a 4D feedback system with beam tracking and reduce the residual misdosages
by rescanning.
110
Bibliography
Alonso, J. (2011). 562 speaker the dielectric wall accelerator: independent evaluation
of project status [1]. Radiotherapy and Oncology, 99, Supplement 1:S229–S230.
Alonso-Basanta, M., Lustig, R. A., and Kennedy, D. W. (2011). Proton beam therapy
in skull base pathology. Otolaryngologic clinics of North America, 44(5):1173–1183.
PMID: 21978900.
Amaldi, U., Bergesio, D., Bonomi, R., Degiovanni, A., Garlasché, M., Magagnin, P.,
Verdú-Andrés, S., and Wegner, R. (2012). High-power test results of a 3 GHz singlecell cavity. arXiv e-print 1206.1930.
Amaldi, U., Berra, P., Crandall, K., Toet, D., Weiss, M., Zennaro, R., Rosso, E., Szeless,
B., Vretenar, M., Cicardi, C., De Martinis, C., Giove, D., Davino, D., Masullo, M., and
Vaccaro, V. (2004). LIBO—a linac-booster for protontherapy: construction and tests
of a prototype. Nuclear Instruments and Methods in Physics Research Section A:
Accelerators, Spectrometers, Detectors and Associated Equipment, 521(2–3):512–
529.
Amaldi, U., Bonomi, R., Braccini, S., Crescenti, M., Degiovanni, A., Garlasché, M.,
Garonna, A., Magrin, G., Mellace, C., Pearce, P., Pittà, G., Puggioni, P., Rosso, E.,
Verdú Andrés, S., Wegner, R., Weiss, M., and Zennaro, R. (2010). Accelerators
for hadrontherapy: From lawrence cyclotrons to linacs. Nuclear Instruments and
Methods in Physics Research Section A: Accelerators, Spectrometers, Detectors and
Associated Equipment, 620(2–3):563–577.
Amaldi, U., Braccini, S., Magrin, G., Pearce, P., and Zennaro, R. (2008). Ion acceleration
system for medical and/or other applications.
Amaldi, U., Braccini, S., and Puggioni, P. (2009). High frequency linacs for hadrontherapy. Reviews of Accelerator Science and Technology, 02(01):111–131.
Amaldi, U. and Grandolfo, M. and Picardi, L. (1996). The RITA network and the design
of compact proton accelerators.
113
Andres, S. V., Garlasche, M., Bonomi, R., Amaldi, U., Degiovanni, A., and Wegner, R.
(2012). 203 the tera high gradient test program for hadron therapy linacs. Radiotherapy and Oncology, 102, Supplement 1:S99–S100.
Baroni, G., Ferrigno, G., Orecchia, R., and Pedotti, A. (2000). Real-time threedimensional motion analysis for patient positioning verification. Radiotherapy and
Oncology, 54(1):21–27.
Bernatowicz, K., Lomax, A. J., and Knopf, A. (2013). Comparative study of layered and
volumetric rescanning for different scanning speeds of proton beam in liver patients.
Physics in medicine and biology, 58(22):7905–7920. PMID: 24165090.
Bert, C. and Durante, M. (2011). Motion in radiotherapy: particle therapy. Physics in
Medicine and Biology, 56(16):R113.
Bert, C., Gemmel, A., Saito, N., Chaudhri, N., Schardt, D., Durante, M., Kraft, G., and
Rietzel, E. (2010). Dosimetric precision of an ion beam tracking system. Radiation
oncology (London, England), 5:61. PMID: 20591160.
Bert, C., Groezinger, S. O., and Rietzel, E. (2008). Quantification of interplay effects
of scanned particle beams and moving targets. Physics in Medicine and Biology,
53(9):2253–2265.
Bert, C. and Rietzel, E. (2007). 4D treatment planning for scanned ion beams. Radiation
Oncology, 2(1):24.
Bert, C., Saito, N., Schmidt, A., Chaudhri, N., Schardt, D., and Rietzel, E. (2007). Target
motion tracking with a scanned particle beam. Medical physics, 34(12):4768–4771.
PMID: 18196804.
Bethe, H. A. (1953). Molière’s theory of multiple scattering.
89(6):1256. Copyright (C) 2010 The American Physical Society.
Physical Review,
Blattmann, H. and Coray, A. (1990). A horizontal proton beam line for the development
of a scanning technique. Radiotherapy and Oncology, 17(1):17–20.
Bortfeld, T., Jiang, S. B., and Rietzel, E. (2004). Effects of motion on the total dose
distribution. Seminars in Radiation Oncology, 14(1):41–51.
Bortfeld, T., Jokivarsi, K., Goitein, M., Kung, J., and Jiang, S. B. (2002). Effects of intrafraction motion on IMRT dose delivery: statistical analysis and simulation. Physics in
Medicine and Biology, 47(13):2203–2220.
Bragg, W. H. (1904). On the absorption of alpha rays, and on the classification of the
alpha rays from radium. Philosophical Magazine, 6(8):719–725.
114
Britton, K. R., Starkschall, G., Tucker, S. L., Pan, T., Nelson, C., Chang, J. Y., Cox, J. D.,
Mohan, R., and Komaki, R. (2007). Assessment of gross tumor volume regression
and motion changes during radiotherapy for non-small-cell lung cancer as measured
by four-dimensional computed tomography. International journal of radiation oncology, biology, physics, 68(4):1036–1046. PMID: 17379442.
Calypso Medical (2011). Calypso Medical Installs System into World’s Largest Proton
Facility at University of Pennsylvania. Press release.
Caporaso, G. (2011). Science and technology review (S&TR) | October/November
2011: Weapons diagnostics technology revolutionizes cancer treatment. https:
//str.llnl.gov/OctNov11/caporaso.html.
Caporaso, G. J., Chen, Y.-J., and Sampayan, S. E. (2009). The dielectric wall accelerator. Reviews of Accelerator Science and Technology, 02(01):253–263.
Caporaso, G. J., Mackie, T. R., Sampayan, S., Chen, Y.-J., Blackfield, D., Harris, J.,
Hawkins, S., Holmes, C., Nelson, S., Paul, A., Poole, B., Rhodes, M., Sanders, D.,
Sullivan, J., Wang, L., Watson, J., Reckwerdt, P. J., Schmidt, R., Pearson, D., Flynn,
R. W., Matthews, D., and Purdy, J. (2008). A compact linac for intensity modulated
proton therapy based on a dielectric wall accelerator. Physica medica, 24(2):98–101.
PMID: 18430600.
Casiraghi, M., Albertini, F., and Lomax, A. J. (2013). Advantages and limitations of the
’worst case scenario’ approach in IMPT treatment planning. Physics in medicine and
biology, 58(5):1323–1339. PMID: 23391569.
Chaudhri, N., Saito, N., Bert, C., Franczak, B., Steidl, P., Durante, M., Rietzel, E., and
Schardt, D. (2010). Ion-optical studies for a range adaptation method in ion beam
therapy using a static wedge degrader combined with magnetic beam deflection.
Physics in Medicine and Biology, 55(12):3499.
Chu, W. T., Ludewigt, B. A., and Renner, T. R. (1993). Instrumentation for treatment of cancer using proton and light-ion beams. Review of Scientific Instruments,
64(8):2055–2122.
Combs, S. E. and Debus, J. (2013). Treatment with heavy charged particles: Systematic review of clinical data and current clinical (comparative) trials. Acta oncologica
(Stockholm, Sweden). PMID: 23964656.
Combs, S. E., Laperriere, N., and Brada, M. (2013). Clinical controversies: proton
radiation therapy for brain and skull base tumors. Seminars in radiation oncology,
23(2):120–126. PMID: 23473689.
115
CPAC (2013). CPAC - compact particle acceleration corporation.
pro/.
http://www.cpac.
Degiovanni, A., Amaldi, U., Bonomi, R., Garlasché, M., Garonna, A., Verdú-Andrés, S.,
and Wegner, R. (2011). TERA high gradient test program of RF cavities for medical
linear accelerators. Nuclear Instruments and Methods in Physics Research Section
A: Accelerators, Spectrometers, Detectors and Associated Equipment, 657(1):55–
58.
DeLaney, T. F. (2011). Proton therapy in the clinic. Frontiers of radiation therapy and
oncology, 43:465–485. PMID: 21625169.
Dowdell, S., Grassberger, C., Sharp, G. C., and Paganetti, H. (2013). Interplay effects
in proton scanning for lung: a 4D monte carlo study assessing the impact of tumor
and beam delivery parameters. Physics in medicine and biology, 58(12):4137–4156.
PMID: 23689035.
Engelsman, M. and Kooy, H. M. (2005). Target volume dose considerations in proton beam treatment planning for lung tumors. Medical physics, 32(12):3549–3557.
PMID: 16475753.
Flynn, R. T., Barbee, D. L., Mackie, T. R., and Jeraj, R. (2007). Comparison of intensity
modulated x-ray therapy and intensity modulated proton therapy for selective subvolume boosting: a phantom study. Physics in medicine and biology, 52(20):6073–6091.
PMID: 17921573 PMCID: PMC2712448.
Fokdal, L., Honoré, H., Høyer, M., Meldgaard, P., Fode, K., and von der Maase, H.
(2004). Impact of changes in bladder and rectal filling volume on organ motion and
dose distribution of the bladder in radiotherapy for urinary bladder cancer. International Journal of Radiation Oncology*Biology*Physics, 59(2):436–444.
Fourrier, J., Mandrillon, P., Mandrillon, J., Meot, F., Pasternak, J., and Conjat, M. (2008).
Variable energy protontherapy FFAG accelerator. In Conf.Proc., volume C0806233,
page TUPP115.
Fredriksson, A. (2012). A characterization of robust radiation therapy treatment planning methods-from expected value to worst case optimization. Medical physics,
39(8):5169–5181. PMID: 22894442.
Furukawa, T., Inaniwa, T., Sato, S., Shirai, T., Mori, S., Takeshita, E., Mizushima, K.,
Himukai, T., and Noda, K. (2010). Moving target irradiation with fast rescanning and
gating in particle therapy. Medical Physics, 37(9):4874–4879. PMID: 20964205.
116
Furukawa, T., Inaniwa, T., Sato, S., Tomitani, T., Minohara, S., Noda, K., and Kanai,
T. (2007). Design study of a raster scanning system for moving target irradiation in
heavy-ion radiotherapy. Medical Physics, 34(3):1085–1097.
Goitein, M., Lomax, A. J., and Pedroni, E. S. (2002). Treating cancer with protons.
Physics Today, 55(9):45–50.
Gottschalk, B., Koehler, A., Schneider, R., Sisterson, J., and Wagner, M. (1993).
Multiple coulomb scattering of 160 MeV protons. Nuclear Instruments and Methods in Physics Research Section B: Beam Interactions with Materials and Atoms,
74(4):467–490.
Grudiev, A., Calatroni, S., and Wuensch, W. (2009). New local field quantity describing
the high gradient limit of accelerating structures. Physical Review Special Topics Accelerators and Beams, 12(10):102001.
Grözinger, S. O., Li, Q., Rietzel, E., Haberer, T., and Kraft, G. (2004). 3D online compensation of target motion with scanned particle beam. Radiotherapy and oncology:
journal of the European Society for Therapeutic Radiology and Oncology, 73 Suppl
2:S77–79. PMID: 15971315.
Haberer, T., Becher, W., Schardt, D., and Kraft, G. (1993). Magnetic scanning system for
heavy ion therapy. Nuclear Instruments and Methods in Physics Research Section A:
Accelerators, Spectrometers, Detectors and Associated Equipment, 330(1–2):296–
305.
Habermehl, D., Debus, J., Ganten, T., Ganten, M.-K., Bauer, J., Brecht, I. C., Brons, S.,
Haberer, T., Haertig, M., Jäkel, O., Parodi, K., Welzel, T., and Combs, S. E. (2013).
Hypofractionated carbon ion therapy delivered with scanned ion beams for patients
with hepatocellular carcinoma – feasibility and clinical response. Radiation Oncology,
8(1):59. PMID: 23497349.
Hamm, R., Crandall, K. R., and Potter, J. (1991). Preliminary design of a dedicated
proton therapy linac. In , Conference Record of the 1991 IEEE Particle Accelerator
Conference, 1991. Accelerator Science and Technology, pages 2583–2585 vol.4.
Hanley, J., Debois, M. M., Mah, D., Mageras, G. S., Raben, A., Rosenzweig, K., Mychalczak, B., Schwartz, L. H., Gloeggler, P. J., Lutz, W., Ling, C., Leibel, S. A., Fuks,
Z., and Kutcher, G. J. (1999). Deep inspiration breath-hold technique for lung tumors:
the potential value of target immobilization and reduced lung density in dose escalation. International Journal of Radiation Oncology*Biology*Physics, 45(3):603–611.
117
Harris, E. J., Miller, N. R., Bamber, J. C., Symonds-Tayler, J. R. N., and Evans, P. M.
(2010). Speckle tracking in a phantom and feature-based tracking in liver in the presence of respiratory motion using 4D ultrasound. Physics in Medicine and Biology,
55(12):3363.
Hill-Kayser, C. E., Both, S., and Tochner, Z. (2011). Proton therapy: Ever shifting sands
and the opportunities and obligations within. Frontiers in oncology, 1:24. PMID:
22655235.
Hong, L., Goitein, M., Bucciolini, M., Comiskey, R., Gottschalk, B., Rosenthal, S., Serago, C., and Urie, M. (1996). A pencil beam algorithm for proton dose calculations.
Physics in medicine and biology, 41(8):1305–1330. PMID: 8858722.
Hoppe, B., Henderson, R., Mendenhall, W. M., Nichols, R. C., Li, Z., and Mendenhall,
N. P. (2011). Proton therapy for prostate cancer. Oncology (Williston Park, N.Y.),
25(7):644–650, 652. PMID: 21888265.
Hui, Z., Zhang, X., Starkschall, G., Li, Y., Mohan, R., Komaki, R., Cox, J. D., and
Chang, J. Y. (2008). Effects of interfractional motion and anatomic changes on proton therapy dose distribution in lung cancer. International Journal of Radiation Oncology*Biology*Physics, 72(5):1385–1395.
IBA, Proton Therapy (2012).
ProteusONE, proton therapy.
iba-protontherapy.com/.
http://www.
ICRU (International Commission on Radiation Units & Measurements) (1999a). ICRU
report 50, prescribing, recording, and reporting photon beam therapy.
ICRU (International Commission on Radiation Units & Measurements) (1999b). ICRU
report 62, prescribing, recording, and reporting photon beam therapy.
ICRU (International Commission on Radiation Units & Measurements) (2007). ICRU
report 78, prescribing, recording, and reporting photon beam therapy.
ICRU (International Commission on Radiation Units & Measurements) (2010). ICRU
report 83, prescribing, recording, and reporting intensity-modulated photon-beam
therapy.
Inaniwa, T., Furukawa, T., Kanematsu, N., Mori, S., Mizushima, K., Sato, S., Toshito, T.,
Shirai, T., and Noda, K. (2012). Evaluation of hybrid depth scanning for carbon-ion
radiotherapy. Medical physics, 39(5):2820–2825. PMID: 22559653.
International Electrotechnical Commission (1999). Radiotherapy equipment - coordinates, movements & scales, may 1995.
118
Iwata, Y., Kadowaki, T., Uchiyama, H., Fujimoto, T., Takada, E., Shirai, T., Furukawa, T.,
Mizushima, K., Takeshita, E., Katagiri, K., Sato, S., Sano, Y., and Noda, K. (2010).
Multiple-energy operation with extended flattops at HIMAC. Nuclear Instruments and
Methods in Physics Research Section A: Accelerators, Spectrometers, Detectors and
Associated Equipment, 624(1):33–38.
Jäkel, O. (2006). Ranges of ions in metals for use in particle treatment planning. Physics
in Medicine and Biology, 51(9):N173.
Jäkel, O., Combs, S., Bert, C., and Richter, D. (2013). Patient data by courtesy of Heavy
Ion Therapy Center HIT (Heidelberg) and Gesellschaft für Schwerionenforschung
GSI (Darmstadt).
Jongen, Y., Abs, M., Blondin, A., Kleeven, W., Zaremba, S., Vandeplassche, D., Aleksandrov, V., Gursky, S., Karamyshev, O., Karamysheva, G., Kazarinov, N., Kostromin,
S., Morozov, N., Samsonov, E., Shirkov, G., Shevtsov, V., Syresin, E., and Tuzikov, A.
(2010). Compact superconducting cyclotron c400 for hadron therapy. Nuclear Instruments and Methods in Physics Research Section A: Accelerators, Spectrometers,
Detectors and Associated Equipment, 624(1):47–53.
Kanai, T., Endo, M., Minohara, S., Miyahara, N., Koyama-ito, H., Tomura, H., Matsufuji,
N., Futami, Y., Fukumura, A., Hiraoka, T., Furusawa, Y., Ando, K., Suzuki, M., Soga,
F., and Kawachi, K. (1999). Biophysical characteristics of HIMAC clinical irradiation
system for heavy-ion radiation therapy. International journal of radiation oncology,
biology, physics, 44(1):201–210. PMID: 10219815.
Kanai, T., Matsufuji, N., Miyamoto, T., Mizoe, J., Kamada, T., Tsuji, H., Kato, H., Baba,
M., and Tsujii, H. (2006). Examination of GyE system for HIMAC carbon therapy.
International journal of radiation oncology, biology, physics, 64(2):650–656. PMID:
16414376.
Keall, P. J., Kini, V. R., Vedam, S. S., and Mohan, R. (2001). Motion adaptive x-ray
therapy: a feasibility study. Physics in Medicine and Biology, 46(1):1–10.
Kilpatrick, W. D. (1957). Criterion for vacuum sparking designed to include both rf and
dc. Review of Scientific Instruments, 28(10):824–826.
Klein, H.-U., Baumgarten, C., Geisler, A., Heese, J., Hobl, A., Krischel, D., Schillo, M.,
Schmidt, S., and Timmer, J. (2005). New superconducting cyclotron driven scanning
proton therapy systems. Nuclear Instruments and Methods in Physics Research
Section B: Beam Interactions with Materials and Atoms, 241(1–4):721–726.
119
Knopf, A.-C., Boye, D., Lomax, A., and Mori, S. (2013). Adequate margin definition
for scanned particle therapy in the incidence of intrafractional motion. Physics in
medicine and biology, 58(17):6079–6094. PMID: 23939146.
Knopf, A.-C., Hong, T. S., and Lomax, A. (2011). Scanned proton radiotherapy for
mobile targets-the effectiveness of re-scanning in the context of different treatment
planning approaches and for different motion characteristics. Physics in medicine
and biology, 56(22):7257–7271. PMID: 22037710.
Kraus, K. M., Heath, E., and Oelfke, U. (2011). Dosimetric consequences of tumour motion due to respiration for a scanned proton beam. Physics in medicine and biology,
56(20):6563–6581. PMID: 21937770.
Krause, S., Beck, S., Schubert, K., Lissner, S., Hui, S., Herfarth, K., Debus, J., and
Sterzing, F. (2012). Accelerated large volume irradiation with dynamic Jaw/Dynamic
couch helical tomotherapy. Radiation oncology (London, England), 7:191. PMID:
23146914.
Kupelian, P., Willoughby, T., Mahadevan, A., Djemil, T., Weinstein, G., Jani, S., Enke,
C., Solberg, T., Flores, N., Liu, D., Beyer, D., and Levine, L. (2007). Multi-institutional
clinical experience with the calypso system in localization and continuous, real-time
monitoring of the prostate gland during external radiotherapy. International Journal
of Radiation Oncology*Biology*Physics, 67(4):1088–1098.
Lagendijk, J. J., Raaymakers, B. W., Raaijmakers, A. J., Overweg, J., Brown, K. J.,
Kerkhof, E. M., Put, R. W. v. d., Hårdemark, B., Vulpen, M. v., and Heide, U. A. v. d.
(2008). MRI/linac integration. Radiotherapy and Oncology, 86(1):25–29.
Lambert, J., Suchowerska, N., McKenzie, D. R., and Jackson, M. (2005). Intrafractional motion during proton beam scanning. Physics in Medicine and Biology,
50(20):4853–4862.
Langen, K. M. and Jones, D. T. L. (2001). Organ motion and its management. International Journal of Radiation Oncology*Biology*Physics, 50(1):265–278.
Lattanzi, J., McNeeley, S., Pinover, W., Horwitz, E., Das, I., Schultheiss, T. E.,
and Hanks, G. E. (1999). A comparison of daily CT localization to a daily
ultrasound-based system in prostate cancer. International Journal of Radiation Oncology*Biology*Physics, 43(4):719–725.
Lennox, A. J. (1989). Hospital-based proton linear accelerator for particle therapy and
radioisotope production. Nuclear Instruments and Methods in Physics Research Section B: Beam Interactions with Materials and Atoms, pages 1197–1200.
120
Leo, W. R. (1994). Techniques for Nuclear and Particle Physics Experiments: A How-To
Approach. Springer.
Lomax, A. (1999). Intensity modulation methods for proton radiotherapy. Physics in
Medicine and Biology, 44(1):185–205.
Mackie, T. R., Holmes, T., Swerdloff, S., Reckwerdt, P., Deasy, J. O., Yang, J., Paliwal,
B., and Kinsella, T. (1993). Tomotherapy: a new concept for the delivery of dynamic
conformal radiotherapy. Medical physics, 20(6):1709–1719. PMID: 8309444.
Maughan, R. L., Powers, W. E., and Blosser, H. G. (1994). A superconducting cyclotron
for neutron radiation therapy. Medical Physics, 21(6):779–785.
Mayahara, H., Murakami, M., Kagawa, K., Kawaguchi, A., Oda, Y., Miyawaki, D., Sasaki,
R., Sugimura, K., and Hishikawa, Y. (2007). Acute morbidity of proton therapy for
prostate cancer: The hyogo ion beam medical center experience. International Journal of Radiation Oncology*Biology*Physics, 69(2):434–443.
Merchant, T. E. (2013). Clinical controversies: proton therapy for pediatric tumors.
Seminars in radiation oncology, 23(2):97–108. PMID: 23473686.
Mevion Medical Systems (2012). Compact proton accelerator hits 250 MeV - MedicalPhysicsWeb. http://medicalphysicsweb.org/cws/article/research/
42731. Still River Systems achieves clinical beam extraction from its compact proton
accelerator.
Minohara, S., Kanai, T., Endo, M., Noda, K., and Kanazawa, M. (2000). Respiratory
gated irradiation system for heavy-ion radiotherapy*1. International Journal of Radiation Oncology*Biology*Physics, 47(4):1097–1103.
Mohan, R. and Bortfeld, T. (2011). Proton therapy: clinical gains through current and
future treatment programs. Frontiers of radiation therapy and oncology, 43:440–464.
PMID: 21625168.
Molière, G. (1948). Theorie der Streuung schneller geladener Teilchen II. Mehrfachund Vielfachstreuung. Zeitschrift für Naturforschung Teil A, 3:78–97.
Mori, S., Furukawa, T., Inaniwa, T., Zenklusen, S., Nakao, M., Shirai, T., and Noda, K.
(2013a). Systematic evaluation of four-dimensional hybrid depth scanning for carbonion lung therapy. Medical physics, 40(3):031720. PMID: 23464315.
Mori, S., Inaniwa, T., Furukawa, T., Zenklusen, S., Shirai, T., and Noda, K. (2013b).
Effects of a difference in respiratory cycle between treatment planning and irradiation for phase-controlled rescanning and carbon pencil beam scanning. The British
journal of radiology, 86(1028):20130163. PMID: 23833034.
121
Mori, S., Lu, H.-M., Wolfgang, J. A., Choi, N. C., and Chen, G. T. Y. (2009). Effects of interfractional anatomical changes on water-equivalent pathlength in charged-particle
radiotherapy of lung cancer. Journal of radiation research, 50(6):513–519. PMID:
19959880.
Negoro, Y., Nagata, Y., Aoki, T., Mizowaki, T., Araki, N., Takayama, K., Kokubo, M., Yano,
S., Koga, S., Sasai, K., Shibamoto, Y., and Hiraoka, M. (2001). The effectiveness
of an immobilization device in conformal radiotherapy for lung tumor: reduction of
respiratory tumor movement and evaluation of the daily setup accuracy. International
Journal of Radiation Oncology*Biology*Physics, 50(4):889–898.
Nihei, K., Ogino, T., Ishikura, S., Kawashima, M., Nishimura, H., Arahira, S., and
Onozawa, M. (2005). Phase II feasibility study of high-dose radiotherapy for prostate
cancer using proton boost therapy: first clinical trial of proton beam therapy for
prostate cancer in japan. Japanese journal of clinical oncology, 35(12):745–752.
PMID: 16314345.
Nill, S., Bortfeld, T., and Oelfke, U. (2004). Inverse planning of intensity modulated
proton therapy. Zeitschrift für medizinische Physik, 14(1):35–40. PMID: 15104008.
Nioutsikou, E., Seppenwoolde, Y., Symonds-Tayler, J. R. N., Heijmen, B., Evans, P.,
and Webb, S. (2008). Dosimetric investigation of lung tumor motion compensation
with a robotic respiratory tracking system: an experimental study. Medical physics,
35(4):1232–1240. PMID: 18491515.
Nordlund, K. and Djurabekova, F. (2012). Defect model for the dependence of breakdown rate on external electric fields. Physical Review Special Topics - Accelerators
and Beams, 15(7):071002.
Oelfke, U. and Bortfeld, T. (2003). Optimization of physical dose distributions with
hadron beams: comparing photon IMRT with IMPT. Technology in Cancer Research
& Treatment, 2(5):401–412.
Ohara, K., Okumura, T., Akisada, M., Inada, T., Mori, T., Yokota, H., and Calaguas,
M. J. (1989). Irradiation synchronized with respiration gate. International Journal of
Radiation Oncology*Biology*Physics, 17(4):853–857.
Paganetti, H. (2012). Proton therapy physics. Series in Medical Physics and Biomedical
Engineering. CRC Press, Taylor and Francis Group, Boca Raton, Fla.
Park, P. C., Cheung, J. P., Zhu, X. R., Lee, A. K., Sahoo, N., Tucker, S. L., Liu, W., Li, H.,
Mohan, R., Court, L. E., and Dong, L. (2013). Statistical assessment of proton treatment plans under setup and range uncertainties. International journal of radiation
oncology, biology, physics, 86(5):1007–1013. PMID: 23688812.
122
Park, P. C., Zhu, X. R., Lee, A. K., Sahoo, N., Melancon, A. D., Zhang, L., and Dong, L.
(2012). A beam-specific planning target volume (PTV) design for proton therapy to
account for setup and range uncertainties. International journal of radiation oncology,
biology, physics, 82(2):e329–336. PMID: 21703781.
Pedroni, E., Bacher, R., Blattmann, H., Böhringer, T., Coray, A., Lomax, A., Lin, S.,
Munkel, G., Scheib, S., and Schneider, U. (1995). The 200-MeV proton therapy
project at the paul scherrer institute: conceptual design and practical realization.
Medical Physics, 22(1):37–53.
Pedroni, E., Bearpark, R., Böhringer, T., Coray, A., Duppich, J., Forss, S., George, D.,
Grossmann, M., Goitein, G., Hilbes, C., Jermann, M., Lin, S., Lomax, A., Negrazus,
M., Schippers, M., and Kotle, G. (2004). The PSI gantry 2: a second generation
proton scanning gantry. Zeitschrift für medizinische Physik, 14(1):25–34. PMID:
15104007.
Peggs, S and Barton, D (2002). The rapid cycling medical synchrotron. In Proceedings
of the European Particle Accelerator Conference, pages 2754–6.
Phillips, M. H., Pedroni, E., Blattmann, H., Boehringer, T., Coray, A., and Scheib, S.
(1992). Effects of respiratory motion on dose uniformity with a charged particle scanning method. Physics in Medicine and Biology, 37(1):223–233.
Picardi, L., Bartolini, R., Silvestrov, G. I., Ronsivalle, C., Vsevolozskhaya, T., and Vignati, A. (1994). Preliminary design of a very compact protosynchrotron for proton
therapy.
Protom International, Inc. (2013). Protom - proton therapy technologies. http://www.
protominternational.com/.
PTCOG, Patientstatistics (2013). Particle Therapy Co-Operative Group (PTCOG).
Hadron Therapy Patient Statistics. http://ptcog.web.psi.ch/.
Raaymakers, B. W., Raaijmakers, A. J. E., and Lagendijk, J. J. W. (2008). Feasibility
of MRI guided proton therapy: magnetic field dose effects. Physics in medicine and
biology, 53(20):5615–5622. PMID: 18799829.
Rechner, L. A., Howell, R. M., Zhang, R., Etzel, C., Lee, A. K., and Newhauser, W. D.
(2012). Risk of radiogenic second cancers following volumetric modulated arc therapy and proton arc therapy for prostate cancer. Physics in medicine and biology,
57(21):7117–7132. PMID: 23051714.
Riboldi, M., Orecchia, R., and Baroni, G. (2012). Real-time tumour tracking in particle
therapy: technological developments and future perspectives. The lancet oncology,
13(9):e383–391. PMID: 22935238.
123
Robinson, A. P. L., Zepf, M., Kar, S., Evans, R. G., and Bellei, C. (2008). Radiation
pressure acceleration of thin foils with circularly polarized laser pulses. New Journal
of Physics, 10(1):013021.
Saito, N., Bert, C., Chaudhri, N., Gemmel, A., Schardt, D., Durante, M., and Rietzel,
E. (2009). Speed and accuracy of a beam tracking system for treatment of moving
targets with scanned ion beams. Physics in Medicine and Biology, 54(16):4849.
Sampayan, S. E., Caporaso, G. J., and Kirbie, H. C. (1998). Enhanced dielectric-wall
linear accelerator. CIB: H05H7/00; H05H9/00; (IPC1-7): H05H9/00.
Sandison, G. A., Papiez, E., Bloch, C., and Morphis, J. (1997). Phantom assessment of
lung dose from proton arc therapy. International journal of radiation oncology, biology,
physics, 38(4):891–897. PMID: 9240659.
Schell, S. and Wilkens, J. J. (2012). Dosimetric effects of energy spectrum uncertainties in radiation therapy with laser-driven particle beams. Physics in Medicine and
Biology, 57(5):N47.
Schillo, M., Geisler, A., Hobl, A., Klein, H. U., Krischel, D., Meyer-Reumers, M., Piel, C.,
Blosser, H., Kim, J.-W., Marti, F., Vincent, J., Brandenburg, S., and Beijers, J. P. M.
(2001). Compact superconducting 250 MeV proton cyclotron for the PSI PROSCAN
proton therapy project. AIP Conference Proceedings, 600:37–39.
Schippers, J. M. (2009). Beam delivery systems for particle radiation therapy: Current
status and recent developments. Reviews of Accelerator Science and Technology,
02(01):179–200.
Schippers, J. M. and Lomax, A. J. (2011). Emerging technologies in proton therapy.
Acta oncologica (Stockholm, Sweden), 50(6):838–850. PMID: 21767183.
Schlegel, W.and Bille, J. (2001). Medizinische Physik, volume 2. Springer, Berlin.
Schlegel, W. and Mahr, A. (2007). Multimedia DVD, 3D Conformal Radiation Therapy
- A multimedia introduction to methods and techniques 2nd revised and enhanced
edition. Springer Verlag Berlin Heidelberg New York.
Scholz, M. and Kraft, G. (1994). Calculation of heavy ion inactivation probabilities based
on track structure, x ray sensitivity and target size. Radiation Protection Dosimetry,
52(1-4):29–33.
Scholz, M. and Kraft, G. (1996). Track structure and the calculation of biological effects
of heavy charged particles. Advances in Space Research, 18(1–2):5–14.
124
Seco, J., Robertson, D., Trofimov, A., and Paganetti, H. (2009). Breathing interplay
effects during proton beam scanning: simulation and statistical analysis. Physics in
Medicine and Biology, 54(14):N283.
Seiler, P. G., Blattmann, H., Kirsch, S., Muench, R. K., and Schilling, C. (2000). A novel
tracking technique for the continuous precise measurement of tumour positions in
conformal radiotherapy. Physics in medicine and biology, 45(9):N103–110. PMID:
11008969.
Sengbusch, E., Pérez-Andújar, A., DeLuca, P M, J., and Mackie, T. R. (2009). Maximum proton kinetic energy and patient-generated neutron fluence considerations in
proton beam arc delivery radiation therapy. Medical physics, 36(2):364–372. PMID:
19291975.
Seppenwoolde, Y., Shirato, H., Kitamura, K., Shimizu, S., van Herk, M., Lebesque, J. V.,
and Miyasaka, K. (2002). Precise and real-time measurement of 3D tumor motion
in lung due to breathing and heartbeat, measured during radiotherapy. International
Journal of Radiation Oncology*Biology*Physics, 53(4):822–834.
Shah, A. P., Kupelian, P. A., Waghorn, B. J., Willoughby, T. R., Rineer, J. M., Mañon,
R. R., Vollenweider, M. A., and Meeks, S. L. (2013). Real-time tumor tracking in
the lung using an electromagnetic tracking system. International journal of radiation
oncology, biology, physics, 86(3):477–483. PMID: 23523325.
Shirato, H., Harada, T., Harabayashi, T., Hida, K., Endo, H., Kitamura, K., Onimaru,
R., Yamazaki, K., Kurauchi, N., Shimizu, T., Shinohara, N., Matsushita, M., DosakaAkita, H., and Miyasaka, K. (2003). Feasibility of insertion/implantation of 2.0-mmdiameter gold internal fiducial markers for precise setup and real-time tumor tracking in radiotherapy. International journal of radiation oncology, biology, physics,
56(1):240–247. PMID: 12694845.
Shirato, H., Seppenwoolde, Y., Kitamura, K., Onimura, R., and Shimizu, S. (2004).
Intrafractional tumor motion: lung and liver. Seminars in Radiation Oncology,
14(1):10–18. PMID: 14752729.
Siddon, R. L. (1985). Fast calculation of the exact radiological path for a threedimensional CT array. Medical Physics, 12(2):252–255.
Smeenk, R. J., Teh, B. S., Butler, E. B., van Lin, E. N., and Kaanders, J. H. (2010). Is
there a role for endorectal balloons in prostate radiotherapy? a systematic review.
Radiotherapy and Oncology, 95(3):277–282.
Smith, A. R. (2009). Vision 20/20: proton therapy. Medical physics, 36(2):556–568.
PMID: 19291995.
125
Sonke, J., Lebesque, J., and Herk, M. v. (2008). Variability of four-dimensional computed tomography patient models. International Journal of Radiation Oncology, Biology, Physics, 70(2):590–598.
Steiner, E., Georg, D., Goldner, G., and Stock, M. (2013). Prostate and patient intrafraction motion: Impact on treatment time-dependent planning margins for patients with
endorectal balloon. International Journal of Radiation Oncology*Biology*Physics,
86(4):755–761.
Sterzing, F., Schubert, K., Sroka-Perez, G., Kalz, J., Debus, J., and Herfarth, K. (2008).
Helical tomotherapy. experiences of the first 150 patients in heidelberg. Strahlentherapie und Onkologie: Organ der Deutschen Röntgengesellschaft ... [et al], 184(1):8–
14. PMID: 18188517.
Stroom, J. C., Koper, P. C., Korevaaar, G. A., van Os, M., Janssen, M., de Boer, H. C.,
Levendag, P. C., and Heijmen, B. J. (1999). Internal organ motion in prostate cancer
patients treated in prone and supine treatment position. Radiotherapy and Oncology,
51(3):237–248.
Takahashi, K., Purdy, J. A., and Liu, Y. Y. (1983). Work in progress: treatment planning
system for conformation radiotherapy. Radiology, 147(2):567–573. PMID: 6403972.
Timmermann, B., Lomax, A. J., Nobile, L., Grotzer, M. A., Weiss, M., Kortmann, R.-D.,
Bolsi, A., and Goitein, G. (2007). Novel technique of craniospinal axis proton therapy
with the spot-scanning system: avoidance of patching multiple fields and optimized
ventral dose distribution. Strahlentherapie und Onkologie: Organ der Deutschen
Röntgengesellschaft ... [et al], 183(12):685–688. PMID: 18040613.
Tobias, C. A., Lawrence, J. H., Born, J. L., McCombs, R. K., Roberts, J. E., Anger, H. O.,
Low-Beer, B. V. A., and Huggins, C. B. (1958). Pituitary irradiation with high-energy
proton beams a preliminary report. Cancer Research, 18(2):121–134.
van Goethem, M. J., van der Meer, R., Reist, H. W., and Schippers, J. M. (2009). Geant4
simulations of proton beam transport through a carbon or beryllium degrader and
following a beam line. Physics in medicine and biology, 54(19):5831–5846. PMID:
19741273.
Varian Medical Systems (2012). Varian medical systems | oncology, x-ray & inspection
equipment. http://www.varian.com/.
http://www.varian.com/us/
oncology/treatments/treatment_techniques/rapidarc/.
Varian medical systems (2008).
RapidArc.
126
Weber, U., Becher, W., and Kraft, G. (2000). Depth scanning for a conformal ion beam
treatment of deep seated tumours. Physics in Medicine and Biology, 45(12):3627.
Wilks, R. J. and Bliss, P. (2002). The use of a compensator library to reduce dose
inhomogeneity in tangential radiotherapy of the breast. Radiotherapy and oncology:
journal of the European Society for Therapeutic Radiology and Oncology, 62(2):147–
157. PMID: 11937241.
Wilks, S. C., Langdon, A. B., Cowan, T. E., Roth, M., Singh, M., Hatchett, S., Key,
M. H., Pennington, D., MacKinnon, A., and Snavely, R. A. (2001). Energetic proton
generation in ultra-intense laser–solid interactions. Physics of Plasmas, 8(2):542–
549.
Willoughby, T. R., Kupelian, P. A., Pouliot, J., Shinohara, K., Aubin, M., Roach, Mack,
r., Skrumeda, L. L., Balter, J. M., Litzenberg, D. W., Hadley, S. W., Wei, J. T., and
Sandler, H. M. (2006). Target localization and real-time tracking using the calypso
4D localization system in patients with localized prostate cancer. International journal
of radiation oncology, biology, physics, 65(2):528–534. PMID: 16690435.
Wolf, R. and Bortfeld, T. (2012). An analytical solution to proton bragg peak deflection in a magnetic field. Physics in medicine and biology, 57(17):N329–337. PMID:
22892827.
Wong, J. W., Sharpe, M. B., Jaffray, D. A., Kini, V. R., Robertson, J. M., Stromberg,
J. S., and Martinez, A. A. (1999). The use of active breathing control (ABC)
to reduce margin for breathing motion. International Journal of Radiation Oncology*Biology*Physics, 44(4):911–919.
Yan, Y., Song, Y., and Boyer, A. L. (2002). An investigation of a video-based patient
repositioning technique. International journal of radiation oncology, biology, physics,
54(2):606–614. PMID: 12243841.
Zenklusen, S. M., Pedroni, E., and Meer, D. (2010). A study on repainting strategies
for treating moderately moving targets with proton pencil beam scanning at the new
gantry 2 at PSI. Physics in Medicine and Biology, 55(17):5103–5121.
Zhang, Y., Boye, D., Tanner, C., Lomax, A. J., and Knopf, A. (2012). Respiratory
liver motion estimation and its effect on scanned proton beam therapy. Physics in
medicine and biology, 57(7):1779–1795. PMID: 22407290.
127
List of Figures
2.1.1
2.2.1
2.2.2
2.2.3
2.3.1
2.3.2
2.3.3
2.4.1
2.4.2
2.5.1
.
.
.
.
.
.
.
.
.
.
6
10
11
12
14
16
18
19
21
26
3.1.1 Schematic drawing of previous versions of TULIP designs . . . . . . .
3.1.2 Drawing of the most recent TULIP design . . . . . . . . . . . . . . . .
38
39
Initial σ0 and FWHMs for increasing proton energies . . . . . . . . . .
Tulip dose calculation flow chart . . . . . . . . . . . . . . . . . . . .
Transversal view of the CT of Phantom1 . . . . . . . . . . . . . . . .
Rotational dose delivery with TULIP . . . . . . . . . . . . . . . . . .
TuDoCa evaluation: histograms . . . . . . . . . . . . . . . . . . . . .
TuDoCa evaluation: depth dose profiles for 3DSS . . . . . . . . . . . .
TuDoCa evaluation: dose distributions for 3DSS . . . . . . . . . . . .
TuDoCa evaluation: depth dose profiles for static rotational delivery . .
TuDoCa evaluation: dose distributions for static rotational delivery . . .
Effect of submillimeter IC on the dose distribution for dynamic rotational
delivery . . . . . . . . . . . . . . . . . . . . . . . . . . . . . . . . .
Effect of submillimeter IC shift on the dose distribution for DET . . . . .
Gantry positions for dynamic rotational dose delivery with TULIP . . . .
Dvhs for rotational dynamic dose delivery without a fixed angular step .
Comparison of dose distributions for 3D spot scanning and dynamic rotational delivery . . . . . . . . . . . . . . . . . . . . . . . . . . . . .
Dose profiles for 3D spot scanning and rotational delivery . . . . . . .
CT views for 3DSS patient cases. . . . . . . . . . . . . . . . . . . .
43
46
48
49
52
53
54
55
56
4.1.1
4.1.2
4.1.3
4.1.4
4.1.5
4.1.6
4.1.7
4.1.8
4.1.9
4.1.10
4.1.11
4.2.1
4.2.2
4.2.4
4.2.5
4.2.6
Schematic drawing of depth dose curves for protons and Carbon ions
Schematic drawing of a cyclotron . . . . . . . . . . . . . . . . . . .
Design of a single room proton therapy facility by Mevion . . . . . .
Schematic drawing of a synchrotron . . . . . . . . . . . . . . . . .
Schematic drawing of laser acceleration . . . . . . . . . . . . . . .
Schematic drawing of a dielectric wall accelerator (DWA). . . . . . .
Schematic drawing of a cyclinac taken from . . . . . . . . . . . . . .
Passive beam delivery . . . . . . . . . . . . . . . . . . . . . . . .
Active beam scanning . . . . . . . . . . . . . . . . . . . . . . . .
Schematic drawing of interplay effects . . . . . . . . . . . . . . . .
I
58
59
65
68
70
71
75
4.2.7
4.2.8
4.2.9
4.2.10
Inclusive dvhs for 3D spot scanning irradiation of the spine sarcoma
Dose distribution for craniospinal irradiation with TULIP . . . . . . .
Inclusive dvhs for 3D spot scanning irradiation of the prostate . . .
Dose distributions for a lung patient for different BDRs . . . . . . .
5.2.1
5.2.2
5.2.3
5.2.4
5.2.5
5.3.1
Process flow of 4D dose delivery simulation software I . . . . . . . . . 87
Process flow of 4D dose delivery simulation software II . . . . . . . . . 88
Measured motion data and correlated CT phases . . . . . . . . . . . . 90
Motion parameter values for the individual patients . . . . . . . . . . . 92
CT views of lung and liver patients . . . . . . . . . . . . . . . . . . . 93
DVHs showing the magnitude of the effect of tumor motion during irradiation on the dose . . . . . . . . . . . . . . . . . . . . . . . . . . . . 97
Dose distribution for the lung tumor of patient LU2 . . . . . . . . . . . 98
Dose distribution for the static and moving liver tumor of patient LI . . . 98
DVHs for rescanning with TULIP . . . . . . . . . . . . . . . . . . . . 101
DVHs for rescanning with TULIP for liver patient LI . . . . . . . . . . . 102
DVHs for rescanning with TULIP . . . . . . . . . . . . . . . . . . . . 103
5.3.2
5.3.3
5.3.4
5.3.5
5.3.6
II
.
.
.
.
.
.
.
.
76
77
78
82
List of Tables
3.1.1 TULIP design parameters . . . . . . . . . . . . . . . . . . . . . . . .
37
4.1.1
4.1.2
4.1.3
4.1.4
4.2.1
4.2.2
4.2.3
44
48
51
58
63
64
4.2.4
4.2.5
4.2.6
4.2.7
4.2.8
4.2.9
4.2.10
Patient and beam specific input data and parameters for TuDoCa . . . .
Cylindrical phantom ’Phantom1’ CT data . . . . . . . . . . . . . . . .
Evaluation of dose algorithm: results . . . . . . . . . . . . . . . . . .
Influence of relative isocenter shift on the dose distributions: results . .
CT data for cylindrical phantom and lung patient A . . . . . . . . . . .
Parameter combinations for dynamic and static dose delivery with TULIP
Dosimetric results for rotational dynamic and 3D spot scanning dose
delivery with TULIP . . . . . . . . . . . . . . . . . . . . . . . . . . .
Results with regard to time for rotational dynamic and 3D spot scanning
dose delivery with TULIP . . . . . . . . . . . . . . . . . . . . . . . .
Patient data for 3D spot scanning dose delivery simulation study . . . .
TULIP specific beam delivery parameters . . . . . . . . . . . . . . . .
Results for 3D spot scanning dose delivery with TULIP . . . . . . . . .
Irradiation time for 3D spot scanning dose delivery with TULIP . . . . .
Patient Data for studying the influence of BDRs on the dose . . . . . .
Influence of breakdowns on the dose . . . . . . . . . . . . . . . . . .
5.2.1
5.2.2
5.2.3
5.2.4
5.2.5
5.3.1
5.3.2
66
66
74
74
76
78
80
81
CT acquisition steps . . . . . . . . . . . . . . . . . . . . . . . . . . 89
Patient motion parameter values . . . . . . . . . . . . . . . . . . . . 91
CT data for lung and liver patients . . . . . . . . . . . . . . . . . . . 93
Treatment planning data for lung and liver patients . . . . . . . . . . . 94
TULIP specific beam delivery parameters . . . . . . . . . . . . . . . . 94
Results for 4D spot scanning dose delivery . . . . . . . . . . . . . . . 97
Irradiation times for 3D spot scanning dose delivery to moving tumors
with TULIP . . . . . . . . . . . . . . . . . . . . . . . . . . . . . . . 99
5.3.3 Results for 4D rescanning dose delivery with TULIP . . . . . . . . . . 100
5.3.4 Irradiation times for 4D rescanning dose delivery with TULIP . . . . . . 100
III
Acknowledgments
First, I want to express my gratitude to my supervisor Prof. Dr. Uwe Oelfke for giving
me the opportunity to work at the German Cancer Research Center and for supporting
me and my individual interests throughout my thesis.
I thank Prof. Dr. Wolfgang Schlegel for acting as a second referee and for constantly
providing support, whenever needed. I am grateful for a friendly and nice working environment in the department of Medical Physics in Radiationtherapy supported by Prof.
Schlegel.
I am very grateful to Prof. Dr. Ugo Amaldi, who had the idea for the TULIP project
and thus made this work possible. Special thanks go also to the entire TERA group at
CERN (Switzerland) who supported me throughout this work with fruitful discussions
and a nice working environment.
Dr. Simeon Nill I wish to thank for his outstanding support and active help throughout the entire time I spent at the German Cancer Research Center.
VI


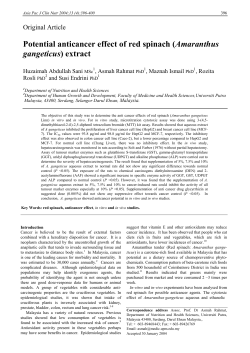
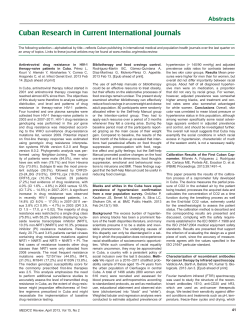


© Copyright 2026