
The health outcome of the Fukushima catastrophe
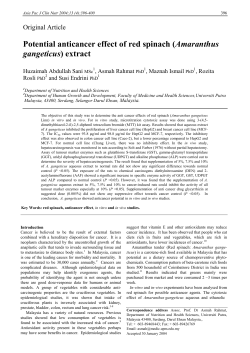
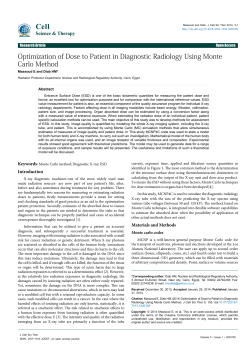
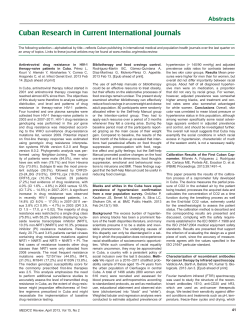
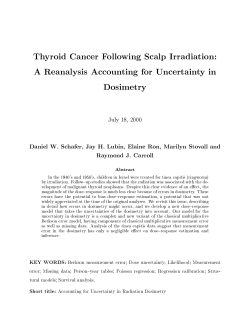
The health outcome of the Fukushima catastrophe
Initial analysis from risk model of the
European Committee on Radiation Risk, ECRR
Chris Busby
Green Audit
Aberystwyth UK
30th March 2011
Assumptions and methodology
The radiation risk model of the European Committee on Radiation Risk is described
in ECRR2010. It differs from the model currently employed by radiation protection
agencies which are based on the recommendations of the International Commission
on Radiological Protection ICRP. The latter ICRP model deals with radiation
exposure from all sources in the same way, as if it were external to the body, and
averages the dose to the body as if it were uniform across tissues more massive than 1
kilogram. The ICRP model then takes this dose and multiplies it by a risk factor for
cancer based on the cancer yield at high acute doses of the Japanese populations of
Hiroshima and Nagasaki who have been studied since 1952. This method cannot
apply to internal doses from radioactive substances, called radionuclides, which have
been inhaled or ingested in food or water. This is because these substances have
varying affinities for DNA and different parts of the body and can deliver very high
energy to local tissue. The ICRP method cannot be applied to inhaled or ingested hot
particles, which are solid but microscopic and can lodge in tissue delivering high
doses to local cells. There is a great deal of evidence that exposure to internal
radionuclides is up to 1000 times more harmful than the ICRP model concludes.
The ECRR risk model deals with this issue by adding hazard enhancement weighting
factor to the doses calculated for internal radionuclide or particle exposures.
Collective Dose
Up until recently the ICRP model employed a system known as collective dose. This
enabled calculation of the cancer yield following an exposure to a known population
of some given dose. The individual dose to a representative individual was calculated
and that was then multiplied by the population at risk. This gave the collective dose.
This number could then be multiplied by the cancer risk factor to obtain the cancer
yield. The ICRP abandoned this method, although it is quite a sensible approach. The
reason was that (a) it was felt to be politically embarrassing and (b) the ICRP risk
model was conceded to be strictly invalid for internal exposures since the uncertainty
was as high as 500-fold or more for certain internal radionuclide exposures. This
followed many studies of the effects of the Chernobyl Catastrophe which showed
much higher cancer yields than had been predicted by the ICRP model.
Calculating risk by ECRR method.
In order to properly apply the ECRR risk model to the Fukushima catastrophe it is
necessary to know:
1. the doses from each of the radionuclides emitted or some way of assessing
these
2. the population exposed
Since information about the concentrations of the different radionuclides which are
contaminating the areas near the plant is not yet available, a strictly formal application
of the ECRR model is not yet possible.
However it is possible to make some assumptions which will give a reasonable
idea of the health consequences of the exposures based on the ECRR approach.
There are two approaches to approximating internal dose which both give
approximately the same result. I can calculate the area contamination on the basis of
the gamma radiation dose rate. I can also employ the reports of the International
Atomic Energy Agency IAEA of contamination level at various distances from the
release point. I will then assume that the internal ICRP dose is equal to the external
reported dose, or that obtained by calculating the dose rate over an infinite flat plane
contaminated with the isotope Cs-137. This can be done using the USA EPA FGR12
Part 2 or the graph of the HRP 1971 shown below in Fig 1.
Fig 1 Exposure rate over a plane source which can be used to determine either the
source contamination level given the dose rate or the dose rate given the source
contamination. (HRP 1971). Conversion factors: One Curie Ci = 37GBq or 37 x 109
Becquerel. Can assume that 1 Roentgen = 1 Rem = 10mSv.
Table 1 shows the contamination in Bqm-2 (Becquerels per square metre) from a flat
uniformly contaminated plane with material emitting one photon of energy 660keV
(0.66Mev) approximately the energy of a Caesium-137 emission. The Iodine-131
emission is of lower energy, 365keV and so the contamination would be higher if this
energy were used for the calculation.
Table 1. Contamination of surface based on gamma dose rate1 metre above ground
(or gamma dose rate based on contamination of surface. Assumes photon energy of
660keV (Cs-137).
Gamma dose rate µSv/h
1
5
10
20
50
100
1000 (1mSv/h)
10,000 (10mSv/h)
Surface contamination MBqm-2
0.308
1.54
3.08
6.16
15.4
30.8
308
3080 (3.08 GBq)
This method was applied to the results of the study of Tondel et al 2004 in Sweden
who found 11% increase for 100kBqm-2 surface contamination. It almost exactly
predicted what these researchers found. These researchers carried out regressions to
correlate cancer increases with area contamination by Cs-137 and other radionuclides
from Chernobyl. The error factor relating the ICRP risk model, which employs
external radiation, was upwards of 600-fold. Of course, this was an external dose rate
based on contamination that was used by Tondel et al and obtained from the Swedish
authorities i.e. the contamination was measured, not the external dose rate. In the case
of Fukushima, there are dose rate measurements reported but also some surface
contamination reports from the IAEA. We now briefly address the contamination and
dose rates reported up to 30th March.
Radiation exposure near Fukushima
There are a number of sources of information, but for the purposes of this study we
employ the official data from the Japanese MEXT Ministry
(www.mext.go.jp/english/radioactivity_level/detail/1303986.htm ) and from the IAEA
bulletins. The data from MEXT is reported for areas near the Fukushima plant and
also for other prefectures. The MEXT map showing measured dose rates near the
Fukushima plant for 16/17 March is reproduced in Fig 2. This is an example and
includes my handwritten values for dose rates copied from the March 16 and 17th
bulletins. Means and standard deviations for dose rate values from the sequential
reports from March 16th to March 29th are given in Table 2 for different distance
zones. As in the case of Chernobyl, the contamination is not uniform and the
measurements are also patchy.
The measurements of surface contamination have been reported by the IAEA in
various bulletins. Their results are given in Table 3.
Fig 2 External dose rates in Fukushima prefecture March 16/17th 2011 µSv/h
Table 2 Mean dose rates µSv/h and mean contamination (MBqm-2) reported from 16th
to 29th March 2011 at various distanced from the nuclear site at Fukushima (Soma).
SD is standard deviation; N is number of readings. Data from MEXT. (www.mext.jp)
Distances
0-20km 16/17 March
20-30km 16/17 March
30-50km 16/17 March
30-50km 29 March
50-70km 29 March
Mean rate
measured
µSv/h
14.3
11.9
15.1
6.42
1.6
SD
N
19.9
18.8
5.9
9.7
1.0
17
39
9
18
3
MBqm-2
contamination
deduced
4.4
3.7
4.7
1.9
0.9
Table 3 Surface beta gamma contamination, gamma dose rates in statements from
16th March to 29th March from the International Atomic Energy Agency, IAEA
IAEA
bulletin
date
17th
March
Area/
contam/ dose
Statement
30km
In some locations at around 30 km from the Fukushima plant, the
dose rates rose significantly in the last 24 hours (in one location
from 80 to 170 microsievert per hour and in another from 26 to 95
microsievert per hour). But this was not the case at all locations at
this distance from the plants.
Dose rates to the north-west of the nuclear power plants, were
observed in the range 3 to 170 microsievert per hour, with the
higher levels observed around 30 km from the plant.
20th
March
150km/
Tokyo
21 March
200km
2-160µSv/h
0.2-0.9MBq
22 March
23 March
68km
0.8-9.1µSv/h
0.08-0.9MBq
30-73km
0.2-6.9µSv/h
0.02-0.6MBq
24 March
34-73km
0.6-6.9µSv/h
0.04-0.4MBq
Dose rates in other directions are in the 1 to 5 microsievert per hour
range.
The IAEA radiation monitoring team took additional measurements
yesterday between Tokyo and locations up to 150 km from the
Fukushima site. Dose rates were typically a few microsieverts per
hour compared to a typical background level of around 0.1
microsieverts per hour.
As I reported yesterday, the IAEA radiation monitoring team took
measurements at distances from 56 to 200 km from the Fukushima
nuclear power plant. At two locations in Fukushima Prefecture
gamma dose rate and beta-gamma contamination measurements
have been repeated. These measurements showed high beta-gamma
contamination levels.
The dose-rate results ranged from 2-160 microsieverts per hour,
which compares to a typical natural background level of around 0.1
microsieverts per hour. High levels of beta-gamma contamination
have been measured between 16-58 km from the plant. Available
results show contamination ranging from 0.2-0.9 MBq per square
metre.
The IAEA took measurements at additional locations between 35 to
68 km from the Fukushima plant. The dose-rate results ranged from
0.8 to 9.1 microsieverts per hour. The beta-gamma contamination
measurements ranged from 0.08 to 0.9 MBq per square metre .
The IAEA radiation monitoring team took additional measurements
at distances from 30 to 73 km from the Fukushima nuclear power
plant. Results from gamma dose-rate measurements in air ranged
from 0.2 to 6.9 microsievert per hour. The beta-gamma
contamination measurements ranged from 0.02 to 0.6
Megabecquerel per square metre.
The IAEA radiation monitoring team made additional
measurements at distances from 21 to 73 km from the Fukushima
nuclear power plant. At distances between 34 and 73 km, in a
westerly direction from the site, the dose rate ranged from 0.6 to 6.9
microsievert per hour. At the same locations, results of beta-gamma
contamination measurements ranged from 0.04 to 0.4
Megabecquerel per square metre At distances between 30 and 32
30-32km NW
16-59µSv/h
3.8-4.9MBq
27th
March
30-41km
0.9-17µSv/h
kilometers from the Fukushima Nuclear Power Plant, in a north
westerly direction from the site, dose rates between 16 and 59
microsievert per hour were measured. At these locations, the results
of beta-gamma contamination measurements ranged from 3.8 to 4.9
Megabecquerel per square metre. At a location of 21 km from the
Fukushima site, where a dose rate of 115 microsieverts per hour was
measured, the beta-gamma contamination level could not be
determined.
The second team made additional measurements at distances of 30
to 41 km from the Fukushima nuclear power plant. At these
locations, the dose rates ranged from 0.9 to 17 microsievert per
hour. At the same locations, results of beta-gamma contamination
measurements ranged from 0.03 to 3.1 Megabecquerel per square
metre.
Exposure in Prefectures
Values of exposures in prefectures is also available from the MEXT Ministry website
in the form of graphs of dose rate. These have been reduced to mean dose rates and
are given in Table 4 for prefectures local to the catastrophe. An example for Ibaraki
Prefecture is give in Fig 3.
Table 4 Rates of exposure in selected prefectures from 16th to 29th March with
deduced surface contamination. Background is assumed to be 0.04µSv/h
Prefecture
Dose rate µSv/h
Ibaraki
Yamagata
Tochigi
Tokyo
Gunma
Saitama
0.35
0.1
0.2
0.1
0.1
0.1
Deduced surface
contamination
kBq/m-2
95
18
50
18
18
18
Fig 3. Dose rates in Ibaraki prefecture as displayed on MEXT website
Comparison of the IAEA statements and the MEXT measurements with our
calculations of area contamination show that all the measurements and calculations
roughly agree though the contamination levels deduced from the dose rates are much
higher than those reported by the IAEA. I will assume that the method can be used to
determine the area contamination for those areas where no surface contamination
levels have been reported. I will employ the Tondel et al 2004 published regression
coefficient of 11% increase in cancer (all cancers) per 100kBqm-2 to predict the 10year cancer yield. I will assume for the calculation that the exposure is for 365 days.
To establish the total cancer increase we will require the populations involved.
Populations
Using data from the Japanese census, it is possible to establish the approximate
populations at risk. Fig 2 shows the population density in areas defined by a 100km
and 200km radius. Assuming mean population densities given by the shadings the
population at risk can be calculated using mass planimetry (cutting out with scissors
and weighing on a chemical balance) Results are given in Table 4
Fig 4 Population density, Japan Prefectures 2005
Table 5 Populations and areas within 100 and 200km rings for the purposes of
calculating collective doses and cancer increases.
Locality
100km radius land area
100 - 200km radius land annulus
Population
3,338,900
7,874,600
Cancer excess in 100km population
This is an extremely conservative set of assumptions. On the basis of the
measurements and arguments above, I assume the 100km radius is contaminated
uniformly to 600kBqm-2. The dose associated with this level of contamination is
2 µSv/h. Assuming that no one moves away and that the contamination remains at
this level, using the Tondel et al 2004 regression coefficient of 11% cancer increase
per 100kBqm-2 and assuming the same spectrum of radionuclides and pathways for
exposure the cancer increase in the 100km population is 66% and these cancers will
be manifest in the next ten years.
The cancer rate for all malignancies in the Japanese population is 462 per
100,000 per year. Therefore the annual number of cancers in the 3,388,900 population
of the 100km radius is 15,656. In ten years there will be 156,560 cancers normally if
this 2005 rate is maintained plus an extra 66% of this number diagnosed from
Fukushima that is 103,329 extra cancers due to the Fukushima exposures.
The annual dose from this contamination can be calculated in mSv. If we assume 365
days and 24 hour a day exposures then for 2 µSv/h the annual dose is 17mSv. The
population is 3,338,900 so the collective dose is 56,761 person Sieverts. The ICRP
absolute cancer risk factor is 0.05 per Sievert. Thus the ICRP predicts 2838 extra
cancers in this population from the Fukushima fallout.
Given that the ICRP predicted excess cancers will probably appear in the next
10 years, they will not be measurable above the normal rate unless they are rare
cancers. Examples are leukaemia in children or thyroid cancer.
The ECRR absolute risk method cannot be formally used unless we know the
individual radionuclide exposures. However it can be used if we approximate that 1/3
of the dose is internal and that 1/3 of the internal dose carries a weighting of 300
(which was the overall weighting factor obtained from the weapons test fallout
spectrum of radionuclides epidemiology). Then the annual internal dose is 5.6mSv
and 1/3 of this is 1.9mSv which we weight at 300. The total ECRR dose is thus
575mSvECRR. The collective dose is then 3,338,900 x 575 x 10-3 to give 1,919,867
person Sieverts and a lifetime (50 year) cancer yield of 191,986 extra cancers
assuming the ECRR risk factor of 0.1 per Sievert ECRR. Given the different time
frames, these numbers obtained from the Tondel et al 2004 regression and the ECRR
absolute model based on the atmospheric test cancer yields in Wales and England are
in reasonable agreement.
The three predictions are given in Table 5
Table 5. The predicted cancer increases in the 100km zone near the Fukushima site
Model
ICRP
Cancer yield
2838
ECRR Tondel
103,329
ECRR absolute
191,986
Note, assumptions
In 50 years, based on collective doses at
exposure of 2 µSv/h for one year
In ten years following the catastrophe, based on
surface contamination only
In 50 years, based on collective doses at
exposure of 2 µSv/h for one year; probably half
of these expressed in the first ten years.
Cancer excess in 200km annulus population
The methods employed above may be extended to the 200km annulus if the
contamination levels are known. Presently no data is available of contamination in
these areas although dose rates are available. NOAA Computer modelling carried out
by us and published on the internet (www.llrc.org) and elsewhere suggest that the
plumes from the catastrophe have travelled south over the highly populated areas
shown in Fig4. Dose rates have been published for these areas and from these dose
rates it can be assumed that significant exposures have occurred. From Table 4 and
Fig 3 we can assume that the exposures are of the order of 1 µSv/h with associated
contamination levels. Therefore the methods employed for the 100km area may be
extended to the 200km area. The population is, however, much greater at 7,874,600.
The results are given in Table 6.
Table 6. The predicted cancer increases in the 100-200km zone near the Fukushima
site
Model
ICRP
Cancer yield
3320
ECRR Tondel
120,894
ECRR absolute
224,623
Note, assumptions
In 50 years, based on collective doses at
exposure of 2 µSv/h for one year
In ten years following the catastrophe, based on
surface contamination only
In 50 years, based on collective doses at
exposure of 2 µSv/h for one year; probably half
of these expressed in the first ten years.
Other areas and some caveats.
First, it should be clear that the surface contamination calculated from the gamma
dose rates is twice to three times the highest level referred to by the IAEA in their
bulletins. It is clear that the authorities do not reveal the full picture; something which
also occurred following Chernobyl. I note that the IAEA stated that the maximum
level was 0.9MBqm-2. Was this because above 1MBq there would have had to have
been some consequent action? The lower IAEA level has been used for the cancer
risk calculation where the Tondel method was employed and the conservative low
dose of 2 µSv/h for the absolute risk methods. But it is clear that the doses are much
higher than this in the 100km zone, mostly between 6 and 14 µSv/h. They are
particularly high to the North West out to 60km. Again, this is about twice to three
times the dose rate we have used. Therefore the overall cancer yield is likely to also
be twice to three times as high. But there is a problem. The ECRR risk model
assumed a biphasic dose response relationship, and so there is linearity of risk only
over the low dose region.
For the high exposures modelled here there will be significant saturation, that is the
proportionate cancer risk will fall as the dose increases. This is for a number of
reasons but partly because there will be competing causes of early death.
Second, it must be understood that unlike ICRP, the ECRR model does not only
model cancer. Studies of populations exposed internally show that a wide spectrum of
diseases and conditions follow; these include heart disease, diabetes, and all the
normal conditions and illnesses that contribute to mortality and morbidity. In addition,
studies of nuclear Test veterans, Chernobyl-affected populations and those exposed to
Uranium show us that alarming increases in congenital disease in children and
grandchildren are to be expected. The ECRR2010 report should be studied for details.
Third, these predictions are based on the assumption that the population will remain in
the 100km zone for one year. If they are evacuated inside one month, the yield will be
much less, though not in proportion to the period of exposure since it is clear that the
initial exposures were high and with weathering and decays the exposures will
become less as time goes on.
The predictions for other areas can be scaled according to the exposures given in
Table 4. It must be understood that although the doses and assumed contamination is
lower in these prefectures, the populations are enormous, and therefore the cancer and
health detriment yield will also be very great.
Finally, all these predictions are based on the assumption that the spectrum of internal
exposures is the same as weapons test fallout (ECRR Absolute) or Chernobyl Sweden
(Tondel). There may be more uranium and/or plutonium in the Fukushima spectrum
and this may affect the risk by increasing it. They are also based on the contamination
reports to date and will have to be altered when the more accurate reports become
available or if there is further contamination.
Conclusions and recommendations
1. The ECRR risk model has been applied to the 3 million people living in the
100km radius of the Fukushima catastrophe. Assuming these people remain
living there for one year the number of excess cancers predicted by the method is
approximately 200,000 in the next 50 years with 100,000 being diagnosed in the
next 10 years. If they are evacuated immediately, the number will fall by a
significant amount. For those 7 million living between 100km and 200km from
the site, the predicted number of cancers is slightly greater with 220,000 extra
cancers in the next 50 years and about 100,000 being expressed in the next ten
years. These predictions are based on the ECRR risk model and also the findings
of cancer risk on Sweden after the Chernobyl accident.
2. The ICRP model predicts 2838 extra cancers in the 100km population. The
eventual yield will therefore be another test of the two risk models.
3. Calculations based on official gamma dose rates published by the Japanese
Ministry MEXT can be used to back calculate surface contamination at the
positions of the measurements using accepted scientific methods. The results
show that the IAEA reports have significantly under reported the contamination
levels.
4. It is recommended that urgent attention is given to making isotope specific
ground contamination measurements.
5. It is recommended that populations living within the 100km zone to the North
West of the site are immediately evacuated and the zone is made an exclusion
zone.
6. The ICRP risk model should be abandoned and all political decisions should
be made on the basis of the recommendations of the European Committee on
Radiation Risk www.euradcom.org
7. Investigation and legal sanctions should be brought against those who
knowingly held back data from the public.
8. Investigation and legal sanctions should be brought against those minimising
the health effects of this event in the media.
References
ECRR2010 The 2010 Recommendations of the European Committee on Radiation
Risk. Edited by Chris Busby, Rosalie Bertell, Alexey Yablokov, Inge Schmitz
Feuerhake and Molly Scott Cato. Brussels: ECRR; available from www.euradcom.org
Tondel Martin, Lindgren Peter, Hjalmarsson Peter, Hardell Lennart and Persson
Bodil, (2006) Increased incidence of malignancies in Sweden after the Chernobyl
accident, American Journal of Industrial Medicine, (49), 3, 159-168.
Tondel M, Hjalmarsson P, Hardell L, Carisson G and Axelson A (2004) Increase in
regional total cancer incidence in Northern Sweden. J Epidemiol. Community Health.
58 1011-10


© Copyright 2026