
Evaluation of the suppressive effect of intermittent aeration on nitrite
W 15007 Examensarbete 30 hp Februari 2015 Evaluation of the suppressive effect of intermittent aeration on nitrite-oxidising bacteria in a mainstream nitritation-anammox process Amanda Okhravi ABSTRACT Evaluation of the suppressive effect of intermittent aeration on nitrite-oxidising bacteria in a mainstream nitritation-anammox process Amanda Okhravi An alternative to conventional removal of nitrogen through autotrophic nitrification and heterotrophic denitrification is autotrophic nitritation-anammox. The anammox bacteria oxidise ammonium directly to nitrogen gas with nitrite as an electron acceptor. Total autotrophic removal of nitrogen in the mainstream would bring wastewater treatment plants closer to being energy self-sufficient as it would allow for a significant reduction of aeration and an increased chemical oxygen demand reduction in the pre-treatment. An increased chemical oxygen demand reduction by mechanical treatment would potentially generate a greater biogas yield in the subsequent anaerobic digestion of the sludge. Nitritation-anammox processes have been successfully implemented over the world for treatment of ammonium rich sludge liquor of higher temperatures, while the feasibility of a mainstream implementation is still under evaluation. Lower ammonium concentrations, lower operating temperatures and better effluent quality represent the main challenges considering this energy autarkic treatment technique. Terminating nitrification at nitritation, i.e. favouring ammonia-oxidising bacteria while supressing nitrite-oxidising bacteria, is vital for a functioning nitritation-anammox process. This study aims to evaluate the suppressive effect of intermittent aeration on nitriteoxidising bacteria while sustaining anammox activity by ex-situ batch tests in a pilot-scale moving bed biofilm reactor at Sjölunda Wastewater Treatment Plant in Malmö, Sweden. The pilot plant consists of one reactor treating sludge liquor and two mainstream reactors, connected in series, receiving effluent from a high-loaded activated sludge plant. The batch test showed a slight decrease of nitrite-oxidising bacteria activity when the reactors were intermittently aerated. Some loss in activity is expected as oxygen supply is decreased when aeration is switched from continuous to intermittent. Furthermore, the decrease coincided with an increased organic carbon loading favouring fast growing heterotrophic bacteria. The decrease in nitrite-oxidising bacteria activity can thereby be coupled with an increased competition for dissolved oxygen and space with heterotrophic bacteria. The suppression of nitrite-oxidising bacteria was not selective as results indicate a decrease in ammonia-oxidising bacteria activity as well. The nitrogen removal rate was decreased during the study while the potential anammox activity was stable in the mainstream and increased in the sludge liquor reactor. This indicates that the anammox bacteria are not hampered but rather that the availability of nitrite, i.e. the activity of ammonia-oxidising bacteria, is the limiting factor of the process. Keywords: Activity tests, anammox, AOB, Manammox, nitritation, NOB, OUR. Water and Environmental Engineering, Department of Chemical Engineering, Lund University, P.O. Box 124, SE-221 00 Lund, Sweden. i REFERAT Utvärdering av den hämmande effekten av intermittent luftning på nitritoxiderande bakterier i en huvudströmsnitritation-anammoxprocess Amanda Okhravi Ett alternativ till konventionell kväverening via autotrof nitrifikation och heterotrof denitrifikation är autotrof nitritation-anammox. Anammoxbakterien oxiderar ammonium direkt till kvävgas med nitrit som elektronacceptor. Fullständigt autotrof kväverening skulle föra avloppsreningsverk närmare ett självförsörjande energiläge då luftningsbehovet minskas signifikant och en ökad reduktion av organiskt kol via mekanisk rening skulle möjliggöras. Den ökade reduktionen av organiskt kol ger potentiellt en ökad biogasproduktion i den efterkommande anaeroba rötningen av slammet. Framgångsrika nitritation-anammoxprocesser har implementerats över världen för behandling av ammoniumrikt rejektvatten med högre temperatur medan möjligheten för en huvudströmsimplementation utreds. Lägre ammoniumkoncentrationer, lägre drifttemperaturer och höga krav på utgående vattens kvalitet utgör de största utmaningarna för denna reningsteknik. Att avbryta nitrifikation vid nitritation, det vill säga gynna ammoniakoxiderande bakterier och hämma nitritoxiderande bakterier är vitalt för en fungerande nitritationanammoxprocess. Denna studie ämnar att utvärdera den hämmande effekten av intermittent luftning på nitritoxiderande bakterier samtidigt som anammoxaktiviteten bibehålls. Detta gjordes med hjälp av ex situ -aktivitetstest med bärare från en bioreaktor i pilotskala med rörligt bärarmaterial på Sjölunda Avloppsreningsverk i Malmö. Pilotanläggningen består av en reaktor för behandling av rejektvatten och två huvudströmsreaktorer, kopplade i serie, som mottar vatten från Sjölundas högbelastade aktivslamanläggning. Aktivitetstesterna visade att aktiviteten av nitritoxiderande bakterier sjönk något. En viss minskning i aktiviteten är dock förväntad enbart utifrån att tillförseln av syre minskat då luftningsstrategin ändrats från kontinuerlig till intermittent. Minskningen av aktiviteten sammanföll även med en ökad belastning av organiskt kol, vilket gynnar snabbväxande heterotrofer. Den minskade aktiviteten av nitritoxiderande bakterier kan därmed förklaras av en ökad konkurrens med heterotrofa bakterier om löst syre och plats. De nitritoxiderande bakterierna hämmades inte selektivt då resultaten tyder på att det även skett en minskning av de ammoniakoxiderande bakteriernas aktivitet. Kvävereningshastigheten har gått ned under studien medan den potentiella anammoxaktiviteten har varit stabil i huvudströmsreaktorerna och har ökat i rejektvattenreaktorn. Detta indikerar att anammoxbakterierna inte blivit hämmade utan att det snarare är tillgången på nitrit, det vill säga aktiviteten av ammoniakoxiderande bakterier, som är begränsande för processen. Nyckelord: Aktivitetstester, anammox, AOB, Manammox, nitritation, NOB, OUR. Vattenförsörjnings- och avloppsteknik, Institutionen för Kemiteknik, Lunds Universitet, Box 124, 221 00, Lund. ii PREFACE This thesis is the final project of the Master Programme in Environmental and Water Engineering at Uppsala University and corresponds to 30 ECTS. It has been carried out on the behalf of VA SYD at Sjölunda WWTP in Malmö, Sweden. PhD David Gustavsson at VA SYD acted as supervisor, Professor Jes la Cour Jansen at Water and Environmental Engineering, Department of Chemical Engineering, Lund University acted as the subject reviewer and senior lecturer Fritjof Fagerlund at the Department of Earth Sciences, Uppsala University, was the final examiner. I would like to thank my supervisor David Gustavsson for giving me the opportunity to take part in the Manammox project and for sharing your knowledge with me. I hope that my evaluation can aid in identifying a feasible mainstream nitritation-anammox configuration at Sjölunda. I would also like to thank my subject reviewer Jes la Cour Jansen not only for your valuable input, but also for your amazing ability to organise my thoughts and this thesis. Copyright © Amanda Okhravi, Department of Earth Sciences, Uppsala University and Water and Enironmental Engineering, Department of Chemical Engineering, Lund University. UPTEC W 15007, ISSN 1401-5765 Digitally published at the Department of Earth Sciences, Uppsala University, Uppsala, 2015 and published at the Department of Chemical Engineering, Lund University, Lund, 2015. iii POPULÄRVETENSKAPLIG SAMMANFATTNING Att rena avloppsvatten från kväve är ett växande problem i världen, även om kväve är ett essentiellt näringsämne för alla levande organismer så kan för höga koncentrationer ha förödande konsekvenser för ekosystem. Kväveföreningar så som ammonium, nitrit och nitrat kan ackumuleras i hav, sjöar och vattendrag och orsaka övergödning. På avloppsreningsverk renas kväve konventionell via de biologiska processerna nitrifikation och denitrifikation, där omvandlar olika bakterier det kväve som finns i avloppsvattnet till kvävgas som sedan släpps ut i atmosfären. I början av 1990-talet upptäcktes anammoxbakterien, vilket öppnade en ny väg att åstadkomma kväverening genom, nämligen via nitritation-anammox. Nitritation-anammox omvandlar också kvävet som finns i avloppsvattnet till kvävgas men omvandlingen utförs här av andra bakteriegrupper. Att använda nitritation-anammox för behandling av det vanliga avloppsvattnet, så kallat huvudströmsvatten, på avloppsreningsverk skulle föra dem närmare ett självförsörjande energiläge. Anammoxbakterien behöver inget syre och därmed sänks luftningsbehovet signifikant, vilket gör att energibesparingar kan göras. Bakterierna involverade i nitritationanammox behöver inte heller organiskt kol, vilket möjliggör ett ökat uttag av organisk kol ur avloppsvattnet. Det borttagna organiska kolet kan sedan rötas till biogas, avloppsreningsverk skulle således även kunna producera mer energi. Framgångsrika nitritation-anammoxprocesser har implementerats över världen för behandling av rejektvatten, det vatten som erhålls vid avvattning av rötat slam. Att åstadkomma en fungerande nitritation-anammoxprocess för behandling av huvudströmsvatten är däremot svårare, lägre kvävebelastning, lägre drifttemperatur och höga krav på utgående vattens kvalitet utgör de största utmaningarna för denna reningsteknik. Avgörande för en fungerande nitritation-anammoxprocess är att gynna anammoxbakterier och ammoniakoxiderande bakterier samt att hämma nitritoxiderande bakterier. En driftstrategi som på senare tid visat sig hämma nitritoxiderande bakterier är intermittent luftning, alltså att lufttillförseln till reaktorerna slås på och av istället för att vara kontinuerlig. Denna studie ämnar att utvärdera den hämmande effekten av intermittent luftning på nitritoxiderande bakterier. Genom att utvärdera de olika kväveomvandlande bakteriernas aktivitet med hjälp av två olika aktivitetstest när luftningsstrategin ändrades från kontinuerlig till intermittent kunde den hämmande effekten undersökas. Studien genomfördes vid en pilotanläggning bestående av bioreaktorer med rörligt bärarmaterial på Sjölunda Avloppsreningsverk i Malmö. Pilotanläggningen består av en reaktor för behandling av rejektvatten och två huvudströmsreaktorer, kopplade i serie, som mottar vatten från Sjölundas högbelastade aktivslamanläggning. Aktivitetstesterna visade att aktiviteten av nitritoxiderande bakterier sjönk något. En viss minskning i aktivitet är dock förväntad enbart utifrån att den totala tillförseln av syre minskat då luftningsstrategin ändrats från kontinuerlig till intermittent. Minskningen av aktivitet sammanföll även med en ökad belastning av organiskt kol, vilket gynnar snabbväxande heterotrofa bakterier. Den minskade aktiviteten av nitritoxiderande bakterier kan därmed förklaras av en ökad konkurrens med heterotrofa bakterier om löst syre och plats. iv De nitritoxiderande bakterierna hämmades inte selektivt då resultaten tyder på att det även skett en minskning av de ammoniakoxiderande bakteriernas aktivitet. Kvävereningshastigheten har gått ned under studien medan den potentiella anammoxaktiviteten har varit stabil i huvudströmsreaktorerna och har ökat i rejektvattenreaktorn. Många studier har dock visat att intermittent luftning faktiskt hämmar nitritoxiderande bakterier. Att denna studie visar på annat resultat kan bero på att syrehalten aldrig gick ned till 0 mg/L i reaktorerna samt att nedgången var för långsam. De nitritoxiderande bakterierna utsattes då inte för de syrefria förhållanden som krävs för att de ska hämmas. I framtiden bör fokus därmed läggas på olika sätt att åstadkomma en snabbare nedgång i syrehalt. v LIST OF ABBREVIATIONS Anammox Anaerobic ammonium oxidation AOB Ammonia-oxidising bacteria BOD Biochemical oxygen demand COD Chemical oxygen demand DO Dissolved oxygen HB Heterotrophic bacteria Manammox Mainstream anammox MBBR Moving bed biofilm reactor Mp 1 Mainstream pilot reactor 1 Mp 2 Mainstream pilot reactor 2 NOB Nitrite-oxidising bacteria OUR Oxygen uptake rate Rp Sludge liquor pilot reactor SAA Specific anammox activity SRT Solids retention time WWTP Wastewater treatment plant vi TABLE OF CONTENTS ABSTRACT ........................................................................................................................ I REFERAT .......................................................................................................................... II PREFACE .......................................................................................................................... III POPULÄRVETENSKAPLIG SAMMANFATTNING ....................................... IV LIST OF ABBREVIATIONS ..................................................................................... VI 1. INTRODUCTION ...................................................................................................... 1 1.1 OBJECTIVE .............................................................................................................. 3 2. THEORY ...................................................................................................................... 5 2.1 NITROGEN TRANSFORMING PROCESSES........................................................ 5 2.1.1 Factors influencing nitritation-anammox ............................................................ 6 2.2 NITROGEN REMOVAL VIA NITRIFICATION-DENITRIFICATION ................ 8 2.3 NITROGEN REMOVAL VIA NITRITATION-ANAMMOX ................................. 8 2.3.1 Moving Bed Biofilm Reactor - MBBR ............................................................... 9 2.4 INTERMITTENT AERATION ............................................................................... 11 2.4.1 NOB-suppressive mechanisms .......................................................................... 12 3. THE MANAMMOX PILOT PLANT AT SJÖLUNDA WWTP ................. 13 3.1 OPERATION OF THE MANAMMOX PILOT PLANT ........................................ 13 3.2 AERATION CONTROL STRATEGIES ................................................................ 15 4. METHOD ................................................................................................................... 19 4.1 SPECIFIC ANAMMOX ACTIVITY – SAA .......................................................... 19 4.1.1 Experimental set-up ........................................................................................... 20 4.1.2 Calculations ....................................................................................................... 22 4.2 OXYGEN UPTAKE RATE – OUR......................................................................... 23 4.2.1 Experimental set-up ........................................................................................... 24 4.2.2 Calculations ....................................................................................................... 26 4.3 CYCLE STUDY ...................................................................................................... 27 5. RESULTS AND DISCUSSION ........................................................................... 29 5.1 OPERATIONAL RESULTS ................................................................................... 29 5.1.1 Aeration of the mainstream pilot ....................................................................... 29 5.1.2 Performance of the pilot plant ........................................................................... 32 5.2 SPECIFIC ANAMMOX ACTIVITY – SAA .......................................................... 35 5.2.1 Influence of temperature ................................................................................... 35 5.2.2 Influence of air flow .......................................................................................... 39 5.2.3 Influence of COD .............................................................................................. 42 5.3 OXYGEN UPTAKE RATE – OUR......................................................................... 43 5.3.1 Influence of air flow .......................................................................................... 45 5.3.2 Influence of COD .............................................................................................. 45 5.3.3 Influence of ammonium residual ....................................................................... 48 6. CONCLUSIONS....................................................................................................... 51 7. FUTURE FOCUS AT THE MANAMMOX PILOT PLANT ...................... 53 8. REFERENCES .......................................................................................................... 55 APPENDIX I – MANOMETRIC METHOD ........................................................... 60 APPENDIX II – OUR METHOD ............................................................................... 62 ii 1. INTRODUCTION Conventional removal of nitrogen through autotrophic nitrification and heterotrophic denitrification at municipal wastewater treatment plants is an energy intensive process. This is mainly due to the requirement of aerobic conditions by the nitrifying bacteria and the decreased potential for biogas production. The potential biogas production is decreased as denitrification and the long solids retention times, that are needed because for the slow growing nitrifying bacteria, increase the oxidation of organic carbon to carbon dioxide (Kartal et al., 2010). In some cases the inherent organic carbon in the wastewater is not sufficient for removal of nitrate by denitrification and an external carbon source, such as methanol, must be added (Siegrist et al., 2008) In the early nineties the process of autotrophic anaerobic ammonium oxidation (anammox) was discovered in biofilm systems (Mulder et al., 1995). The anammox bacteria oxidise ammonium directly to nitrogen gas with nitrite as an electron acceptor (Figure 1) (Strous et al., 1998). Figure 1 Overview of the nitrogen transforming processes that are relevant to nitrogen removal. Light blue represent nitritation and dark blue represents nitratation, which together make up nitrification. Orange represents the anammox reaction and green is denitrification. Total autotrophic removal of nitrogen via a combination of the first step of nitrification, i.e. nitritation, and anammox is a less energy consuming alternative to conventional nitrogen removal as the aeration requirement is significantly decreased and no organic carbon is needed (Siegrist et al., 2008). Biogas production can be increased mainly as nitritationanammox would allow for an increase in chemical oxygen demand reduction in the pre1 treatment by mechanical means but also as a decrease of the solids retention time for the aerobic carbon oxidation, if the chemical oxygen demand reducing stage and nitrogen removal stage are separate, would be possible. This would result in a greater biogas yield in the subsequent anaerobic digestion of the primary and secondary sludge. A successful nitritation-anammox process is dependent on favouring the production of nitrite by ammonia-oxidising bacteria and preventing the oxidation of nitrite to nitrate by nitrite-oxidising bacteria, i.e. terminating nitrification at nitritation. Suppression of heterotrophic denitrification bacteria is also vital as they compete with the anammox bacteria for nitrite (Wett et al., 2010). Total autotrophic nitrogen removal has been successfully implemented to treat the warm sludge liquor produced when dewatering anaerobically digested sludge, but obtaining a sufficient degree of nitrogen removal in the mainstream is much more difficult (Lackner et al., 2014). As organic nitrogen compounds are digested during the anaerobic treatment, the sludge liquor is rich in ammonium and typically has a temperature above 20 °C. The high temperature of the sludge liquor favours ammonia-oxidising bacteria rather than nitrite-oxidising bacteria as their growth rate is higher at temperatures above 20 °C (Hellinga et al., 1998). As the anammox bacteria have a very low growth rate, high temperatures also favour the anammox process (Strous et al., 1998). The higher ratio between chemical oxygen demand and nitrogen in mainstream wastewater compared to the sludge liquor generates conditions that supresses the anammox bacteria. Presence of organic carbon favours the fast growing heterotrophic denitrification bacteria which, as well as the nitrite-oxidising bacteria, compete with the anammox bacteria for nitrite (Tang et al., 2009). Different configurations for full-scale treatment of sludge liquor with nitritation-anammox have been installed at wastewater treatment plants over the world. Among the most common are the sequencing batch reactor, granular sludge process and moving bed biofilm reactor (Lackner et al., 2014). More stringent nitrogen effluent standards in the future will cause a need for wastewater treatment plants to enhance their nitrogen removal capacity. An implementation of nitritation-anammox in the mainstream instead of extending the conventional nitrogen removal would bring wastewater treatment plants closer to being energy self-sufficient (Kartal et al., 2010). In the year of 2011, the municipal joint authority VA SYD decided to start up a pilot plant in cooperation with Water and Environmental Engineering at Lund University, aiming to achieve a stable and significant nitritation-anammox reaction in a moving bed biofilm reactor at Sjölunda Wastewater Treatment Plant in Malmö, Sweden, for treatment of wastewater from the high-loaded activated sludge plant. The project was named Manammox, an abbreviation for mainstream anammox. The high-loaded activated sludge plant generates wastewater with a low ratio between chemical oxygen demand and nitrogen that is well suited for treatment with nitritation-anammox. As Sjölunda Wastewater Treatment Plant already has a moving bed biofilm reactor consisting of six parallel lines for post-denitrification, the technology was chosen for the pilot plant as these lines hopefully could be converted to a nitritation-anammox process for mainstream treatment in the future (Gustavsson et al., 2012). 2 1.1 OBJECTIVE The objective of this master thesis is to evaluate if intermittent aeration has a suppressive effect on the nitrite-oxidising bacteria. Possible variations of the nitrogen transforming bacteria will be monitored while operational changes at the Manammox pilot plant are implemented. This will be done by ex-situ batch tests of carriers from the three pilot reactors of the Manammox pilot plant at Sjölunda Wastewater Treatment Plant. The reactors have been continuously aerated until early October 2014 when the aeration control strategy in the two reactors treating mainstream wastewater was changed to intermittent aeration. The main research questions can be summarised as follows: How will the changed aeration control strategy affect the activity of the nitrogen transforming bacteria? Will the suppression of nitrite-oxidising bacteria increase by the change of aeration control strategy? Will the activity of the anammox bacteria be sustained when the aeration control strategy is changed? This evaluation aims to aid in identifying good operational strategies for a successful implementation of nitritation-anammox in the mainstream of Sjölunda Wastewater Treatment Plant. 3 4 2. THEORY 2.1 NITROGEN TRANSFORMING PROCESSES Five different nitrogen transforming processes are relevant concerning removal of nitrogen at Wastewater Treatment Plants (WWTPs), namely nitritation, nitratation, denitrification, anammox (Table 1) and assimilation. Table 1 The chemical reactions of nitritation, nitratation, denitrification and anammox (with permission from Gustavsson et al., 2012). Nitritation Nitratation Nitrogen transformation 𝑁𝐻 + 1.5 𝑂 → 2 𝐻 + 𝑁𝑂 + 𝐻 𝑂 Nitrogen transformation 𝑁𝑂 + 0.5 𝑂 → 𝑁𝑂 Metabolism 80.7 𝑁𝐻 + 114.55 𝑂 + 106.4 𝐻𝐶𝑂 → 𝐶 𝐻 𝑁𝑂 + 79.7 𝑁𝑂 + 82.7𝐻 𝑂 + 155.4 𝐻 𝐶𝑂 Metabolism 134.5 𝑁𝑂 + 𝑁𝐻 + 62.25 𝑂 + 𝐻𝐶𝑂 + 4 𝐻 𝐶𝑂 → 𝐶 𝐻 𝑁𝑂 + 134.5 𝑁𝑂 + 3𝐻 𝑂 Denitrification Anammox Nitrogen transformation 14 𝑁𝑂 + 𝐶 𝐻 𝑂 𝑁 + 14 𝐻 → 7 𝑁 +17 𝐶𝑂 + 𝐻𝐶𝑂 + 𝑁𝐻 + 14 𝐻 𝑂 Nitrogen transformation 𝑁𝐻 + 𝑁𝑂 → 𝑁 + 2 𝐻 𝑂 Metabolism 3.73 𝑁𝑂 + 0.57 𝐶 𝐻 𝑂 𝑁 + 3.73 𝐻 → 𝐶 𝐻 𝑁𝑂 + 1.65 𝑁 + 5.26 𝐶𝑂 +3.8 𝐻 𝑂 Metabolism 𝑁𝐻 + 1.32 𝑁𝑂 + 0.066 𝐻𝐶𝑂 + 0.13 𝐻 → 1.02 𝑁 + 0.26 𝑁𝑂 + 0.066 𝐶𝐻 𝑂 . 𝑁 . + 2.03 𝐻 𝑂 Nitrification is the aerobic process where ammonium is converted to nitrate. It is a two-step process where the first step, nitritation, is the conversion of ammonium to nitrite, and the second step, nitratation, is the conversion of nitrite to nitrate. Nitritation is performed by ammonia-oxidising bacteria (AOB) and nitratation is performed by nitrite-oxidising bacteria (NOB) (Wang et al., 2009). Nitrifiers are lithotrophic autotrophs, deriving their energy from the oxidation of ammonia or nitrite (Bitton, 2010). Denitrification is the process where nitrate is anoxically reduced to nitrite and ultimately to dinitrogen gas with organic matter as an electron donor. The denitrifying bacteria are mostly organotrophic heterotrophs and use organic compounds as a carbon source (Zumft, 1997). Anammox is the process of anaerobic ammonia oxidation where ammonium is oxidised with nitrite as an electron acceptor. The consumption of ammonium and nitrite occur in a ratio of 1:1.32 and produces mainly nitrogen gas but also some nitrate. The anammox bacteria grow on this conversion and use carbon dioxide/bicarbonate as a carbon source (Strous et al., 1998), making them autotrophic chemolithotrophs. They are strictly anaerobic organisms and are thereby inhibited already at low concentrations of dissolved 5 oxygen, the inhibition is however reversible (Strous et al., 1997). The anammox bacteria have a low growth rate, only 0.0027 h-1, yielding a doubling time of approximately 11 days at a temperature of 32-33 °C (Strous et al., 1998). Later studies though claim that the doubling time is significantly shorter. Oshiki, et al. (2011) states that it is 7 days at a temperature of 37 °C and Tsushima, et al. (2007) estimated it to be as low as 3.6 to 5.4 days at the same temperature. Nitrogen assimilation provides the bacterial cell with the nutrient nitrogen for cellular synthesis. It is the process in which organic nitrogen compounds are formed from inorganic nitrogen. In absence of the preferred inorganic nitrogen nutrient ammonia, nitrate is used instead. Inside the bacterial cell the oxygen in nitrate is removed and hydrogen is added forming ammonia, which then can be assimilated into new cellular material (Gerardi, 2006). Assimilation is responsible for 25-30% of the nitrogen removal at ordinary WWTPs and the removal is mainly due to heterotrophic organisms as autotrophic organisms have a much lower growth rate (Bitton, 2010). 2.1.1 Factors influencing nitritation-anammox Solids retention time - SRT One major issue concerning the anammox bacteria is their low growth rate. Typical maximum growth rates of the aerobic AOB and NOB are approximately ten times higher than that of the anammox bacteria (Sin et al., 2008). Retaining a high biomass with small losses throughout the process is thereby significant to ensure that the anammox biomass is not washed out. At temperatures above 20 °C AOB grow faster than NOB (Hunik et al., 1994), meaning that NOB washout can be accomplished by selecting a sufficiently low SRT (Hellinga et al., 1998). The anammox bacteria though require a much higher SRT because of their low growth rate (Strous et al., 1998; Tsushima et al., 2007; Oshiki et al., 2011), making NOB washout by selecting a low SRT impossible if nitritation-anammox occur simultaneously in one single reactor. Dissolved oxygen - DO As the anammox bacteria are anaerobic organisms one of the main factors inhibiting the process is dissolved oxygen (DO), although the inhibition is reversible (Strous et al., 1997a). In a biofilm system the anaerobic environment in the inner layers is created by closely adjacent oxygen consuming AOB and NOB in the outer layers (Wett et al., 2010; Vlaeminck et al., 2010; Lotti et al., 2015b). If the AOB are somehow inhibited the anammox bacteria are at risk of oxygen inhibition, this gives the NOB a chance to compete with the anammox bacteria about the nitrite. If the DO level is too low, the rate of the ammonium oxidation by AOB is reduced and thereby also the rate of the anammox reaction. AOB and NOB compete for oxygen, low DO levels have been shown to favour AOB because of their higher oxygen affinity. A lower oxygen half saturation constant of AOB corresponds to a higher specific growth rate of AOB than NOB at low DO levels (Hanaki et al., 1989b). This has however been questioned as quite a wide range of affinities for oxygen have been reported for both AOB and NOB (Sin et al., 2008). Regmi, et al. (2014) concluded that NOB have a lower oxygen half saturation constant than AOB, proposing the explanation that different NOB have different oxygen affinities. Nitrospira sp. which have a higher oxygen affinity than Nitrobacter sp. are more abundant in mainstream wastewater. 6 Operating at higher DO levels would thereby give AOB a competitive advantage over NOB. Temperature High temperatures favour the anammox bacteria as the activity typically decreases with about 7% per °C (Siegrist et al., 2008). According to Stefansdottir (2014) the activation energy increases with decreasing temperature leading to a decrease of the anammox activity of over 90% when decreasing the temperature from 30 °C to 10 °C. The temperature effect increases with decreasing temperatures but the anammox bacteria are capable of adapting to lower temperatures in long-term cultivations (Lotti et al., 2015a). Hunik, et al. (1994) showed that NOB grow faster than AOB at temperatures below 20 °C, making NOB washout in most mainstream wastewater a complicated matter. pH and substrate Although ammonium and nitrite are vital substrates for the anammox reaction, nitritation and nitratation too high concentrations can be inhibitory to the processes. The equilibrium between ammonium and free ammonia (Table 2) is affected by the pH in such a way that an increased pH will increase the concentration of the un-ionized form. Nitrite will exist in equilibrium with free un-ionized nitrous acid (Table 2) and the concentration of free nitrous acid will increase as pH decreases. Both free nitrous acid and free ammonia have an inhibiting effect on AOB and NOB (Anthonisen et al., 1976) as well as on the anammox bacteria (Strous et al., 1999; Dapena-Mora et al., 2007; Jaroszynski et al., 2012). Table 2 The equilibrium between ammonium and free ammonia and between nitrite and free nitrous acid. Ammonium – free ammonia Nitrite – free nitrous acid 𝑁𝐻 + 𝑂𝐻 ⇄ 𝑁𝐻 + 𝐻 𝑂 𝑁𝑂 + 𝐻 ⇄ 𝐻𝑁𝑂 The reported threshold of the inhibitory nitrite concentration span over a wide range. Strous, et al. (1999) states that the anammox process is completely inhibited at nitrite concentrations higher than 100 mg N L-1. Dapena-Mora, et al. (2007) reports a 50% inhibition of the process at nitrite concentrations of 350 mg N L-1, while Lotti, et al. (2012) claims that 50% inhibition occurs at 400 mg N L-1. Lotti, et al. (2012) also states that the inhibition is reversible and that the activity of the anammox bacteria recovered fully after removal of the nitrite. Inhibition of the anammox process by ammonium or nitrate occurs at much higher concentrations than that of nitrite. The activity of the anammox bacteria is not affected up to concentrations of at least 1000 mg N L-1 according to Strous, et al. (1999). DapenaMora, et al. (2007) reports a 50% inhibition by ammonium at 770 mg N L-1 and 50% inhibition by nitrate at 630 mg N L-1. Jaroszynski states that the anammox activity is significantly affected when free ammonia concentrations exceed 2 mg N L-1. The NOB generally tolerates lower free ammonia concentrations than the AOB (Anthonisen et al., 1976). Organic substances The autotrophic anammox bacteria require wastewater with a low chemical oxygen demand 7 (COD). Presence of organic substances gives the fast-growing heterotrophs a chance to thrive in both oxic and anoxic environments causing the anammox bacteria to be overgrown, with a shorter SRT as a result. The slow-growing anammox bacteria (Strous et al., 1998) require a high SRT and it is thereby vital to suppress the heterotrophs by an initial enhanced removal of COD. Desloover, et al. (2011) concluded that a COD:N ratio of 2.2 at an SRT of 46 days and a temperature of 36 °C was sufficiently low to prevent the overgrowing of anammox bacteria by heterotrophic denitrifiers. The nitrogen removal was even favoured by the competition of anammox bacteria and denitrifiers as the denitrifiers consumed some of the nitrate produced in the anammox process. The accumulation of nitrifying bacteria has been shown to decrease with increasing C:N in biofilms due to the competition for DO and space with heterotrophic bacteria. AOB and NOB are more affected by this competition as their growth rate and yield is much lower than that of heterotrophic bacteria and denitrifiers (Okabe et al., 1996). Ballinger, et al. (2010) showed that AOB are affected by the competition for DO with heterotrophic bacteria at C:N ratios above 2 g g-1. 2.2 NITROGEN REMOVAL VIA NITRIFICATION-DENITRIFICATION Removal of nitrogen through nitrification-denitrification is often accomplished in an activated sludge plant. This can be done in a one-step process where the decomposition of COD, nitrification and denitrification all occur in the same sludge. Autotrophic nitrifiers have a lower growth rate than heterotrophic denitrifiers, thereby the SRT must be kept higher than what is actually needed for the decomposition of COD and denitrification. Less sludge is produced when the SRT is increased due to the increased mineralisation in the sludge. The increased mineralisation decreases the potential of producing biogas since a larger amount of the carbon in the wastewater is released to the atmosphere as carbon dioxide. In a two-stage system the decomposition of COD and pre-denitrification takes place in the same sludge and nitrification occurs in a descendent separate sludge. This allows for an adjustment of the SRT according to the needs of the different bacteria. 2.3 NITROGEN REMOVAL VIA NITRITATION-ANAMMOX An alternative to the traditional nitrification-denitrification removal of nitrogen is removal via nitritation-anammox. This process combines the aerobic oxidation of ammonium to nitrite, i.e. nitritation, by AOB with the anaerobic oxidation of ammonia with nitrite as an electron acceptor, i.e. anammox, to nitrogen gas. As 88 % of the nitrogen in the anammox reaction is converted to nitrogen gas and the remaining 12 % are converted to nitrate a higher degree of removal than 88 % is not theoretically possible (Strous et al., 1998). The autotrophic removal of nitrogen can be achieved in a one-stage or two-stage process. In a two-stage process the AOB and anammox bacteria are separated in two different reactors, making it easier to achieve optimal conditions for the different bacterial groups. For example this would allow for an elimination of the anammox bacteria’s exposure to oxygen (Ma et al., 2011), which would be more difficult in one reactor. Simultaneous nitritation-anammox in one single reactor would on the other hand reduce the space and energy requirement. A single reactor system could thereby be an economical option for nitrogen removal, particularly for wastewater with a high ammonium load and low COD concentration (Cho et al., 2011). 8 Different full-scale reactor configurations have been successfully installed at WWTPs over the world for a nitritation-anammox treatment of the ammonium rich and low COD:N ratio sludge liquor. Most common are the sequencing batch reactor, granular sludge process and moving bed biofilm reactor (MBBR) (Lackner, et al. 2014). A successful implementation of nitritation-anammox in the mainstream is much more challenging than treating sludge liquor as temperature as well as ammonium concentrations are lower. To achieve a sufficient degree of nitrogen removal the undesired competition between AOB, NOB, heterotrophic bacteria and the anammox bacteria must be minimised (Wett et al., 2010). The anammox bacteria are dependent on AOB for the oxidation of ammonium to nitrite, while suppression of NOB and denitrification bacteria is of importance as they compete with the anammox bacteria for nitrite. Suppression of heterotrophic bacteria is vital as they compete with both AOB and NOB for DO. Figure 2 illustrates which substrates which bacterial groups compete for. Figure 2 Illustration of the competition for substrates between the different bacterial groups. Since no organic carbon is consumed by the autotrophic bacteria the utilisation of the organic matter in the sewage can be maximized, i.e. the production of biogas by anaerobic treatment of the sludge is increased (Siegrist et al., 2008). Combining an enhanced COD removal with implementation of nitritation-anammox in the mainstream would bring WWTPs closer to being self-sufficient as biogas production is increased and the aeration requirement is significantly decreased (Kartal et al., 2010) since only slightly more than half of the ammonium has to be converted to nitrite by AOB. 2.3.1 Moving Bed Biofilm Reactor - MBBR To allow for simultaneous nitritation-anammox the process can be carried out in a biofilm system such as the MBBR, a common configuration for nitritation-anammox treatment of sludge liquor (Lackner et al., 2014). In a MBBR system the biofilm is grown on small plastic carriers which are moving freely in the liquid of the reactor. Carriers are kept in motion through mechanical mixing or agitation by aeration and are retained in the reactor with a sieve arrangement at the outlet. Carriers can be of various sizes and shapes but all have a density close to 1000 kg m-3, the most commonly used is the original Kaldnes™ K1 carrier (Figure 3). The carriers have a diameter of 10 mm, a total area of 670 mm2 per unit, an effective area of 490 mm2 and should not be operated at filling degrees (volume of 9 carriers divided by volume of empty reactor) above 70% as this inhibits the carriers ability to move freely in the bulk (Ødegaard et al., 2000). Figure 3 The original Kaldnes™ K1 carrier. To achieve a good balance between the wanted AOB and anammox bacteria in the biomass the difference in SRT should correspond to that of the growth rate. The slow-growing anammox bacteria require a higher SRT than the AOB. In biofilm systems this can be achieved without any specific control actions by stratification of the biofilm structure. The anaerobic anammox bacteria settle at the inner biofilm layers, where they are not exposed to oxygen, while the aerobic AOB prefer the outer layers where the oxygen concentration is higher. The outer layers of the biofilm are exposed to a higher sheer stress and erosion than the inner layers, thereby a natural SRT selection can be accomplished (Wett et al., 2010). Solved substrates need to be transported through the biofilm to the bacteria where the reaction takes place, and the reaction products need to be transported out (la Cour Jansen and Harremoës, 1984). An illustration of a conceptual model including the fundamental processes in a fixed biofilm can be seen in Figure 4. Figure 4 Conceptual model of transport phenomena inside a fixed biofilm (with permission from la Cour Jansen and Harremoës, 1984). 10 The bulk process can be of either zero or half-order with respect to the bulk concentration and can be summarised with Equation 1 and 2 (la Cour Jansen and Harremoës, 1984). 𝑟 =𝑘 =𝑘 𝑟 =𝑘 ∙ 𝐶∗ = valid for 𝛽 = ∙𝐿 2𝐷 ∙ 𝑘 ∙ 𝐶∗ valid for 𝛽 < 1 ∙ ∗ ∙ ≥1 (1) (2) where 𝑟 is the removal rate per unit area biofilm surface [g m-2 s-1], 𝑘 is the zero order removal rate per unit area [g m-2 s-1], 𝑘 is the half order rate constant per unit area [g-1/2 m-1/2 s-1], 𝑘 is the intrinsic zero order removal rate in the biofilm [g m-3 s-1], 𝐿 is the biofilm thickness [m], 𝐷 is the coefficient of molecular diffusion in the biomass [m2 s-1], 𝐶 ∗ is the bulk concentration at the surface of the biofilm [g m-3] and 𝛽 is the dimensionless penetration ratio. When the substrate penetrates the biofilm fully (𝛽 ≥ 1) the bulk process becomes zero order, i.e. the process becomes independent of the substrate concentration. Limitation caused by diffusion leads to a partial biofilm penetration at lower concentrations, thereby making the bulk process become a half-order reaction (la Cour Jansen and Harremoës, 1984). When considering redox processes, either the electron donor or acceptor is the rate limiting substrate. The substrate that penetrates the biofilm least is the limiting substrate and the change in limiting substrate can be described by Equation 3 (la Cour Jansen and Harremoës, 1984). ∗ ∗ = ∙ ∙ = (3) ∙𝑀 where 𝐶 ∗ and 𝐶 ∗ are the bulk concentrations of the electron donor and acceptor [g m-3], 𝐷 and 𝐷 are the corresponding diffusion coefficients [m2 s-1], 𝑘 and 𝑘 are the corresponding zero order intrinsic reaction rates [g m-3 s-1] and 𝑀 is the stoichiometric consumption ratio [g g-1]. 2.4 INTERMITTENT AERATION Terminating nitrification at nitritation, i.e. preventing the oxidation of nitrite to nitrate by NOB, is crucial for a successful nitritation-anammox process. NOB out-selection by high temperatures, low SRT, FA inhibition or low DO (Siegrist et al., 2008, Hellinga et al., 1998, Anthonisen et al., 1976, Hanaki et al., 1996) is not an applicable option for simultaneous nitritation-anammox treatment of the mainstream. A promising alternative is intermittent aeration as a lag-phase in the formation of nitrate by NOB has been observed in the transition of an anoxic environment to an aerobic (Kornaros et al., 2010, Wett et al., 2012, Malovanyy et al., 2014). Lochmatter, et al. (2014) showed that intermittent aeration or alternating high/low DO concentration can reduce the NOB concentration by over 95% at 20 °C within 60 days in a nitrogen removal over nitrate granular sludge sequencing batch reactor. At 15 °C the nitrite oxidation could not be completely suppressed but the NOB population still decreased. This although NOB have a higher growth rate than AOB below 20 °C (Hellinga et al., 1998). 11 2.4.1 NOB-suppressive mechanisms Wett, et al. (2012) presents two possible explanations for the suppressive effect on NOB of transient anoxia. The intermittent aeration might interrupt the metabolic conversions and thereby cause the formation of inhibitory intermediate products such as nitric oxide and/or cause a lag-phase in the enzymatic activity. Kornaros, et al. (2010) showed that NOB are slow in adapting to aerobic conditions after being exposed to one or consecutive anoxic disturbances. The delay in the recovery of NOB is strongly dependent on the duration of the anoxic period. Nitrite and ammonium concentrations decrease during the anoxic phase as it is consumed by the anammox bacteria. The lack of substrate at the beginning of an aerobic phase also has a suppressive effect on the NOB. Tappe, et al. (1999) showed that the respiratory activity of AOB and NOB after a starvation time of ammonia respectively nitrite when substrate was again available decreased with increased starvation time. This observed decrease in respiratory activity was though much greater for NOB than AOB. In the same way, extended periods of starvation decreased the bacteria’s velocity of resuscitation. AOB was shown to recover faster from starvation than NOB. Malovanyy, et al. (2014) proposes that this absence of the two process substrates DO and nitrite and not the anoxic phase length is the only mechanism affecting the activity of NOB. 12 3. THE MANAMMOX PILOT PLANT AT SJÖLUNDA WWTP Sjölunda Wastewater Treatment Plant in Malmö is designed for 550,000 population equivalents (Hanner et al., 2003) and the average daily load is almost 300,000 population equivalents, where 1 population equivalent equals 70 g BOD7 (biochemical oxygen demand) person-1day-1 (Gustavsson et al., 2013). At Sjölunda WWTP the nitrogen removal is descendent of pre-precipitation in pre-settlers and a high-loaded activated sludge plant (HLAS) for COD removal (Figure 5). Nitrification occurs in nitrifying trickling filters, and denitrification is accomplished in a descendant MBBR operated with methanol as a carbon source (Hanner et al., 2003). Figure 5 Configuration of Sjölunda WWTP where SF is the grit removal, FS is the primary settlers, BM is the wet-weather flow basin, AS is the activated sludge, NTF are the nitrifying trickling filters, MBBR is the moving bed biofilm reactor, DAF is the dissolved air flotation, SBR is the sequencing batch reactor, GF is the thickening of the primary sludge (gravity thickening), BF is the thickening of the secondary sludge (band gravity thickening), AR is the anaerobic digestion tank and CF is the sludge dewatering (centrifuges). The HLAS consists of six parallel lines, each with a reaction and settling tank, and is operated with a SRT of 2-2.5 days. The inlet is not aerated, allowing for pre-denitrification of nitrite and nitrate recycled from the mainstream nitrifying trickling filters. The sequencing batch reactor plant (nitritation only) and a nitritation-anammox plant, the latter used for biofarming by the company AnoxKaldnes are treating sludge liquor from the dewatering of anaerobically digested sludge. The influent to the HLAS is a mixture of the pre-precipitated and pre-settled wastewater and treated sludge liquor (Gustavsson et al., 2013). 3.1 OPERATION OF THE MANAMMOX PILOT PLANT An objective of the Sjölunda Manammox pilot studies is to achieve a nitrogen removal efficiency of at least 70% at a load of 1 g NH4+-N m-2 day-1 at 17 °C during a five month period in the mainstream pilot (Gustavsson et al., 2012). The layout of the pilot plant can be seen in Figure 6. The boxes represents the variables measured with online meters (Gustavsson et al., 2013). 13 Figure 6 Layout of the Manammox pilot plant with measured variables. The pilot plant consists of three MBBRs for nitritation-anammox. One 1.5 m3 reactor (Rp) for sludge liquor treatment, and the two serial 2.3 m3 reactors (Mp 1 and Mp 2) receiving effluent from one of the HLAS lines (Figure 7 and 8). Figure 7 Mainstream reactor 1. Figure 8 Inside mainstream reactor 1. Start-up of the sludge liquor pilot took place in October 2012, and in April 2013 the two mainstream pilots were taken in operation (Gustavsson et al., 2013). At start-up the reactors 14 were fully inoculated with Kaldnes™ K1 carriers originating from the full-scale nitritationanammox sludge liquor treatment plant at Himmerfjärden WWTP (Plaza et al., 2011). All reactors are operated with a filling degree of 40%, have a coarse bubble aeration system and a mixer. Carriers are manually moved between the sludge liquor pilot and the mainstream pilot every second weekday, this results in an average carrier retention time of 37 days in the mainstream reactor and 11 days in the sludge liquor reactor. This is done to stimulate the growth of the slow-growing anammox bacteria (Strous et al., 1998) and AOB, as the conditions in Rp are more favourable. It is also thought to suppress NOB growth as they are exposed to higher concentrations of ammonia in Rp (Anthonisen et al., 1976). The mainstream pilot reactors influent have been a mixture of the HLAS effluent and treated sludge liquor up to the 1st of July 2014 when they have been operated with only HLAS effluent. Characteristics of the untreated sludge liquor and effluent from the HLAS can be seen in Table 3. Table 3 Daily flow-proportional characteristics of the effluent from the HLAS and untreated sludge liquor where SD is the standard deviation, SS is suspended solids and VSS is volatile suspended solids. Parameter [unit] SS [mg L-1] VSS [mg L-1] COD [mg L-1] COD filtrated [mg L-1] BOD7 [mg L-1] BOD7 filtrated [mg L-1] P-tot [mg L-1] P-tot filtrated [mg L-1] N-tot [mg L-1] NH4+-N [mg N L-1] NO2--N [mg N L-1] NO3--N [mg N L-1] Alkalinity [mg HCO3- L-1] 3.2 HLAS effluent Sludge liquor (Sept 19 – Dec 17, 2014) (Sept 19 – Dec 17, 2014) Average SD No. of Average SD No. of samples samples 30 23 61 37 15 4.9 1.0 0.26 31 24 0.11 1.5 350 ± 63 ± 11 ± 23 ± 6.1 ± 7.6 ± 2.3 ± 0.97 ± 0.20 ± 7.0 ± 5.9 ± 0.034 ± 0.25 ± 55 38 15 26 26 14 15 15 15 15 61 61 61 61 2200 1200 2400 220 300 43 84 14 950 850 - ± 2500 ± 2000 ± 2800 ± 81 ± 400 ± 34 ± 95 ± 4.3 ± 300 ± 170 - 36 16 27 26 15 16 16 16 16 54 - AERATION CONTROL STRATEGIES Two different aeration control strategies have been implemented in Mp 1 and Mp 2 during this study. At both strategies Rp is continuously aerated with a fixed pH set-point. The alkalinity of the untreated sludge liquor is due to bicarbonate, presence in a ratio of about 1.1 mol bicarbonate per mol ammonium. Nitritation is an acidifying process, generating 2 hydrogen ions per oxidised ammonium, but only about half of the incoming ammonium should be oxidised to nitrite as the anammox process consumes ammonium and nitrite in a ratio of 1:1.32. If more than half of the incoming ammonium is oxidised the alkalinity of the sludge liquor will not be enough to maintain the pH value, but it will instead decrease. In the same way, if less than half of the incoming ammonium is oxidised, too little acidity will be produced and the pH value will increase. The pH-value is maintained by controlling 15 the air valve. An increased supply of oxygen will increase the ammonium oxidation and the production of acidity, and a decreased supply of oxygen will decrease the ammonium oxidation and decrease the production of acidity. Since the 19th of April 2013 the pH setpoint has been around 7.0. Basic – continuous aeration with fixed DO set-point Mp 1 and Mp 2 are continuously aerated (Figure 9). The DO set-point is manually chosen for both reactors. Figure 9 Theoretical plot of the DO level in Mp 1 or Mp 2 with the "Basic" aeration strategy applied. Basic intermittent – intermittent aeration with fixed DO set-point Mp 1 and Mp 2 are intermittently aerated with fixed DO set-points (Figure 10). The cycle length is manually chosen as well as the ratio between the non-aerated and aerated phase. Figure 10 Theoretical plot of the DO level in Mp 1 or Mp 2 with the aeration strategy "Basic intermittent" applied. A summary of during which periods of time the different aeration strategies have been applied is shown in Table 4. 16 Table 4 Summation of periods of different aeration control strategies applied in the mainstream pilot during the study where R is the ratio between the non-aerated and aerated phase length. Period Date interval Aeration control strategy 1 1 July7 Oct 2014 Basic 2.1 2 8 Oct21 Nov 2014 Basic intermittent 3 22 Nov 201415 Jan 2015 Basic intermittent 17 DO set-point [mg L-1] Mp 1 Mp 2 Cycle length [min] R 2.1 - - 2.1 2.1 40 1/3 2.5 2.1 80 1/3 18 4. METHOD A good tool for identifying good operational strategies for a successful implementation of nitritation-anammox in the mainstream is determining the activity of the nitrogen transforming bacteria. By monitoring possible changes in their activity an evaluation of the effect of different operational changes can be done. During the activity tests optimal conditions are applied, e.g. substrate is unlimited and pH is controlled. The measured activity is thereby the potential activity and not the actual activity in the rector. By measuring the production of nitrogen gas the activity of the anammox bacteria can be determined. The used method for determining the specific anammox activity (SAA) is the one described by Dapena-Mora, et al. (2007), which has been modified by Lotti, et al. (2012) and Stefansdottir (2014). To evaluate the activity of NOB the maximum oxygen uptake rate (OURmax) has been determined by measuring the depletion of oxygen in a solution when different substrates are added. The used method for measuring the OUR is the one described by Hagman and la Cour Jansen (2007) modified by Llano and Galkin (2014) and Olofsson (2014). 4.1 SPECIFIC ANAMMOX ACTIVITY – SAA As the consumption of nitrite and ammonium by the anammox bacteria produces nitrogen gas, the pressure increases if the reaction occurs in a closed reactor. By measuring the overpressure in the headspace of a closed reactor the SAA can be determined (DapenaMora et al., 2007). Heterotrophic denitrifiers are also capable of producing nitrogen gas, their relative importance is though considered to be negligible as an organic carbon source is needed for denitrification. When determining the amount produced nitrogen gas consideration must be taken to nitrogen gas in the headspace as well as dissolved gas in the liquid phase. The increment of pressure can be converted to the amount produced nitrogen gas located in the headspace according to the ideal gas law (Equation 4) 𝑛 = ∙ (4) ∙ where 𝑛 is the amount of substance in the headspace [mol], 𝑝 is the pressure in the headspace [mbar], 𝑉 is the volume of the headspace [L], 𝑅 is the ideal gas constant [mbar L K-1 mol-1] and 𝑇 is the temperature [K]. The concentration of dissolved gas in the liquid phase can be calculated according to Henry’s law (Equation 5) 𝑐 , =𝑘 , (5) ∙𝑝 where 𝑐 , is the concentration of the dissolved gas [mol L-1], 𝑘 [mol L-1 mbar-1] and 𝑝 is the pressure in the headspace [mbar]. , is Henry’s constant The value of Henry’s constant [mol L-1 mbar-1] depends on the solute, the solvent and the temperature. For nitrogen gas dissolved in water 𝑘 , can be expressed as 19 𝑘 = 6.1 ∙ 10 , ∙ ∙𝑒 (6) . where 𝑇 is the temperature [K]. The substance amount of the dissolved gas in the liquid phase can be calculated according to 𝑛 =𝑐 , (7) ∙𝑉 where 𝑛 is the substance amount [mol], 𝑐 , is the concentration of the dissolved gas [mol L-1] and 𝑉 is the volume of the liquid phase [L]. The total amount of produced nitrogen gas is given by addition of the amount of nitrogen gas in the headspace and the amount of dissolved gas in the liquid phase (Equation 8). 𝑛 (8) =𝑛 +𝑛 where 𝑛 is the total amount produced nitrogen gas [mol], 𝑛 is the substance amount nitrogen gas in the headspace [mol] and 𝑛 is the substance amount nitrogen gas in the liquid phase [mol]. The SAA at every point of time can be determined by dividing the time derivative at that point of time, i.e. the production rate, of the amount of nitrogen gas by the total effective area of the carriers. 𝑆𝐴𝐴 = 60 ∙ 24 ∙ ∙ (9) ∙ Where 𝑆𝐴𝐴 is the specific anammox activity [g m-2 day-1], is the production rate of -1 nitrogen gas [mol min ], 𝑀 is the molar weight of nitrogen gas [g mol-1], 𝑋 is the number of carriers, 𝐴 is the effective area of one carrier [m2] and 60 ∙ 24 is the conversion from minutes to days [min day-1]. 4.1.1 Experimental set-up Carriers were sampled from one of the three reactors Mp 1, Mp 2 or Rp at the Manammox pilot plant. They were rinsed carefully with tepid water to remove particulate compounds and by manual counting 240 carriers put in a 1 L reactor (bottle) with a magnetic stir bar (Figure 11). This resulted in a ratio between the volume of the carriers and the volume of the empty reactor, i.e. a filling ratio, of 32.16 %. Distilled water (750 ml) and phosphate buffer (22 ml, 1 M), to achieve a constant pH around 7.75 throughout the experiment, was added to the reactor. The reactor was then placed on a magnetic stirrer with a stirring speed of 400 rpm in a water bath. The temperature of the water bath was set to 28 °C. Water covered the whole reactor to ensure that a stable temperature in both the liquid and the gas phase was accomplished. Figure 11 Reactor with carriers. 20 To achieve anaerobic conditions the liquid phase was flushed with nitrogen gas for 10 minutes and the gas phase was flushed for 1.5 minutes, this was done 15 minutes after the reactor was placed in the water bath Immediately after the flushing with nitrogen gas the reactor was sealed with a septum. The pressure sensor was connected through the septum as well as an additional needle to equalize the pressure in the headspace to atmospheric pressure (Figure 12). The pressure meter (Figure 13), that was programmed to log one value each minute, measures relative pressure and the pressure relative to atmospheric pressure was set to 0. The reactor was left in the water bath for 30 minutes for pressure and temperature stabilization. Figure 12 Reactor placed in the water bath with the additional needle and pressure sensor connected through the septum. Figure 13 Pressure sensor and syringe with needle. Ammonium solution (20 ml, 5 mg NH4+-N mL-1) and nitrite solution (20 ml, 5 mg NO2--N mL-1) were added to the reactor thru the septum via two 60 ml syringes with needles (Figure 13). The additional needle was then removed and the logger was started, the duration of the experiment was 120 minutes. By weighing the reactor immediately after the experiment and then filling it up with water and weighing it again, the volume of the headspace could be calculated by dividing the difference in weight with the density of water. The carriers were rinsed with tepid water again and returned to the pilot plant reactor they originally were collected from. Recorded data was then exported from GSOFT 3050 to Microsoft Excel where all processing of data was performed. A full description of the manometric method and a complete list of used material can be found in Appendix I. 21 4.1.2 Calculations The volume of the headspace was calculated by dividing the weight difference between the reactor immediately after a finished test and the reactor when it was completely filled with water by the density of water (Equation 10) (10) 𝑉 = where 𝑉 is the volume of the headspace [L], 𝑚 is the weight of the reactor immediately after a finished test [g], 𝑚 is the weight of the reactor when it is completely filled with water [g] and 𝜌 if the density of water [g L-1]. The concentration of dissolved nitrogen gas in the liquid phase was calculated with Henry’s law (Equation 5) with Henry’s constant according to Equation 6. 𝑐 = 6.1 ∙ 10 , ∙ ∙𝑒 . (11) ∙𝑝 where 𝑐 , is the concentration of the dissolved nitrogen gas [mol L-1], 𝑇 is the temperature [K] and 𝑝 is the pressure in the headspace [mbar]. The amount produced nitrogen gas was calculated according to Equation 8 with the insertion of Equation 4 and 7. 𝑛 = ∙ ∙ +𝑐 , (12) ∙𝑉 where 𝑛 is the total amount produced nitrogen gas [mol], 𝑝 is the pressure in the headspace [mbar], 𝑉 is the volume of the headspace [L], 𝑅 is the ideal gas constant [mbar L K-1 mol-1], 𝑇 is the temperature [K], 𝑐 , is the concentration of the dissolved nitrogen gas [mol L-1] and 𝑉 is the volume of the liquid phase [L]. A typical plot of the amount produced nitrogen gas (𝑛 ) with time can be seen in Figure 14. 1400 ntot [µmol] 1200 1000 800 600 400 200 0 0 20 40 60 80 100 120 Time [min] Figure 14 Typical plot of the total amount produced nitrogen gas in the reactor as a function of time. The production rate of nitrogen gas was determined by preforming a linear regression, using Microsoft Excel’s function “SLOPE”, on every set of ten time-consecutive data 22 Change in ntot [µmol min-1] points of the total amount of nitrogen gas produced. A typical plot of how the production rate varies with time can be seen in Figure 15. 20 16 12 8 4 0 0 20 40 60 80 100 120 10 min time interval end [min] Figure 15 Typical variation of the production rate of nitrogen gas in the reactor with time. The maximum production rate was inserted into equation 9, yielding the maximum SAA. 𝑆𝐴𝐴 = Where 𝑆𝐴𝐴 ∙ (13) ∙ is the maximum specific anammox activity [g m-2 day-1], is the maximum production rate of nitrogen gas [mol min-1], 𝑀 is the molar weight of nitrogen gas [g mol-1], 𝑋 is the number of carriers, 𝐴 is the effective area of one carrier [m2] and 60 ∙ 24 is the conversion from minutes to days [min day-1]. 4.2 OXYGEN UPTAKE RATE – OUR The oxygen uptake rate (OUR) is a measurement of the activity of aerobic bacteria. By measuring the depletion of oxygen in a solution during a limited period of time the OUR can be calculated (Hagman and la Cour Jansen, 2007). 𝑂𝑈𝑅 = −60 ∙ ∙ (14) ∙ Where 𝑂𝑈𝑅 is the oxygen uptake rate [g O2 m-2 h-1], is the time derivative of the -1 -1 concentration of oxygen in the solution [g L min ], 𝑉 is the volume of the liquid phase [L], 𝑋 is the number of carriers, 𝐴 is the effective area of a carrier [m2] and 60 is the conversion from minutes to hours [min h-1]. Different substrates and inhibitors are added to measure the activity of different bacteria. When no substrate or inhibitor addition is done the depletion of oxygen is due to the endogenous respiration, which is the consumption of oxygen by microorganisms in the absence of substrate (Hagman and la Cour Jansen, 2007). To inhibit AOB selectively and fully allylthiourea (ATU) can be added at a concentration of 86 µM (Ginestet et al., 1998). 23 4.2.1 Experimental set-up The description of the method is for one activity test. When the tests were carried out most often two activity tests were performed simultaneously. Carriers were sampled from one of the three reactors Mp 1, Mp 2 or Rp at the pilot plant. The carriers were carefully rinsed with tepid water to remove particulate compounds and 128 carriers were manually counted and put in a 500 ml beaker with 400 ml of tap water and a magnetic stir bar. The beaker was placed on a magnetic stirrer with a stirring speed of 350 rpm in a water bath (Figure 16). The water bath temperature was set to 28.3 °C . The sensor and the aeration stone were placed in the beaker as far down as possible without disturbing the stirring. The sensor and the aeration stone were not to be too close to each other (Figure 17). Figure 16 Beaker with carriers and water on Figure 17 Sensor and aeration stone placed the magnetic stirrer in the water bath. in the beaker. When the temperature in the beaker had reached 28.0 °C -28.3 °C, continuous aeration was started. After 1.5 h of continuous aeration ten cycles of no aeration and aeration were started. One cycle consisted of 5 min and 4 s of no aeration followed by 5 min and 9 s of aeration. Addition of phosphate buffer (1 M) and ammonium solution (5 mg NH4+-N mL-1) was done 30 seconds before cycle 4 and addition of nitrite solution (5 mg NO2--N mL-1) was done 30 seconds before cycle 7. Addition of ATU was done after 30 s of aeration in cycle 6. An overview of the aeration cycles can be seen in Table 5. 24 Table 5 Overview of the aeration cycles with volume in the beaker. Point Cycle Aeration of time is [min:s] switched 00:00 1 OFF 05:04 ON 10:13 2 OFF 15:17 ON 20:26 3 OFF 25:30 ON 30:39 4 OFF 35:43 40:52 45:56 51:05 56:09 61:18 66:22 71:31 76:35 81:42 86:46 91:55 96:59 5 6 7 8 9 10 ON OFF ON OFF ON OFF ON OFF ON OFF ON OFF ON 30 s before add After 30 s add 5.5 ml phosphate buffer 4 ml ammonium solution 1 ml ATU 4 ml nitrite solution Volume of solution in beaker [ml] 400 400 400 400 400 409.5 409.5 409.5 409.5 409.5 409.5 410.5 414.5 414.5 414.5 414.5 414.5 414.5 414.5 414.5 The concentration of NH4+-N and NO2--N varied during the test as they are used as substrates by the bacteria. The initial concentrations of the chemicals can be seen in Table 6. Table 6 Initial concentrations of added chemicals in the beaker. Chemical Added in cycle + 3 6 6 NH4 -N NO2--N ATU Initial concentration 48.84 mg L-1 48.25 mg L-1 8.299 µM After approximately 97 minutes of aeration cycles the test was finished. The carriers were again rinsed with tepid water and returned to the pilot plant reactor they originally were collected from. Data was transported from the logger via an USB and imported to Microsoft Excel where all processing of data was performed. A full description of the OUR method and a complete list of used material can be found in Appendix II. 25 4.2.2 Calculations DO [mg L-1] A typical plot of the DO level in the beaker is shown in Figure 18. 8 7 6 5 4 3 2 1 0 0 25 50 75 100 125 150 175 200 Time [min] Figure 18 Typical variation of the DO level with time in the beaker. The change in oxygen level with time was calculated by performing a linear regression, using Microsoft Excel’s function “SLOPE”, on every set of four time-consecutive data points, i.e. two minutes, of the oxygen level (Figure 19). Change in DO [mg L-1 min-1] 3 2 1 0 0 25 50 75 -1 100 125 150 175 200 2 minute time interval end [min] Figure 19 Typical plot of the time derivative of the concentration of oxygen with time in the beaker. The minimum value of the time derivate of the concentration of oxygen, i.e. the maximum depletion of oxygen, of every aeration cycle was inserted into Equation 14 to calculate the maximum OUR of every aeration cycle. 𝑂𝑈𝑅 , = −60 ∙ where 𝑂𝑈𝑅 , , , ∙ (15) ∙ is the maximum oxygen uptake rate during aeration cycle k [g m-2 h-1], is the minimum time derivative of the concentration of oxygen in the solution during aeration cycle k [g L-1 min-1], 𝑉 is the volume of the liquid phase [L], 𝑋 is the number of carriers, 𝐴 is the effective area of a carrier [m2] and 60 is the conversion from minutes to hours [min h-1]. 26 A typical plot of the maximum OUR of every aeration cycle can be seen in Figure 20. OURmax,k [mg L-1 h-1] 300 250 200 150 100 50 0 1 2 3 4 5 6 7 8 9 10 Aeration cycle k Figure 20 Typical plot of the maximum OUR of every aeration cycle. The endogenous OUR (𝑂𝑈𝑅 ), AOB plus NOB OUR (𝑂𝑈𝑅 (𝑂𝑈𝑅 ) were calculated with Equation 16, 17 and 18. 𝑂𝑈𝑅 𝑂𝑈𝑅 𝑂𝑈𝑅 = 𝑂𝑈𝑅 = 𝑂𝑈𝑅 where 𝑂𝑈𝑅 , ) and NOB OUR (16) , = 𝑂𝑈𝑅 , , , , − 𝑂𝑈𝑅 − 𝑂𝑈𝑅 (17) , (18) , is the OUR as seen in Figure 20 [mg L-1 h-1]. No NOB inhibitors were used during this study and thereby no explicit measurement for the AOB activity was acquired. Azide has been shown to selectively inhibit NOB at a concentration of 24 µM (Gineste et al., 1998), but it has severe toxic effects on humans. Sodium chlorate also inhibits NOB but as shown by Gustafsson (2013) it also inhibits AOB to some extent. The NOB OUR included in AOB plus NOB OUR is not the maximum NOB OUR as nitrite is limited in aeration cycle 4, 5 and 6. The NOB OUR calculated from Equation 18 can thereby not be subtracted from the AOB plus NOB OUR to attain the AOB OUR, which was done in Llano & Galkin (2014). 4.3 CYCLE STUDY For further understanding of the nitrogen transformation in the reactors detailed cycle studies were performed on the 13th of November 2014 during period 2 and on the 7th of January 2015 during period 3. Water was sampled every second, every fourth or every eighth minute in Mp 1, Mp 2 and the incoming wastewater. Sampling was most frequently performed during the non-aerated phase and the first 10-20 minutes of aeration. The wastewater was filtered through Munktell folded filter papers of size 185 mm with a pore size > 10 µm into plastic test tubes of volume 14 ml and stored in a refrigerator until the time of analysis. Sampling was performed during two full cycles and an extra non-aerated phase at the end. The samples were analysed for concentration of NH4+-N with HACH LANGE Ammonium LCK 303 2-47 mg L-1, NO2--N with HACH LANGE Nitrite LCK 341 0.015-0.6 mg L-1 and NO3--N with HACH LANGE Nitrate 0.23-13.5 mg L-1. 27 28 5. RESULTS AND DISCUSSION All data presented except SAA and OUR are daily mean values, or calculated from daily mean values from the pilot plant reactors. 5.1 OPERATIONAL RESULTS 5.1.1 Aeration of the mainstream pilot During period 1 both Mp 1 and Mp 2 were continuously aerated with a DO set-point of 2.1 mg L-1. Typical curves of the DO level in Mp 1 and Mp 2 during period 1 are shown in Figure 21. 4 DO [mg L-1] 3 2 1 0 0 30 60 90 120 150 180 Time [min] Mp 1 Mp 2 Figure 21 Typical curves of the DO levels in Mp 1 and Mp 2 during period 1. During period 2 both Mp 1 and Mp 2 were intermittently aerated with a DO set-point of 2.1 mg L-1. The cycle length was set to 40 minutes and the ratio between the non-aerated and aerated phase length was 1/3. Nitrite, nitrate and ammonium concentrations were determined during two whole cycles and one extra non-aerated phase in the two mainstream reactors. Due to problems with the analytical method, the nitrate concentrations were considered to be non-representative and are therefore not shown. How nitrite varied as the DO level varied during period 2 is shown in Figure 22. The stability of the ammonium concentration in influent, Mp 1 and Mp 2 is shown in Figure 23. 29 1 3 0.75 2 0.5 1 0.25 0 NO2--N [mg L-1] DO [mg L-1] 4 0 0 30 60 90 120 150 180 Time [min] DO Mp 1 DO Mp 2 Nitrite Mp 1 Nitrite Mp 2 Figure 22 DO and nitrite concentration in Mp 1 and Mp 2 during two cycles in period 2. 40 NH4+-N [mg L-1] 32 24 16 8 0 0 30 60 90 120 150 180 Time [min] Influent ammonium concentration Ammonium concentration Mp 1 Ammonium concentration Mp 2 Figure 23 Ammonium concentrations in influent, Mp 1 and Mp 2 during two cycles (the same as in Figure 22 above) in period 2. In period 2 the non-aerated phase length of 10 minutes was insufficient for dropping the DO levels to 0 mg L-1. The DO level did not decrease below 0.5 mg L-1, therefore, in period 3, the cycle length was extended in to 60 minutes, but the ratio between the non-aerated and aerated phase length was kept at 1/3 to provide the same opportunity for aerobic ammonium oxidation (Figure 24). The DO set-point was set to 2.5 mg L-1 in Mp 1 and kept at 2.1 mg L-1 in Mp 2. The ammonium concentrations in influent, Mp 1 and Mp 2 during the cycle study in period 3 were also stable (Figure 25). 30 1 3 0.75 2 0.5 1 0.25 0 NO2--N [mg L-1] DO [mg L-1] 4 0 0 30 60 90 120 150 180 Time [min] DO Mp 1 DO Mp 2 Nitrite Mp 1 Nitrite Mp 2 Figure 24 DO and nitrite concentration in Mp 1 and Mp 2 during two cycles in period 3. 40 NH4+-N [mg L-1] 32 24 16 8 0 0 30 60 90 120 150 180 Time [min] Influent ammonium concentration Ammonium concentration Mp 1 Ammonium concentration Mp 2 Figure 25 Ammonium concentrations in influent, Mp 1 and Mp 2 during two cycles in period 3. Still, the DO in the non-aerated phase did not drop to 0 mg L-1, only to around 0.3 mg L-1 in Mp 1 and 0.2 mg L-1 in Mp 2. From the cycle studies it can be concluded that the reactors are operated at low DO levels during relatively long periods of time in the transition between the non-aerated and aerated phases. It was found that the NOB Nitrospira sp. was more common than Nitrobacter sp. in a previous study of the Manammox pilot plant (Gustavsson et al., 2014). Nitrospira have a higher DO affinity than AOB (Regmi et al., 2014), thereby NOB have a competitive advantage over AOB at low DO levels. The slow nature of the transition could thereby reduce the suppressive effect of transient anoxia on NOB. 31 5.1.2 Performance of the pilot plant During the study operational parameters varied in both mainstream and sludge liquor pilot (Table 7). Table 7 Average temperature, ammonium load, air flow and COD load in the mainstream and sludge liquor pilot during the different periods of time. Period 1 2 3 Average T [°C] Mp Rp 20 18 16 27 25 24 Average NH4+-N load [g N m-2 day-1] Mp Rp 1.3 1.0 1.2 1.7 2.0 1.9 Average air flow [Nm3 h-1] Mp 1 Mp 2 Rp 1.9 1.4 1.4 1.4 1.0 0.88 4.0 5.6 6.0 Average COD load [g m-2 day-1] Mp Rp 3.0 2.6 2.9 0.74 1.6 2.0 The inflow to the mainstream pilot was always around 2 m3 h-1, yielding a hydraulic retention time of 2.3 h. As the inflow is constant, the influent is diluted at wet-weather conditions. During period 2 heavy rain occurred at several occasions, which is why the load during that period is lower in the mainstream pilot. Temperatures decreased in both mainstream and sludge liquor pilot due to a change in season, and because of the heavy rains. The average air flow in Mp 1 and Mp 2 was decreased from period 1 to period 2 and 3 as intermittent aeration was implemented. Difficulties with foaming at Sjölunda WWTP required trickling with treated mainstream wastewater in the sludge liquor storage tank, which lowered the sludge liquor temperature compared to regular sludge liquor. Therefore, the decrease in sludge liquor temperature followed the decrease in the mainstream wastewater. The nitrogen removal rate decreased from period 1 to period 2 and further in to period 3 in the mainstream reactor, while the removal rate in Rp was highest in period 2 (Table 8). Table 8 Average nitrogen removal rate and mol produced nitrate per mol oxidised ammonium in mainstream and sludge liquor pilot. Period 1 2 3 Average N removal rate [g N m-2 day-1] Mp Rp 0.50 0.31 0.29 1.3 1.6 1.4 Average produced NO3-/ oxidised NH4+ [%] Mp Rp 44 48 50 14 14 16 A nitrate production of 0.13 mole per mole oxidised ammonium is an indicator that nitritation-anammox is occurring (Table 1). During nitritation 1 mol ammonium is oxidised and during the anammox reaction 1 mol is oxidised, anammox produces 0.26 mol nitrate resulting in a ratio of 0.13 mol mol-1. 32 3 Period 1 Period 2 Period 3 100 80 2 60 40 1 20 0 18-09-14 03-10-14 18-10-14 02-11-14 17-11-14 02-12-14 0 17-12-14 Produced NO3-/oxidised NH4+ [%] NH4+-N load and N removal rate [g N m-2 day-1] The change in ammonium load, nitrogen removal rate and nitrate per oxidised ammonium with time can be seen in Figure 26 for the mainstream pilot and in Figure 27 for the sludge liquor reactor. Date Ammonium load Nitrogen removal rate Produced nitrate/oxidised ammonium 3 Period 1 Period 2 Period 3 100 80 2 60 40 1 20 0 18-09-14 03-10-14 18-10-14 02-11-14 17-11-14 02-12-14 0 17-12-14 Produced NO3-/oxidised NH4+ [%] NH4+-N load and N removal rate [g N m-2 day-1] Figure 26 Ammonium load, nitrogen removal rate and produced nitrate per oxidised ammonium in the mainstream pilot. Date Ammonium load Nitrogen removal rate Produced nitrate/oxidised ammonium Figure 27 Ammonium load, nitrogen removal rate and produced nitrate per oxidised ammonium in the sludge liquor pilot. Changes in ammonium load affect the nitrogen removal rate. In the mainstream pilot the correlation was strongest in period 1 (Figure 28). In Rp the removal rate exhibits a strong linear correlation with the ammonium load (Figure 29). 33 N removal rate [g N m-2 day-1] 0.7 R12 = 0.50 0.6 R22 = 0.15 0.5 R32 = 0.23 0.4 0.3 0.2 0.1 0 0 1 NH4+-N Period 1 2 load [g N Period 2 m-2 day-1] Period 3 Figure 28 Nitrogen removal rate as function of ammonium load in the mainstream pilot for the different periods of time. N removal rate [g N m-2 day-1] 3 R2 = 0.92 2.5 2 1.5 1 0.5 0 0 1 2 NH4+-N 3 load [g N m-2 4 day-1] Figure 29 Nitrogen removal rate as a function of ammonium load in the sludge liquor pilot. The decrease in average nitrogen removal rate from period 1 to period 2 and 3 in the mainstream reactor is to some extent expected. The air flow has been significantly reduced due to intermittent aeration, lowering the overall rate of ammonium oxidation. The decrease in temperature due to the change in season also lowers the activity of all bacterial groups individually. The ammonium load has increased in Rp, this causes an increase in aeration to keep the rising pH value to the set-point by increasing the ammonium oxidation. A decrease in temperature will cause a decrease of the rate of ammonium oxidation and a rise in pH, causing an increase in supplied air. Increasing supplied air will increase the ammonium oxidation but also the nitrite oxidation by NOB. 34 5.2 SPECIFIC ANAMMOX ACTIVITY – SAA The SAA during the studied periods was stable in Mp 1, showed a tendency to increase in Mp 2 and increased in Rp (Table 9). Table 9 The average SAA in Mp 1, Mp 2 and Rp with standard deviation and number of samples during the different periods. Average SAA ± SD [g N m-2 day-1] Mp 1 Mp 2 Rp Period 1 2 3 5.9 ± 0.29 6.1 ± 0.17 6.0 ± 0.40 5.3 ± 0.45 6.0 ± 0.33 6.6 ± 0.86 5.8 ± 0.16 7.3 ± 0.70 9.1 ± 0.40 No. of samples Mp 1 Mp 2 Rp 4 5 4 5 5 4 2 6 4 The change in SAA with time is shown in Figure 30. 12 SAA [g N m-2 day-1] Period 1 Period 2 Period 3 10 8 6 4 2 0 18-09-14 03-10-14 18-10-14 02-11-14 17-11-14 02-12-14 17-12-14 Date Mp 1 Mp 2 Rp Figure 30 The SAA in Mp 1, Mp 2 and Rp. The SAA is greater in the sludge liquor pilot as temperature and substrate availability is higher there than in the mainstream pilot. Generally, the SAA should be greater in Mp 1 than in Mp 2 as ammonium load is higher there due to their serial connection. On the other hand, the COD load is always higher in Mp 1, which can decrease the SAA. As all batch tests are performed at the same temperature (28 °C) and with unlimited substrate the stability of the SAA in Mp 1 does not indicate that the actual nitrogen removal rate has been constant during the study but rather that the potential nitrogen removal by the anammox bacteria has been maintained. In the same way do the increasing trends with time of the SAA in Mp 2 and Rp indicate an increase in the potential nitrogen removal rate of the anammox bacteria and not the occurring removal rate. 5.2.1 Influence of temperature The temperature has decreased in the mainstream and sludge liquor pilot during the time of the study while the SAA has been stable in Mp and increased in Mp 2 (Figure 31) as well as in Rp (Figure 32). 35 30 12 Period 2 Period 3 25 10 20 8 15 6 10 4 5 2 0 18-09-14 03-10-14 18-10-14 02-11-14 17-11-14 02-12-14 SAA [g N m-2 day-1] Temperature [ᵒC] Period 1 0 17-12-14 Date Temperature SAA Mp 1 SAA Mp 2 Figure 31 The change in temperature and SAA in Mp 2 and Mp 1. 30 12 Period 2 Period 3 25 10 20 8 15 6 10 4 5 2 0 18-09-14 03-10-14 18-10-14 02-11-14 17-11-14 02-12-14 SAA N [g m-2 day-1] Temperature [ᵒC] Period 1 0 17-12-14 Date Temperature SAA Rp Figure 32 The change in temperature and SAA in Rp. The temperature has a great impact on the anammox activity (Siegrist et al., 2008; Lotti et al., 2015a). Sultana (2014) observed a decrease of the SAA in an MBBR with decreasing operating temperature when batch tests were performed at 25 °C. In this study an increase of SAA with decreasing MBBR operating temperature was observed in Rp, while the SAA in the mainstream reactors seemed unchanged with decreasing temperature (Figure 33). 36 SAA [g N m-2 day-1] 12 10 8 6 4 2 0 0 5 10 15 20 25 30 Pilot reactor operating temperature [°C] Mp 1 Mp 2 Rp Figure 33 The change in SAA with MBBR operating temperature in Mp 1, Mp 2 and Rp. Sultana (2014) though observed that the magnitude of the SAA at operating temperatures in the range of 19-13 °C was comparable, indicating that the anammox bacteria had adapted to the gradual change in temperature to some extent. This has also been stated by Lotti, et al. (2015a). The observed stability and increase of the SAA at the Manammox pilot plant could partly be explained by an adaption by the anammox bacteria to ambient temperatures. In the study by Sultana (2014) the MBBR was operated with a higher nitrogen loading at 19 °C. At 16 and 13 °C the load was kept constant at 1 g N m-2 day-1. In the Manammox sludge liquor pilot the load has instead increased. As the removal rate is strongly dependent on the load (Figure 29) in Rp the same trend as observed by Sultana (2014) is not to be expected at the Manammox pilot plant. As carriers are moved between the sludge liquor and mainstream reactors it is possible that the stability of the SAA in Mp 1 and slight increase in SAA in Mp 2 is due to the more favourable conditions in Rp, such as higher load and temperature. The carrier retention time is though quite high for the mainstream reactors (37 days) compared to the retention time in the sludge liquor (11 days). A previous study at Sjölunda WWTPs Manammox pilot plant (Stefansdottir, 2014) showed that the relationship between the inverted temperature and the natural logarithm of the SAA could be described by a linear equation (Table 10). Table 10 The linear equations for the inverted temperature dependency of the natural logarithm of the SAA in Mp 1, Mp 2 and Rp at the different temperature intervals of 10-20 °C and 20-30 °C. T is inserted in Kelvin and SAA in g N m-2 day-1 (Stefansdottir, 2014). Reactor Equation (10-20 °C) Equation (20-30 °C) Mp 1 ln 𝑆𝐴𝐴 = −18290 + 63.217 ln 𝑆𝐴𝐴 = −7756.6 + 27.447 Mp 2 ln 𝑆𝐴𝐴 = −25224 + 87.195 ln 𝑆𝐴𝐴 = −7041.5 + 24.996 Rp ln 𝑆𝐴𝐴 = −18162 + 63.069 ln 𝑆𝐴𝐴 = −7262.6 + 25.874 37 The measured SAA corrected with the decrease with temperature according to Table 10 from 28 °C, at which the batch tests were performed, to the actual operating temperature of the pilot reactors at the time is shown for Mp 1, Mp 2 and Rp in Figure 34. 12 Period 1 SAA [g m-2 day-1] 10 Period 2 Period 3 8 6 4 2 0 18-09-14 03-10-14 18-10-14 02-11-14 17-11-14 02-12-14 17-12-14 Date Corrected SAA Mp 1 Corrected SAA Mp 2 Corrected SAA Rp Figure 34 Measured SAA corrected to operating temperature in Mp 1, Mp 2 and Rp. The temperature corrected SAA gives an implication on what the anammox activity in the reactors should have been during the study if unlimited substrate was provided and no oxygen was present. The corrected SAA is thereby higher than the actual anammox activity. A comparison between the temperature corrected SAA and the nitrogen removal rate can be seen in Figure 35 for the mainstream reactor and in Figure 36 for the sludge liquor reactor. SAA and N removal rate [g N m-2 day-1] 3 Period 1 Period 2 Period 3 2 1 0 18-09-14 03-10-14 18-10-14 02-11-14 17-11-14 02-12-14 17-12-14 Date Corrected SAA Mp 1 Corrected SAA Mp 2 Nitrogen removal rate Figure 35 Temperature corrected SAA and nitrogen removal rate in Mp 1 and Mp 2 with time. 38 SAA and N removal rate [g N m-2 day-1] 8 7 Period 1 Period 2 Period 3 6 5 4 3 2 1 0 18-09-14 03-10-14 18-10-14 02-11-14 17-11-14 02-12-14 17-12-14 Date Corrected SAA Rp Nitrogen removal rate Figure 36 Temperature corrected SAA and nitrogen removal rate in Rp with time. The downward trend in the temperature corrected SAA in the mainstream indicating that the decreased nitrogen removal rate is not unexpected. In the mainstream reactor the average temperature corrected SAA decreased 53% from period 1 to period 3 while the average nitrogen removal rate decreased 42%. The difference between the SAA and actual nitrogen removal might indicate that a larger proportion of the nitrogen removal in period 3 is due to heterotrophic denitrification than in period 1. This is though expected as the reactors were constantly aerated in period 1, thereby the anoxic conditions required for denitrification were avoided. It is also possible that the difference is due to an underestimation of the potential SAA when performing the temperature correction. The evaluation of the temperatures effect on the anammox activity performed by Stefansdottir (2014) was based on short term batch test. The anammox bacteria were exposed to lower temperatures instantly, while the temperature change in the actual pilot reactors in this study were gradual. Studies have shown that the anammox bacteria are capable of some adaption to lower temperatures if the change is gradual (Lotti et al., 2015a). The evaluation of the decrease in SAA at the Manammox pilot plant due to decreasing temperatures performed by Stefansdottir (2014) might thereby be over-estimated, resulting in an underestimation of the potential SAA in the reactors. In the sludge liquor pilot the average temperature corrected SAA and nitrogen removal rate increased from period 1 to period 3 with 24% and 8% respectively. The difference in increase indicate that the potential SAA could not be fully utilized, possible due to limitations in nitrite availability as COD load increased significantly from period 1 to period 3 causing an inhibition of AOB activity (data not shown). 5.2.2 Influence of air flow The air flow was decreased from period 1 to period 2 and 3 in Mp 1 and Mp 2 (Figure 37) and increased in Rp (Figure 38). 39 Period 1 Period 2 Period 3 12 2 8 1 4 0 18-09-14 03-10-14 18-10-14 02-11-14 17-11-14 02-12-14 SAA [g N m-2 day-1] Air flow [Nm3 h-1] 3 0 17-12-14 Date Air flow Mp 1 Air flow Mp 2 SAA Mp 1 SAA Mp 2 Figure 37 Change in airflow and SAA in Mp 1 and Mp 2. 12 12 Period 2 Period 3 10 10 8 8 6 6 4 4 2 2 0 18-09-14 03-10-14 18-10-14 02-11-14 17-11-14 02-12-14 SAA [g m-2 day-1] Air flow [Nm3 h-1] Period 1 0 17-12-14 Date Air flow SAA Rp Figure 38 Change in airflow and SAA in Rp. The decrease in air flow from period 1 to period 2 and 3 in the mainstream reactor should decrease the anammox activity as the rate of ammonia oxidation by AOB will be reduced and thereby also the availability of nitrite. In Figure 39 it can be seen that the nitrogen removal rate has decreased from period 1 to period 2 and 3, as well as the total air flow to Mp 1 and Mp 2 together. The increase in air flow from period 1 to period 2 and further in to period 3 in Rp is due to the increased load and decreased temperature. Aeration is increased to maintain the pH setpoint when pH is increased due to higher ammonium loading or lower ammonium oxidation due to lower temperatures. The increased air flow had, as expected and observed, a positive impact on the activity of AOB and thereby the anammox process and the nitrogen removal rate (Figure 40). 40 Period 1 Period 2 Period 3 1 4 0.8 3 0.6 2 0.4 1 0.2 0 18-09-14 03-10-14 18-10-14 02-11-14 17-11-14 02-12-14 0 17-12-14 N removal rate [g N m-2 day-1] Air flow [Nm3 h-1] 5 Date Total air flow Nitrogen removal rate Figure 39 Change in total air flow to the mainstream reactor and nitrogen removal rate. Air flow [Nm3 h-1] 10 3 Period 1 Period 2 Period 3 2.5 8 2 6 1.5 4 1 2 0.5 0 18-09-14 03-10-14 18-10-14 02-11-14 17-11-14 02-12-14 N removal rate [g m-2 day-1] 12 0 17-12-14 Date Air flow Nitrogen removal rate Figure 40 Change in air flow and nitrogen removal rate in Rp. The nitrogen removal rate in the mainstream reactor seems to follow the changes in total air flow and exhibits a slight linear trend (Figure 41). 41 N removal rate [mg N m-2 day-1] 700 R2 = 0.57 600 500 400 300 200 100 0 0 1 2 3 Total air flow [Nm3 4 5 h-1] Figure 41 Nitrogen removal rate as a function of total air flow to the mainstream reactors. The nitrogen removal rate in the mainstream reactor has decreased from period 1 to 2 with 39% and the air flow was decreased with 25%. From period 1 to 3 the removal rate has decreased with 42% and the airflow was decreased with 30%. From Figure 40 and 41 and the fact that the potential anammox activity did not decrease it can be deduced that the nitrogen removal rate has decreased because of a reduced AOB activity due to the reduced supply of oxygen. The decrease in removal rate is though greater than the decrease in air flow. This is probably due to the lower availability of substrate since the ammonium load is lower in period 2 and 3 than in period 1 and reduced activities of all bacterial groups due to declining temperatures with time. 5.2.3 Influence of COD The influent COD concentration in the mainstream and sludge liquor pilot varied quite a lot during the studied period (Figure 42 and 43). The average COD concentration during the different periods increased in the sludge liquor pilot was quite stable in the mainstream reactor. 120 12 Period 2 Period 3 100 10 80 8 60 6 40 4 20 2 0 18-09-14 03-10-14 18-10-14 02-11-14 17-11-14 02-12-14 SAA [g m-2 day-1] COD [mg L-1] Period 1 0 17-12-14 Date Influent COD concentration SAA Mp 1 SAA Mp 2 Figure 42 Change in the influent COD concentration and SAA in Mp 1 and Mp 2. 42 Period 1 Period 2 12 Period 3 10 8000 8 6000 6 4000 4 2000 2 COD [mg L-1] 10000 0 14-09-18 14-10-03 14-10-18 14-11-02 14-11-17 14-12-02 SAA [g m-2 day-1] 12000 0 14-12-17 Date Influent COD concentration SAA Rp Figure 43 Change in the influent COD concentration and SAA in Rp. The COD concentration increased and decreased within the same operational periods but the SAA in Mp 1 and Mp 2 seems to be unaffected by this. Presence of fast growing heterotrophic bacteria increase as the availability of organic carbon increases. This potentially puts the anammox bacteria at risk of being overgrown by heterotrophic bacteria, with a decrease in SAA as a consequence. The increase and stability of the COD concentration in the influent to the sludge liquor and mainstream pilot implies that the rise/stability in the SAA not can be coupled with a decrease of the impact of heterotrophic bacteria due to a reduced COD concentration. 5.3 OXYGEN UPTAKE RATE – OUR In both mainstream reactors the average NOB OUR and AOB plus NOB OUR decreased and the average endogenous respiration increased. The same tendency was observed in the sludge liquor pilot (Table 11, 12 and 13). Table 11 Average endogenous OUR for Mp 1, Mp 2 and Rp. Period 1 2 3 Average endogenous OUR ± SD [mg m-2 h-1] Mp 1 Mp 2 Rp 42 ± 5.4 51 ± 10 57 ± 11 30 ± 1.8 33 ± 4.2 44 ± 4.8 No. of samples 28 ± 1.7 30 ± 4.3 36 ± 1.9 Mp 1 Mp 2 Rp 3 6 4 4 7 4 4 4 3 Table 12 Average AOB plus NOB OUR for Mp 1, Mp 2 and Rp. Period 1 2 3 Average AOB plus NOB OUR ± SD [mg m-2 h-1] Mp 1 Mp 2 Rp 270 ± 13 220 ± 39 210 ± 28 280 ± 11 260 ± 15 250 ± 20 270 ± 10 230 ± 10 250 ± 19 43 No. of samples Mp 1 Mp 2 Rp 3 6 4 4 7 4 4 4 3 Table 13 Average NOB OUR for Mp 1, Mp 2 and Rp. Period 1 2 3 Average NOB OUR ± SD [mg m-2 h-1] Mp 1 Mp 2 Rp No. of samples Mp 1 Mp 2 Rp 110 ± 5.3 120 ± 5.9 120 ± 5.1 97 ± 14 110 ± 5.2 110 ± 5.9 83 ± 6.9 98 ± 4.7 99 ± 3.5 3 6 4 4 7 4 3 4 3 The changes in NOB, endogenous and AOB plus NOB OUR with time are shown in Figure 44 for the mainstream reactors and in Figure 45 for Rp. 300 Period 1 Period 2 Period 3 OUR [mg m-2 h-1] 250 200 150 100 50 0 18-09-14 03-10-14 18-10-14 02-11-14 17-11-14 02-12-14 17-12-14 Date NOB OUR Mp 1 Endogenous OUR Mp 1 AOB plus NOB OUR Mp 1 NOB OUR Mp 2 Endogenous OUR Mp 2 AOB plus NOB OUR Mp 2 Figure 44 Changes in NOB, endogenous and AOB plus NOB OUR in Mp 1 and Mp 2. 300 Period 1 Period 2 Period 3 OUR [mg m-2 h-1] 250 200 150 100 50 0 18-09-14 03-10-14 18-10-14 02-11-14 17-11-14 02-12-14 17-12-14 Date NOB OUR Rp Endogenous OUR Rp AOB plus NOB OUR Rp Figure 45 Change in NOB OUR, endogenous OUR and AOB plus NOB OUR in Rp. 44 The decrease in AOB plus NOB OUR was of similar magnitude to that in the NOB OUR (Table 14). Table 14 The change in average AOB plus NOB OUR and NOB OUR from period 1 to period 2 and 3 in Mp 1, Mp 2 and Rp. Period Change in average AOB plus NOB OUR from period 1 [%] Mp 1 Mp 2 Rp 0 - 17 - 20 1 2 3 0 - 6.2 - 11 Change in average NOB OUR from period 1 [%] Mp 1 Mp 2 Rp 0 - 6.1 - 7.6 0 - 14 - 26 0 - 7.4 - 17 0 - 9.2 - 15 If NOB was inhibited selectively the decrease in NOB OUR should be greater than that in AOB plus NOB OUR. The small observed difference in decrease between AOB plus NOB OUR and NOB OUR does not imply this though. As AOB plus NOB OUR does not include the maximum NOB OUR, a larger decrease is expected in the NOB OUR. 5.3.1 Influence of air flow The air flow in the mainstream reactor was decreased from period 1 to period 2 and 3. This is expected to decrease the NOB OUR, which was observed (Figure 46). Period 1 Period 2 150 Period 3 2 100 1 50 0 18-09-14 03-10-14 18-10-14 02-11-14 17-11-14 02-12-14 OUR [mg m-2 h-1] Air flow [Nm3 h-1] 3 0 17-12-14 Date Air flow Mp 1 Air flow Mp 2 NOB OUR Mp 1 NOB OUR Mp 2 Figure 46 Change in NOB OUR and airflow in the mainstream reactor with time. The average NOB OUR decreased with 14% in Mp 1 and 7.4% in Mp 2 from period 1 to period 2 while the air flow was decreased with 25%. The NOB decrease was 26% and 17% for Mp 1 and Mp 2 respectively from period 1 to 3 when the air flow was decreased 30%. If NOB would have been successfully suppressed the decrease in NOB OUR should be greater than the one in air flow. 5.3.2 Influence of COD COD concentrations increased during mid period 2 in the mainstream pilot due to operational difficulties at the high-loaded activated sludge plant. The NOB OUR seems to 45 decrease and the endogenous OUR seems to increase as the COD concentration increases in all reactors (Figure 47 and 48). 150 150 Period 2 Period 3 120 120 90 90 60 60 30 30 0 18-09-14 03-10-14 18-10-14 02-11-14 17-11-14 02-12-14 OUR [mg m-2 h-1] COD [mg L-1] Period 1 0 17-12-14 Date Influent COD concentration NOB OUR Mp 1 NOB OUR Mp 2 Endogenous OUR Mp 1 Endogenous OUR Mp 2 Figure 47 Change in NOB OUR, endogenous OUR and influent COD concentration in Mp 1 and Mp 2. 10000 150 Period 2 Period 3 8000 120 6000 90 4000 60 2000 30 0 18-09-14 03-10-14 18-10-14 02-11-14 17-11-14 02-12-14 OUR [mg m-2 h-1] COD [mg L-1] Period 1 0 17-12-14 Date Influent COD concentration NOB OUR Rp Endogenous OUR Rp Figure 48 Change in NOB OUR, endogenous OUR and influent COD concentration in Rp. Increasing COD levels should have a positive effect on heterotrophic bacteria, which in turn would increase the endogenous respiration as observed. The increase in heterotrophic bacteria would also cause the NOB OUR to decrease as the accumulation of nitrifying bacteria has been shown to decrease with an increasing C:N ratio in biofilms due to the competition for DO and space (Okabe et al., 1996). In Figure 47 and 48 it can be observed that when the COD concentration ceases to increase, during period 3, the NOB activity increased. Thereby it can be concluded that the decrease in NOB activity can be coupled with an increased competition with heterotrophic bacteria. Mp 1 should be more sensitive to changes in COD concentration than Mp 2 as they are connected in series. This can be observed in Figure 47 as the decrease in NOB OUR is greater in Mp 1 than in Mp 2 with 46 increasing COD load. The NOB OUR in Rp seems less affected by changes in COD concentration than in the mainstream pilot even though they are larger. It is possible that the COD in the sludge liquor is more persistent than the COD in the mainstream wastewater as much of the easy degradable COD already has been digested during the anaerobic digestion of the sludge. The COD in the sludge liquor may therefore not have such a positive impact on heterotrophic growth as the COD in the mainstream wastewater has. The AOB plus NOB OUR exhibits the same behaviour as the NOB OUR with increasing COD levels in both mainstream (Figure 49) and sludge liquor reactor (Figure 50). 150 300 Period 2 Period 3 125 250 100 200 75 150 50 100 25 50 0 18-09-14 03-10-14 18-10-14 02-11-14 17-11-14 02-12-14 OUR [mg m-2 h-1] COD [mg L-1] Period 1 0 17-12-14 Date Influent COD concentration AOB plus NOB OUR Mp 1 Endogenous OUR Mp 1 Endogenous OUR Mp 2 AOB plus NOB OUR Mp 2 Figure 49 Change in AOB plus NOB OUR, endogenous OUR and influent COD concentration in Mp 1 and Mp 2. 10000 300 Period 2 Period 3 8000 240 6000 180 4000 120 2000 60 0 18-09-14 03-10-14 18-10-14 02-11-14 17-11-14 02-12-14 OUR [mg m-2 h-1] COD [mg L-1] Period 1 0 17-12-14 Date Influent COD concentration AOB plus NOB OUR Rp Endogenous OUR Rp Figure 50 Change in AOB plus NOB OUR, endogenous OUR and influent COD concentration in Rp. As AOB activity is included in the AOB plus NOB OUR it is likely that the increased COD load had the same decreasing effect on the AOB activity as on the NOB activity. The 47 150 0.5 COD [mg L-1] Period 1 Period 2 Period 3 120 0.4 90 0.3 60 0.2 30 0.1 0 18-09-14 03-10-14 18-10-14 02-11-14 17-11-14 02-12-14 0 17-12-14 NOB OUR/AOB plus NOB OUR [%] change in the ratio between NOB OUR and AOB plus NOB OUR in Mp 1 and Mp 2 can be seen in Figure 51. Date Influent COD NOB OUR/AOB plus NOB OUR Mp 1 NOB OUR/AOB plus NOB OUR Mp 2 Figure 51 Change influent COD concentration and in the ratio between NOB OUR and AOB plus NOB OUR in Mp 1 and Mp 2. It seems as when the NOB OUR was at its lowest (end of period 2), the ratio between NOB OUR and AOB plus NOB OUR was at its highest. From Figure 51 it can be deduced that the NOB had a more predominant role during periods of higher COD concentrations than in periods of lower COD concentrations. This implies that AOB was more affected by an increased COD concentration than NOB. 5.3.3 Influence of ammonium residual When the ammonium concentration is low in the effluent NOB activity seems to increase in Mp 2 (Figure 52). The sludge liquor pilot shows a slight tendency to the same trend (Figure 53). 150 Period 1 Period 2 Period 3 25 125 20 100 15 75 10 50 5 25 0 18-09-14 03-10-14 18-10-14 02-11-14 17-11-14 02-12-14 Date Ammonium residual NOB OUR Mp 2 Figure 52 Change in NOB OUR and ammonium residual in Mp 2. 48 0 17-12-14 OUR [mg m-2 h-1] NH4+-N residual [mg L-1] 30 150 Period 1 Period 2 Period 3 250 125 200 100 150 75 100 50 50 25 0 18-09-14 03-10-14 18-10-14 02-11-14 17-11-14 02-12-14 OUR [mg m-2 h-1] NH4+-N residual [mg L-1] 300 0 17-12-14 Date Ammonium residual NOB OUR Rp Figure 53 Change in NOB OUR and ammonia residual in Rp. The ammonium residual increased in the mainstream reactor with 9.2% from period 1 to period 2, and with 48% from period 1 to 3. In Rp the ammonium residual increased with 23% from period 1 to period 2, and with 140% from period 1 to 3. If no ammonium is left in the reactor ammonium oxidation cannot occur, thereby the competition for oxygen between AOB and NOB is reduced and NOB will thrive. The increase in ammonium residual can maybe partly explain the decrease in NOB activity. Although, in the end of period 3 the NOB activity seems to recover even though the ammonium residual is quite high. The changes in DO per ammonium in the bulk and NOB OUR in Mp 2 and Rp are shown in Figure 54. Data for Mp 1 is not shown as there are no online measurements of the bulk ammonium concentration in Mp 1. 140 DO/NH4+-N [g g-1] Period 1 Period 2 Period 3 3 120 100 80 2 60 40 1 OUR [mg m-2 h-1] 4 20 0 18-09-14 03-10-14 18-10-14 02-11-14 17-11-14 02-12-14 0 17-12-14 Date Oxygen/ammonium Mp 2 Oxygen/ammonium Rp NOB OUR Mp 2 NOB OUR Rp Figure 54 Change in NOB OUR and the ratio between DO bulk ammonium nitrogen concentration in Mp 2 and Rp. When DO are at such low levels that oxygen is limiting and bulk ammonium concentrations are high, the affinity constants to oxygen and ammonium of AOB allow them to grow more rapidly than NOB. This causes an increase in nitritation and a decrease in the oxygen available to NOB, causing them to be outcompeted by AOB. At lower 49 ammonium concentrations AOB growth rate will not exceed NOB growth rate, causing consumption of nitrite produced by AOB by NOB instead of anammox bacteria (Pérez et al., 2014). The less suppressive effect of oxygen limitation on NOB as g DO per g bulk ammonium concentration increase might explain the abruption of the decreasing trend of NOB OUR in the middle of period 2 and beginning of period 3. 50 6. CONCLUSIONS Nitrite-oxidising bacteria was not selectively inhibited by intermittent aeration, probably as the DO level did not reach 0 mg O2 L-1 during the non-aerated phase. Nitrite-oxidising bacteria and ammonia-oxidising bacteria activity was decreased in both mainstream and sludge liquor pilot when implementing intermittent aeration without increasing air flow rate or DO set-points. Nitrite-oxidising bacteria and ammonia-oxidising bacteria activity was decreased in both mainstream and sludge liquor pilot due to increased competition with heterotrophic bacteria. The potential anammox activity in the mainstream reactors was sustained when implementing intermittent aeration. The potential anammox activity increased in the sludge liquor pilot as the ammonium load increased. The nitrogen removal rate in the mainstream pilot decreased due to reduced temperature and ammonia-oxidising bacteria activity. The nitrogen removal rate increased in the sludge liquor pilot due to increased ammonium load. 51 52 7. FUTURE FOCUS AT THE MANAMMOX PILOT PLANT The Manammox pilot plant has been successful in maintaining a high potential anammox activity compared to other studies. The SAA in the mainstream reactors was around 6 g N m-2 day-1 when operating temperatures ranged from 16-20 °C. Sultana (2014) achieved a SAA of 2.3 g N m-2 day-1 at an operating temperature of 19 °C when batch test were performed at 25 °C. The limiting factor seems to be the availability of nitrite, i.e. sustaining a high AOB activity. Future studies should therefore focus on factors influencing AOB. During this study no NOB-inhibiting substances have been used in the batch tests. Sodium chlorate can be used to inhibit NOB. A study by Gustafsson (2013) though showed that the inhibition was not selective but that AOB also was inhibited to some extent. Other substances, such as azide, do inhibit NOB selectively but due to their toxic effect on humans they have not been applied during this study. The possibility of safely performing the batch OUR-test with a selective NOB-inhibiting substance in a laboratory should be considered as this could provide more significant information about the relative importance of AOB versus NOB. The DO level was not reduced to 0 mg L-1 during the anoxic phase in period 2 nor in period 3. Although increasing COD:N ratios are considered to decrease anammox activity as well as AOB and NOB activity (Desloover et al., 2011; Ballinger et al., 2002), further investigations of the reactors performance at different COD:N ratios should be carried out. Higher COD:N ratios will achieve a faster drop in the DO level when aeration is turned off and maintaining it low during the anoxic phase (Malovanyy et al., 2014). A sharper transition between aerobic and anoxic phase will decrease the time at which the reactors are operated with a low DO level at which Regmi, et al. (2014) concluded that NOB outcompete AOB. Another strategy for reducing the DO level faster could be to turn off the stirring in the reactors as aeration is switched off (Persson, pers.comm., 2014). This would of course not reduce the bulk DO level faster but it might help dropping the DO level in the biofilm more instantly. When the bulk is continuously stirred oxygen is pushed in to the biofilm, helping the diffusion. Turning off stirring would thereby reduce the oxygen diffusion in the biofilm by reduced convection. A faster drop of the DO level could also be achieved by increasing the ammonium load when aeration is turned off (Smets, pers.comm., 2014). By increasing the inflow when entering the anoxic phase more ammonium will be available, thereby more oxygen will be consumed by AOB causing a sharper drop in DO level. Carriers have been manually moved between the sludge liquor and mainstream pilot every second weekday, yielding a carrier retention time of 37 days in the mainstream pilot and 11 days in the sludge liquor pilot. This is done as it is believed to have a positive impact on the anammox activity and suppression of NOB but the effect has not been quantified. Further evaluation of this would be of importance as it would help in isolating other factors influencing the process. As carriers are moved between the sludge liquor and mainstream pilot it is important to make sure that NOB are totally repressed in the sludge liquor pilot. A small growth in the sludge liquor pilot could manifest itself in the mainstream reactors as conditions are more favourable for NOB there. Ammonium residual is not regulated at the Manammox pilot plant. Results from this study, as well as others studies (Pérez et al., 2014), indicate that NOB activity increase when 53 ammonium residual is low and oxygen is available. It would therefore be of interest to implement a control strategy based on the ammonium concentration in the effluent in an attempt to supress NOB further. Evaluating the impact of heterotrophic denitrification on the nitrogen removal rate would also aid in identifying good operational strategies. A study of the relative impact of denitrification and anammox at different operational periods would ensure that nitrogen removal is due to nitritation-anammox. The suggested topics for further studies can be summarized as follows Evaluation of the COD:N ratios impact on dropping the DO level Evaluation of the impact of no stirring during the non-aerated phase on the DO level in the biofilm Evaluation of the impact of increasing the inflow and thereby ammonium load during the anoxic phase on the DO level Evaluation of the effect of moving carriers between sludge liquor and mainstream pilot on the different nitrogen transforming bacteria Ensure total NOB repression in the sludge liquor pilot Evaluation of the effect of controlling ammonium residual on NOB activity Evaluation of the relative importance of heterotrophic denitrification at different operational strategies 54 8. REFERENCES Anthonisen, A.C., Loehr, R.C., Prakasam, T.B.S. and Srinath, E.G., 1976. Inhibition of Nitrification by Ammonia and Nitrous Acid. Water Pollution Control Federation, [e-journal] 48(5), pp.835-852. Ballinger, S.J., Head, I.M.m Curtis, T.P. and Godley A.R., 2002. The effect of C/N ratio on ammonia oxidizing bacteria community structure in a laboratory nitrificationdenitrification reactor. Water Science and Technology, 46(1-2), pp.543-550. Bitton, G., 2010. Wastewater Microbiology. [e-book] New Jersey: John Wiley & Sons, Inc. Cho, S., Fujii, N., Lee, T. and Okabe, S., 2011. Development of a simultaneous partial nitrification and anaerobic ammonia oxidation process in a single reactor. Bioresource Technology, [e-journal] 102(2), pp.652-659. Dapena-Mora, A., Fernández, I., Campos, J.L., Mosquera-Corral, A., Méndez, R. and Jetten, M.S.M., 2007. Evaluation of activity and inhibition effects on Anammox process by batch tests based on the nitrogen gas production. Enzyme and Microbial Technology, [e-journal] 40(4), pp.859-865. Desloover, J., De Clippeleir, H., Boeckx, P., Laing, G.D., Colsen, J., Verstraete, W. and Vlaeminck. Floc-based sequential partial nitritation and anammox at full scale with contrasting N2O emissions. Water Research, 45(9), pp.2811-2821. Ford, D.L, Churchwell, R.L. and Kachtick, J.W., 1980. Comprehensive analysis of nitrification of chemical processing wastewaters. Water Pollution Control Federation, [e-journal] 52(11), pp.2726-2746. Gerardi, M.H., 2006. Wastewater Bacteria. [e-book] New Jersey: John Wiley & Sons, Inc. Ginestet, P., Audic, J.M., Urbain, V. and Block, J.C., 1998. Estimation of nitrifying bacterial activities by measuring oxygen uptake in the presence of the metabolic inhibitors allylthiourea and azide. Applied and Environmental Microbiology, [online] Available at: http://www.ncbi.nlm.nih.gov/pmc/articles/PMC106310/ [Accessed 30 September 2014]. Gustafsson, I., 2013. Metoder för aktivitetstest av anammox och ammoniakoxiderande bakterier på bärarmaterial. Master thesis. Uppsala University. Gustavsson, D.J.I., Persson, F., Aspegren, H., Stålhandske, L., la Cour Jansen, J., 2012. Anammox i huvudströmmen – Vad är problemet?. VATTEN, [online] Available at: http://www.tidskriftenvatten.se/mag/tidskriftenvatten.se/dircode/docs/48_article_4595 .pdf [Accessed 4 November 2014]. Gustavsson, D.J.I., Aspegren, H., Stålhandske, L. and la Cour Jansen, J., 2013. Mainstream anammox at Sjölunda Wastewater Treatment Plant – pilot operation of sludge liquor treatment and start-up of the full process. In: Proceedings of 13th Nordic Wastewater Conference. Malmö, Sweden, 8-10 October 2013. Gustavsson, D.J.I., Persson, F. and la Cour Jansen, J., 2014. Manammox – mainstream anammox at Sjölunda WWTP. In: IWA (The International Water Association), Proceedings of IWA World Water Conference & Exhibition. Lisbon, Portugal, 21-26 September 2014. Hagman, M. and la Cour Jansen, J., 2007. Oxygen uptake rate measurements for application at wastewater treatment plants. VATTEN, [online] Available at: 55 http://www.tidskriftenvatten.se/mag/tidskriftenvatten.se/dircode/docs/48_article_236 1.pdf [Acsessed 25 September 2014]. Hanaki, K., Wantawin, C. and Ohgaki, S., 1990a. Effects of the activity of heterotrophs on nitrification in a suspended-growth reactor. Water Research, [e-journal] 24(3), pp.289-269. Hanaki, K., Wantawin, C. and Ohgaki, S., 1990b. Nitrification at low levels of dissolved oxygen with and without organic loading in a suspended-growth reactor. Water Research, [e-journal] 24(3), pp.297-302. Hanner, N., Aspegren, H., Nyberg, U. and Andersson, B., 2003. Upgrading the Sjölunda WWTP according to a novel process concept. Water Science and Technology, 47(12), pp.1-7. Hellinga, C., Schellen, A.A.J.C., Mulder, J.W., van Loosdrecht, M.C.M. and Heijnen, J.J., 1998. The Sharon® process: an innovative method for nitrogen removal from ammonium-rich waste water. Water Science and Technology, 37(9), pp.135-142. Hunik, J.H., Tramper, J. and Wijffels, R.H., 1994. A strategy to scale up nitrification processes with immobilized cells of nitrosomonas europea and nitrobacter agilis. Bioprocess Engineering, [e-journal] 11(2), pp.73-82. Jaroszynski, L.W., Cicek, N., Sparling, R. and Oleszkiewicz, J.A., 2012. Impact of free ammonia on anammox rates (anoxic ammonium oxidation) in a moving bed biofilm reactor. Chemosphere, 88(2), pp.188-195. Kartal, B., Kuenen, J.G. and van Loosdrecht, M.C.M., 2010. Sewage treatment with anammox. SCIENCE, [e-journal] 328(5979), pp.702-703. Kornaros, M., Dokianakis, S.N. and Lyberatos, G., 2010. Partial Nitrification/Denitrification Can Be Attributed to the Slow Response of Nitrite Oxidizing Bacteria to Periodic Anoxic Disturbances. Environmental Science & Technology, [e-journal] 44(19), pp.7245-7253. Lackner, S., Gilbert, E.M., Vlaeminck, S.E., Joss, A., Horn, H. and van Loosdrecht, M.C.M, 2014. Full-scale partial nitritation/anammox experiences – An application survey. Water Research, [e-journal] 55(2015), pp.292-303. la Cour Jansen, J. and Harremoës, P., 1984. Removal of soluble substrates in fixed films. Water Science and Technology, 17(2-3), pp. 1-14. Lemaire, R., Marcelino, M. and Yuan, Z., 2008. Achieving the Nitrite Pathway Using Aeration Phase Length Control and Step-Feed in a SBR Removing Nutrients From Abattoir Wastewater. Biotechnology and Bioengineering, [e-journal] 100(6), pp.1228-1236. Llano, N. and Galkin, V., 2014. Evaluation of bacteria population dynamics in mainstream anammox. Master thesis. Lund University. Lochmatter, S., Maillard, J. and Holliger, C., 2014. Nitrogen Removal over Nitrate by Aeration Control in Aerobic Granular Sludge Sequencing Batch Reactors. International journal of environmental research and public health, [e-journal] 11(7), pp.6955-6978. Lotti, T., van der Star, W.R.L., Kleerebezem, R., Lubello, C. and van Loosdrecht, M.C.M., 2012. The effect of nitrite inhibition on the anammox process. Water Research, [ejournal] 46(8), pp.2559-2569. 56 Lotti, T., Kleerebezem, R. and van Loosdrecht, M.C.M., 2015a. Effect of temperature change on anammox activity. Biotechnology and Bioengineering, 112(1), pp.98-103. Lotti, T., Kleerebezem, R., Hu, Z., Kartal, B., de Kreuk, M.K., van Erp Taalman Kip, C., Kruit, J., Hendrickx, T.L.G. and van Loosdrecht, M.C.M., 2015b (in press). Pilotscale evaluation of anammox based main-stream nitrogen removal from municipal wastewater. Environmental Technology. (Accepted for publication November 2014) Ma, B., Zhang, S., Zhang, L., Yi, P., Wang, J., Wang, S. and Peng, Y., 2011. The feasibility of using a two-stage autotrophic nitrogen removal process to treat sewage. Bioresource Technology, [e-journal] 102(17), pp.8331-8334. Malovanyy, A., Trela, J. and Plaza, E., 2014. Competition between AOB and NOB in deammonification MBBR treating mainstream wastewater. In: IWA (The International Water Association), IWA Specialist Conference “Global Challenges: Sustainable Wastewater Treatment and Resource Recovery”. Kathmandu, Nepal, 2630 Oct 2014. Mulder. A., van de Graaf, A.A., Robertson, L.A. and Kuenen, J.G., 1995. Anaerobic ammonium oxidation discovered in a denitrifying fluidized bed reactor. FEMS Microbiology Ecology, 16(1995), pp.177-184. Okabe, S., Oozawa, Y., Hirata, K. and Watanabe, Y., 1996. Relationship between population dynamics of nitrifiers in biofilms and reactor performance at various C:N ratios. Water Research, [e-journal] 30(7), pp.1563-1572. Olofsson, M., 2014. Development of the OUR method for measurements of AOB, NOB and heterotrophic bacteria activities. (in Swedish). Internal report at VA SYD. Oshiki, M., Shimokawa, M., Fujii, N., Satoh, H. and Okabe, S., 2011. Physiological characteristics of the anaerobic ammonium-oxidizing bacterium ‘Candidatus Brocadia sinica’. Microbiology, 157(6), pp.1706-1713. Pérez, J., Lotti, T., Kleerebezem, R., Picioreanu, C. and van Loosdrecht, M.C.M., 2014. Outcompeting nitrite-oxidizing bacteria in sewage treatment plants: A model-based study. Water Research, 66(2014), pp.208-218. Persson, F., 2014. Discussion on how to achieve a sharper transition between non-aerated and aerated phase in an MBBR. (Personal communication, December 2014) Plaza, E., Trela, J. and Hultman, 2011. Swedish experiences of the deammonification process in a biofilm system. In: WEF/IWA, Proceedings of the WEF/IWA Conference in Nutrient Recovery and Management. Miami,USA, 9-12 January 2011. Regmi, P., Miller, M.W., Holgate, B., Bunce, R., Park, H., Chandran, K., Wett, B., Murty, S. and Bott, C.B., 2014. Control of aeration, aerobic SRT and COD input for mainstream nitritation/denitritation. Water Research, [e-journal] 57(2014), pp.162171. Siegrist, H., Salzgeber, D., Eugster, J. and Joss, A., 2008. Anammox bring WWTP closer to energy autarky due to increased biogas production and reduced aeration energy for N-removal. Water Science and Technology, 57(3), pp.383-388. Sin, G., Kaelin, D., Kampschreur, M.J., Takács, I., Wett, B., Gernaey, K.V., Rieger, L., Siegrist, H. and Loosdrecht, M.C.M, 2008. Modelling nitrite in wastewater systems: a discussion of different modelling concepts. Water Science and Technology, 58(6), pp.1155-1171. 57 Smets, B., 2014. Discussion on how to achieve a sharper transition between non-aerated and aerated phase in an MBBR. (Personal communication, December 2014) Stefansdottir, D., 2014. Manometric method for evaluation of anammox activity in mainstream anammox at Sjölunda WWTP. Master thesis. Lund University. Strous, M., van Gerven, E., Kuenen, J.G. and Jetten, M.S.M., 1997a. Effects of Aerobic and Microaerobic Conditions on Anaerobic Ammonium-Oxidizing (Anammox) Sludge. Applied and Environmental Microbiology, [online] Available at: http://www.ncbi.nlm.nih.gov/pmc/articles/PMC1389188/pdf/hw2446.pdf [Accessed 29 October 2014]. Strous, M., Heijnen, J.J., Kuenen, J.G. and Jetten, M.S.M., 1998. The sequencing batch reactor as a powerful tool for the study of slow growing anaerobic ammoniumoxidizing microorganisms. Applied Microbiology and Biotechnology, [e-journal] 50(5), pp.589-596. Strous, M., Kuenen, J.G. and Jetten, M.S.M., 1999. Key physiology of anaerobic ammonium oxidation. Applied and Environmental Microbiology, [e-journal] 65(7), pp.3248-3250. Sultana, R., 2014. Partial Nitritation/anammox Process in a moving bed biofilm reactor operated at low temperatures. Licentiate thesis. The Royal Institute of Technology. Tang, C.J., Zheng, P., Wang, C.H. and Mahmood, Q., 2010. Suppression of anaerobic ammonium oxidizers under high organic content in high-rate Anammox UASB reactor. Bioresource Technology, [e-journal] 101(6), pp.1762-1768. Tappe, W., Laverman, A., Bohland, M., Braster, M., Rittershaus, S., Groeneweg, J. and van Verseveld, H.W., 1999. Maintenance Energy Demand and Starvation Recovery Dynamics of Nitrosomonas europaea and Nitrobacter winogradskyi Cultivated in a Retentostat with Complete Biomass Retention. Applied and Environmental Microbiology, [e-journal] 65(6), pp.2471-2477. Tsushima, I., Kindaichi, T. and Okabe, S., 2007. Quantification of anaerobic ammoniumoxidizing bacteria in enrichment cultures by real time PCR. Water Research, 41(4), pp.785-794. Vlaeminck, S.E. Terada, A., Smets, B.F., De Clippeleir, H., Schaubroeck, T., Bolca, S., Demeestere, L., Mast, J., Boon, N., Carballa, M. and Verstraete, W., 2010. Aggregate Size and Architecture Determine Microbial Activity Balance for Onestage Partial Nitritation and Anammox. Applied and Environmantal Microbiology, 76(3), pp.900-909. Wang, L.K., Pereira, N., Hung, Y.T. and Shammas, N.K. eds., 2009. Handbook of Environmental Engineering, Volume 8: Biological Treatment Processes. [e-book] New York: Humana Press. Wett, B., Hell, M., Nyhuis, G., Puempel, T., Takacs, I. and Murthy, S., 2010. Syntrophy of aerobic and anaerobic ammonia oxidisers. Water Science and Technology, 61(8), pp.1915-1922. Wett, B., Omari, A., Podmirseg, S.M., Han, M., Akintayo, O., Gómez Brandón, M., Murty, S., Bott, C., Hell, M., Takács, I., Nyhuis, G. and O’Shaugnessy, M., 2012. Going for mainstream deammonification from bench- to full-scale for maximized resource efficiency. Water Science and Technology, 68(2), pp.283-289. 58 Zumft, W. G., 1997. Cell biology and molecular basis of denitrification. Microbiology and Molecular Biology Reviews, 61(4), pp.533-616. Ødegaard, H., Gisvold, B. and Strickland, J., 2000. The influence of carrier size and shape in a moving bed biofilm process. Water Science and Technology, 41(4-5), pp.383391. 59 APPENDIX I – MANOMETRIC METHOD Preparation of chemical solutions Phosphate buffer, 1M 32.35 g Na2HPO4∙2H2O and 2.84 g NaH2PO4 was added to a 200 ml volumetric flask. Distilled water was added up to the 200 ml marking. The volumetric flask was placed on a magnetic stirrer with heating (50 °C) to facilitate the solvation. The solution was then stored slightly over room temperature. Ammonium solution, 5 mg NH4+-N mL-1 11.80 g (NH4)2SO4 was added to a 500 ml volumetric flask. Distilled water was then added up to the 500 ml marking. The volumetric flask was placed on a magnetic stirrer to facilitate the solvation of the salt. The solution was then stored in a refrigerator. Nitrite solution, 5 mg NO2--N mL-1 12.42 g NaNO2 was added to a 500 ml volumetric flask. Distilled water was then added up to the 500 ml marking. The volumetric flask was placed on a magnetic stirrer to facilitate the solvation of the salt. The solution was then stored in a refrigerator. Materials Bottle of volume 1 L Septum 240 carriers (fresh) Two syringes with a volume of 50 ml with needles Needle for pressure stabilization Water bath Magnetic stirrer MIXdrive 1 eco with control unit MIXcontrol 20, 2mag Water heater SHC2000, Scanvac Pressure meter GMH 5150, Greisinger electronic GmbH Sensor GMSD 350MR, Greisinger electronic GmbH Software GSOFT 3050, Greisinger electronic GmbH Method 1. 2. 3. 4. 5. 6. Fill up the water bath and set the temperature to 28 °C. Collect carriers and water from one of the three reactors of the Manammox pilot plant and note the time. Rinse the carriers carefully but thorough with tepid tap water in a colander. Manually count 240 carriers and put them in a 1 L reactor. Add 750 ml of distilled water, 22 ml of phosphate buffer and a magnetic stir bar to the reactor. Put a septum and a lock on the reactor 60 7. 8. 9. 10. 11. 12. 13. 14. 15. 16. 17. 18. 19. 20. Place the reactor on the magnetic stirrer in the water bath when the temperature of the water bath has reached 28 °C. It is recommended that the stirrer speed is successively increased up to 400 rpm to achieve a good mixing. Make sure that the water bath covers the liquid phase and head space of the reactor but not the septum. Leave the reactor in the water bath for 15 minutes. Hold the reactor so that the top is slightly above the water level, remove the septum and lock and measure the temperature and pH. Flush the solution with nitrogen gas for 10 minutes. Flush the headspace with nitrogen gas for 1.5 minutes. Put the septum and the lock back on the reactor immediately after removing the gas distributor. Start the pressure meter (not logging) and tare it. Place the pressure sensor connected to the pressure meter and a separate needle thru the septum. Leave the reactor in the water bath for 30 minutes for pressure and temperature stabilization. Add 20 ml ammonium solution and 20 ml nitrite solution with two separate 50 ml syringes and needles thru the septum. Make sure that the pressure is again stabilized at 0 mbar and then remove the separate needle from the septum. Start logging. Log one value each minute for 120 minutes. Stop logging Measure the temperature and pH and weigh the reactor. Fill the reactor with water and weigh it again. 61 APPENDIX II – OUR METHOD Preparation of chemical solutions Phosphate buffer, 1M 32.35 g Na2HPO4∙2H2O and 2.84 g NaH2PO4 was added to a 200 ml volumetric flask. Distilled water was added up to the 200 ml marking. The volumetric flask was placed on a magnetic stirrer with heating (50 °C) to facilitate the solvation. The solution was then stored slightly over room temperature. Ammonium solution, 5 mg NH4+-N mL-1 11.80 g (NH4)2SO4 was added to a 500 ml volumetric flask. Distilled water was then added up to the 500 ml marking. The volumetric flask was placed on a magnetic stirrer to facilitate the solvation of the salt. The solution was then stored in a refrigerator. Nitrite solution, 5 mg NO2--N mL-1 12.42 g NaNO2 was added to a 500 ml volumetric flask. Distilled water was then added up to the 500 ml marking. The volumetric flask was placed on a magnetic stirrer to facilitate the solvation of the salt. The solution was then stored in a refrigerator. 3.44 mM allyltiourea (ATU) Materials Two beakers with a volume of 500 ml Four syringes with a volume of 5 ml Two syringes with a volume of 10 ml Water bath Water heater/cooler LAUDA ECO SILVER, LAUDA Magnetic stirrer MIXdrive 1 eco with control unit MIXcontrol 20, 2mag Two sensors LDO and LDO101, HACH Two loggers HQ40d multi, HACH Stand for the sensors Air pump with two outflows, 3 Ls-1 each, and an effect of 3.5 W AIRLINE 3, SYSTEMA Two air tubes Two aeration stones Circuit breaker S-SYSTEM Supply 220 V AC Recycler, electromatic Phosphate buffer (1M) Ammonium solution (5 mg NH4-N mL-1) Nitrite solution (5 mg NO2-N mL-1) ATU (3.44 mM) 62 Method 1. Fill up the water bath and set the temperature to 28.3 °C. 2. Collect carriers and water from one of the three reactors of the Manammox pilot plant and note the time. 3. Rinse the carriers carefully but thorough with tepid tap water in a colander. 4. Manually count 128 carriers and put them in a 500 ml beaker. 5. Add 400 ml of tap water to the beaker. 6. Add a magnetic stir bar to the beaker. 7. Place the beaker on the magnetic stirrer in the water bath when the temperature of the water bath has reached 28.3 °C. 8. Start the magnetic stirrer with a stirring speed of 350 rpm. 9. Make sure that the aeration is off and place the LDO sensor and aeration stone in the beaker. They should be placed as far down as possible in the beaker without disturbing the stirring and not to close to each other. 10. When the temperature in the beaker has reached 28.0 °C- 28.3 °C, start the logging and start continuous aeration. 11. When the solution has been continuously aerated for 1.5 h, start taking the time and connect the air pump to the circuit breaker. Remember to make sure that the circuit breaker is switched on and that it is connected to a socket. One aeration cycle consists of no aeration and aeration. Depending on the length of a cycle the following steps will occur at different points of time. 12. Add 5.5 ml of phosphate buffer with a 10 ml syringe and 4 ml ammonium solution with a 5 ml syringe 30 s before cycle 4. 13. Add 1 ml ATU with a 4 ml syringe when the aeration has been on for 30 s in cycle 6. 14. Add 4 ml of nitrite solution with a 5 ml syringe 30 s before cycle 7. 15. When 10 cycles of no aeration/aeration has passed the experiment is finished. 16. Transfer data from the logger to an USB memory. 17. Rinse the carriers and return them to the reactor they were originally collected from. 63


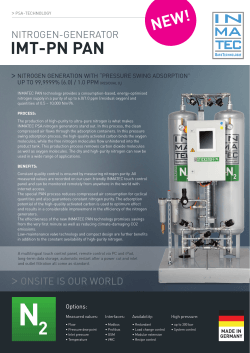

© Copyright 2026