
Functional SYNTAX Score for Risk Assessment in Multivessel Coronary Artery Disease
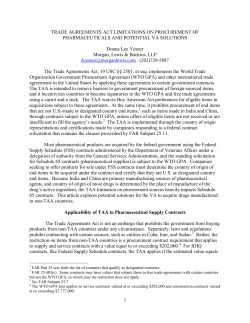
Journal of the American College of Cardiology © 2011 by the American College of Cardiology Foundation Published by Elsevier Inc. CLINICAL RESEARCH Vol. 58, No. 12, 2011 ISSN 0735-1097/$36.00 doi:10.1016/j.jacc.2011.06.020 Interventional Cardiology Functional SYNTAX Score for Risk Assessment in Multivessel Coronary Artery Disease Chang-Wook Nam, MD, PHD,*† Fabio Mangiacapra, MD,‡ Robert Entjes, MD,§ In-Sung Chung, MD, PHD,† Jan-Willem Sels, MD,§ Pim A. L. Tonino, MD, PHD,§ Bernard De Bruyne, MD, PHD,‡ Nico H. J. Pijls, MD, PHD,§ William F. Fearon, MD,* on behalf of the FAME Study Investigators Stanford, California; Daegu, Korea; Aalst, Belgium; and Eindhoven, the Netherlands Objectives This study was aimed at investigating whether a fractional flow reserve (FFR)-guided SYNTAX score (SS), termed “functional SYNTAX score” (FSS), would predict clinical outcome better than the classic SS in patients with multivessel coronary artery disease (CAD) undergoing percutaneous coronary intervention (PCI). Background The SS is a purely anatomic score based on the coronary angiogram and predicts outcome after PCI in patients with multivessel CAD. FFR-guided PCI improves outcomes by adding functional information to the anatomic information obtained from the angiogram. Methods The SS was prospectively collected in 497 patients enrolled in the FAME (Fractional Flow Reserve versus Angiography for Multivessel Evaluation) study. FSS was determined by only counting ischemia-producing lesions (FFR ⱕ0.80). The ability of each score to predict major adverse cardiac events (MACE) at 1 year was compared. Results The 497 patients were divided into tertiles of risk based on the SS. After determining the FSS for each patient, 32% moved to a lower-risk group as follows. MACE occurred in 9.0%, 11.3%, and 26.7% of patients in the low-, medium-, and high-FSS groups, respectively (p ⬍ 0.001). Only FSS and procedure time were independent predictors of 1-year MACE. FSS demonstrated a better predictive accuracy for MACE compared with SS (Harrell’s C of FSS, 0.677 vs. SS, 0.630, p ⫽ 0.02; integrated discrimination improvement of 1.94%, p ⬍ 0.001). Conclusions Recalculating SS by only incorporating ischemia-producing lesions as determined by FFR decreases the number of higher-risk patients and better discriminates risk for adverse events in patients with multivessel CAD undergoing PCI. (Fractional Flow Reserve versus Angiography for Multivessel Evaluation [FAME]; NCT00267774) (J Am Coll Cardiol 2011;58:1211–8) © 2011 by the American College of Cardiology Foundation As a result of the reduction of repeat revascularization after percutaneous coronary intervention (PCI) due to drugeluting stents, a large and growing number of patients with multivessel coronary artery disease (CAD) are undergoing PCI (1,2). However, the long-term safety and efficacy of these procedures remain controversial. Therefore, appropriate selection of target vessels and of methods for revascu- larization is critical to obtain optimal clinical outcomes in patients with multivessel CAD. The SYNTAX score (SS) is an anatomic scoring system based on the coronary angiogram, which not only quantifies lesion complexity, but also predicts outcome after PCI in patients with multivessel CAD and/or left main disease (2–5). The SS allows prospective risk stratification of patients with multivessel CAD undergoing PCI. However, the SS has several inherent limitations because it is angiog- From the *Division of Cardiovascular Medicine, Stanford University Medical Center, Stanford, California; †Division of Cardiology, Keimyung University Dongsan Medical Center, Daegu, Korea; ‡Cardiovascular Center Aalst, Aalst, Belgium; and the §Department of Cardiology, Catharina Hospital, Eindhoven, the Netherlands. Dr. De Bruyne has received research grants from the Meijer Lavino Foundation for Cardiac Research. Dr. Pijls has received an institutional research grant for the Catharina Hospital Eindhoven from St. Jude Medical. Dr. Fearon has received an institutional research grant from St. Jude Medical. All other authors have reported that they have no relationships relevant to the contents of this paper to disclose. Manuscript received February 9, 2011; revised manuscript received June 2, 2011, accepted June 14, 2011. See page 1219 Downloaded From: http://content.onlinejacc.org/ on 11/18/2014 raphy based (6). Recent studies have shown that many angiographically significant lesions are not hemodynamically significant, and stenting these stenoses results in worse outcomes (7–9). The FAME (Fractional Flow Reserve Versus Angiography in Multivessel Evaluation) study demonstrated that treatment based on fractional flow reserve (FFR) measurement in addition to angiography can de- 1212 Nam et al. Functional SYNTAX Score in Multivessel CAD Abbreviations and Acronyms AUC ⴝ area under the curve CABG ⴝ coronary artery bypass graft CAD ⴝ coronary artery disease CI ⴝ confidence interval FFR ⴝ fractional flow reserve FSS ⴝ functional SYNTAX score IDI ⴝ integrated discrimination improvement MACE ⴝ major adverse cardiac event(s) crease rates of major adverse cardiac events (MACE) in patients with multivessel CAD (10 –12). The aim of this study was to determine whether an FFRguided SYNTAX score, termed “functional SYNTAX score” (FSS) and defined as a recalculated SS counting only ischemiaproducing lesions as assessed by FFR, is a better predictor of 1-year clinical outcome in patients with multivessel CAD undergoing PCI. Methods Study design and population. This study was performed by rePCI ⴝ percutaneous analyzing the patients in the coronary intervention FFR-guided arm of the FAME ROC ⴝ receiver-operator study. In brief, FAME was a characteristic multicenter trial designed to inSS ⴝ SYNTAX score vestigate PCI outcomes in 1,005 patients with multivessel CAD (10). All patients were randomly assigned to angiographyguided PCI (n ⫽ 497) or FFR-guided PCI (n ⫽ 509). Patients assigned to angiographic guidance underwent stenting of all indicated lesions with drug-eluting stents. In patients assigned to FFR guidance, FFR was measured in each diseased coronary artery, and stents were placed only if the FFR was ⱕ0.80. Patients with angiographically significant left main CAD, previous coronary artery bypass graft (CABG) surgery, cardiogenic shock, or extremely tortuous or calcified coronary arteries were excluded. The FAME study protocol was approved by the internal review board or ethics committee of each participating center. The SS for each patient was calculated by 3 interventional cardiologists from different centers to assess interobserver reproducibility; the cardiologists were blinded to the baseline clinical characteristics, procedural data, clinical outcomes, and previously calculated SS. The lesions selected for this calculation were based on the previous FAME study (10). From the baseline diagnostic angiogram, each coronary lesion producing ⱖ50% diameter stenosis in vessels ⱖ1.5 mm by visual estimation was scored separately using the SS score algorithm from its website, and individual scores were added to provide the overall SS (4,13). FSS was calculated by separately adding the individual scores of lesions with an actual value of FFR ⱕ0.80 and ignoring lesions with FFR ⬎0.80. To assess intraobserver reproducibility, angiograms were reanalyzed by the same interventional cardiologist in 1 center at 8 weeks after the first analysis. The investigator remained blinded to the results of the first analysis. MI ⴝ myocardial infarction Downloaded From: http://content.onlinejacc.org/ on 11/18/2014 JACC Vol. 58, No. 12, 2011 September 13, 2011:1211–8 Procedural details. PCI was performed using standard techniques. Antiplatelet and antithrombotic agents were prescribed according to current PCI guidelines (14). FFR was measured with a coronary pressure guidewire (Radi, St. Jude Medical, Uppsala, Sweden) and defined as the ratio between mean distal coronary pressure and mean aortic pressure, both measured simultaneously at maximal hyperemia induced by intravenous adenosine, administered at 140 g/kg/min through a central vein. Hyperemic pressure pull-back recordings were performed as described previously (15,16). Quantitative coronary angiography was performed offline. Study endpoints. The primary endpoint was the rate of MACE at 1 year. MACE was defined as a composite of death, myocardial infarction (MI), or any repeat revascularization. Secondary endpoints included individual components of MACE. Death was defined as all-cause mortality. MI was defined as a 3-fold or greater elevation of creatine kinase-myocardial band (CK-MB) level or new Q waves in ⱖ2 contiguous leads of the electrocardiogram (17). Total CK and CK-MB levels were measured in all patients between 12 and 24 h after PCI. Repeat revascularization included repeat PCI or CABG. After discharge, follow-up was performed at 1 month, 6 months, and 1 year. Statistical analyses. All variables were stratified according to SS tertiles. Three groups of FSS were divided by the same cutoff score based on SS tertiles. Continuous variables, including SS, are expressed as mean ⫾ SD and were compared using 1-way ANOVA. Categorical data are presented as frequency (%) and were compared using the Pearson chi-square test or the Fisher exact test, appropriately. The reproducibility of SYNTAX scoring was evaluated by calculating intraobserver and interobserver reliability using intraclass correlation. Receiver-operator characteristic (ROC) curves analysis and integrated discrimination improvement (IDI) were used to compare the performance and predictive accuracy of the SS and FSS for MACE during 1-year follow-up (18). Multivariate logistic regression analysis also was used to assess independent predictors of MACE at 1 year. The parameters analyzed in multivariate analysis were selected when the p value was ⬍0.10 in the univariate analysis. Differences were considered to be statistically significant when the 2-sided p values were ⬍0.05. All statistical analyses were performed using SPSS version 15.0 for Windows (SPSS Inc., Chicago, Illinois) and SAS version 9.1 (SAS Institute Inc., Cary, North Carolina). Results SYNTAX score according to risk groups. The SS was prospectively measured in 497 patients of the 509 patients in the FFR-guided arm of the FAME study. Twelve cases were excluded because of missing angiograms. The range, mean, and median SS were 4 to 43, 14.8 ⫾ 6.0, and 13.8, respectively, whereas those for FSS were 0 to 43, 11.3 ⫾ 6.9, and 10.5, respectively. In this study, the 497 patients were divided into tertiles (intertertile range: 12 to 16) of risk JACC Vol. 58, No. 12, 2011 September 13, 2011:1211–8 based on the SS, namely low, medium, and high SS (34%, n ⫽ 167; 34%, n ⫽ 167; and 32%, n ⫽ 163, respectively) and analyzed. After incorporating FFR into the SS to calculate FSS, 32% of patients moved from a higher-risk group to a lower-risk group as follows: 23% of the highest SS tertile moved to the medium-risk FSS group and 15% moved to the lowest-risk FSS group, whereas 59% of the middle SS tertile moved to the lowest-risk FSS group. Thus, after calculating the FSS, 3 new groups were created as follows: low FSS, 59% (n ⫽ 290), medium FSS, 21% (n ⫽ 106), and high FSS, 20% (n ⫽ 101) (Fig. 1). Reproducibility of the SYNTAX score. The mean values of the SS calculated by 3 cardiologists were 14.1 ⫾ 5.4, 14.2 ⫾ 6.7, and 16.5 ⫾ 7.4, whereas those of FSS were 10.6 ⫾ 6.6, 10.9 ⫾ 7.5, and 12.4 ⫾ 8.1, respectively. An interobserver reliability of classic SS using the intraclass correlation analysis was 0.594, 95% confidence interval (CI): 0.515 to 0.661 (p ⬍ 0.0001), and that of FSS was increased as 0.713, 95% CI: 0.664 to 0.756 (p ⬍ 0.0001). With respect to intraobserver variability, the value of the SS in the first measurement was 14.2 ⫾ 6.7 versus 14.6 ⫾ 7.3 for the second measurement. The mean difference of intraobserver variability using paired t test for the classic SS was 0.358 ⫾ 3.175 (p ⫽ 0.013), and that of the FSS was 0.307 ⫾ 3.024 (p ⫽ 0.025). An intraobserver reliability of classic SS using the intraclass correlation analysis was 0.946, 95% CI: 0.9535 to 0.955 (p ⬍ 0.0001), and that of FSS was 0.961, 95% CI: 0.953 to 0.967 (p ⬍ 0.0001). Baseline characteristics and procedural results. Baseline clinical, angiographic, and procedural characteristics of the study population are summarized and stratified in Tables 1 and 2. Baseline clinical characteristics were not different among the 3 groups. However, the number of indicated lesions per patient, involvement of proximal left anterior descending coronary artery, and indicators of procedure complexity, such as procedure time, amount of contrast agent used, Figure 1 Nam et al. Functional SYNTAX Score in Multivessel CAD 1213 number of drug-eluting stents used, and total stent length were significantly larger in the higher-SS or -FSS group, reflecting the higher calculated score for these patients. 1-year outcomes according to the SS and FSS. Death or MI occurred in 4.8%, 7.5%, and 15.8% of patients with low, medium, and high FSS, respectively (p ⫽ 0.005). Although a similar trend was observed in the SS groups, the differences did not achieve statistical significance (5.4%, 6.0%, and 11.7% in the low-, medium-, and high-SS groups, p ⫽ 0.06) (Fig. 2). The rate of any repeat revascularization was 4.5% and 3.8% in the low and medium FSS groups, respectively, compared with 12.9% in the high-FSS group, respectively (p ⫽ 0.005). A similar pattern was observed in the SS groups (3.6%, 4.2%, and 10.4% in the low-, medium-, and high-SS groups, p ⫽ 0.02). The rate of MACE as a composite of death, MI, and repeat revascularization was 9.0%, 11.3%, and 26.7% in the low-, medium-, and high-FSS groups (p ⬍ 0.001) and 8.4%, 10.2%, and 20.9% in the low-, medium-, and high-SS groups, respectively (p ⫽ 0.001) (Fig. 2). Predictors of outcomes. Logistic regression analysis was used to define the predictors of MACE at 1 year (Table 3). Comorbidity with peripheral vascular disease, procedure time, contrast volume used, the SS, and FSS were related to MACE in univariate analysis. However, after multivariate adjustment, the independent predictors of 1-year MACE were FSS (relative risk: 1.14, 95% CI: 1.04 to 1.25, p ⫽ 0.006) and procedure time (relative risk: 1.01, 95% CI: 1.01 to 1.02, p ⫽ 0.003). SS versus FSS. ROC analysis for clinical outcomes at 1 year is shown in Figure 3. In the ROC for 1-year MACE, the area under the curve (AUC) for FSS was larger than that of SS (Harrell’s C of FSS, 0.677 vs. SS, 0.630, p ⫽ 0.02) (Fig. 3A). FSS demonstrated a better predictive accuracy for MACE compared with SS (IDI of 1.94%, p ⬍ 0.001). A similar result was observed in the ROC for death or MI; the Proportions of Study Population Proportions of the study population according to the tertiles of the classic SYNTAX score (SS) (A) and those of the functional SYNTAX score (FSS) (B). After incorporating FFR into the SS to calculate FSS, 32% of patients moved from a higher-risk group to a lower-risk group as follows: 38% of the highest SS tertile moved to the medium- or lowest-risk FSS group, whereas 59% of the medium-risk SS tertile moved to the lowest-risk FSS group. Downloaded From: http://content.onlinejacc.org/ on 11/18/2014 1214 Nam et al. Functional SYNTAX Score in Multivessel CAD JACC Vol. 58, No. 12, 2011 September 13, 2011:1211–8 Baseline Procedural of the Classic Table 1 andBaseline andCharacteristics Procedural Characteristics of SS theGroups Classic SS Groups Low SS (n ⴝ 167) Medium SS (n ⴝ 167) High SS (n ⴝ 163) p Value Clinical Age, yrs 64 ⫾ 10 65 ⫾ 10 65 ⫾ 10 0.40 Male 124 (74) 130 (78) 122 (75) 0.72 Diabetes 32 (19) 39 (23) 49 (30) 0.07 Hypertension 103 (62) 98 (59) 102 (63) 0.75 Hypercholesterolemia 119 (72) 122 (74) 115 (71) 0.87 Current smoking 54 (32) 46 (28) 36 (22) 0.12 Positive family history 73 (45) 58 (35) 69 (44) 0.16 Previous myocardial infarction 67 (40) 51 (31) 64 (39) 0.15 Previous PCI 47 (28) 49 (30) 47 (29) 0.96 Peripheral vascular disease 12 (7) 16 (10) 19 (12) 0.40 57 ⫾ 11 57 ⫾ 11 57 ⫾ 11 0.81 ⬍0.001 Left ventricular ejection fraction, % Angiographic 2.4 ⫾ 0.7 3.0 ⫾ 0.9 3.5 ⫾ 1.3 50%–70% narrowing 169 (42) 235 (47) 225 (39) 70%–90% narrowing 160 (40) 170 (34) 220 (38) 90%–99% narrowing 59 (15) 70 (14) 79 (14) Total occlusion 10 (3) 22 (5) 52 (9) 36 (22) 74 (44) 100 (61) ⬍0.001 9.1 ⫾ 1.9 13.9 ⫾ 1.2 21.6 ⫾ 4.7 ⬍0.001 Indicated lesions per patient Involvement of proximal LAD lesion SYNTAX score Procedural 56 ⫾ 28 69 ⫾ 44 85 ⫾ 50 ⬍0.001 233 ⫾ 104 265 ⫾ 111 321 ⫾ 161 ⬍0.001 Drug-eluting stents used per patient 1.4 ⫾ 0.9 1.6 ⫾ 0.9 2.2 ⫾ 1.1 ⬍0.001 Total stent length, mm 25 ⫾ 18 31 ⫾ 20 43 ⫾ 26 ⬍0.001 Average stent diameter, mm 3.0 ⫾ 0.4 2.9 ⫾ 0.4 2.9 ⫾ 0.3 0.43 Procedure time, min* Contrast agent used, ml Values are mean ⫾ SD or n (%). Patients were divided into tertiles according to the SYNTAX score (SS). *Procedure time was defined as time from introduction of first catheter until removal of last guiding catheter. LAD ⫽ left anterior descending coronary artery; PCI ⫽ percutaneous coronary intervention. AUC for FSS was larger than that of SS (0.676 vs. 0.621, p ⫽ 0.017) (Fig. 3B), and IDI of 1.30%, p ⫽ 0.0008. The results for any repeat revascularization showed Harrell’s C of FSS of 0.657 versus SS, 0.627 (p ⫽ 0.329) (Fig. 3C), and IDI of 0.54% (p ⫽ 0.02). When the clinical SS (19), which added clinical parameters to the classic SS, is compared with the FSS, the AUC for 1-year MACE for the FSS was larger than that of the clinical SS (0.687 vs. 0.608, p ⫽ 0.008). Discussion The major findings in the current study are that the FSS decreases the number of highest-risk patients as assessed by the classic SS while better discriminating risk for adverse cardiac events in patients with multivessel CAD undergoing PCI. Furthermore, the FSS is an independent predictor of 1-year MACE in these patients. Finally, the inter- and intraobserver variability of the FSS is better than that for the SS. These findings could have significant clinical implications on decision making regarding the choice of revascularization strategies in patients with multivessel CAD. Recently the SS, which is derived from coronary anatomy and lesion characteristics, was introduced to quantify lesion complexity and to predict early and late clinical outcomes Downloaded From: http://content.onlinejacc.org/ on 11/18/2014 after PCI in patients with multivessel CAD and/or left main disease (2,4). Methods of revascularization can be decided according to the SS and improve clinical outcome. However, it is well known that angiographic lesion assessment has several inherent limitations (6). The severity of a significant number of lesions is underestimated or overestimated by only using angiographic information. Moreover, PCI of a functionally nonsignificant stenosis is not of benefit to the patient, either from a prognostic or from a symptomatic point of view (7). In the FAME study, FFR-guided PCI in multivessel CAD was associated with a favorable 1- and 2-year clinical outcome compared with PCI guided by angiography alone (11). In the current study, by recalculating the SS after counting only ischemia-producing lesions with FFR ⱕ0.80, termed “functional SYNTAX score” (FSS), 32% of studied patients moved from higher-risk groups by SS to lower-risk groups by FSS (Fig. 1). In particular, 23% of patients in the highest SS tertile moved to the middle group, 15% of the highest tertile moved to the lowest group, and 59% of patients in the middle SS tertile moved to the lowest group. These changes were driven in large part by the conversion of angiographic 3-vessel CAD to functional 1- or 2-vessel CAD. Nam et al. Functional SYNTAX Score in Multivessel CAD JACC Vol. 58, No. 12, 2011 September 13, 2011:1211–8 1215 Baseline Procedural of the FSS Groups Table 2 andBaseline andCharacteristics Procedural Characteristics of the FSS Groups Low FSS (n ⴝ 290) Medium FSS (n ⴝ 106) High FSS (n ⴝ 101) p Value Age, yrs 64 ⫾ 10 66 ⫾ 10 65 ⫾ 11 0.31 Male 216 (75) 80 (76) 80 (79) 0.63 67 (23) 21 (20) 32 (32) 0.11 Hypertension 174 (60) 63 (59) 66 (65) 0.60 Hypercholesterolemia 209 (73) 72 (68) 75 (75) 0.51 88 (30) 27 (26) 21 (21) 0.17 120 (42) 38 (36) 42 (42) 0.47 107 (37) 35 (33) 40 (40) 0.64 Previous PCI 95 (33) 19 (18) 29 (29) 0.02 Peripheral vascular disease 21 (10) 7 (7) 11 (11) 0.53 58 ⫾ 11 57 ⫾ 11 56 ⫾ 12 0.55 ⬍0.001 Clinical Diabetes Current smoking Positive family history Previous myocardial infarction Left ventricular ejection fraction, % Angiographic 2.8 ⫾ 0.9 2.9 ⫾ 0.9 3.6 ⫾ 1.4 50%–70% narrowing 392 (49) 125 (40) 112 (31) 70%–90% narrowing 282 (35) 114 (37) 154 (43) 90%–99% narrowing 99 (13) 57 (18) 52 (14) Total occlusion 27 (3) 14 (5) 43 (12) 97 (33) 53 (50) 60 (59) ⬍0.001 6.7 ⫾ 3.5 13.9 ⫾ 1.3 21.7 ⫾ 5.0 ⬍0.001 ⬍0.001 Indicated lesions per patient Involvement of proximal LAD lesion SYNTAX score Procedural Procedure time, min* Contrast agent used, ml Drug-eluting stents used per patient 59 ⫾ 37 72 ⫾ 33 99 ⫾ 54 239 ⫾ 102 281 ⫾ 122 361 ⫾ 173 ⬍0.001 1.3 ⫾ 0.9 2.0 ⫾ 0.9 2.5 ⫾ 1.1 ⬍0.001 Total stent length, mm 25 ⫾ 18 40 ⫾ 19 49 ⫾ 27 ⬍0.001 Average stent diameter, mm 2.9⫾ 0.4 3.0 ⫾ 0.3 2.9 ⫾ 0.3 0.24 Values are mean ⫾ SD or n (%). Patients were divided into 3 groups using same tertile values of classic SS in Table 1. *Procedure time was defined as time from introduction of first catheter until removal of last guiding catheter. FSS ⫽ functional SYNTAX score; other abbreviations as in Table 1. With changes in the relative proportions of each risk group, the rate of MACE was accordingly increased from low- and medium-risk groups to the highest-risk group; this difference was greater in the FSS groups compared with the classic SS groups. The rate of death or myocardial infarction as a critical hard endpoint was significantly different in the FSS groups unlike the SS groups (Fig. 2). Because nearly all the ischemia-producing lesions were sufficiently revascularized at the time of the initial PCI, and the rate of repeat revascularization was very low in the low- and medium-FSS groups, as it was in the SS groups, the predictive accuracy of FSS for repeat revascularization was not statistically different from SS. However, the FSS did predict repeat revascularization in that the highest-FSS group had a significantly higher repeat revascularization rate compared with the lowest and middle groups. The MACE rate of the patients who moved from the high-risk group based on the classic SS to the low- and medium-risk groups based on the FSS was significantly lower when compared with those patients who remained in the high-risk group (11.3% vs. 26.7%, p ⫽ 0.028). Therefore, the FSS can not only help to more accurately stratify the risk in each patient with multivessel CAD, but it is also more closely related to prognosis after revascularization according to risk group. Downloaded From: http://content.onlinejacc.org/ on 11/18/2014 The decision on whether to perform PCI or CABG in patients with multivessel CAD remains highly controversial. If the 2010 European myocardial revascularization guidelines are applied to patients in this study (20), 43% (29 of 69 patients) of patients in whom CABG would be recommended due to 3-vessel CAD with an SS ⬎22 would move to a lower-risk group after calculation of the FSS and thereby might have another option. In contrast, when the fact is considered that the patients with high FSS had the worst 1-year outcome after PCI in all studied groups, surgical revascularization could be considered in the highrisk patients with multivessel CAD classified by FSS, and hopefully improve outcomes. This hypothesis will need to be tested by another randomized trial. In multivariate analysis, the independent predictors of cumulative 1-year MACE were FSS and procedure time. The result was the same when this analysis was repeated to predict only the hard endpoints of death and MI, or to predict 1-year MACE excluding periprocedural MI. In the latter analysis, the presence of diabetes was added to the original 2 predictors. The ROC and IDI analyses demonstrate a superior ability of the FSS to predict death or MI, and MACE at 1 year compared with the classic SS. The interobserver reproducibility of FSS also was better than 1216 Figure 2 Nam et al. Functional SYNTAX Score in Multivessel CAD JACC Vol. 58, No. 12, 2011 September 13, 2011:1211–8 Outcomes According to the SS The rates of death or myocardial infarction (MI) (A), and the rates of major adverse cardiac events (MACE), as composite of death, MI, or any repeat revascularization including repeat percutaneous coronary intervention and coronary artery bypass graft (B) according to the tertiles of SS and FSS. The rate of death or MI as a critical hard endpoint was significantly different in the FSS groups unlike the SS groups. The rate of MACE was accordingly increased for the highest-risk group; this trend was attenuated in the FSS groups compared with the classic SS groups. *p ⬍ 0.01, **p ⬍ 0.001. Abbreviations as in Figure 1. that of SS, because it eliminates functionally insignificant lesions, resulting in fewer lesions requiring inclusion and description by the SS and therefore fewer chances for disagreement. The FSS has better predictive accuracy and reliability than the classic SS. Therefore, the selection of target vessels, the method for revascularization, and the determination of prognosis in patients with multivessel CAD are improved by calculating the FSS in daily practice. The FSS still does not include clinical patient characteristics. Recent studies have demonstrated that the incorporation of clinical risk factors into scoring systems, such as the clinical SS or New Risk Stratification score, improves the predictability and accuracy of the SS (19,21). However, this was not the subject of this study and will have to be investigated further. Study limitations. First, because the current study is restricted to 1-year clinical outcome, unscored lesions by FFR guidance can progress to future adverse outcome beyond this time. However, a previous report demonstrated good clinical outcome up to 5 years in lesions deferred based on FFR guidance (7). Second, this study was not a direct comparison of outcomes between FFR-guided PCI and CABG in patients with multivessel CAD. Therefore, a new randomized trial would be necessary to prove that application of the FSS would result in better outcomes in patients undergoing PCI compared with CABG. Third, measuring FFR to calculate the FSS is inherently invasive and adds complexity, but the information is extremely valuable, and we believe it outweighs the added risk. Fourth, the FFR comparison was against visual calculation of the syntax score same as the SYNTAX (Synergy Between Percutaneous Coronary Intervention With Taxus and Cardiac Surgery) trial, and that if quantitative coronary angiography had been used, this may have affected the number of reclassified patients. Finally, this study population had 2- and 3-vessel disease, whereas the SYNTAX trial included patients with 3-vessel disease and/or left main disease. Therefore, direct comparison between studies or analysis using the same cutoff score as SYNTAX trial were impossible. However, patients in this study could still be stratified into low-, medium-, and higher-risk groups based on the FSS. Conclusions Compared with the classic SS, the FSS, which is obtained by counting only ischemia-provoking lesions, has better reproducibility, has better prognostic value, and increases the proportion of patients with multivessel CAD who fall into the lowest risk for adverse events after PCI. Predictors Composites of Death, MI,ofRepeat or CABGPCI, at 1orYear Table 3 for Predictors for Composites Death, PCI, MI, Repeat CABG at 1 Year Univariate Variables Multivariate Variables Relative Risk 95% CI p Value Relative Risk 95% CI p Value Diabetes 1.61 0.93–2.80 0.09 1.49 0.81–2.75 0.20 Hypertension 1.61 0.92–2.80 0.09 1.26 0.69–2.28 0.45 Peripheral vascular disease 2.11 1.02–4.36 0.045 1.54 0.67–3.51 0.31 Procedure time 1.01 1.01–1.02 ⬍0.001 1.01 1.01–1.02 0.003 Contrast agent used 1.01 1.00–1.01 0.01 1.00 0.99–1.01 0.61 Classic SYNTAX score 1.07 1.03–1.11 0.001 0.92 0.83–1.02 0.11 Functional SYNTAX score 1.08 1.05–1.12 ⬍0.001 1.14 1.04–1.25 0.006 CABG ⫽ coronary artery bypass graft; CI ⫽ confidence interval; MI ⫽ myocardial infarction; PCI ⫽ percutaneous coronary intervention. Downloaded From: http://content.onlinejacc.org/ on 11/18/2014 Nam et al. Functional SYNTAX Score in Multivessel CAD JACC Vol. 58, No. 12, 2011 September 13, 2011:1211–8 1217 Reprint requests and correspondence: Dr. William F. Fearon, Division of Cardiovascular Medicine, Stanford University Medical Center, 300 Pasteur Drive, H2103, Stanford, California 94305. E-mail: [email protected]. REFERENCES Figure 3 ROC Analysis Receiver-operator characteristic (ROC) curve analysis for the classic SS and FSS for composite of death, myocardial infarction (MI), or repeat revascularization (A), death or MI (B), and any revascularization (C). The ROC analysis demonstrates a superior ability of the FSS to predict death or MI and major adverse cardiac events at 1 year compared with the classic SS. p values in each figure are the comparison of Harrell’s C index model of SS and FSS. AUC ⫽ area under curve; CI ⫽ confidence interval; other abbreviations as in Figure 1. Downloaded From: http://content.onlinejacc.org/ on 11/18/2014 1. Kukreja N, Onuma Y, Garcia-Garcia HM, Daemen J, van Domburg R, Serruys PW. Three-year survival following multivessel percutaneous coronary intervention with bare-metal or drug-eluting stents in unselected patients. Am J Cardiol 2009;103:203–11. 2. Serruys PW, Morice MC, Kappetein AP, et al. Percutaneous coronary intervention versus coronary-artery bypass grafting for severe coronary artery disease. N Engl J Med 2009;360:961–72. 3. van Gaal WJ, Ponnuthurai FA, Selvanayagam J, et al. The Syntax score predicts peri-procedural myocardial necrosis during percutaneous coronary intervention. Int J Cardiol 2009;135:60 –5. 4. Serruys PW, Onuma Y, Garg S, et al. Assessment of the SYNTAX score in the Syntax study. EuroIntervention 2009;5:50 – 6. 5. Wykrzykowska JJ, Garg S, Girasis C, et al. Value of the SYNTAX score for risk assessment in the all-comers population of the randomized multicenter LEADERS (Limus Eluted from A Durable versus ERodable Stent coating) trial. J Am Coll Cardiol 2010;56:272–7. 6. Topol EJ, Nissen SE. Our preoccupation with coronary luminology. The dissociation between clinical and angiographic findings in ischemic heart disease. Circulation 1995;92:2333– 42. 7. Pijls NH, van Schaardenburgh P, Manoharan G, et al. Percutaneous coronary intervention of functionally nonsignificant stenosis: 5-year follow-up of the DEFER Study. J Am Coll Cardiol 2007;49:2105–11. 8. Shaw LJ, Berman DS, Maron DJ, et al. Optimal medical therapy with or without percutaneous coronary intervention to reduce ischemic burden: results from the Clinical Outcomes Utilizing Revascularization and Aggressive Drug Evaluation (COURAGE) trial nuclear substudy. Circulation 2008;117:1283–91. 9. Keun-Ho Park, Bon-Kwon Koo, Jung-Won Suh, et al. Assessment of intermediate coronary stenosis in Koreans using the fractional flow reserve. Korean Circ J 2008;38:468 –74. 10. Tonino PA, De Bruyne B, Pijls NH, et al. Fractional flow reserve versus angiography for guiding percutaneous coronary intervention. N Engl J Med 2009;360:213–24. 11. Pijls NH, Fearon WF, Tonino PA, et al. Fractional flow reserve versus angiography for guiding percutaneous coronary intervention in patients with multivessel coronary artery disease: 2-year follow-up of the FAME (Fractional Flow Reserve Versus Angiography for Multivessel Evaluation) study. J Am Coll Cardiol 2010;56:177– 84. 12. Tonino PA, Fearon WF, De Bruyne B, et al. Angiographic versus functional severity of coronary artery stenoses in the FAME study fractional flow reserve versus angiography in multivessel evaluation. J Am Coll Cardiol 2010;55:2816 –21. 13. Sianos G, Morel MA, Kappetein AP, et al. The SYNTAX Score: an angiographic tool grading the complexity of coronary artery disease. EuroIntervention 2005;1:219 –27. 14. Kushner FG, Hand M, Smith SC Jr., et al. 2009 focused updates: ACC/AHA guidelines for the management of patients with ST-elevation myocardial infarction (updating the 2004 guideline and 2007 focused update) and ACC/AHA/SCAI guidelines on percutaneous coronary intervention (updating the 2005 guideline and 2007 focused update): a report of the American College of Cardiology Foundation/American Heart Association Task Force on Practice Guidelines (erratum in J Am Coll Cardiol 2010;55:612; dosage error in article text J Am Coll Cardiol 2009;54:2464). J Am Coll Cardiol 2009;54:2205– 41. 15. Nam CW, Yoon HJ, Cho YK, et al. Outcomes of percutaneous coronary intervention in intermediate coronary artery disease: fractional flow reserve-guided versus intravascular ultrasound-guided. J Am Coll Cardiol Intv 2010;3:812–7. 16. Pijls NH. Optimum guidance of complex PCI by coronary pressure measurement. Heart 2004;90:1085–93. 17. Thygesen K, Alpert JS, White HD, et al. Universal definition of myocardial infarction. Circulation 2007;116:2634 –53. 1218 Nam et al. Functional SYNTAX Score in Multivessel CAD 18. Pencina MJ, D’Agostino RB Sr., D’Agostino RB Jr., Vasan RS. Evaluating the added predictive ability of a new marker: from area under the ROC curve to reclassification and beyond. Stat Med 2008;27:157–72, discussion 207–12. 19. Garg S, Sarno G, Garcia-Garcia HM, et al. A new tool for the risk stratification of patients with complex coronary artery disease: the Clinical SYNTAX Score. Circ Cardiovasc Interv 2010;3:317–26. 20. Wijns W, Kolh P, Danchin N, et al. Guidelines on myocardial revascularization: the Task Force on Myocardial Revascularization of the European Society of Cardiology (ESC) and the European Asso- Downloaded From: http://content.onlinejacc.org/ on 11/18/2014 JACC Vol. 58, No. 12, 2011 September 13, 2011:1211–8 ciation for Cardio-Thoracic Surgery (EACTS). Eur Heart J 2010;31:2501–55. 21. Chen SL, Chen JP, Mintz G, et al. Comparison between the NERS (New Risk Stratification) score and the SYNTAX (Synergy between Percutaneous Coronary Intervention with Taxus and Cardiac Surgery) score in outcome prediction for unprotected left main stenting. J Am Coll Cardiol Intv 2010;3:632– 41. Key Words: coronary angiography y coronary artery disease y fractional flow reserve y percutaneous coronary intervention y risk assessment.


© Copyright 2026