
Manipulating exciton fine-structure in quantum dots with a lateral electric field
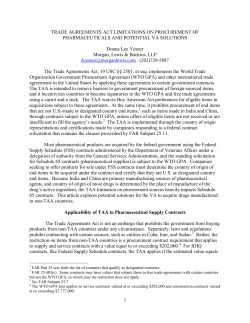
Manipulating exciton fine-structure in quantum dots
with a lateral electric field
B. D. Gerardot, S. Seidl, P. A. Dalgarno, and R. J. Warburton
School of Engineering and Physical Sciences, Heriot-Watt University, Edinburgh EH14 4AS, UK
D. Granados and J. M. Garcia,
Instituto de Microelectronica de Madrid, CNM (CSIC), Isaac Newton 8, PTM, 28760 Tres Cantos, Madrid, Spain
K. Kowalik and O. Krebs
CNRS-Laboratoire de Photonique et Nanostructures, Route de Nozay, 91460 Marcoussis, France
K. Karrai
Center for NanoScience and Department für Physik der LMU, Geschwister-Scholl-Platz 1, 80539 Munich, Germany
A. Badolato and P. M. Petroff,
Materials Department, University of California, Santa Barbara, California 93106
The fine structure of the neutral exciton in a single self assembled InGaAs quantum dot is investigated under the effect of a lateral electric field. Stark shifts up to 1.5 meV, an increase in linewidth,
and a decrease in photoluminescence intensity were observed due to the electric field. We show that
the lateral electric field strongly affects the exciton fine structure splitting due to active manipulation
of the single particle wave-functions. Remarkably, the splitting can be tuned over large values and
through zero.
There is currently great interest in producing entangled
photons on demand for applications in quantum information
processing [1]. One proposal which has spurred much research is to use the radiative biexciton-exciton cascade in
semiconductor quantum dots (QDs) to produce pairs of polarization entangled photons [2]. In an idealized QD, the
bright exciton states (M = ≤ 1) are degenerate. In this case
the two decay paths from the biexciton to the vacuum state
via the intermediate single exciton are indistinguishable in
energy, thus the photons emitted in the radiative cascade are
polarization entangled. However, in practice the rotational
symmetry of a self-assembled QD is broken and the electron-hole exchange interaction mixes the bright exciton
states into a non-degenerate doublet (referred to as a finestructure splitting, or FSS). This leads to an energetically
distinguishable recombination path for the biexciton-exciton
cascade. While polarization correlations are observed in the
linear basis, the polarization entanglement is destroyed due
to the FSS [3, 4]. For photons to be polarization entangled
using this scheme, the requirement that the FSS be less than
the homogeneous linewidth must be met. The FSS is typically 10-100 µeV, while the homogeneous linewidth of selfassembled InGaAs QDs is ~ 1 µeV [5].
Several techniques have been used to actively manipulate the value of the FSS, including: an in-plane electric [6]
or magnetic [7] field, and an in-situ uniaxial stress [8]. Also,
it has been reported that QDs which are smaller due to the
growth process [9] or subsequent annealing [10] have a
smaller FSS. Unfortunately, these QDs are higher in energy
and the photons produced by the QD become difficult to
distinguish from those produced in the wetting layer. Recently, polarization entangled photons from specific QDs
with energetically overlapping bright exciton states have
been reported [11, 12]. However, a robust approach that
would allow one to actively tune the FSS from a large value
to zero for each QD is still necessary in order to realize an
event ready entangled photon pair source. To this end we
further explore the effect of a lateral electric field on the
fine-structure splitting.
There are three basic characteristics of an exciton in a
lateral electric field attributed to the quantum confined Stark
effect, as has been investigated for quantum wells [13] and
QDs [14]: a red-shift in recombination energy, a decreased
oscillator strength, and a decreased exciton lifetime due to
an increase in non-radiative carrier tunnelling probability.
Additionally, electric fields also affect the FSS of a selfassembled QD [6], and while a thorough understanding is
still lacking the expectation of such an effect is motivated by
the following. The long-range component of the exchange
interaction greatly affects the FSS, and is largely determined
by the electron-hole overlap [15]. Self-assembled QDs
which are elongated along the [1-10] direction impart an
asymmetry onto the electron and hole wave-functions.
Therefore, an in-plane electric field changes the single particle wave-functions thus altering the electron-hole overlap
and affecting the FSS. While previous results demonstrated
a small change in the FSS [6], we show here a much
stronger effect such that the FSS can be tuned over a large
range (~ 100 µeV) and the degeneracy of the bright exciton
states can be restored.
Our samples consist of a single layer of self-assembled
InAs/GaAs QDs grown by molecular beam epitaxy. The
ground state exciton energies of the QDs are inhomogeneously broadened around 950 nm. Two CrNiAu gate electrodes, each 200 µm wide and separated by a 15 µm channel, were deposited using conventional photolithography.
The gate fingers were aligned parallel to the [1-10] direction
of the GaAs wafer. The Schottky contacts are used to induce
1
Pexc= 0.5 nW
22.1 µeV
a
0.996
-30
-20
-10
0
Polarization = π45
10
Laser Detuning (µeV)
20
30
40
b
30
20
10
0
0
90
180
270
360
450
540
630
The PL from several QDs at different spatial positions in
the channel between the two contacts was measured as a
function of applied bias. In contrast to previous reports [14],
for our device QDs in the centre of the channel show no
dependence on the applied bias, signifying that the voltage
drop entirely occurs in the depletion region near the gates.
By placing a detector below the sample, we can measure the
incident laser power in transmission. The transmission
power in this setup decreases as the laser spot moves on top
of the opaque Au contact. This allows us to measure the
ratio of the laser spot on top of the Schottky gate, providing
a measurement of the distance of the laser spot center from
the gate. In this way, we estimate the lateral depletion width
to be ~ 500 nm for the device. Fig. 2 shows the PL from a
neutral exciton as a function of applied bias for a QD located ~ 200 nm from the gate. Several features are observed
in the spectra. The first is that the PL of the neutral exciton
quenches abruptly at ≤ 1 V which we interpret as a charging
2
counts
Wavelength (nm)
958.8
958.4
500
55
55.00
Dot A
0
958.0
-6
-4
-2
0
2
4
6
Applied Bias (V)
FIG. 2: Low temperature (4 K) photoluminescence of a neutral exciton as a
function of applied bias from a QD located in the depletion region of the
device. The PL is quenched from ~ +1.0 to -1.0 V due to a charging event,
while at larger biases the exciton energy changes due to the Stark effect. In
addition to the Stark effect, the PL intensity decreases with increasing bias
due to a combination of reduced oscillator strength and carrier tunnelling.
The second feature of note is the large shift in energy, ~
1 meV for this QD, with applied bias. A dipole in an electric
field displays a Stark shift with a quadratic field dependence: E = E0 – pF + bF2, where E is the exciton energy, F
the electric field, p the permanent dipole moment, and b the
polarizability. In our device the electric field strength is
highly dependent on QD position and laser power (see below), so essentially we use the QD itself as a local in situ
probe of the electric field. To estimate F based on the Stark
shift observed by PL, we assume a rotationally symmetric
(in-plane) parabolic confinement potential. This leads to
zero dipole moment in the x-y plane, pxy = 0. We have
characterized similar QDs in other samples under the influence of vertical electric fields and find the average lateral
extent of the electron (Lexy) and hole (Lhxy) wave-function to
be 5 and 3 nm, respectively [16]. Using these values, we
estimate b = -4 µeV/(kV/cm)2 and for a Stark shift of 1
meV, F = 15kV/cm.
10 V
9V
8V
0V
946.5
1500
1000
946.0
500
945.5
Stark shift (µeV)
Linear Polarization (°)
FIG. 1: The fine-structure splitting of the neutral exciton for the same quantum dot measured using (a) laser spectroscopy and (b) polarization dependent photoluminescence. For the laser spectroscopy, the splitting of the two
peaks fit with Lorentzian lines is 22.1 µeV. The PL spectra were fit with a
Lorentian curve at each polarization. The solid line fit for the energy shift
due to polarization is a sin curve with an amplitude (i.e. FSS) of 26.6 ≤ 3.4
µeV. Additionally, there is a small drift in the PL energy likely caused by a
small temperature change in the spectrometer.
1000
1300
1300
Wavelength (nm)
λexc= 937 nm
0.998
Energy Shift (µeV)
Transmission
1.000
event. PL lines shifted in energy appear in the spectra between ≤ 1 V (not shown), but because of the relatively high
QD density in the sample it is difficult to assign different
lines to the same dot unambiguously.
Stark shift (µeV)
an electric field in the plane of the QDs, which are located
130 nm below the surface. However, due to the roughness
of the gate fingers (~ 3 µm), the exact direction of the electric field relative to the crystallographic axis for each QD is
not precisely known. Photoluminescence (PL) was performed using non-resonant excitation with an 850 nm laser
diode and a 0.5 m focal length spectrometer equipped with a
Si-CCD. The spectral resolution was measured to be ~ 33
µeV (FWHM) using a narrowband laser. The FWHM diameter of the diffraction-limited laser spot on the sample
surface is ~ 400 nm due to the use of a hemispherical glass
(n = 2.0) solid immersion lens. By measuring the polarization dependence of the PL, we can identify neutral excitons
in the QD emission through observation of the FSS. The
doublet of orthogonally linear-polarized lines can be resolved with an accuracy of ~ 5 µeV by using a Lorentzian
curve-fitting procedure [6, 7]. The accuracy of this technique was verified by comparing the doublet in PL to a
measurement on the same QD of the FSS made using transmission spectroscopy (Fig. 1), which has sub-µeV resolution
[5]. This comparison was made on a sample which allowed
for a vertical electric field as presently required in our
transmission experiment.
0
1
10
100
Excitation power in transmission (nW)
FIG. 3: The effect of carrier screening in the device for different applied
biases. At high excitation powers the Stark effect is strongly reduced due to
space-charge accumulation in the device. At low powers Stark shifts of ~
1.5 meV are observed for an applied bias of 10V.
Fig. 3 displays the Stark shift measured as a function of
laser power for four different applied biases on a different
QD than that in Fig. 2 but in the same region of the device.
As the laser power is increased the electric field at the QD’s
position is reduced due to a space-charge effect. This behavior can be explained by charge screening at the free surface;
excited electrons and holes in the depletion region are swept
in opposite directions and screen the electric field. Fig. 4
shows the intensity decrease due to the electric field for the
neutral exciton presented in Fig 1. This result is caused by a
combination of a reduction of oscillator strength and an in-
creased carrier tunneling probability. In addition, carriers
excited at 850 nm must relax into the ground state. Carriers
in the p-shell have an even larger tunneling probability than
those in the s-shell due to the electric field, effectively reducing the pumping rate into the ground state. The tunneling
of carriers out of the ground state also leads to a reduced
exciton lifetime and directly contributes to an increased
linewidth Γ. In addition, there may be significant spectral
diffusion caused by the large fluctuation in charge at the
nearby free surface. Due to the significant line broadening
observed at even a modest lateral electric field, the Stark
shift could not be used as the modulation in transmission
spectroscopy [5].
1600
100
(counts/120
75
800
50
400
25
0
0
250
500
750
Linewidth (µeV)
PL Intensity
sec)
Dot A
1200
0
1000
To engineer devices suitable for entangled photon production, these results indicate that a lateral electric field is
sufficient to tune the FSS to zero. However, the strong effect of carrier tunneling is a considerable drawback. Two
strategies may circumvent this problem. One would be to
find a QD with a small negative FSS that responds like Dot
A. In this scenario a very small electric field would be
needed thus tunneling is unlikely. A second approach might
be to use QDs with a deeper confining potential such that
the effect of carrier tunneling is reduced, although in such
dots the initial FSS may be larger.
In summary, we have studied QDs in the depletion region of a Schottky gate. A lateral electric field was used to
induce Stark shifts of up to 1.5 meV in the ground state neutral exciton. Additionally, a decrease in PL intensity and a
linewidth broadening were observed due to the electric
field. We report the manipulation of the FSS over a large
range (~ 100 µeV) and most importantly through zero. We
hope that these results stimulate a microscopic understanding of the electric field dependence on the exciton fine
structure splitting.
Stark Shift (µeV)
3
FSS (µeV)
FSS (µeV)
Previous experiments on the FSS of self-assembled QDs
have found the alignment of the linear polarization orientation to be orthogonal relative to the crystallographic fast
growth direction [1-10] [3, 4, 6, 7, 15]. We have studied
several QDs in the depletion region of our device, and surprisingly we find that the polarization orientation with respect to the crystal axis is not identical for each QD, similar
to that reported for CdTe/ZnTe QDs [17]. Nevertheless,
values for the FSS between 5 and 30 µeV at zero applied
bias were observed. Fig. 5 displays the fine-structure splitting for three QDs as a function of Stark shift. The three
QDs were located in the same sample in the same device
and each had a PL energy near 953 nm (≤ 5 nm), and therefore should be very similar. As the polarization orientation
is not the same for each QD, the distinction of positive or
negative for the FSS values are arbitrarily chosen.
In general, two types of behavior for the FSS as a function of electric field are observed. For Dot A in Fig. 5 an
intrinsic splitting of ~ 5 µeV is measured. With the application of the electric field, the FSS increases with a square
root dependence on the Stark shift. At the maximum field
for which there is still PL intensity, a FSS of ~ 94 µeV is
measured. For Dots B and C, intrinsic FSS values of 27 and
17 µeV are measured, respectively. For these two QDs, the
FSS shows evidence of an oscillatory response to the Stark
shift whereas the other properties of the QDs (i.e. linewidth,
intensity, energy) change monotonically with the Stark shift.
In Dot B the FSS approaches zero before increasing three
times. Dot C shows evidence of oscillatory behavior in
which the FSS remarkably crosses zero splitting. To identify if the dipoles are rotating in response to the electric
field, the polarization dependent PL was repeated at three
different biases (identified by arrows in Fig. 5) for Dot C. In
each case, the dipole orientation was the same.
100
100
Dot A
50
50
0
0
0
50
100 Dot B
100
150
200
250
300
100
50
50
0
0
0
FSS (µeV)
FIG. 4: PL intensity and linewidth as a function of Stark shift. With an
increasing electric field, the linewidth increases and a concurrent decrease
in PL intensity is observed. The dashed line corresponds to the resolution
limit of the spectrometer.
150
300
450
600
750
25
25
0
0
-25
-25 Dot C
0
25
50 75 100 125 150 175
Stark Shift (µeV)
FIG. 5: The fine-structure splitting of three different QDs as a function of
Stark shift. In Dot A, the splitting shows a square root dependence on the
Stark shift. Dots B and C exhibit a splitting with an oscillatory response to
the Stark shift. Dots A and B approach zero splitting, whereas in Dot C the
splitting is tuned through zero. The arrows for Dot C correspond to the
values where the dipole orientations were measured.
We acknowledge financial support for this work from
SANDIE (EU), EPSRC (UK), and DAAD (Germany).
[1] D. Bouwmeester, A. K. Ekert, and A. Zeillinger, The Physics of Quantum Information (Springer, Berlin, 2000).
[2] O. Benson, C. Santori, M. Pelton, and Y. Yamamoto, Phys. Rev. Lett.
84, 2513 (2000).
[3] C. Santori, D. Fattal, M. Pelton, G. S. Solomon, and Y. Yamamoto,
Phys. Rev. B 66, 045308 (2002).
[4] R. M. Stevenson, R. M. Thompson, A. J. Shields, I. Farrer, B. E. Kardynal, D. A. Ritchie, and M. Pepper, Phys. Rev. B 66, 081302(R) (2002).
[5] A. Högele, S. Seidl, M. Kroner, K. Karrai, R. J. Warburton, B. D.
Gerardot, and P. M. Petroff, Phys. Rev. Lett 93, 217401 (2004).
[6] K. Kowalik, O. Krebs, A. Lemaitre, S. Laurent, P. Senellart, P. Voison,
and J. A. Gaj, Appl. Phys. Lett. 86, 041907 (2005).
[7] R. M. Stevenson, R. J. Young, P. See, D. G. Gevaux, K. Cooper, P.
Atkinson, I. Farrer, D. A. Ritchie, and A. J. Shields, Phys. Rev. B 73,
033306 (2006).
[8] S. Seidle, M. Kroner, A. Högele, K. Karrai, R. J. Warburton, A.
Badolato, and P. M. Petroff, Appl. Phys. Lett 88, 203113 (2006).
[9] R. Sequin, A. Schliwa, S. Rodt, K. Potschke, U. W. Pohl, and D.
Bimberg, Phys. Rev. Lett 95, 257402 (2006).
[10] A. I. Tartakovskii, M. N. Makhonin, I. R. Sellers, J. Cahill, A. D.
Andreev, D. M. Whittaker, J. P. R. Wells, A. M. Fox, D. J. Mowbray, M. S.
Skolnik, K. M. Groom, M. J. Steer, H. Y. Liu, M. Hopkinson, Phys. Rev. B
70, 193303 (2004); W. Langbein, P. Borri, U. Woggon, V. Stavarache, D.
Reuter, and A. D. Wieck, Phys. Rev. B 69, 161301(R) (2004).
[11] N. Akopian, N. H. Lindner, E. Poem, Y. Berlatzky, J. Avron, D.
Gershoni, B. D. Gerardot, and P. M. Petroff, Phys. Rev. Lett 96, 130501
(2006).
[12] R. J. Young, R. M. Stevenson, P. Atkinson, K. Cooper, D. A. Ritchie,
and A. J. Shields, New J. Phys 8, 29 (2006); R. M. Stevenson, R. J. Young,
P. Atkinson, K. Cooper, D. A. Ritchie, and A. J. Shields, Nature 439, 179
(2006).
[13] D. A. B. Miller, D. S. Chemla, T. C. Damen, A. C. Gossard, W. Wiegmann, T. H. Wood, and C. A. Burrus, Phys. Rev. B 32, 1043 (1985).
[14] H. Gotoh, H. Kamada, H. Ando, and J. Temmyo, Appl. Phys. Lett. 76,
867 (2000); W. Heller, U. Bockelmann, and G. Abstreiter, Phys. Rev. B 57,
6270 (1998).
[15] M. Bayer, G. Ortner, O. Stern, A. Kuthar, A. A. Gorbunov, A. Forchel,
P. Hawrylak, S. Fafard, K. Hinzer, T. L. Reinecke, S. N. Walck, J. P.
Rathmaier, F. Klopf, and F. Schafer, Phys. Rev. B 65, 195315 (2002).
[16] R. J. Warburton, C. Schulhasuer, D. Haft, C. Schäflein, K. Karrai, J.
M. Garcia, W. Schoenfeld, and P. M. Petroff, Phys. Rev. B 65, 113303
(2002).
[17] L. Marsal, L. Besombes, F. Tinjod, K. Kheng, A. Wasiela, B. Gilles, J.
L. Rouviere, and H. Mariette, J. Appl. Phys. 91, 4936 (2002).
4


© Copyright 2026