
Document 432868
-AI Report No: TI'?-?NS/T Meeting Date: 14-157a November 12, 2014 Alameda-Contra Costa Transit District STAFF REPORT TO: Planning Committee AC Transit Board of Directors FROM: David J. Armijo, General Manager SUBJECT: AC Transit review of Emeryville Berkeley Oakland Transit Study (EBOTS) Proposal BRIEFING ITEM RECOMMENDED ACTION(S): Consider receiving a report on the draft Emeryville Berkeley Oakland Transit Study (EBOTS). EXECUTIVE SUMMARY: The EBOTS Study has reviewed potential improvements in transit service for West Oakland, Emeryville, and West Berkeley. When the Board last saw the study, it proposed a network of short routes connecting Emeryville, West Berkeley, and West Oakland to transit hubs such as BART stations. The Study now proposes a "Trunkline" from Jack London Square to Gilman Street & San Pablo Avenue in Berkeley via 3rd Street, Mandela Parkway, 40th Street, Hollis Street, 7th Street (BerkeleyL 6th Street, and Gilman Street. The Trunkli ne would operate every 10-15 minutes from 6:00 am to 10:00 pm on weekdays, and 7:00 am to 11:00 pm on weekends . This service would largely duplicate AC Transit service, especially service on San Pablo Avenue, and is unlikely to be a cost effective route. The study also includes a long range proposal for streetcars on two routes. The West Oakland route would operate from Jack London Amtrak station via the 2"d/3rd Street couplet to West Oa kland BART, loop around the station, then continue north on Mandela, Hollis, and east 401h Street to Macarthur BART. The Emeryville streetcar route would start at Macarthur BART, go 1 west on 40 h Street, north on Hollis Street, west on Powell, then loop on Shellmound and Christie in the Emery Bay Market area. Neither of the streetcar proposals seems likely to substantially improve transit in the corridor, compared to an improved AC Transit route network. BUDGETARY/FISCAL IMPACT: There are no budgetary/fiscal impacts associated with this report. There is potential in the future for loss of fare revenue if duplicative service is implemented under EBOTS. EBOTS service could also be a competitor for future capital funding. Report No. 14-157a Page 2 of 4 BACKGROUND/RATIONALE: AC Transit and EBOTS Attachment 1 includes maps of the Trunkline and Streetcar proposal. A staff report from the City of Emeryville describing the study is included as Attachment 2 and the draft EBOTS report is included as Attachment 3. The specific recommendations are included in the EBOTS report. Depending on time, place, and manner by which they are implemented, the EBOTS proposals could make the transit network more complicated and difficult to understand. They also have the potential to siphon ridership from nearby AC Transit routes. AC Transit has worked closely with Emeryville to coordinate service between AC Transit and the Emery Go Round shuttle/local transit service. Recognizing the interest in north-south service in the EBOTS corridor, in 2004 the District implemented Line 19 from Alameda to North Berkeley via West Oakland, Emeryville, and West Berkeley. Unfortunately, the line suffered from poor ridership-particularly in its northern segment-and was discontinued north of Emeryville in 2009. The southern Emeryville and West Oakland segments were incorporated into Line 26 and 31. AC Transit has participated in the EBOTS study since its initiation. However, the study's proposals have changed substantially in recent months contrary to staff's recommendations. When the study was last presented to the Board in June, the medium term proposal called for 2-3 short distance routes which connected the EBOTS corridor to major transit hubs such as BART stations. This proposal was partially developed by staff through participation in this study. The current proposal calls for a "Trunkline Corridor" from Jack London Square to West Berkeley via West Oakland BART and Emeryville, terminating at Gilman Street. The EBOTS route would closely parallel several AC Transit routes. In particular, it would parallel the route of Lines 72/72M/72R, in a very productive segment between 40th Street in Emeryville and University Avenue in Berkeley. Weekday service on this segment is four local trips per hour and five rapid trips per hour. EBOTS Proposal The short range proposals in EBOTS are based on concepts being reviewed as part of AC Transit's Comprehensive Operational Analysis (COA). Public outreach for the COA is underway; route level proposals are expected early next year. The study's medium term proposal is the Trunkline Connector. This corridor would be within Y, mile of San Pablo Avenue from 40th Street in Emeryville north, a duplicative location for a major route. The Trunkline Connector could result in ridership losses along San Pablo Avenue, resulting in a need to review San Pablo service for possible reductions. Data for the area does not indicate a great demand for the long north-south trips that the Trunkline would provide. The EBOTS proposed line would duplicate or closely parallel other AC Transit routes. In West Oakland, the Trunkline would be on the same streets as AC Transit service or within X mile of that service. In Emeryville and West Berkeley, the EBOTS route would be within Y, mile of San Pablo Avenue. Report No. 14-157a Page 3 of4 The EBOTS route would also largely replicate the eliminated Line 19. Justification for this route states that additional development in the last five years would make this route more productive now. However, only the Emeryville segment has experienced significant development. West Berkeley is particularly unlikely to have major development soon; the voters of Berkeley recently rejected a proposal to allow more non-industrial development in West Berkeley. If the City were to implement the EBOTS line, AC Transit would have to review its service in this area. There are previous examples within the District where the introduction of duplicative service resulted in a reduction of ridership on an AC Transit route and an ultimate reduction in AC Transit service. EBOTS in relation to San Pablo Avenue Lines 72, 72M, and 72R on San Pablo Avenue provide frequent north-south connections from Oakland through Emeryville, Berkeley and cities further north, seven days per week. Prior to the recent recession, there was considerable housing development along San Pablo Avenue, especially in Oakland, Emeryville, and Berkeley. With the economy back on the rise, development has returned. In the next 12 months, AC Transit will study the San Pablo corridor for transit infrastructure upgrades as part of the Major Corridors Study that AC Transit is now initiating. Given the high level of transit service and transit-oriented development, coupled with AC Transit's commitment to improve service along San Pablo Avenue, San Pablo seems more appropriate as the primary transit corridor in this area, deeming another trunk line corridor a half-mile away unnecessary. The EBOTS study projects that ridership on the EBOTS line would almost triple to quadruple between 2014 and 2020. Ridership would increase from 2,000 daily to 5,800-7,300 daily. It is difficult to see how this could occur, even with improved service. The pace of growth in this area does not support this type of projection. More refined numbers will be developed as part of the Alameda Countywide Transit Study that the Alameda County Transportation Commission is doing. Streetcars The study proposes streetcar service in the long term, which may be an excessively large investment for this corridor. Although streetcars are often politically popular, there is little evidence that streetcars improve transit ridership, which is the primary goal of this study. Streetcars have the operational disadvantages of local buses-having to operate in traffic without the advantages-the ability to maneuver around obstacles. Because of this, streetcars are generally slower than buses. Streetcars are also more expensive to build, operate, and maintain. While streetcars have often been asserted to provide economic development advantages, it is unclear if those advantages would exist along the EBOTS corridor. In addition, it is difficult to assess how much economic development could be attributed to a streetcar compared to other factors such as land use and other local policies. For these reasons, staff does not support the recommendation for a streetcar in this study area. The streetcar ridership projections are also questionable. The conditions of other streetcar lines cannot be direcly applied to streetcars in the East Bay. These particular segments can also be addressed through the analysis in the Countywide Transit Plan. Report No. 14-157a Page 4 of 4 Future Approach AC Transit understands the importance of the Emeryville-West Berkeley-West Oakland area, particularly with regard to potential employment growth. In addition, there are plans to add thousands of housing units. While almost all of the area is within walking distance of transit, many locations are not near frequent transit. As a result, staff believes that a frequent transit network is more important to the area over single transit line and streetcar. We will continue to work with the three cities to develop transit plans and projects that will be beneficial for passengers, for cities and for the AC Transit system. ADVANTAGES/DISADVANTAGES: The advantage of the study's recommendation for a proposed Trunkline would be to provide direct north-south service between numerous destinations. The disadvantage is that the line would duplicate existing AC Transit lines, and might use substantial operating funds without serving many passengers. The advantage of the streetcar is that it would provide a highly visible mode of transit. The disadvantages are that it would be slower and less flexible than buses, and would cost more to build and operate. ALTERNATIVES ANALYSIS: There are no alternatives associated with this briefing report or the EBOTS report PRIOR RELEVANT BOARD ACTIONS/POLICIES: SR 14-157, Presentation to the Board about EBOTS study ATTACHMENTS: 1: EBOTS Maps 2: City of Emeryville Staff Report on EBOTS 3: Draft Report- Emeryville Oakland Berkeley Transit Study Executive Staff Approval: Reviewed by: Prepared by: Dennis Butler, Acting Chief Planning, Engineering and Construction Officer Jim Cunradi, Long Range Planning Manager Robert Del Rosario, Director of Service Development Nathan Landau, Senior Transportation Planner EBOTS Trunkline Connector Enhanced Bus Route < ...._ _ __ c=::J EBOTS Study Area City Boundary Rail c::=J EBOTS Study Area City Boundary Rail Ferry lines Ferry lines Trunkline Conne<tor Route Other Routes Shuttles Removed AC Transit Routes New Conne<tor Route lineCl ---- .---~-- ---- _.-- l"'l New Streetcar Routes • • • lineSl • • • lineS2 • • • llneSl·B· 'Broadway Circulator· not included inEBOTS study ~-~ ... .. - - NewACTransitRoutes line13, 48 - - - Updated AC Transit Routes r::l Line 12, 14, 26, 49, 57, 72,12R,12M Unchanged ACTransit Routes llne51B, NL.F, H,Z - - Removed AC Transit Routes Line31 - - Shuttles Emecy-Go-Round Shuttles, West Berkeley Shuttle EBOTS Proposed Streetcar Routes )> .-+ .-+ OJ Vl n :::0 ;;;r- I-" 3ro ::::::1 .-+ I-" ~ I I-" V1 ....... OJ This page intentionally blank SR 14-157a Attachment 2 REPORT FROM CITY OF EMERYVILLE TO: AC Transit Board of Directors FROM: Diana Keena, Transportation Planner SUBJECT: Update on Emeryville Berkeley Oakland Transit Study (EBOTS) Report SUMMARY: The City of Emeryville is working with AC Transit, BART, the Emeryville and West Berkeley Transportation Management Associations, the Capitol Corridors Joint Powers Authority, the Cities of Oakland and Berkeley, and the Alameda County Transportation Commission to develop a vision for improving transit in Emeryville, West Oakland and West Berkeley. The Federal Transit Administration is funding the work. Based on comments from an extensive participation process, the attached draft report recommends changes to two of AC Transit's proposed route modifications; a Trunkline Connector enhanced bus from Jack London Square to West Oakland BART and north to Gilman Street in Berkeley, and Streetcars from MacArthur BART into Emeryville and West Oakland. BACKGROUND: This study is being conducted because the people in this corridor want better connection to each other and regional transit. In the fall of 2013, the team elicited comments about trips people wish to make, problems with transit, and ideas for solutions, through three community workshops and a questionnaire that received 800 responses. Based on this input, the consultants devised options for review at a round of workshops and meetings and a questionnaire in the spring of 2014. The study recommends the following improvements: Short-Term Improvements Short-term improvements would include expanding the West Berkeley shuttle and working with major developers to initiate a shuttle in West Oakland, along with recommending changes to AC Transit's proposed route modifications designed to better connect central Emeryville with downtown Berkeley and transbay service. These include routing the new 48 line from Emeryville Public Market to Shattuck and Bancroft between downtown Berkeley and UC Berkeley, and extending the F line a block north of Shellmound Way to serve the new bus hub at the Public Market. Emeryville report on EBOTS Page 2 of3 EBOTS Trunkline Connector Enhanced Bus Route The Trunkline Connector would be a branded hybrid bus with curb extensions and low-floor buses for level boarding, 10-minute frequency, hours from 6am to lOpm weekdays and 7am to 11pm weekends, signal priority for faster travel, shelters with cameras and bike racks, real-time arrival information, and marketing. It would provide bi-directional service from Jack London Square to West Oakland BART and north through Emeryville and West Berkeley, traveling on 3rd, Mandela, Hollis, 7th, 6th and Gilman. EBOTS Streetcar Routes The Emeryville Streetcar service would connect Emeryville to MacArthur BART by running in two directions on 40th, Shellmound, 64th, Christie, Powell, Hollis and back on 40th. This "figure 8" route would supplement the Emery Go-Round by adding service where ridership is highest. The West Oakland Streetcar would connect MacArthur BART, the East BayBridge shopping area, West Oakland BART, and Jack London Square, traveling on 40th, Mandela and 3rd. It would connect two ends of the Broadway transit service, forming the "0" envisioned in the West Oakland Specific Plan. If the Broadway service does not extend on 40th to MacArthur BART, the EBOTS service would need to extend on 40th to Broadway. Broadway Transit Study staff plan to present their study to the Oakland City Council in December or January. Funding and Implementation The report lists potential funding sources, explains what types of agencies can receive Federal formula funds, and lists funding sources and operator types that could work for the Trunkline Connector enhanced bus and the streetcars. The Trunkline Connector enhanced bus could be operated by a transportation management association or AC Transit. The streetcars could be operated by a transportation management association, AC Transit, BART, or a tri-city joint powers authority. Evaluation of Improvements The report estimates that the Trunkline Connector would add about 3,800 to 5,300 new riders, the West Oakland Streetcar would add about 3,100 to 4,200 new riders, and the Emeryville Streetcar would add about 4,900 to 6,300 new riders. Combined annualized capital cost and annual operation and maintenance cost of the recommendations is estimated as shown below: • • • Trunkline Connector (16.2 miles, 12 years): $19-21 million/year Emeryville Streetcar (5.3 miles, 30 years): $13-15 million/year West Oakland Streetcar (4.3 miles, 30 years): $9-11 million/year The Trunkline Connector enhanced bus would support economic development by improving access to development opportunity sites, promoting trips within the study area, and expanding access to and quality of transit in West Oakland. The streetcars would connect West Oakland to, and would better connect Emeryville to, MacArthur BART. Emeryville report on EBOTS Page 3 of 3 ADVANTAGES/DISADVANTAGES: The advantages of this study are that it describes transit improvements desired by people in Emeryville, West Oakland and West Berkeley; and it could lead to an opportunity for AC Transit to be involved in implementing the recommendations. The disadvantage of the recommendations is that they could lead to the establishment of service that could compete with two of AC Transit's potential service improvements. Specifically, the Trunkline Connector enhanced bus would overlap the part of AC Transit's potential rerouted 26 line that would run on Mandela, and the Emeryville streetcar would overlap AC Transit's potential 57 line extension on 40th and Shellmound. ALTERNATIVES ANALYSIS: The options reviewed in June included "C" shaped routes connecting the Mandela-Hollis-G'h corridor to MacArthur, Ashby and North Berkeley BART stations. The Emeryville City Council directed staff to focus on connecting the corridor to itself, and AC Transit staff pointed out that serving BART stations from one direction could compete with AC Transit lines that serve those stations from both directions. The proposed bus route was devised in response to these concerns. PRIOR RELEVANT BOARD ACTIONS/POLICIES: On June 11, 2014, the Board heard a report on options and provided comments. This page intentionally blank Emeryville Berkeley Oakland Transit Study September 201 4 This project was completed in collaboration with: City of Berkeley City of Oakland ACTransit Bay Area Rapid Transit Amtrak Capitol Corridor Emeryville Transportation Management Association City of Emeryville 1333 Park Avenue Emeryville, CA 94608 West Berkeley Transportation Management Association Alameda County Transportation Commission Metropolitan Transportation Commission Emeryville Berkeley Oakland Transit Study September 2014 Prepared by: CDM Smith In association with: CHS Consulting Group BAE Urban Economics MIG Inc. Nancy Whelan Consulting City of Emeryville 1333 Park Avenue Emeryville, CA 94608 TABLE OF CONTENTS 1. Project Background ........................................................................................................ 1 Technical Advisory Committee (TAC).............................................................................................................. 1 Project Goals and Objectives .............................................................................................................................. 2 2. Planning Process ............................................................................................................ 3 Process of Developing Options ......................................................................................................................... 3 Community Engagement ..................................................................................................................................... 5 3. Transit Context............................................................................................................... 8 Transit Markets ..................................................................................................................................................... 8 Existing Context ................................................................................................................................................... 8 Planned Improvements ...................................................................................................................................... 10 4. Proposed Transit Improvements ................................................................................... 15 Short-Term Improvements (1 - 5 years).......................................................................................................... 15 EBOTS Trunkline Connector Route (5 – 10 Years) ..................................................................................... 17 EBOTS Streetcar Routes (10 – 20 Years) ....................................................................................................... 19 5. Evaluation of Improvements......................................................................................... 23 Ridership .............................................................................................................................................................. 23 Vehicle Miles Traveled (VMT) Analysis .......................................................................................................... 25 Effects on Environmental Justice Communities ........................................................................................... 26 Safety and Security .............................................................................................................................................. 31 Costs ..................................................................................................................................................................... 33 Compatibility with Existing Transit ................................................................................................................. 35 Economic Development Impact ...................................................................................................................... 36 6. Funding and Implementation ....................................................................................... 45 Federal Funding Recipients ............................................................................................................................... 45 Potential Funding Sources ................................................................................................................................. 45 Trunkline Connector Route .............................................................................................................................. 48 Streetcar Routes .................................................................................................................................................. 49 Fund Readiness Strategies ................................................................................................................................. 50 Other Potential Sources ..................................................................................................................................... 52 Emeryville Berkeley Oakland Transit Study i List of Figures Figure 1: Initial Evaluation Connectors Option ......................................................................................................................5 Figure 2: Current AC Transit and Shuttle Routes ............................................................................................................... 13 Figure 3: Shuttle Routes and Potential AC Transit Routes ............................................................................................. 14 Figure 4: Trunkline Connector Route ...................................................................................................................................... 18 Figure 5: Proposed Streetcar Routes ....................................................................................................................................... 21 Figure 6: Proposed Trunkline Connector and Streetcar Routes .................................................................................. 22 Figure 7: EBOTS Study Area Minority Populations............................................................................................................ 29 Figure 8: EBOTS Study Area Low-Income Populations.................................................................................................... 30 List of Tables Table 1: Existing Transit Markets and Service........................................................................................................................8 Table 2: Transit Improvements – Daily Ridership Forecast .......................................................................................... 24 Table 3: Daily VMT Reduction by Route ................................................................................................................................. 25 Table 4: Minority and Low Income Populations in the EBOTS Study Area ............................................................. 27 Table 5: Minority and Low-Income within 1/4 mile of routes ..................................................................................... 27 Table 6: Compatibility with Existing Transit ........................................................................................................................ 35 Table 7: Projected Employment and Household Change by EBOTS Subarea, Year 2010 - 2035 ................... 36 Table 8: Value Capture Strategies Overview ........................................................................................................................ 40 Table 9: Projected new Development Measures in the EBOTS Area, 2015-2035................................................. 42 Table 10: Potential New Property Tax Increment, EBOTS Area, 2015-2035 ......................................................... 42 Table 11: Economic Development Impact by EBOTS Transit Project ....................................................................... 43 Table 12: Summary of Potential Funding Sources by Project ....................................................................................... 46 Table 13: Independent means Fund Readiness Strategies ............................................................................................. 51 Table 14: Additional Potential Sources of Funding for Proposed Routes ................................................................ 52 Emeryville Berkeley Oakland Transit Study ii Project Participants Technical Advisory Committee Policy Advisory Committee City of Berkeley – Transportation – Matt Nichols, Andrew Heidel, Fatema Crane Berkeley Mayor’s Office – Calvin Fong City of Berkeley – Planning – Alex Amoroso, Jordan Harrison, Warren Logan City of Berkeley – Economic Development – Jennifer Cogley City of Emeryville – Transportation – Michael Roberts City of Emeryville – Planning – Charles S. Bryant City of Emeryville – Economic Development – Amber Evans City of Oakland – Transportation – Jamie Parks City of Oakland – Planning – Elois Thornton City of Oakland – Economic Development – Margot Lederer Prado AC Transit – Planning – Nathan Landau Emeryville Mayor – Jac Asher Oakland Mayor’s Office – Melissa Vargas, Michael Johnson Oakland Community Economic Development Committee Emeryville Transportation Management Association Board President – Geoff Sears Oakland Planning Commission West Berkeley Transportation Management Association Board President – Trina Ostrander West Oakland Neighbors Metropolitan Transportation Commission – Transit - Kenneth Folan West Oakland Business Alert Emeryville Staff Project Manager – Diana Keena Berkeley Chamber of Commerce – Erik Holland Assistant Planner – Sara Billing Emeryville Chamber of Commerce – Bob Canter Interns – Brandon Harrell, Maria Bakali Oakland Metropolitan Chamber of Commerce – Charissa Frank Oakland Staff Coordination West Oakland Commerce Association – Steve Lowe Emeryville Resident – John Scheuerman Alameda County Transportation Commission – Planning – Kara Vuicich Emeryville Planning Commission BART Directors– Zachary Mallett, Rebecca Saltzman BART – Planning – Duncan Watry Capitol Corridor – Planning – James Allison Emeryville Economic Development Committee Emeryville Transportation Committee Berkeley Resident – Paula Bradford Emeryville and West Berkeley Transportation Management Associations – Operations – Roni Hattrup Berkeley Transportation Commission AC Transit Board Member –Greg Harper AC Transit – Operations – Stephen Newhouse Emeryville and West Berkeley Transportation Management Associations – Planning – Trudy Presser Emeryville Transportation Management Association Oakland Residents – Suzanne Loosen, Ray Kidd East Bay Housing Organizations – Darin Lounds Center for Independent Living – Ben NcMullan, Brandon Young Councils, Boards, Committees and Groups Berkeley City Council Emeryville City Council Broadway Transit Study - Zach Seal, Bruce Williams Consultants CDM Smith – Bill Hurrell, Brian Soland, Peter Martin, Kelly Clonts CHS Consulting Group – Bill Lieberman MIG Inc. – Jamillah Jordan, Joan Chaplick BAE Urban Economics – Ron Golem, Jessica Hitchcock Nancy Whelan Consulting – Nancy Whelan, Tina Spencer Caltrans Staff Project Manager - Sergio Ruiz Project Supervisor – Becky Frank Oakland City Council Alameda- Contra Costa Transit Board Bay Area Rapid Transit Board of Directors Emeryville Berkeley Oakland Transit Study iii 1. Project Background The purpose of the Emeryville Berkeley Oakland Transit Study (EBOTS) is to explore future visions for the study area with respect to transit as it relates to land use in Emeryville, West Berkeley, and West Oakland. Planned population and job growth and increased investment in the area will spur the need for additional transportation investments, including transit, pedestrian, and bicycle improvements. The corridor is a jobs-rich environment with more employment than housing; mobility improvements offer the potential for improved access to jobs for those living in, near, or commuting to the corridor. This report is organized by discussing the background and planning process, the transit context of the study area, reviewing the proposed improvements, evaluating them, then finally discussing implementation and funding. Section One describes the project background. Section Two discusses the planning process, community engagement, and iterative process that led to the development of the proposed routes. Section Three provides a description of the transit context in the EBOTS study area including planned improvements. Section Four provides a description of the proposed transit improvements for the EBOTS study area. Section Five includes an evaluation of the proposed routes based on a range of factors, including: ridership, vehicle miles traveled, environmental justice, safety and security, costs, economic development, and compatibility with existing transit. Section Six includes a high-level look at the funding and implementation strategy. Technical Advisory Committee (TAC) The Technical Advisory Committee (TAC) is made up of representatives from the City of Emeryville, City of Berkeley, City of Oakland, AC Transit, BART, Amtrak Capitol Corridor, Emeryville Transportation Management Association (ETMA), West Berkeley Transportation Management Association, Alameda County Transportation Commission, and Metropolitan Transportation Commission. The TAC met bi-monthly throughout the planning process, providing technical review of materials, ensuring accurate and up-to-date information, and allowing representatives from jurisdictions and agencies to coordinate and discuss improvements. Much of the work presented in this report is a culmination of input received from this committee. Emeryville Berkeley Oakland Transit Study 1 Project Goals and Objectives The Technical Advisory Committee has identified the following goals and objectives for the EBOTS corridor: Creating an environment where a car is not required for mobility; Using transit to create a well-connected and cohesive corridor with good access to jobs, education and recreation; Coordinating transit improvements with future population and job growth to help spur economic development; Making near-term transportation improvements including bus route modifications, new shuttle operations, and transit reliability and frequency increases; and Enhancing long-term mobility within the corridor, possibly including new transit service such as streetcar or bus rapid transit. Emeryville Berkeley Oakland Transit Study 2 2. Planning Process Process of Developing Options Initial routes and concepts for transit improvement within the EBOTS study area used a “blank slate” approach, with receptivity to ideas received from the community, as well as existing plans, future land use plans and economic development goals. A wide range of transportation technology options and improvements were screened based on distance, usage and future ridership. Options were evaluated and presented through community meetings, the technical advisory committee, and review by additional local professionals. Several iterations took place before the options and evaluations presented in this document were completed. The first stage in devising new transit services for the area was to identify those streets with active land uses that would generate transit trips as well as those with potential for future job and population growth. These land uses include multifamily residential buildings, business offices, medical complexes and retail commercial facilities. The streets serving these land uses should be suitable in terms of width and traffic characteristics to be able to accommodate transit vehicles. This first round of service development concentrated on bus and small shuttle vehicles, while also considering the possible implementation of streetcars. Where possible, a series of streets was sought that would form a continuous corridor of travel. Such straight corridors are easier for patrons to understand and allow for more efficient transit operation by reducing the number of turns required. Several north-south streets were examined as candidates for service. San Pablo Avenue is among the area’s busiest thoroughfares, but it lies at the east margin of the study area and has already been the subject of transit service proposals in AC Transit’s Comprehensive Operations Analysis (COA). Other streets allowing for north-south continuity in the three cities are: Adeline Street (southern portion), Mandela Parkway, and Peralta Street in Oakland; Hollis Street, Shellmound Street, and West Frontage Road in Emeryville; and 6th and 7th Streets in Berkeley. East-west streets in the study area (and areas further east) include: 2nd/3rd Street couplet, 7th/8th Street couplet, West Grand Avenue and MacArthur Boulevard in Oakland; 40th Street, Powell Street/Stanford Avenue, 65th Street in Emeryville and parts of Oakland; and Ashby Avenue, Dwight Way and University Avenue in Berkeley. Connections further north of the study area’s border with the City of Albany were examined as well but discontinuities in the street system made transit routings too circuitous. Moreover, possible termini north of this border, such as the BART stations at El Cerrito Plaza or El Cerrito Del Norte, stretch what can be served by the local transit concepts under consideration in this study. These northern points might, Emeryville Berkeley Oakland Transit Study 3 however, be tied to Transbay routes serving the study area. Street connections further west and south of the study area are not possible because the existing street network ends at the freeways and San Francisco Bay shoreline. Possible terminals and destinations to be served were examined both inside and outside the study area. It is generally desirable to terminate a transit line at a point where significant trips will be generated. Given the emphasis of EBOTS routes as transit collectors and distributors, as well as short-distance connectors, a terminal or way station at a transfer point with other modes or transit lines is especially important. The key transfer points in or close to this study area include: Amtrak/Capital Corridor stations at Oakland Jack London Square, Emeryville, and Berkeley; BART station at West Oakland, with possible connections to stations outside the study area at 19th Street, MacArthur, Ashby, Downtown Berkeley, and North Berkeley; AC Transit Uptown Transit Center at 20th & Broadway; and Ferry terminal at Jack London Square (with a possible future terminal in Berkeley). In addition to these transfer points, transit should serve important destinations in the area. They include numerous employment centers, like Pixar and Bayer, and retail centers such as the Bay Street, Powell Street and East Bay Bridge shopping centers. Major medical facilities are located mostly outside the study area and need to be tied to it, a function now handled largely through independent shuttles from BART stations; these include the Kaiser, Alta Bates Summit, and Children’s Hospital complexes in Oakland. In order to formulate transit service concepts for the EBOTS study area, the study included numerous sources of information. These sources include existing and projected patterns of development, travel desires revealed by those who responded to the study’s Community Questionnaires, planning documents from the three jurisdictions, and comments expressed at the three first-round public meetings and three second-round public meetings. Analysis of these data was followed by reconnaissance of the study area through maps, aerial photos, and windshield surveys to better understand its existing street infrastructure and surrounding built environment. Emeryville Berkeley Oakland Transit Study 4 Concepts Studied Several alternative routes were evaluated for costs, ridership, and demand and reviewed by the TAC and community outreach. These alternatives helped form the basis of developing the transit routes proposed in this report. A wide range of technology options were initially considered based on community input and compatibility with the study area. These transit technologies were initially screened to narrow the consideration to the best technologies given community input, right-of-way and environmental constraints, and political realities in terms of project funding. Figure 1: Initial Evaluation Connectors Option A “Connectors” option, shown in Figure 1, was considered and was well-regarded by the community and TAC members. However, these routes were ultimately screened out due to overlapping routes with existing and already planned transit routes. For example, within Emeryville, the Emery Go-Round served many any of the roadways in the proposed Connector option. Additionally, planned AC Transit routes would be duplicated with nearly all the connector routes within the Study Area. This circumstance would reduce route efficiency and cause too much shift in ridership away from the planned AC Transit routes. Furthermore, the planned AC Transit routes provide more extended coverage into other parts of Berkeley and Oakland. Community Engagement Round 1 Outreach and Community Feedback Overview Between August 2013 and November 2013, the EBOTS project team conducted a variety of outreach activities to inform stakeholders and the public about the project, and to solicit input on future visions for transit in the study area. This outreach effort was part of Phase 1 of EBOTS, which sought to identify both opportunities and constraints associated with improving transit service in the study corridor, in order to assist the partner cities and agencies involved in the TAC with engaging a broad spectrum of stakeholders in the transit study. Specifically, the objectives of the public process were to inform and collect input from the public on transit services and improvements within the study area. The outreach activities included three community workshops held across the study area (one in each city) and a bilingual (English and Spanish) questionnaire used to collect information regarding how individuals travel within the study area (i.e., travel method) and to gather feedback on potential transit improvements. MIG, the public engagement consultant, conducted a robust bilingual outreach effort to publicize the community workshops and survey questionnaire, including targeted postcard and flyer Emeryville Berkeley Oakland Transit Study 5 distribution, e-blasts, news media articles, and phone calls to key Emeryville-Berkeley-Oakland partners such as community-based organizations, local churches and established civic groups. Key Findings Round 1 of the community meetings identified location-specific access needs, identified many locations that are currently difficult to access and improved service in terms of schedule, reliability, hours of service, and frequency. Participants expressed a desire for shuttle/paratransit service in identifying need for last-mile connections and Emery Go-Round service in West Oakland. Participants also expressed interest in bus transit improvements. Some key opportunities for bus transit service identified include: 1. Connect to key locations in West Oakland, Emeryville, and West Berkeley, including: Jack London Square Berkeley Marina Oakland Army Base Berkeley Bowl West Waterfront areas Fourth Street in Berkeley West Oakland BART Frontage Road Mandela Parkway Emeryville shopping 2. Improve service, including: More off-peak service Schedule reliability Schedule predictability Better coordination between transit agencies Better connections to West Oakland BART Local circulation Vehicle improvements Increased safety measures 3. Improve amenities, including: Real-time arrival information Lighting at bus stops Detailed description of the workshop format, questionnaire and key findings from Round 1 of the Community Engagement and Outreach can be found in the Appendix B. Round 2 Outreach and Community Feedback Overview Between March 2014 and May 2014, the EBOTS project team conducted the second phase of outreach efforts to evaluate ideas for improving transit in the study area. Based on public input collected during Phase 1 outreach, the project team developed potential options for better transit in these communities. The outreach activities included three community workshops held across the study area (one in each city) and a questionnaire used to collect information regarding preferences and priorities for travel within the study area. As in Phase 1, the public engagement process included a range of outreach channels, including communication in local media outlets, the City of Emeryville website, e-blasts, social media communications, bilingual postcards and flyers, information distributed through local officials, regular newsletters, and phone calls to key Emeryville-Berkeley-Oakland partners such as community-based organizations, local churches and established civic groups. Emeryville Berkeley Oakland Transit Study 6 Key Findings The outreach meetings discussed travel patterns of participants, including destinations of interest. The meetings also focused on reasons for trip difficulty in the study area and discussed specific locations that have inadequate access by transit. Participants expressed desires for similar interest categories as in the first round of community engagement, with particular focus on the following: 1. Connect to key locations Jack London Square West Oakland BART Grocery stores 4th Street Emeryville shopping Improve service Schedule reliability More off-peak service Schedule frequency Faster service 3. Improve amenities Improved real-time arrival information Level boarding Dual side doors disabled accessibility Berkeley Marina Berkeley Bowl West Fourth Street in Berkeley Frontage Road Reduce or eliminate need for transfers Expanded overall service Earlier weekday morning service Safe, pedestrian-friendly stops Well-lit shelters with benches Additional bicycle racks on buses Clearer bus route information 2. Detailed description of the workshop format, questionnaire and key findings from Round 2 of the Community Engagement and Outreach can be found in the Appendix C. Emeryville Berkeley Oakland Transit Study 7 3. Transit Context This section explains the background and context of current transit systems within the EBOTS study area as well as planned improvements for these systems. Further information regarding the existing transportation conditions in the study area can be found in Appendix D. Existing conditions as well as current efforts for updating transit systems in a short-term timeframe are included in this section. Transit Markets The transit markets served within the study area include “transbay” commuters traveling to and from San Francisco, local travelers traveling between destinations within the study area and nearby destinations outside the study area, and intra-corridor travelers traveling within the study area. While BART is used for transbay and local travel, no intra-corridor travel occurs on BART since there is only one BART station (West Oakland station) within the study area. Table 1 lists the existing transit markets served by each major transit mode. Table 1: Existing Transit Markets and Service Traveler type Transbay Traveling to- and from- San Francisco to study area Local Traveling to- or from- the study area Intra-corridor Traveling within study area BART Capitol Corridor San Francisco Bay Ferry AC Transit Transbay Routes AC Transit Local Routes Emeryville & Berkeley Shuttles Existing Context Within the study area, the existing transit context is dominated by shuttles, Alameda-Contra Costa Transit District (AC Transit) bus system, as well as the Bay Area Rapid Transit (BART) light rail system. Figure 2 shows the existing shuttle, AC Transit, and BART system routes. Shuttles Emery Go-Round Emery Go-Round is a free shuttle system funded by the City of Emeryville’s Business Improvement District, and operated by the Emeryville Transportation Management Association (ETMA). The shuttle system has three routes that provide service seven days per week (weekend service is limited). Emery Go-Round serves as a transit connection to MacArthur BART station, the Emeryville Amtrak station, and the West Berkeley shuttle system. These routes also serve the large shopping centers in addition to many schools, grocery stores, and other businesses. Emeryville Berkeley Oakland Transit Study 8 Annual ridership for the Emery Go-Round exceeds 1.5 million trips.1 Approximate number of boardings and alightings for each route are listed below: Hollis shuttle line (weekday only): 527,000 trips per year Shellmound/Powell line (weekend and weekday): 867,000 trips per year Watergate Express (weekday peak-period only): 153,000 trips per year West Berkeley Shuttle The West Berkeley Shuttle provides weekday commuter service from Ashby BART station to the area West of Ashby BART station—extending nearly to Berkeley’s Aquatic Park on the San Francisco Bay. During the morning commute period, the shuttle runs from 5:40AM-9:11AM; during the evening commute period, the shuttle runs from 3PM-6:17PM. Each of the two lines, serving similar routes, travel east-west on Ashby Avenue and Dwight Way and north-south on San Pablo Avenue and 7th St. The shuttle service is operated by the Emeryville Transportation Management Association under contract to the West Berkeley Transportation Management Association. As of December 2007, the West Berkeley Shuttle had an average of 100 boardings per weekday in the study area alone (Existing Conditions Report, Wilbur Smith Associates). Other Shuttle Services Downtown Oakland’s Free Broadway Shuttle (not in study area), or the “Free B”, connects 12th Street and 19th Street Oakland BART stations, the Oakland-Jack London Square Ferry Terminal, and the Jack London Square Amtrak station. The Free B offers weekday service from 7AM-7PM and weekend night service from 7PM-1AM on Fridays and 6PM-1AM on Saturdays. Alameda-Contra Costa Transit District (AC Transit) The Alameda-Contra Costa Transit District (AC Transit) provides bus service to in the East Bay within Alameda and Contra Costa counties as well as to San Francisco’s Transbay Terminal. In addition to providing local bus-line connections, many AC Transit routes connect to alternative transit modes, including BART, the Capital Corridor, the Alameda-Oakland Ferry, and the Emery Go-Round. Several Transbay lines have stops within the project area. Transbay lines are typically represented by letters instead of numbers. Bus lines 800-899 are all-nighter lines, operating from 1AM-5AM. Altogether, 25 routes run through the project area,2 with 10 of those connecting to the Transbay Terminal in San Francisco. The Routes in the project area include: Transbay Routes: F, FS, G, C, H, Z, J, NL, 800 East Bay Only Routes: 25, 26, 31, 314, 62, 88, 49, 51B, 802, 72, 72M, 72R, 57, 62, 52 Ridership data calculated with trip data from March 2013 – June 2013. Data provided by the Emeryville Transportation Management Association, personal communication July 19, 2013. 2 Several routes have limited stops within the study area. The G and FS only have a total of 3 stops in the study area and are not included. 1 Emeryville Berkeley Oakland Transit Study 9 Bay Area Rapid Transit (BART) While only one station, the West Oakland BART station, exists within the EBOTS study area, the BART system has a large impact on transbay and local travel to the study area. Transit patterns within the EBOTS study area are mostly affected by transfers from West Oakland, Downtown Oakland, MacArthur, Ashby, and Berkeley BART stations. Outreach meetings and questionnaires showed that there is strong demand for improved connections and service from these stations. Particular attention in this study is given to the West Oakland station (due to the low quality of current connections and its location within the study area) and MacArthur BART station (due to its high demand as the busiest East Bay station outside Downtown Oakland). Planned Improvements Shuttles The following are planned updates to the Emery Go-Round, West Berkeley, and “Free B” shuttles, as well as the proposed Emeryville Bus Hub. The improvements to the “Free B” shuttle are described in the subsequent section discussing the Broadway Streetcar Project. Emery Go-Round Shuttle The Emery Go-Round Shuttle planned route updates including the Hollis (HS), Watergate Express (WE), and the Shellmound (SP).3 Overall, the addition of one route will expand the Emery Go-Round service approximately 25%, specifically focusing on increasing service to some of the most crowded portions of the system. Route changes to each line include: Hollis Shuttle line: Minor changes to this route are planned, such removing one stop on Stanford Avenue at Horton Street westbound. Shellmound line (previously the Shellmound/Powell Route): The Shellmound Route will travel unchanged from MacArthur BART station, but will be truncated to turn around at Shellmound Way rather than continuing to 65th Street. Service the Emeryville peninsula will only be during off-peak periods. Frequency would increase due to route shortening. Powell Bridge line: The new Powell Bridge Route will travel from MacArthur BART on Hollis Street to Powell Street and 65th Street, an area previously served by the Shellmound/Powell Route. Watergate Express line: There will be no changes made to the Watergate Express Shuttle. The Emeryville Bus Hub The Emeryville Bus Hub is a proposed new bus transit hub near the public Market and adjacent to the pedestrian bridge to connect to the Amtrak Station. Many of the potential AC Transit and Emery GoRound routes connect to this location. Alameda-Contra Costa Transit District (AC Transit) AC Transit has planned route updates based on the ongoing Inner East Bay Comprehensive Operations Analysis (COA). The COA recommendations increase focus and added service to the Emeryville, West Berkeley, and West Oakland areas. In Emeryville and West Oakland, every AC Transit route has 3 Fehr and Peers Recommendations, February 7, 2014. Emeryville Berkeley Oakland Transit Study 10 proposed changes to provide better east-west connections to Downtown Oakland, Downtown Berkeley and nearby BART stations. Figure 3 shows an image of the short-term improvements. These improvements address the concerns identified by the community during the outreach process in regard to improving bus service in the study area. The following key themes identified during the community workshops and through the questionnaire are met by the aforementioned improvements: Improved East-West connections; Improved connections to Emeryville from West Oakland, Berkeley via Ashby, Berkeley via Alcatraz, Downtown Berkeley and UC Berkeley; and Improved frequency of service. Based on input received during community workshops, from community input and from discussions during TAC meetings some modifications to the COA routes have been identified. These are noted in the new and updated routes below as well as in Section 4 Proposed Transit Improvements. New and Updated routes AC Transit is proposing the following service changes. All routes would have a peak frequency of 15 minutes, except 10 minutes for the 72R. The potential changes are: Line 12: This line would be revised and no longer extend into downtown Oakland and Piedmont. It would instead connect from West Oakland to Downtown Berkeley directly. Route 13: New AC Transit Route would connect the Emeryville Public Market with Berkeley, Rockridge, Piedmont, Lake Merritt, and Downtown Oakland. It would have stops in areas that Line 12 currently covers. Line 14: This line would be extended into West Oakland with a loop on 14th, Wood, and 7th. This revised line would cover areas currently served by Line 26 and provide access from West Oakland into Downtown Oakland, Lake Merritt, Fruitvale and other East Oakland neighborhoods. Line 26: This line would be streamlined to no longer loop around West Oakland and instead provide direct access into Emeryville via Mandela Parkway, terminating at Emeryville Public Market and a pedestrian bridge to Amtrak. Line 48: Line 48 would connect northwest Berkeley to Ashby BART, Elmwood and Claremont in Berkeley via 6th, 7th and Ashby. Proposed change from AC Transit COA recommendation: have line 48 travel north on 6th to extend into West Berkeley to Gilman and not connect to the Emeryville Public Market. Line 49: Line 49 would be altered to connect the Emeryville Public Market to portions of West Berkeley, Downtown Berkeley and UC Berkeley via Dwight. At Shattuck, the line would travel north, then loop on Durant, Telegraph and Bancroft to connect to the UC Berkeley Campus. Emeryville Berkeley Oakland Transit Study 11 Proposed change from AC Transit COA recommendation: Go north on Shattuck and connect to UC Berkeley Campus on Bancroft and Durant. Line 57: This line would be extended into Emeryville and terminate at the Emeryville Public Market. This revised route would provide new East-West access from Emeryville into Oakland. Line 72/72R/72M: These lines would be consolidated and revised to streamline service. Line 72 would be eliminated. The number of stops would be increased on 72R. Retained Routes Line 51B: This line has not been altered. Improvements will be identified in the upcoming Line 51 Transit Study. Line NL/F/H/Z: These lines would remain the same. Eliminated Routes Line 31: Line 31 currently goes from MacArthur BART to Hollis to West Oakland BART to Alameda, similar to the proposed West Oakland Streetcar Route. This line would no longer serve the study area. Other lines would serve parts of this route. The Broadway Circulator Study Planning efforts to replace the “Free B” Oakland shuttle with an enhanced bus or streetcar system are underway. The planning effort is studying alternatives for different streetcar routes, including from Jack London Square to 27th Street (“Pill Hill”) and possibly to MacArthur BART. This route provides connections between two major Downtown Oakland BART stations (12th Street Oakland City Center and 19th Street Oakland) via Broadway. The objectives of this route are to enhance the current transit service, enhance the “Free B” shuttle line service quality and area, and support economic and community development along Broadway and within the MacArthur BART neighborhood. Connections within this service include4: Jack London Square Downtown/Uptown Oakland 27th Street (“Pill Hill”) Upper Broadway and 51st Street Oakland Chinatown MacArthur BART neighborhood (possibly a later phase) Fehr and Peers (2013). Broadway Transit Urban Circulator Study, Draft Initial Evaluation of Alternatives, City of Oakland. 4 Emeryville Berkeley Oakland Transit Study 12 Figure 2: Current AC Transit and Shuttle Routes .... <l .-<:: -·-· -·EBOTS Study Area (===:J ~A n H ~ --':':'_'~N!_t< • ,; ' ") ,,." "' t; -- 52 ~ !a!IBirtel!y Oty Boundary Amtrak(Capitol Corridor) Ferry Lines ,.a Sl "' ' !§!] BERKELEY IIWII!Iil:l!) • Exilling AC Transit Routes 25, 26, 31,88,49, 518, 72, 72M, 12R, 57, 62, 52, F, C. H, Z. J, FS, NL, 800, 802 •oo~ indude1 roote1 with stop 'Nithin study area - - Shuttles Emery-Go-Round Shuttles West Berkeley Shuttle Oakland "Free 8" BART ,, EBOTS Emeryville Berkeley Oakland Transit Study 13 Figure 3: Shuttle Routes and Potential AC Transit Routes ---- ---- .. a• " _...,.. .. -"" c==J EBOTS Study Area CityBoundary Rail Ferry Lines C::c:::"e:ll::J::::idUAilH • - - Shuttles .. Emery-Go-Round Shuttles West Berkeley ShutUe - NewAC TransitRoutes Une 13, 48 Updated AC Transit Routes Line 12, 14, 26, 49, 57, 72.72R,72M UnchangedACT ran sit Routes line 518,88, NL. F, FS, G, H, Z. 802 -· - - Removed AC Transit Routes Une31 EBOTS Emeryville Berkeley Oakland Transit Study 14 4. Proposed Transit Improvements The following proposed transit improvements have been assembled based on input received from the community meetings and from review and coordination with the TAC as well as the city councils in the three cities. The improvements include the Trunkline Connector route and the Streetcar routes. Short-Term Improvements (1 - 5 years) Short-term improvements are focused on interim improvements that will help set the stage for the proposed Trunkline Connector and Streetcar routes described below as well as other near term improvements related to transit access. Modifications to Planned AC Transit Route Improvements Planned AC Transit improvements were presented and discussed at community meetings and studied as part of the EBOTS planning process for improving transit in the study area. While planned improvements based on AC Transit’s Inner East Bay Comprehensive Operations Analysis (COA) are presented in Section 3 Transit Context, the below are recommendations are modifications those routes based on community input received during the workshops and through discussions with TAC members. Line 48: Line 48 would connect northwest Berkeley to Ashby BART, Elmwood and Claremont in Berkeley via 6th, 7th and Ashby. Proposed change from AC Transit COA recommendation would be to have line 48 travel north on 6th to extend into West Berkeley to Gilman and not connect to the Emeryville Public Market. Line 49: Line 49 would be altered to connect the Emeryville Public Market to portions of West Berkeley, Downtown Berkeley and UC Berkeley via Dwight. At Shattuck, the line would travel north, then loop on Durant, Telegraph and Bancroft to connect to the UC Berkeley Campus. Proposed change from AC Transit COA recommendation is to go north on Shattuck and connect to UC Berkeley Campus on Bancroft and Durant. Line F: No changes were described for Line F in the COA, however, a modification to this route would be to have it stop at the future bus hub on Shellmound Street, near Shellmound Way. Line F currently stops within a few hundred feet of where the new bus hub will be located and this will be an important connection to other transit routes. Connection to the Berkeley Amtrak Station Connection to the Amtrak Station in West Berkeley is currently provided by AC Transit Line 51B as well as one morning and one afternoon connection served by the West Berkeley Shuttle, an indicator of the limited north-south connections to the Berkeley Amtrak Station. One possible solution is increasing the number of trips served by the West Berkeley Shuttle. Another possible improved connection to the Berkeley Amtrak Station is the new AC Transit Line 48 which will connect to the Ashby BART Station and pass near the Amtrak Station at 6th and University. A possible modification of this route would be a short diversion to provide improved service to the Amtrak Station using Addison Street, 4th Street, and Hearst Avenue. The drawback of this diversion is Emeryville Berkeley Oakland Transit Study 15 retaining the continuity and consistency of a more direct route. Regardless, even without the diversion Line 48 would provide a north-south connection within a ¼ mile of the Amtrak Station. Connection to West Oakland Businesses While the new AC Transit routes provide improved connections throughout West Oakland, there may be an opportunity to provide shuttle service from West Oakland BART that more closely serves businesses near West Grand Avenue and at the former Army Base. Additionally, an early version of Gateway Park proposal included the idea of potential shuttle routes connecting area residents to the new park at the base of the Bay Bridge. Further study should consider a shuttle service to provide access to businesses and open space in West Oakland. Improved Bus Stops in Emeryville Two locations in Emeryville have capacity and need for improved bus stop infrastructure and amenities. One is that the City of Emeryville is currently seeking funding for a widening of on- and off-ramps at the I-80 interchange and Powell Avenue. As part of this improvement there would be room for an additional bus stop for AC Transit Transbay service on Powell Street West of the overpass. San Pablo Avenue and 40th Street offers another location where there is an opportunity for significant improvements to bus stops. Several buses currently stop at this intersection, including the Emery Goround Shellmound-Powell line and AC Transit lines 26, 31, 57, 72, 72M, 72R, 802, C and F. This location could accommodate improved bus stops including shelters, real-time arrival displays and improved informational and wayfinding signage. Transit Passes The desire for incorporating AC Transit Easy Pass purchases into new residential and commercial developments was stated several times at community meetings as a possible way to encourage increased transit use. The Easy Pass program costs a fraction of cost per user—between $4 and $10 per month for unlimited rides depending on the group size purchasing passes. Cities can work with new and existing developments to encourage use of the Easy Pass program. There are additional opportunities to provide incentives for participation, such as reduced parking requirements or density bonuses. Study Demand-Responsive Transit New technologies in ridesharing, on-demand cab service, and interactive demand-responsive transit vehicles may become a more viable means of bridging the gap between major transit hubs and local destinations. Historically, demand-responsive transit systems, such as dial-a-ride, have been utilized only in low-density locations. However, some for-profit demand-responsive transit services are beginning to locate in high-density areas. For example a startup called Bridj connects Boston’s inner suburbs to downtown and riders can schedule a pick-up at designated locations. While this is not door-to-door service it does provide a level of flexibility for users not seen by typical bus service. Regarding costs, however, Bridj charges about $6 for a 4.5 mile ride, which is more than three times the cost of regular transit in the area.5 Vehicle capacity and cost per passenger remain the largest barriers to incorporating demand-responsive transit services. Ridership of highly utilized demand-responsive transit top out at approximately 10 riders 5 Seelye, K. Q. (June 4, 2014). To Lure Bostonians, New ‘Pop-Up’ Bus Service Learns Riders’ Rhythms. New York Times. Emeryville Berkeley Oakland Transit Study 16 per vehicle-hour.6 Furthermore, because operational costs and salary of drivers for transit vehicles is a significant factor, limited vehicle capacity relates to higher operational costs to meet the needs of highdensity areas. This indicates that demand-responsive transit may be a feasible solution for late night coverage when transit is less available and demand is reduced, but would be costly for regular service and would add VMT to the network. A feasibility study looking at how demand-responsive transit may supplement public transit and utilize new technology could be considered for cities and/or transit providers within the EBOTS study area. EBOTS Trunkline Connector Route (5 – 10 Years) The Trunkline Connector Service Concept is proposed to connect West Oakland, Emeryville, and West Berkeley in the 5 – 10 year timeframe. This concept was developed in response to input that many locations are currently difficult to access using transit in the study area, including Gilman Street in Berkeley, West Oakland BART station, Berkeley Bowl West and other grocery stores, the Fourth Street commercial area in Berkeley, Jack London Square, and waterfront areas. The line is 8.1 miles in length and would take approximately 41 minutes to traverse in one direction of travel (including service stops), assuming an average speed of 12 mph.7 Figure 4 shows the proposed Trunkline Connector Route. The following identifies the key characteristics of this service: Potts, J. F., M. A. Marshall, E. C. Crockett, J. Washington (2010). TCRP Report 140: A Guide for Planning and Operating Flexible Public Transportation Services. Washington DC: Transportation Research Board, National Research council. 6 AC Transit’s average bus speed is 11mph (http://www.actransit.org/customer/transit-glossary/). TCRP Synthesis 110 – Common Approaches for Improving Transit Bus Speeds states average speeds of transit systems ranging from 8.1 to 16.3, with an average of 13.5 (lower for larger systems). However, many improvements in the proposed system have increased speeds in urban bus systems significantly (TCRP Synthesis 110). 7 Emeryville Berkeley Oakland Transit Study 17 1. Connect to key locations in West Oakland, Emeryville and West Berkeley The Trunkline Connector is designed as a north-south route linking all three cities. It connects residential areas in West Oakland with activity centers like Jack London Square, the West Oakland BART station, the East Bay Bridge shopping center, the retail commercial opportunities along Shellmound Street, and West Berkeley. The line would provide bi-directional service between Jack London Square and Gilman and San Pablo Avenue via 3rd, Mandela, 40th, Hollis, 7th, 6th, and Gilman. o It is important to note that an alternate northern terminus to Downtown Berkeley was also discussed instead of going to Gilman Street. However, this alternate route is not shown because it would overlap with AC Transit Route 51B and the connection between Downtown Berkeley and Emeryville will be served by AC Transit’s planned Route 49. Regardless, as the trunkline connector is studied in the future, this alternate northern terminus may also be considered. The Connector provides better connections to the West Oakland BART station and other major destinations. The route would connect several transportation hubs—the Jack London Square Ferry terminal, the West Oakland BART station, the Emeryville Amtrak, and the Berkeley Amtrak. 2. Improve service Figure 4: Trunkline Connector Route The service would provide frequent service within peak hours as well offpeak daytime hours, evening and weekends. Service would operate every day, from 6:00 am to 10:00 pm Monday through Friday and from 7:00 am to 11:00 pm Saturday and Sunday. Service would be offered at 10 minute intervals daily, with the exception of less frequent (15 minutes interval) service in the early or late hours of each day. Stop spacing would be approximately every 0.2 miles, increasing speeds relative to many comparative routes in the area with more frequent stop spacing. 3. Improve amenities The service would be operated using a branded hybrid or battery bus and includes (1) marketing, (2) speed enhancing features such as curb Emeryville Berkeley Oakland Transit Study 18 extensions, low floors with aisles for faster boarding, and signal priority, and (3) updated bus stops with shelters, lighting, cameras, real-time arrival information, benches, trash bins and bike racks. These improvements respond directly to the input received from the community workshops by focusing on connectivity to key locations in West Oakland, Emeryville and West Berkeley, increasing the quality of service such as frequency and speeds, and transit amenities such as real-time information, vehicle improvements, and faster boarding. EBOTS Streetcar Routes (10 – 20 Years) The timeline of the proposed Streetcar routes is 10 – 20 years. The routes consist of two lines—the West Oakland and Emeryville lines—designed with the Broadway Circulator in mind, expanding this service to connect to West Oakland and Emeryville. There is the need to better tie in MacArthur BART and Jack London Square to West Oakland and Emeryville commercial areas. Two separate lines were developed, but each would serve a mutually exclusive section of the study area (with the exception of some duplication on 40th Street, which allows for increased service in that high demand area). The West Oakland line is 4.3 miles in length and would take approximately 22 minutes to traverse in one direction of travel (including service stops), assuming an average speed of 12 mph.8 The Emeryville line is 5.3 miles in length and would take approximately 27 minutes to traverse in one direction of travel (including service stops), assuming an average speed of 12 mph. The following identifies the key characteristics of the two Streetcar routes: Connect to key locations in West Oakland and Emeryville The Streetcar route connects the Jack London Square area, West Oakland, Amtrak, and MacArthur BART with the East Bay Bridge shopping areas and the medical complexes in the Mid-Broadway area in Oakland. From its southern terminal at the Oakland Jack London Square Amtrak Station, the system would operate on the 2nd/3rd couplet and 3rd Street to the West Oakland BART Station, where it would circulate around the station, continuing north on Mandela, then Hollis, 40th to the MacArthur BART Station. The route would connect West Oakland along Mandela with major transit terminals. The Emeryville Streetcar Route is designed to connect MacArthur BART Station with the employment and shopping areas along Hollis and West Berkeley via 40th, Hollis, Powell, Shellmound and Christie. Improve service The service would provide frequent service within peak hours as well off-peak daytime hours, evening and weekends. Service would operate every day from 6:00 or 7:00 am (depending on day of week) to 10:00 or 11:00 pm. Streetcar systems typically have similar speeds as buses, varying widely depending on operator, line, and location. Average speeds for the Portland Streetcar are approximately 15mph (http://www.nycsubway.org/wiki/Portland_Streetcar). However, because sources vary and system speeds are more dependent on location, average speeds were based on AC Transit bus service average speeds with slight speed increases due to service improvements. 8 Emeryville Berkeley Oakland Transit Study 19 The new line would coordinate with other transit services. Much of the Emeryville line is currently operated as part of the Emery Go-Round Shellmound-Powell shuttle bus route. Adjustments to that service in coordination with the introduction of the proposed route will be important in order to provide complementary and efficient transit service. Improve amenities The service is designed to have bulb-outs and level boarding to improve service efficiency and increase travel speed. Stop amenities for the Streetcar concept include well-lit shelters with real-time arrival information. Marketing and clear route information will help make the streetcar a visible and accessible transit option. Improve economic vitality and community development Due to the visibility of the streetcar mode, routes and service are generally more legible and understood relative to other transit modes. The service investment and visibility has shown to increase economic development and support walkable, transit-oriented development in cities that have recently implemented modern streetcar systems. Figure 5 shows a simplified image focusing on the streetcar routes without distinguishing other transit lines. Figure 6 shows detail of the streetcar routes including the enhanced AC Transit bus routes, Trunkline connector, and the Streetcar routes that are proposed for the 10 – 20 year timeframe. Emeryville Berkeley Oakland Transit Study 20 Figure 5: Proposed Streetcar Routes ------~ r==::1 EBOTS Study Area City Boundary - Rail Ferry Lines Ui (I.SMUS MIRTH Proposed TrunklineConnector Line (1 Proposed Streetcars • • • LineSl Line 52 ••• Potential Streetcar • • • LineS1-B* "Broadway Crrculator- not 1n EBOTS study _ - - Existing Shuttles Emery-Go-Round Shuttles ,--- West Berkeley Shuttle Existing AC Transit Routes Line 518, 88, NL, F, H, Z _ New AC Transit Routes Line 13,48 If _ Updated ACTransit Routes '/--._ -f::. Line 12, 14, 26, 49, 57, 71,71R,71M _ _ Removed ACT ran sit Routes Line 31 EBOTS Emeryville Berkeley Oakland Transit Study 21 Figure 6: Proposed Trunkline Connector and Streetcar Routes .. c=::=J EBOTSStudy Area CityBoundary Rail Ferry Unes - 0_15 B~IUS Proposed Trunkline Connector lineCl • Proposed Streetcars • • • • • • lineSl LineS2 PotentialStreetcar • • • Line51-B* *Eroadway Circulator - not in EBOTS 1tudy - - Existing Shuttles Emery-Go-Round Shuttles West Berkeley Shuttle Exilting ACT ransit Routes -- line SlB, 88, NL, F, H, Z, 802, 800 ..:: New AC Transit Routes line 13, 48 - Updated ACTransit Routes Line 12, 14, 26, 49, 57, 72.72R,72M - - Removed AClransit Routes Line31 O!KJ.AND DUUR HAR8J' EBOTS Emeryville Berkeley Oakland Transit Study 22 5. Evaluation of Improvements This section provides an evaluation of the Trunkline Connector Route and Streetcar Routes. Many evaluations are completed at a “sketch” level consistent with the evaluation stage of the proposed routes. The evaluation of transit options included the following evaluation factors: Ridership Vehicle Miles Traveled (VMT) Analysis Effects on Environmental Justice Communities Safety and Security Costs Compatibility with Existing Transit Economic Development Impact Ridership Ridership forecasts were based on comparative system data, including AC Transit and urban transit systems as reported in the National Transit Database. Average per-stop ridership for comparative AC Transit route segments that run within ¼ mile of the proposed route were used to approximate location-specific transit demand.9 The average number of riders per stop per day for comparative routes ranged from about 31-39 riders. An elasticity factor was applied to the average per-stop ridership to account for increases in service frequency and mode changes in the improved routes. This enhanced perstop ridership average was then used to calculate the route ridership by multiplying the average per-stop ridership by the approximate number of total stops per proposed route. Numbers are rounded to the nearest 100. Table 2 lists the total riders and new ridership projections for the proposed routes. Enhanced bus service: Enhanced service applies an elasticity that accounts for frequency of service increases. While only included in the upper range, ridership would be expected to increase further for additional enhancements such as branding/marketing, low floor busses for faster boarding, and Intelligent Transportation System (ITS) applications such as real-time travel information and signal priority. Literature states that marketing alone can increase ridership up to 10%; the combination of marketing and passenger information can increase ridership as much as 20%.10 For the Trunkline Connector and Streetcar routes, the upper range estimates includes an elasticity factor to account for such variations. Streetcar ridership: An additional elasticity factor was applied to account for increased demand generated by streetcar systems relative to bus transit. Within three comparative systems Routes without overlap in transit demand, such as routes running perpendicular, overnight routes or transbay routes with less than 2 stops in the project area, were not included. 10 Federal Transit Administration. Bus Rapid Transit Practitioner’s Guide. TCRP Report 118; Currie, Graham and Wallis, Ian (2008). “Effective Ways to Grow Urban Bus markets – A Synthesis of Evidence.” 9 Emeryville Berkeley Oakland Transit Study 23 analyzed,11 it was found that streetcar systems typically have approximately 20%-80% more ridership compared to bus systems in the same area. An average estimated ridership increase of 46% was applied to the proposed streetcar routes. Population projection: The increase in ridership for all modes is assumed to increase proportionally to the projected population and job increase in the project area (based on ABAG Travel Analysis Zone projection). In reality, increases in population and job growth will also lead to increases in land use intensity, which will encourage more public transit use, making the lower-range estimated ridership increase by 2020 and 2035 conservative measures. For the Trunkline Connector and Streetcar Routes, the upper range ridership estimates includes an elasticity factor to account for variations in design as well as increased ridership. Transferred Ridership: The total ridership for comparative stops adjacent to proposed routes was distributed across the additional proposed stops (based on route stop-spacing) to estimate the number of “transferred riders,” or those who would transfer from one bus line to the new route line. New Ridership: New ridership includes only those riders generated from service improvements, while the remainder of the ridership includes those who transfer from other routes. This is calculated by taking the total ridership and subtracting the “transferred ridership” for each route. Table 2: Transit Improvements – Daily Ridership Forecast Daily Weekday Ridership Improvement Total Riders New Riders Trunkline Connector Route 2020 Forecast Trunkline Connector Route Jack London Square to North Berkeley 5,800 – 7,300 3,800 – 5,300 4,200 – 5,300 3,100 – 4,200 5,700 – 7,100 4,900 – 6,300 Streetcar Routes 2035 Forecast West Oakland Streetcar Route Jack London Square to MacArthur BART through West Oakland Emeryville Streetcar Route MacArthur BART to Emeryville’s Shellmound Street Seattle’s King County with 82% more, New Orleans with 19% more, and Memphis streetcar system with 37% more. Portland’s streetcar has 172% more ridership, but was deemed not comparable because of the much larger extent of the regional Tri-Met bus system. 11 Emeryville Berkeley Oakland Transit Study 24 Vehicle Miles Traveled (VMT) Analysis Vehicle Miles Traveled (VMT) is assumed to be directly related to increases in new ridership, and the vehicle miles per day traveled by each route. VMT was calculated from the new riders, or the ridership that is not generated from passengers who transferred to another bus or shuttle route. Baseline VMT was calculated based on new riders transferring from a previous mode, including drive alone, carpooling/other, and walk/bicycle modes. Newly added VMT was calculated by using the total vehiclemiles each route will cover. The difference between the baseline VMT for all new riders and the VMT for each route is the calculated VMT changes, which includes additional VMT from new riders switching from vehicle modes (VMT savings) and walk/bike modes (VMT additions) to transit. Ranges are based on the assumption that average trip length for riders is between 2.5 and 3 miles long. The percentage mode share was assumed to be consistent with journey-to-work data from the American Community Survey (2012), for U.S. Census tracks within the project area. Table 3 lists the estimated VMT that the proposed route will create as well as the reduction in VMT that is caused by new riders shifting from non-transit modes to transit modes. Table 3: Daily VMT Reduction by Route Daily Weekday VMT Alternative Total VMT for Route VMT Reduction Trunkline Connector, 2020 Forecast Trunkline Connector Route 2,700 miles Jack London Square to North Berkeley 4,700 – 6,200 miles Streetcar Routes, 2035 Forecast West Oakland West Oakland Streetcar Route Jack London Square to MacArthur BART through West Oakland 800 miles 5,300 – 6,500 miles 1,300 miles 8,300 – 10,200 miles Emeryville Streetcar Route MacArthur BART to Emeryville’s Shellmound Street Emeryville Berkeley Oakland Transit Study 25 Effects on Environmental Justice Communities This section provides an analysis of effects on minority and low-income community within the study area. While this impact overview does not obviate the need for further Title VI12 analyses prior to service improvements, nor does it replace the need for environmental clearance, it does provide an overview of potential effects on protected populations. The primary evaluation factor for this analysis includes transit access within a 1/4mile of transit routes within the study area. Each set of improvements was evaluated and compared with existing transit service to compare access to transit. Additional considerations include construction impacts, gentrification and reduced Sales leakage. Low-Income and Minority Communities For purposes of determining minority and low-income concentrations within the EBOTS study area, the following definitions were used: “Minority” populations include any non-white individuals or households (including Hispanic or Latino populations, regardless of race); “Low-income” populations include households making less than 200% of the federal poverty rate, which is currently at $23,550 for a family of four. This means that households with incomes under $47,100 for a family of four would be considered low-income. The EBOTS study area is racially diverse with 73% of the population is minority, with the highest concentrations located in West Oakland where some census tracts are greater than 80% minority. Other significant concentrations of minority populations occur in Emeryville, where census tracts are between 60% and 80% minority (excluding the area bounded by 53rd Street and 67th Street, and Shellmound and Vallejo which is approximately 40% to 60%) and in West Berkeley from Dwight Way to Camelia Street. However, concentrations of minority populations still range from 40% to 60% in the remaining tracts within the study area. In fact, no census tracts within the study area are less than 40% minority. Since there are no tracts where the ethnicity is below 40% in the study area, the function of this qualitative analysis will be to provide a highlight of where specific service alternatives may provide a higher or lower level of access for minority populations. Table 4, below, presents the percentages of minority and low income populations within the EBOTS study area. Figure 7 presents a map depicting the concentrations of Minority populations in the study area. A review of the low-income populations reveals a slightly different picture from the patterns of minority concentrations. Approximately 44% of households in the EBOTS study area would be classified as lowincome using the definition of households earning less than 200% of the federal poverty level. However, only one area, West Oakland, has significant populations of low income households. In the census block group bounded by Grand and 5th Street, and Adeline and Mandela Parkway, between 70% and 80% of the households fall within the definition of low-income. The second greatest concentration of lowincome households is immediately adjacent, bounded by Grant and 5th Street, and Adeline and Market Title VI of the Civil Rights Act of 1964 protects people from discrimination based on race, color or national origin, specifically in programs/activities that are federally funded. Source: www.fta.dot.gov 12 Emeryville Berkeley Oakland Transit Study 26 Street. This area has concentrations of 60% and 70% of low income. Figure 7 presents a map depicting the concentrations of Low-Income populations in the study area. Table 4 shows the overall minority and low-income population by percentage in the study area. Table 4: Minority and Low Income Populations in the EBOTS Study Area Scenario and Routes % Minority % Non-Minority % Low-Income % Non-Low-Income EBOTS Study Area 73.0% 27.0% 44.4% 55.6% Access to Transit Nearly all areas within the Study area are within a ¼-mile of transit, including areas within low-income and minority areas. Since widespread service is being provided by existing transit service (including shuttle services), little change will occur in the numbers of low-income and minority populations served by transit. However, the intensity and quality of service will be improved with the potential transit improvements. Table 5 shows the percent minority and the percent low income residing within ¼ mile of each route. Figure 7 and Figure 8 show the density of minority and low-income residents within the study area. Table 5: Minority and Low-Income within 1/4 mile of routes Scenario and Routes Existing Transit Routes within the Study Area (1/4-Mile Buffer) Planned Transit Routes within the Study Area , including AC Transit and Emery Go-round improvements described in Section 3 (1/4-Mile Buffer) EBOTS Transit Improvements Trunkline Connector Route Streetcar Routes % Minority % Low-Income 71.95% 43.11% 71.88% 43.01% 71.88% 43.01% *Notes: Includes routes with 30 minutes or less peak frequency. Does not include communities outside of the study area. Because Trunkline Connector and Streetcar route improvements include the AC Transit Updated Bus Routes (covering most of the study area), the percent minority and low-income populations within ¼ mile of routes does not change. The buffer analysis of the AC Transit updates and the proposed routes identified approximately 71.88% of the population within the ¼ mile buffer as minority, which is slightly lower than the overall minority percentage within the EBOTS study area and slightly lower compared with Existing service. However, improvements to service and reliability would offset this modest difference and improved transit service would benefit all users, especially in West Oakland where several key improvements are identified. Potential Construction impacts The construction impacts due to the potential transit improvements are minimal. Construction of streetcar routes would not likely result in any displacements of commercial or residential buildings and construction would not likely occur for longer than 18 months and would be phased in segments to Emeryville Berkeley Oakland Transit Study 27 minimize disruption to the community including limited road closures and detours. Construction of a streetcar may result in impacts related to noise, dust and detours during construction. These impacts could be mitigated with appropriate best management practices and outreach to the community. Benefits for Low-Income and Minority Communities Benefits to low-income and minority communities could include improved access appropriate educational and employment opportunities and attraction of retail and services that would reduce sales leakage out of the area. Emeryville Berkeley Oakland Transit Study 28 Figure 7: EBOTS Study Area Minority Populations ALBANY . ,.-.- .- . .- ..- BERKELEY S\ ~ --......---·...... _..__.. .. t' _ ....-· --- -- \ ... --· g ..... ...... ....... Sec"""-l ...,_ ............. ·-0-20% 20-40% 40-60% 60-aM. 80-100% EBOTS Study Area City Boundaly Amtrak (Gapitol Corridor) - BART (Bay Area Rapid Transit) Railroads Ferry Lines CliiW<l PcX laldcrl ~ ~ftrry ;r-1 -/ EBOTS ----~lrilo~ J.:!:i~---------".......__ _. Emeryville Berkeley Oakland Transit Study 29 Figure 8: EBOTS Study Area Low-Income Populations I ALBANY -~ I ------- -BERKELEY _.. ---- -· --· --- -c...:. .................. ...... -..... _.. _.. ........... ..... ..........,. ·- - cnr 0-15% 15-30\ 30-60% 60-70% 70-80% c::::J EBOTS Study Area City Boundary Amtrak (Capitol Corridor) BART (Bay Are<~ Rapid Transil) Railroads Ferry Unes 02$ EBOTS 05MUS Emeryville Berkeley Oakland Transit Study 30 Safety and Security Safety and security for transit riders, pedestrians, bicyclists, and other vehicles is a concern with the addition of a new transit line or system. At community meetings and in the surveys community members expressed feeling unsafe when waiting at bus stops and occasionally when riding the bus. Furthermore, participants raised several concerns for street crossings and pedestrian safety. Based on these concerns, safety and security issues addressed here include: Security concerns at transit stops and facilities. Safety concerns related to increased collisions and multimodal conflicts. Additional safety concerns related to streetcars and streetcar tracks. Further analysis of specific sites can help identify areas for mitigation by specific site design to prevent adverse safety impacts. A detailed safety plan could be developed to establish the standards and design, construction, and commissioning of a system’s safety elements. Bus Stops and Facilities There are several safety concerns for bus amenities; typically amenities increase the efficiency and safety of passengers. Facilities to enhance safety should have good visibility, lighting, grade separation, and clear demarcation of pedestrian and vehicle areas.13 However, the full extent of a safety analysis depends on several site-specific factors. Landscaping, signage, and other facilities can enhance safety by providing benefits such as lighting and visibility. However, amenities can sometimes cause visual or physical obstructions to vehicles. Site-specific analysis of future stops will need to be conducted in order to fully analyze the safety and security of amenities. For example, bulb outs can have both positive and negative safety effects. Bulb outs can improve safety by reducing the need for buses to re-enter traffic flow after stopping and improve access and increase space for boarding and alighting passengers. They can also potentially decrease pedestrian-vehicle conflicts by making pedestrians more visible to approaching traffic. Bulb outs can potentially have negative impacts on bike safety as they may be causing breaks in continuous bike lanes, which could lead to increased conflicts. 14 Bus stops will have lights and cameras for security. Intermodal Collisions Any increase in transit service increases chances for intermodal (including pedestrian, bicyclist, and other vehicles) conflicts. The impact of the proposed routes on the safety of the corridor is site specific and depends on the design guidelines of the system as well as the site-specific travel characteristics and design of the streets. For example, bus idling and visual obstructions can cause problems for all modes. When idling at intersections, buses can be a visual obstruction limiting drivers’ view of pedestrians at crosswalks. Rear-end collisions and accidents from vehicles quickly changing lanes are a large concern with increased transit due to events where buses make abrupt stops within a shared lane to pick up passengers. 13 14 Accessing Transit – Design Handbook for Florida Bus Passenger Facilities. Oakland Bus Bulbs Analysis – AC Transit East Bay Bus Rapid Transit Project in Alameda County. Emeryville Berkeley Oakland Transit Study 31 Streetcars One of the most common streetcar concerns is that the streetcar tracks provide a hazard for bicycle wheels. Bicycle wheels can get stuck in the track ruts, causing injuries from falls and collisions. Some safety and security concerns unique to streetcars include: Bicyclists wheels can get stuck or slip on tracks Streetcar vehicles cannot change directions to respond to a vehicle conflict Streetcars within travel lanes will increase traffic congestion, causing increased conflicts Emeryville Berkeley Oakland Transit Study 32 Costs All costs were evaluated based on costs of similar systems and guidelines provided by AC Transit. Note that these costs are estimates and actual costs vary widely depending on the specifics of the service and route. Moreover, if routes are operated by a non-profit or under private contract, costs would likely be lower, yet drivers may not be as well compensated. Because of the broad nature of the estimates, all numbers are rounded to the nearest million dollars. Trunkline Connector Route Costs Capital Costs for the Trunkline Connector Route are based on the route mileage as well as the number of total vehicles needed. Capital costs were estimated with a range starting at $270,000 per mile in each direction for a total of 16.2 miles as well as $700,000 per vehicle. Per-mile costs (not including vehicles) are based on the San Pablo Avenue BRT (2005) and the Wilshire Ventura Blvd Metro Rapid System (2000) and inflated to 2014 dollars.15 These costs include stops (accommodating approximately 5 stops per mile) and amenities such as bus arrival information, street furniture, marketing costs, and intersection signal priority costs. Vehicle costs were estimated at $700,000, an estimate based on comparative new 40foot and 60-foot hybrid vehicle purchases.16 To account for variations in costs for different types of system vehicles and operators, a range was created based on an additional 15% contingency rate. With these assumptions, capital costs total $11 – 12 million. Based on a 12-year infrastructure lifecycle,17 annualized capital costs would be approximately $1 million/year. Capital Costs: $11 – 12 million Annualized Capital Costs: $1 million/year The operating and maintenance costs for the Connector Route is based on an estimated number of annual revenue hours, calculated based on route length, peak and off-peak headways, and estimated layover times. According to data reported by the National Transit Database (NTD) in 2010, typical operational and maintenance costs for bus services around the country range from approximately $100/hour to $168/hour (while AC Transit’s fully allocated costs are $168/hour). The estimate used was $160/hour with a range based on an additional 15% contingency rate to account for variations due to system specifics. Operating and Maintenance Costs: $11 – 13 million per year The San Pablo Avenue BRT study’s (2005) costs for traffic, stop improvements and amenities, ridership surveys, marketing and amenity operations was approximately $3.2 million for 26 stops and 14 miles (National Bus Rapid Transit Institute, The San Pablo Rapid BRT Project Evaluation Final Report, 2006). In 2014 dollars, this per-mile cost equals about $270,000. The Wilshire and Ventura Blvd Metro Rapid System (2000) cost approximately $8.2 million for 42 miles for stops and intersection signal priority (Final Report, Los Angeles Metro Rapid Demonstration Program, 2002). In 2014 dollars, this per-mile cost also equals about $270,000. 16 This estimate is based on several system costs, including: a 2012 purchase of 60-foot articulated hybrid-electric buses at $813,100 for CTTRANSIT Hartford (cttransit.com); 40-foot hybrid bus costs of about $500,000 by King County metro Transit (kingcounty.gov, 2013); and San Francisco new Flyer hybrid bus costs of $752,000 per vehicle in 2013. This value is also consistent with estimates made for Oakland in the Broadway Transit Urban Circulator Study (2013). 17 U.S. Department of Transportation Federal Transit Administration (FTA): Useful Life of Transit Buses and Vans. Report No. FTA VA-267229-07.1 15 Emeryville Berkeley Oakland Transit Study 33 Streetcar Route Costs The capital costs for the Streetcar Routes were calculated based on the Seattle streetcar system capital costs ($27.6 million per track-mile in 2014 dollars) and rounded to a rate of $30 million.18 To account for variations in costs for different types of systems, an upper range value was created based on an additional 15% contingency rate. With these assumptions, capital costs total $129 - $148 million for both lines. Based on a 30-year infrastructure lifecycle, annualized capital costs would be $10 – 11 million/year.19 Total Capital Costs: $228 - $331 million a. West Oakland Route: $129 - $148 million b. Emeryville Route: $159 - $183 million Annualized Capital Costs: $10 – 11 million/year a. West Oakland Route: $4 - $5 million/year b. Emeryville Route: $5 - $6 million/year Like the operating costs for the Trunkline Connector Route system, operating and maintenance costs for the Streetcar routes was calculated based on the headway times and total route distance in order to calculate the total operating hours. Streetcar operating and maintenance costs were assumed to be 60% higher than bus service based on findings from the NTD where typical streetcar costs are 40 - 60% higher for comparable modern streetcar systems. This total cost was $270 per hour with an upper range created using an additional 15% contingency rate to account for variations. Total Operational and Maintenance Costs: $13 - $15 million/year a. West Oakland Route: $5 - $6 million/year b. Emeryville Route: $8 - $9 million/year Seattle Streetcar capital costs were $56.4 million for 2.5 miles of track ($22.6 million per track-mile, or $27.6 million per track-mile in 2014 dollars). The Seattle Streetcar systems was constructed from 2005-2007. An additional 25% inflation rate was added to account for increasingly high costs of construction in the Bay Area. 19 Based on an assumption that Streetcar vehicles last approximately 30-40 years. From: Pittsburg City Planning, Strip District Transportation and Land Use Plan Best Practices – Streetcar Capital Cost Estimate – City of Pittsburg. Alternative source, streetcar lifecycle of approximately 30 year: City of Seattle, Section 10 Asset Class - Seattle Streetcars Report. 18 Emeryville Berkeley Oakland Transit Study 34 Compatibility with Existing Transit When new transit service begins in the EBOTS study area it would likely supplement existing transit service. The proposed Trunkline Connector and Streetcar routes provide redundant service along Mandela Parkway and 40th Street, yet connect different key locations. These routes also provide service alongside AC Transit’s potential realignments of Route 26 and Route 57. The relative service frequency and redundancy of these routes should be considered along with phasing and future demand needs. Furthermore, consideration of how and where Emery Go-Round will operate is an important consideration, especially with the Emeryville Streetcar Route, which has segments similar to the Shellmound and Powell Bridge Emery Go-Round routes. Table 6 lists factors contributing to each route’s compatibility with existing transit. Table 6: Compatibility with Existing Transit Service Compatibility with Existing Transit Trunkline Connector Route Streetcar Routes Emery Go-Round: There would be minimal overlapping service along Hollis Street. AC Transit: Service would overlap with AC Transit’s proposed Line 26 within West Oakland, yet this Route would still provide a more direct connection from the West Oakland BART station to Shellmound. Service would also overlap with AC Transit’s proposed Transbay Line Z along 6th Street in West Berkeley. Line 48 would overlap service between Ashby and Gilman along 7th and 6th streets. Emeryville Streetcar Route AC Transit: Streetcar service from MacArthur to Shellmound would overlap with AC Transit’s proposed line 57. Line 57 could be redundant. Emery Go-Round: There would be overlapping service connecting BART to locations currently served by the Hollis Emery Go-Round route and the Powell Bridge Emery Go-Round route. West Oakland Streetcar Route AC Transit: Streetcar service on Mandela would overlap with the Trunkline Connector Route as well as AC Transit’s proposed Line 26. However, West Oakland Streetcar Route would continue to MacArthur BART station and Line 26 would serve Shellmound. Emery Go-Round: There would be minimal overlapping service with this route. Emeryville Berkeley Oakland Transit Study 35 Economic Development Impact Economic Development Potential Each of the EBOTS cities has a significant existing employment base; Emeryville has the largest, followed by West Berkeley and West Oakland. The existing residential population is considerably smaller, resulting in these areas having a very high ratio of jobs to employed residents when compared to the EBOTS cities overall.20 West Oakland has the largest number of residents, followed by Emeryville and West Berkeley. For all three EBOTS cities, fewer than 500 residents live and work in the same city within the study area; this results in substantial in-commuting because of the large employment base, combined with substantial out-commuting by EBOTS residents to jobs located in other places. Each of the EBOTS cities envisions substantial economic development over the next 20 years, to 2035, encompassing a range of new jobs, commercial development, and residential development. West Oakland, through the recently adopted West Oakland Specific Plan, envisions the largest amount of new development as it seeks to preserve its existing economic base and current population, while attracting significant new industrial, Research and Development (R&D), office, retail, and mixed-use development alongside new residential land uses. Emeryville, with the most active current real estate market of the three EBOTS cities, will continue to add a variety of new employment supporting R&D and office uses, and will approach build-out for residential uses. West Berkeley, pursuant to the provisions of the West Berkeley Plan, will see the lowest increase of the three cities in new employment and residential uses, with most activities likely focused on opportunities sited in the M-zoned District west of 6th and 7th Streets. All three EBOTS cities seek to promote commercial and mixed-use development, with multifamily residential, at densities that are supportive of transit. A comparison of existing conditions and future project development is shown in Table 7 below. Growth projections are based on Plan Bay Area figures, using travel analysis zones (TAZ’s) that approximately correspond to the EBOTS study area. An exception is West Berkeley where the EIR for Measure T, No Project Alternative, was used to reflect existing entitlements and the lesser amount of development that is allowed (the West Oakland figures exclude the former Oakland Army Base and other areas that are included in the West Oakland Specific Plan): Table 7: Projected Employment and Household Change by EBOTS Subarea, Year 2010 - 2035 Location 2010 2035 Change West Berkeley Employment 16,645 20,945 4,300 Households 7,718 9,369 1,651 Emeryville Employment 16,040 22,536 6,496 Households 5,694 10,603 4,909 West Oakland Employment 8,786 15,316 6,530 Households 6,795 11,861 5,066 Sources: Plan Bay Area; City of Berkeley; BAE. A more detailed discussion is contained in BAE’s December 20, 2013 memorandum on the Economic Development Inventory and Opportunities Analysis, found in Appendix F. 20 Emeryville Berkeley Oakland Transit Study 36 Emeryville’s current development pipeline includes more than 2,000 new residential units, while more than 200 in are planned in West Berkeley. New employment-generating development is not currently as active, but is expected to pick up as the economic recovery continues, with the East Bay benefiting from spillover, as the San Francisco, Peninsula, and Silicon Valley areas become increasingly expensive, as has occurred in past cycles. In the near-term (next 5 years or less), current market trends suggest that Emeryville will see the most new development, followed by West Berkeley, and West Oakland. Substantial new development in West Oakland is likely to accelerate in the medium-term (5 years+) and beyond, as the West Oakland Specific Plan is implemented, and fewer available sites remain in Emeryville and West Berkeley. Transit and Local Economic Development Appropriately planned and operated local transit can enhance economic development in two primary respects. The first impact is related to mobility, or enhancing the ability of workers and residents to circulate within an area and make connections to the regional transit system. Particularly for built-up areas with a strong economic base, enhanced local transit is critical to accommodate growth without substantial increases in congestion, especially for the EBOTS area with its limited connections to the regional transit system. The second impact from local transit is its potential to be an attractor for new development and new types of uses. Early in Emeryville’s redevelopment as a modern employment center, the establishment of the Emery Go-Round shuttle bus system was critical in attracting office-based employers who have staff that rely on BART to commute to work. Similarly, Oakland is proposing to develop an “O” transit loop that connects West Oakland with BART, Downtown, and the Broadway corridor as part of the West Oakland Specific Plan’s vision for attracting new uses and substantial equitable development to the area. The potential for local transit to be an attractor means that it can also increase a local area’s share of future growth above what would otherwise occur. Another consideration for the EBOTS study is the extent to which new residential versus commercial uses generate more transit ridership. A Public Policy Institute of California study, Making the Most of Transit: Density, Employment Growth, and Ridership around New Stations (Kolko et al, 2011), points out that while much of the emphasis has been on building residential around transit stations, across the US there is a stronger relationship between employment density and transit ridership than there is for residential density; at a Census tract level high density employment is correlated with 24 percent more ridership than high density residential. For West Berkeley and Emeryville, with the existing West Berkeley and Emery Go-Round shuttles, and AC Transit service, the expansion of existing service is more likely to generate mobility benefits than attraction benefits. In other words, most, not all projected growth in these two PDA’s would still likely occur if there is only limited expansion of transit service, assuming the West Berkeley and Emery GoRound shuttles remain in operation. For West Oakland, expansion of existing AC Transit Service and/or the creation of additional new highquality local transportation options are likely to be important factors in attracting the substantial new development, firms, employees, and residents envisioned in the Specific Plan. The lack of enhanced high-quality transit options for West Oakland is more likely to affect how much growth can be attracted to the area than it is for West Berkeley or Emeryville. Emeryville Berkeley Oakland Transit Study 37 Transit Technology and Economic Development The success of streetcar systems in attracting new development activity in Portland, OR, Seattle, WA, and in other cities around the US has created tremendous interest. More than 70 US cities are currently in one stage or another of proposed, planned, or under construction streetcar systems. Streetcar systems are often claimed to generate greater economic development benefits because of developer preferences for systems with fixed investments; rider preferences for rail over buses; the higher quality rider experience with an electric streetcar vs. a diesel or alternative-fuel bus; and the greater rider capacity that streetcars can provide. Conversely, streetcar systems are considerably more expensive to develop and operate on a per-mile basis. The Institute for Transportation and Policy Development Policy (ITDP) recently published a study, More Development for Your Transit Dollar: An Analysis of 21 North American Transit Corridors, (Hook, Lotshaw, Weinstock, 2013)21 that found that of the five transit corridors that generated the most investment in Transit-Oriented Development (TOD), on a dollar of TOD investment per dollar of transit investment, two were bus systems (Cleveland HealthLine BRT and Kansas City Main Street MAX bus), two were streetcars (Portland and Seattle South Lake Union), and one was light-rail (Portland MAX Blue Line). For the 11 transit corridors with “Moderate” TOD Impacts, seven were Bus Rapid Transit (BRT) or bus systems, and four were light-rail transit (and five of the BRT systems met ITDP’s definition for high quality transit). Neither this study nor other research has been able to establish a TOD investment potential from regular transit bus operations. It is challenging and impractical for the EBOTS study to develop useful measures that can relate the amount of transit investment to a certain TOD outcome. This is because transit investment often occurs in conjunction with agency revitalization plans and upzoning that in themselves spur development and increase the value of land, even without transit. Development outcomes are also correlated to current development patterns, current market conditions, and future market potential, all of which vary from place to place. Within the EBOTS subareas there is sufficient variation in these factors that it is not practical to develop measures for how much incremental investment in TOD would result from an incremental investment in transit. Key Factors Shaping Transit and TOD ITDP and other studies indicate that the following factors would be most important, in the following order, for determining how transit investment influences economic development: Local government plans that allow for denser development and use revitalization techniques, including public investment, to spur development. Current development land market conditions, including the availability of opportunity sites. Available at https://go.itdp.org/display/live/More+Development+for+Your+Transit+Dollar%3A+An+Analysis+of+21+North+American+ Transit+Corridors 21 Emeryville Berkeley Oakland Transit Study 38 Transit quality, defined as frequent service, high quality station design, passenger information systems, and other features (ITDP publishes a “BRT Standard” to score transit quality, much of which is applicable to other modes)22. Current demographic and economic trends. The pedestrian orientation of areas around transit stations or stops. All three EBOTS cities already have or will be implementing plans that have provided a framework for development to allow for substantial new development over the next 20 years and beyond. All three cities have a similar built form and pedestrian orientation. Transit quality is more about a set of design features and operational characteristics that can be applied to rail-based or bus-based transit. Therefore, this factor does not support making distinctions between the concepts. Therefore, current development land market conditions and local demographic and economic trends are the two remaining factors that can be used to evaluate differences between the EBOTS transit concepts. In the near-term, these factors would favor Emeryville, since this portion of the study area currently has the strongest current market for development, followed by West Berkeley and West Oakland. In the medium-term and beyond, as implementation of the West Oakland Specific Plan would shift the development land market, the greater potential for growth would favor West Oakland, which could also offer the potential for a greater return, measured as TOD investment that results from the investment in transit. To the extent that expanded transit in the EBOTS area is funded as a New Starts or Small Starts project, the federal and local processes for approval, construction, and commencement of operations is likely to be in the medium- to long-term, and take considerably longer than five years. For transit technology, the variance in TOD outcomes that ITDP identifies between streetcar and bus systems suggests that it should not automatically be assumed that a streetcar will result in a greater amount of new TOD and economic development. With a focus on transit quality as more of a driver of TOD potential than the choice of transit technology, the potential for a streetcar should be evaluated in terms of its ability to move more people at lower cost within a given transit corridor than the bus alternative. The potential for a bus-based system to generate acceptance and interest similar to a streetcar system should be evaluated in terms of the quietness and smoothness of operation of the vehicle (with electric vehicles being ideal), the quality of stops and services, and its branding as a modern transit option. New Development Value Capture Another set of criteria to evaluate the economic development potential of the transit concepts involved the extent to which it could be phased to better match development as it occurs, and the extent to which that development could contribute to capital or operating costs through value capture mechanisms. Value capture is an important strategy for generating a portion of the local match required by many grant sources, as well as for generating direct investment and operating funds for new transit. Value capture techniques involve a range of financing tools that seek to generate funds from a portion of the value of new development. Potential strategies specific to new development, and their applicability to EBOTS The categories for the BRT Standard are: BRT Basics; Service Planning: infrastructure; Station Design and Station-Bus Interface; Quality of Service and Passenger Information Systems; and Integration and Access. The BRT Standard is available at https://go.itdp.org/display/live/The+BRT+Standard 22 Emeryville Berkeley Oakland Transit Study 39 study area improvements, are shown below in Table 8 (this list excludes general taxes that would apply to all properties, such as parcel taxes, sales tax increase, utility user tax increase, etc.). Table 8: Value Capture Strategies Overview Value Capture Strategies Overview Category Description Tax Increment Finance (TIF) Allocates a portion of new tax revenue for funding improvements. The current tool available in California is Infrastructure Finance Districts (IFD). These are challenging to establish under current law, and would likely require 2/3 voter approval. As a practical matter only the local city share of new tax revenues would be available. Assessment Districts Developer Impact Fees Annual receipts tied to parking meter rates and parking ticket charges. Charges levied against new development to offset the cost of improvements to accommodate the impacts of that development. Requires preparation of a nexus study to identify the impact from development, cost of improvements to mitigate it (e.g. transit), and formula for appropriate allocation. Streetcar Routes Annual receipts that can be used for improvements (including bond financing), or operating costs (depends upon district type). Creation of a new parking assessment district to use revenues from parking fees and fines to support transit operations. Trunkline Connector (Enhanced Bus) Annual receipts tied to new development. Can be used for improvements (including bond financing) consistent with IFD legislation. Creation of a district that imposes a surcharge on property tax bills. There are a wide variety of such districts under California law. There are various property owner or voter approval requirements, typically 2/3. A Public Transit Benefit Assessment District (SB142) allows agencies operating transit to create an assessment district through Board action. Parking Assessment Districts Updated AC Transit Bus Routes One-time payments from each new development project into the Capital Improvement Program per the nexus study. Emeryville Berkeley Oakland Transit Study 40 Density Bonuses Allows a developer to increase the size of a project for provision of a public benefit, e.g. contribution to transit improvement. This would require modification of existing plans in the EBOTS area. One-time payments from each new development project that uses the bonus. California laws impose strict approval requirements, and limitations on use of funds, upon local jurisdictions that wish to use the above-listed value capture tools. Experience suggests that most of these tools are more likely to generate property owner, voter, and other public support for new and enhanced transit options (such as an Enhanced Bus Trunkline Connector or Streetcar), and less likely to gain approval for extensions of existing transit options that are seen as being financed by existing federal, state, and local sources (such as the AC Transit Enhanced Bus). There are additional challenges tied to use of value capture that would need to be addressed in future studies. These challenges include: Timing: The amount realized from many value capture tools is tied to development, which is spread over time. By comparison, new transit needs to be build up-front as a system, leading to a mismatch between the timing of costs and revenues. Another challenge is that development is highly cyclical, which means that revenues can vary greatly from year-to-year. Underwriting Financing: Bond underwriters look to established sources of revenues, rather than projections of potential future revenue. This can make it difficult to use value capture tools, aside from assessment districts, as a fund sources to repay bonds. Implementation: There should be consistency between the three cities in the EBOTS area in how value capture tools are used, which requires a greater than usual level of coordination. These challenges can be addressed through phasing of improvements and obtaining loans from local cities’ other funds, among others. The challenges of creating an integrated transit system that spans and benefits three cities in the EBOTS area may justify the creation of revenue-sharing arrangements between the three cities to allow more effective use of value capture tools to help fund transit. Potential Value of Development and Value Capture This section provides an estimate of the potential value of new development in the EBOTS area from 2015 through 2035. Such a discussion is highly conceptual at this stage of planning, and these figures should be considered an indication of the potential magnitude of funds for discussion, rather than a projection of expected receipts. Much more detailed study would be needed to come up with figures that could be used for a financing strategy to fund project costs. The first step to projecting value capture is to identify the amount of development to which value capture tools could be applied. The projections of EBOTS area future household and employment growth previously prepared were reviewed, and pro-rated for the amount of development that is yet to occur in the EBOTS area, as shown in the Table 9. Emeryville Berkeley Oakland Transit Study 41 Table 9: Projected new Development Measures in the EBOTS Area, 2015-2035 Projected New Development, EBOTS Area, 2015-2035 West Berkeley Housing Units Commercial – sq. ft. Emeryville West Oakland Total 679 3,014 4,053 7,746 812,000 1,617,124 1,417,692 3,847,616 Note: The above table is based on the lesser of Plan Bay Area projections or individual City estimate of maximum build-out allowed per existing plans Sources: Plan Bay Area Final Forecast, July 2013; Cities of Berkeley, Emeryville, and Oakland; BAE, 2014. Over the 20-year period from 2015 to 2035, assuming value capture tools can be put in place in the nearterm, these could be applied to up to approximately 7,700 new dwelling units and 3.8 million square feet of all types of new commercial development. The value of this amount of new development was calculated based on the real estate market values identified in Appendix F. These values are considered to be “mid-point” values in the economic cycle, and thus represent an appropriate average as well as a conservative approach to calculating value creation. As shown in the Table 10 below, new development in the EBOTS area would have a potential value in excess of $3.5 billion through 2035, and would generate more than $35 million in new annual property tax revenues by 2035 (with revenues starting at $0 in 2015 and growing as development occurs). Cities only collect a share of property tax revenues, with the rest going to school districts, counties, and other special districts. Using a conservative assumption that the local city share would average 20 percent, by 2035 there could be a total of just over $7 million in new annual property tax revenues combined from new development throughout the EBOTS area. Table 10: Potential New Property Tax Increment, EBOTS Area, 2015-2035 Potential New Property Tax Increment, EBOTS Area, 2015-2035 Average Value per Quantity du/sq.ft. Residential Multifamily Residential 5,422 $294,000 Multifamily For-Sale 2,324 $410,000 Commercial All Uses 3,847,616 $260 Projected Value of New Development Annual New Property Taxes at 1% City Share at Average 20% of New Increment Total $1,594,000,000 $973,600,000 $1,000,400,000 $3,568,000,000 $35,680,000 $7,136,000 Source: BAE, 2014 Cities will look to set aside a large part of this new increment, likely at least half or more, to fund the increased cost of new public services to serve new development. However, the above figures do suggest the following magnitude of potential value capture for discussion: Emeryville Berkeley Oakland Transit Study 42 TIF/IFD financing, assuming property owner/voter approval, and based on 50 percent of the local city share of available increment, and using general bond underwriting principles, could support up to $30 million or more in bond financing by 2035 – if credit guarantees or other solutions are found to meet the challenge of available increment being much lower in early years. Assessment districts, if they can obtain property owner approval at a level equal to 0.1 percent of assessed value, could generate approximately $3.5 million in annual revenues by 2035, and support up to $30 million or more in new bond financing. Further study, and evaluation of policy, political, and other considerations, would be needed to quantify the revenues that could be generated from impact fees, density bonuses, parking districts or other tools. For discussion purposes, it would be reasonable to consider that a combination of these other value capture techniques could potentially generate funds comparable to TIF or assessment districts. Comparison of EBOTS Transit Options The preceding discussion addressed the relationship between transit and local economic development and the factors that are likely to shape the impact of the transit alternatives in the EBOTS subareas. Each alternative would have different implications for economic development, with no one of them being clearly superior. The advantages and disadvantages associated with each option in terms of local economic development and implementation tied to economic development are summarized as shown in Table 11 below: Table 11: Economic Development Impact by EBOTS Transit Project Service Trunkline Connector Route Advantages Enhanced access to Emeryville development opportunity sites North-South orientation promotes trips between destinations in EBOTS area Further expands access to and quality of transit in West Oakland Streetcar Routes Provides a connection from Jack London Square through West Oakland as well as from MacArthur BART to West Oakland Gives direct access from MacArthur BART station to Shellmound Phasing can be done by route; value capture by each city Oakland alignment covers the “O” loop envisioned by City Could handle increasing ridership in parts of Emery Go-Round routes with heaviest demand Emeryville Berkeley Oakland Transit Study Disadvantages No connection to MacArthur BART, busiest East Bay station outside Downtown Oakland and Downtown Berkeley Enhanced access to Emeryville is limited to Hollis Street, and does not provide a direct connection to the Emeryville Shops East-West connection carried by limited capacity of Emery Go-Round No additional West Berkeley or North Oakland connectivity Service to Shellmound is not enhanced to/from destinations north of this area. Because Emeryville has the most active market for new development in the Inner East Bay, enhanced service to Emeryville is not likely to generate significant additional development 43 In addition to the advantages and disadvantages that each transit option would offer in total, it is important to also consider the impact that each individual EBOTS subarea may experience for each option. West Berkeley Routes through this subarea exhibit modest potential to spur economic development due to new transit service, primarily because there is greater market demand than available sites and allowable development pursuant to the West Berkeley Plan. This reduces the ability of new transit to spur additional TOD investment. The Trunkline Connector could be advantageous because it provides more service to West Berkeley destinations and extends its northern reach closer to opportunity areas at the northern end of the Priority Development Area (PDA). Emeryville Routes through this subarea exhibit modest potential to spur economic development due to new transit service, primarily because Emeryville has the most active market for new development in the Inner East Bay and as long as the Emery Go-Round continues to provide service, additional transit service is not likely to generate significant additional development (although current service does not have the capacity for future growth). Both the Trunkline Connector and Streetcar proposed routes are advantageous because they provide service through this area from West Oakland and MacArthur BART stations. West Oakland Routes through this subarea exhibit substantial potential to spur economic development due to new transit service. This is because new modern transit, in conjunction with implementation of the strategies, including public investment, outlined in the West Oakland Specific Plan, has the potential to accelerate market interest in new development in West Oakland. The Trunkline Connector service and West Oakland Streetcar service proposed routes would both provide a high level of service along Mandela Parkway, and provide direct access to the largest number of opportunity sites for new development. The Streetcar two-route concept is functionally the same as the “O” transit loop proposed in the West Oakland Specific Plan. Emeryville Berkeley Oakland Transit Study 44 6. Funding and Implementation The purpose of this initial inventory is to identify sources of funds that might be available for the construction, operation, and maintenance of the transit service options being considered for the EBOTS study area and provide a real world roadmap for positioning potential projects for funding. The scan of sources will provide a basis from which fund sources can be further analyzed for applicability, availability, and requirements and timelines for obtaining funding for specific elements of a recommended EBOTS transit service alternative. Federal Funding Recipients In some cases there may be issues receiving Federal funding depending on the applicant and operator of the transit route. Since the operator has not yet been defined for the Trunkline Connector or Streetcar routes, this information will be important in understanding the types of funding available and who could be the operator. For urbanized areas with 200,000 in population and over, funds are apportioned and flow directly to a designated recipient selected locally to apply for and receive Federal funds. Funding is made available to recipients that must be public bodies with the legal authority to receive and dispense Federal funds under 49 U.S.C. 5307. It is important to note that becoming a direct recipient can be difficult. In addition to the legal authority that is required to become a recipient, applicants may also fall under the federal compliance requirements such as having a ½ fare for senior/disabled passengers; providing complementary paratransit service; complying with federal procurement regulations; and fulfilling transit related Title VI anti-discrimination requirements. Additionally, funding is allocated on the basis of legislative formulas. In the Bay Area, it is based on a combination of bus revenue vehicle miles, bus passenger miles, fixed guideway revenue vehicle miles, and fixed guideway route miles as well as population and population density. That means that a fixed dollar amount comes to the region and is divided among the direct recipients (transit agencies). Because the 5307 and 5339 funds are overprescribed, as indicated, an applicant would need to first become a legal entity that can access the funds, while convincing the regional partners that funds should be allocated. Section 5312 funds can be available to non-transit operators. Eligible recipients are determined for each competition, and may include: universities, public transportation systems, state Department of Transportation (DOT), non-profit and for-profit entities, amongst others. However, this year’s competition is limited to existing direct recipients of Federal Transit Administration (FTA) grants. Potential Funding Sources The potential funding sources described below take into account certain capital costs the proposed new Trunkline Connector Route, and the proposed West Oakland and Emeryville Streetcar Routes. However, to take advantage of traditional sources of operating and capital funds, projects must be included in local and regional transportation planning documents. Some potential funding sources described below specify they are for operating and maintenance costs as well, specifically the Emeryville Berkeley Oakland Transit Study 45 Transportation Development Act (TDA) and the State Transit Assistance (STA) and fare revenues. Table 12 lists which funding sources would be possible options for each improvement type. Table 12: Summary of Potential Funding Sources by Project Potential Funding Sources Trunkline Connector Route Source Description Section 5307 Urbanized Area Formula Funds These funds go to transit operators, and are already fully subscribed. The project sponsor would have to persuade an agency to use its funds for the proposed projects. For vehicle costs, all expansion vehicles must be in the Short Range Transportation Plan (SRTP) and the Regional Transportation Plan (RTP). Generally these funds are used for replacement vehicles, not expansion vehicles. Annual distribution on a formula basis Section 5339 Bus and Facilities Program Can be used for vehicles and to construct bus related facilities. These are relevant to new bus and facility capital costs. Regional distribution on a formula basis annually Congestion Mitigation and Air Quality Improvement (CMAQ) Section 5307 Urbanized Area Formula Funds Section 5309 New Starts Funding Transportation Development Act (TAD)/State Transit Assistance (STA) Projects must be in the local Transportation Improvement Program (TIP). The Metropolitan Transportation Commission (MTC) has a three year programming cycle for the funds it manages and the local Congestion Management Agency (CMA) administers its share through the One Bay Area Grant Program. This funding source is particularly relevant for new bus vehicles. Funds are programmed in cycles This funding is administered and competed for nationally. It is the main source of significant funding for streetcar improvements, although matching funds will need to be found. Must have on-going operating sources confirmed prior to federal full funding grant agreement. The process to be in a full funding grant agreement often takes years and only after NEPA document has been certified Funds allocated to transit operators for use on operating and capital expenditures. They are fully subscribed. These are relevant for capital costs as well as operations and maintenance costs. Annual distribution Emeryville Berkeley Oakland Transit Study Streetcar Routes 46 Potential Funding Sources Trunkline Connector Route Source Description Transportation Fund for Clean Air (TFCA) The Bay Area Air Quality Management District’s TFCA can be used for clean air vehicles only. Can fund shuttle service connecting to train stations. Ongoing collections Alameda County Measure B Sales Tax Funding can be used for capital and operating expenses. Targeted to projects and programs identified in the Transportation Expenditure Plan approved by the voters. Ongoing collections State Transportation Improvement Program (STIP)/Regional Transportation Improvement Program (RTIP) These funds are at historical lows and significant amounts of them are currently programmed to AC Transit for the East Bay Bus Rapid Transit (BRT) through 2028. Programmed for multiple years Streetcar Routes Fares only cover a percentage of the cost of operating Fare Revenues service. While these revenues can be used for operations and maintenance as well as capital costs, they tend to be used for operations and maintenance because the cost of operations far exceeds the fare revenue received. Senate Bill 142 (SB142)/Public Transit Assessment District Ongoing collections Transit District, municipal operator, or other public agency operating transit, commuter rail, or intercity rail services to approve, by a two-thirds majority, to issue bonds and levy a fee on the special district for bond repayment. To be implemented, the levy may not be opposed by a majority of the properties affected. Funds may only be used for capital costs. The area in the benefit district must be within a half mile of the center point of the transit station. Further, projects must provide special benefits to the parcels of land and improvements to land within the vicinity of the rail station. Property-Based Business Improvement District One is in place already in Emeryville and supports the Emery Go-Round shuttle. Business owners in a specific area pay a fee to fund improvements and/or improve the quality of the area paying the fee. Emeryville Berkeley Oakland Transit Study 47 Potential Funding Sources Source Description Transit Investments for Greenhouse Gas and Energy Reduction (TIGGER) Can help fund electric buses that use batteries. Trunkline Connector Route Streetcar Routes Trunkline Connector Route Funding Sources For the Trunkline Connector route, the operator and the specific enhancements making up the bus route need to be identified. Many of these improvements also need to be specified in regional planning documents, as well as in the planning documents of the sponsor agency. The funding strategies do not take into account need for replacement of vehicles after initial purchase, which increases the total capital cost at the time the vehicles and other infrastructure need to be replaced (approximately 12 years for buses). Bus Capital Cost Funding Sources (all costs including a new bus line and bus stops): Section 5307 Urbanized Area Formula Funds (annual distribution on a formula basis) Transportation Development Act (TDA)/State Transit Assistance (STA) funds (annual distribution) Alameda County Measure B Sales Tax (ongoing collections) State Transportation Improvement Program (STIP)/Regional Transportation Improvement Program (RTIP) Clean Air Vehicle Capital Cost Funding Sources: 23 Section 5307 Urbanized Area Formula Funds (annual distribution on a formula basis) Section 5339 Bus and Facilities Program (regional distribution on a formula basis annually) Congestion Mitigation and Air Quality Improvement (CMAQ) Section 5307 Urbanized Area Formula Funds (programmed in cycles)23 Transportation Development Act (TDA)/State Transit Assistance (STA) funds (annual distribution) Hybrid vehicles must meet certain requirements http://www.epa.gov/fedrgstr/EPA-AIR/2007/May/Day-24/a9821.htm Emeryville Berkeley Oakland Transit Study 48 Bay Area Air Quality Management District’s Transportation Fund for Clean Air (ongoing collections) Alameda County Measure B Sales Tax (ongoing collections) Operation and Maintenance Funding Sources: Transportation Development Act (TDA)/State Transit Assistance (STA) funds (annual distribution) Fare revenues (ongoing collections) Operator Options Many aspects of the system, particularly costs, will be dependent on the operator of the proposed system. Additionally, many funding options require the operator to be specified in advance of the project start. The options below should be considered for choosing an operator: ETMA as Operator. A new association could be formed or the Emeryville Transportation Management Association could expand, if property owners in West Oakland and West Berkeley (and Emeryville if it is a second association) vote to join an improvement district. Someone would have to initiate the formation or expansion and conduct the election. AC Transit as Operator. AC Transit receives Federal funding. Or a new transit agency could be formed, but Federal Transit Administration (FTA) allocates funding to AC Transit and BART by formula for some of its programs. Streetcar Routes Funding Sources The addition of streetcar service is an addition to the Trunkline Connector proposed route. However, a full analysis needs to identify the project sponsor for the street car service. Certain improvements also need to be included in regional planning documents, as well as in the planning documents of the sponsor agency in order to take advantage of new funding sources not currently contemplated such as a regional gas tax. The funding sources do not take into account need for replacement of vehicles after initial purchase, which increases the total capital cost at the time the vehicles and other infrastructure need to be replaced (approximately 30 years for streetcar infrastructure and vehicles). Capital Costs (all elements of the streetcar infrastructure): Section 5309 New Starts Funding Operation and Maintenance Funding Sources: Transportation Development Act (TAD)/State Transit Assistance (STA) funds (annual distribution) Fare revenues (ongoing collections) Emeryville Berkeley Oakland Transit Study 49 Operator Options There are several options for choosing an operator for the proposed Streetcar routes. These options are closely related to how the system is funded. Several options include: ETMA as Operator. A new association could be formed or the Emeryville Transportation Management Association could expand, if property owners in West Oakland and West Berkeley (and Emeryville if it is a second association) vote to join an improvement district. Someone would have to initiate the formation or expansion and conduct the election. Current or New Transit Agency as Operator. AC Transit and BART receive Federal funding. If they were interested, they could add the new service – perhaps BART for streetcars. Or a new transit agency could be formed, but Federal Transit Administration (FTA) allocates funding to AC Transit and BART by formula for some of its programs. Three-City Joint Powers Authority (JPA). The three cities, with or without AC Transit and/or BART, could form a Joint Powers Authority (JPA), but a JPA would have a hard time competing with existing transit agencies for funding. Fund Readiness Strategies It is not sufficient to simply identify potential capital and operating sources to build and operate expansion projects. A successful funding strategy will be based on sound project planning, and will require a good deal of political will. Because major capital investments are costly and almost always require a variety of funding sources from all levels of government, it is important for project sponsors to understand what is needed to take advantage of new funding that may become available. For projects that are not yet a part of regional and local planning documents, it can be a challenge to access traditional transit funding resources, which are generally committed in advance to projects that have been in the queue for several years. Therefore non-traditional funding might be available more quickly, such as Business Improvement Districts (BIDs), or transit benefit assessment districts. In the event that funds can be identified through BIDs, Developer fees, or other non-traditional transit related funding, projects may be able to be forwarded at a much quicker pace. This can be helpful for accessing project development funds that would help advance the project in order to take advantage of traditional federal and state transportation funds. Table 13, below, represents the timeline and strategies if projects can find “Independent Means” to implement portions of the project sooner. Due to the cost of the Streetcar Alternative, it is assumed that some level of federal funds would be sought. Some of these steps are similar to the Fund Readiness Strategies in order to ensure that projects are included in required planning documents should they wish to qualify for federal, state or local fund programs. Additionally, even though the list is numbered, some tasks can occur concurrently (such as procuring vehicles at the same time as local decision making process for the alignment of the streetcar). Emeryville Berkeley Oakland Transit Study 50 Table 13: Independent means Fund Readiness Strategies Independent Means Fund Readiness Strategies Time Frame Action 1. 2. 3. 4. 5. 1 - 5 years 6. 7. 8. 9. 10. 11. Establish project sponsors for trunkline connector and streetcar routes Determine priority for improvements for future study Confirm priority with project sponsors Ensure AC Transit projects are included in AC Transit’s Short Range Transit Plan Obtain funds for Project Development for capital investments (trunkline connector and/or streetcar service) Conduct process to establish local decisions on mode and alignment for major capital investments, including alternatives analysis for trunkline connector and streetcar routes Complete required environmental and Plans, Specifications & Estimates (PS&E) for trunkline connector bus alternatives (includes Title VI minority and lowincome anti-discrimination analysis) Secure funds for vehicle expansion (bus alternatives) Secure operating funds for trunkline connector bus alternatives Procure vehicles for bus alternatives Ensure projects are included in local and regional transportation plans (Countywide Transit Plan, RTP, Countywide Plan) Complete required environmental documentation for streetcar Secure operating funds in order to secure federal 5309 funds Secure local match funds for federal program Secure federal funds for major capital investments Preliminary Engineering for streetcar routes 5 - 10 years 12. 13. 14. 15. 16. 10 - 20 years 17. Design and Construction of streetcar routes Emeryville Berkeley Oakland Transit Study 51 Other Potential Sources Other potential funding sources exist, but in some cases the projects will need to have a more fully developed scopes before it can be determined whether these sources are potential matches or not. In other cases, the funding sources are dependent on new development, or the adoption of additional fees or taxes, and therefore are more speculative or have longer lead times. The additional potential sources are listed in Table 14. Table 14: Additional Potential Sources of Funding for Proposed Routes Funding Source Element Highway-Rail Grade Crossing Program For elements at railway-highway crossings including signing and pavement markings at crossings, active warning devices (e.g. lights and gates), crossing surface improvements, sight distance improvements, grade separations (new and reconstructed), and the closing and consolidation of crossings. Transit Oriented Development Planning Pilot For new fixed-guideway and core capacity improvement projects that focused growth around transit stations to promote ridership, affordable housing near transit, revitalized downtown centers and neighborhoods, and encourage local economic development. Pilot program funding may not be available in future. Federal Transit Administration (FTA) Section 5312 Research: Low or no Emission Vehicle Deployment For projects in nonattainment or maintenance areas, funding for capital projects for low or no emission vehicles, facilities and related equipment. Must be a section 5307 eligible recipient (governors, responsible local officials, and publicly owned transit operators). The Metropolitan Transportation Commission (MTC) would need to submit application. Federal Transit Administration (FTA) Section 5310 Enhanced Mobility Seniors and Individuals with Disabilities This source is applicable if any of the service benefits the target populations. Developer Fees Fees that can be used to pay for public facilities necessitated by development. Generally, a nexus study must demonstrate that the development dictates the need for the facilities. OneBayArea Grant Program New Transportation Sales Taxes Program administered by the Alameda County Transportation Commission (ACTC) and the Metropolitan Transportation Commission (MTC) that combines many sources of funding in support integrating the Federal Transportation Program with California’s climate law. Alameda County is currently planning to put an additional sales tax measure on the ballot in November 2014 in support of transportation projects in the County. Includes a grant for shuttles for which cities can apply Cities have the ability to put such a tax on the ballot, as well, depending Emeryville Berkeley Oakland Transit Study 52 Funding Source Element upon their identified need. Prop 1B Traffic Light Synchronization This funding can be used in support of traffic light synchronization projects. Parcel Taxes Through a two-thirds vote of property owners, the imposition of a tax for a specific purpose. Can be put on the ballot by cities, counties, AC Transit or BART. Transportation Investment Generating Economic Recovery (TIGER) Discretionary Grant Program Administered by the federal government, this program funds rail and transit projects which promise to achieve critical national objectives. Emeryville Berkeley Oakland Transit Study 53


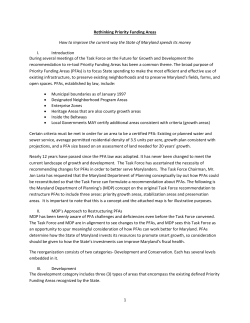

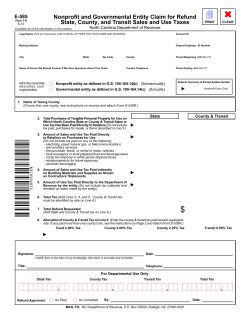


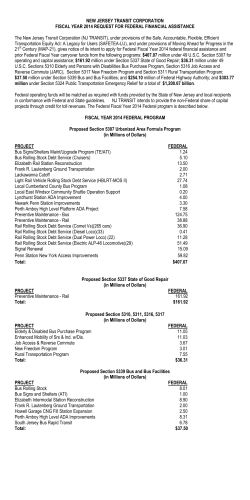

© Copyright 2026